
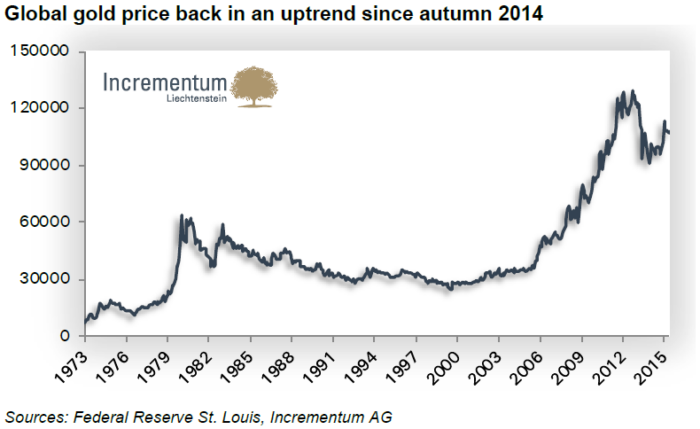
By 2015, the gold market had endured almost four years of decline after the peak of the 2000s bull market.
Gold reached its cycle high of USD 1,921 on September 6, 2011, while silver peaked earlier in April 2011. Since then, the market had moved decisively lower.
The 2015 report was already the fourth edition published after that peak, placing it firmly within the bear market phase that followed the extraordinary rally of the 2000s.
At the time, few investors believed that gold could soon recover.

In truth, investor sentiment in 2015 had turned deeply pessimistic.
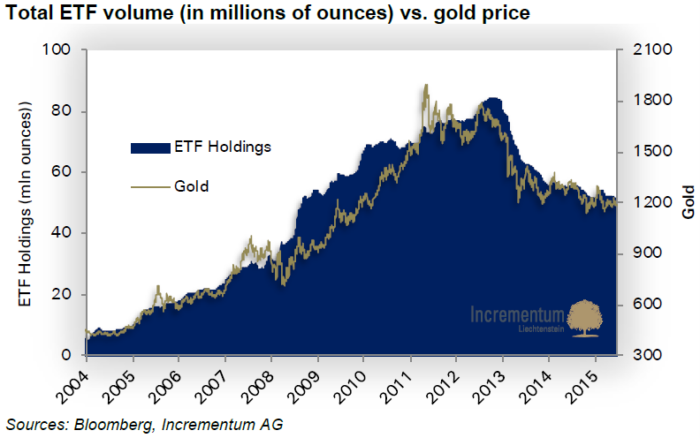
Speculation in the gold sector had largely evaporated, something clearly visible in the sharp decline in gold ETF holdings. Many investors who had enthusiastically embraced gold during the 2008 financial crisis had abandoned it once the immediate threat of systemic collapse appeared to fade.
As we wrote in the report, the situation resembled a familiar human pattern: when crises loom, people seek safety; when stability appears to return, that caution quickly disappears. In the years following the financial crisis, the extraordinary monetary interventions of central banks created the impression that the worst dangers had been averted.
Consequently, gold was no longer perceived as a necessity by many of those who had turned to it during the crisis.
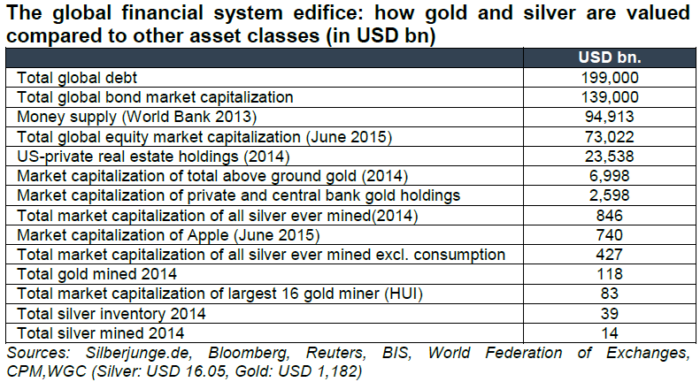
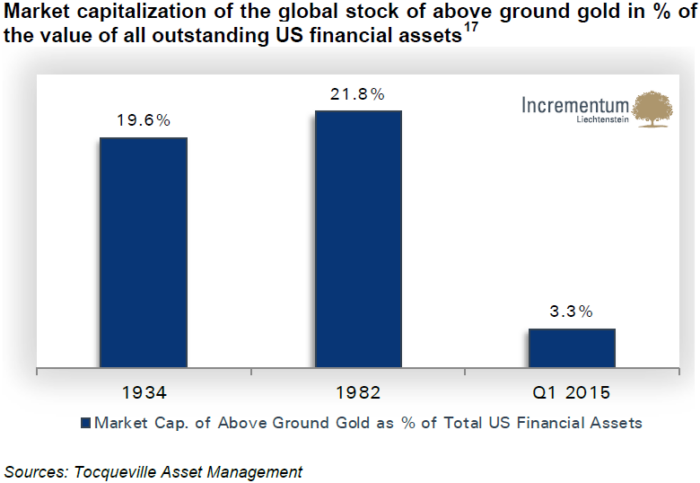
Despite the bull market of the 2000s, gold and silver were still tiny markets compared to the global financial system.
The numbers from 2014 illustrate this striking imbalance:
Total global debt: approximately USD 199 trillion
Total above-ground gold market capitalization: about USD 6.998 trillion
Total silver ever mined: roughly USD 846 billion
These figures demonstrate how small precious metals markets remained relative to global financial assets. Even after a decade-long rally, it was difficult to argue that gold or silver represented systemic bubbles.
On the contrary, their size suggested substantial upside potential if capital were to flow back into the sector.
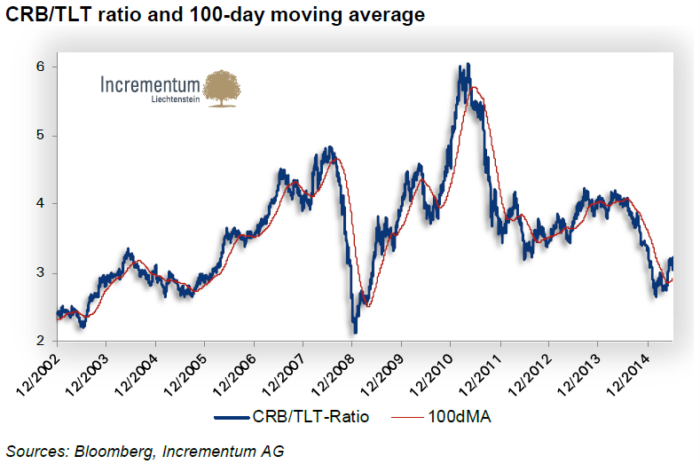
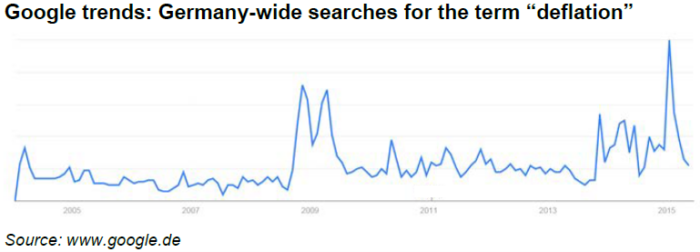
A key concept discussed in the report was “monetary tectonics”. Plainly, this theme had been introduced in the 2014 edition.
The idea is that the global economy is constantly shaped by competing inflationary and deflationary forces, much like tectonic plates beneath the earth’s surface.
By 2015 it had become clear that deflationary forces were dominating, creating a disinflationary environment that was generally unfavorable for gold. This environment helped explain why the precious metal had struggled despite continued monetary stimulus.
However, tectonic pressures rarely remain static. Eventually, the balance between these forces shifts, often suddenly.
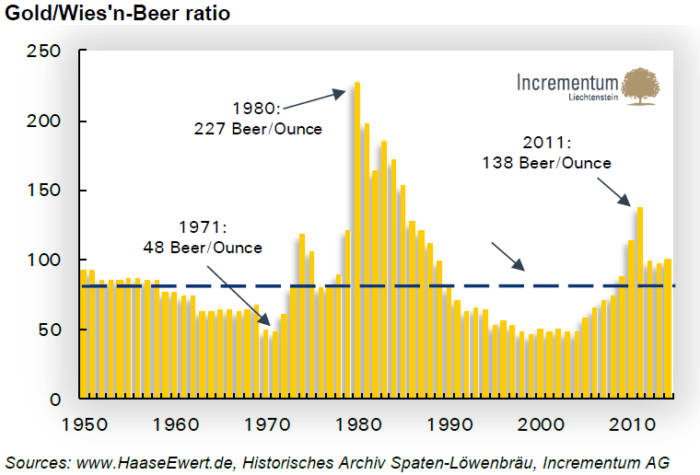
The 2015 report also introduced one of the most beloved charts in the In Gold We Trust series: the Gold/Oktoberfest Beer Ratio.
This ratio measures how many Mass beers at Munich’s Oktoberfest one ounce of gold can buy.
What began as a creative way to visualize gold’s purchasing power quickly became a reader favorite. Every year during Oktoberfest, we update the ratio to reflect the latest beer prices.
The success of this chart later inspired a whole family of unique gold ratios, which have also become a recurring feature of the report.
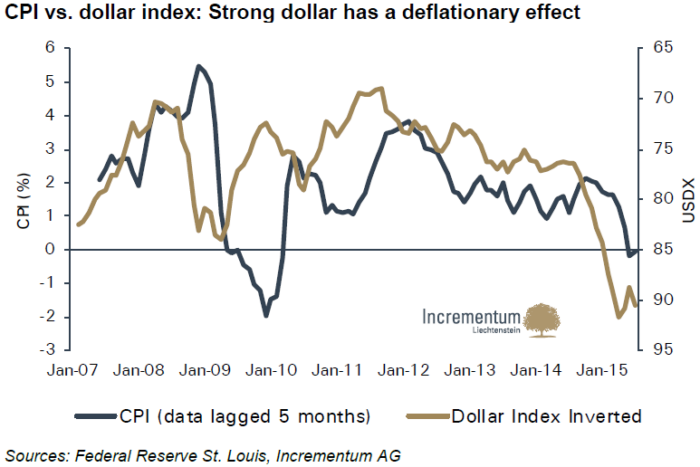
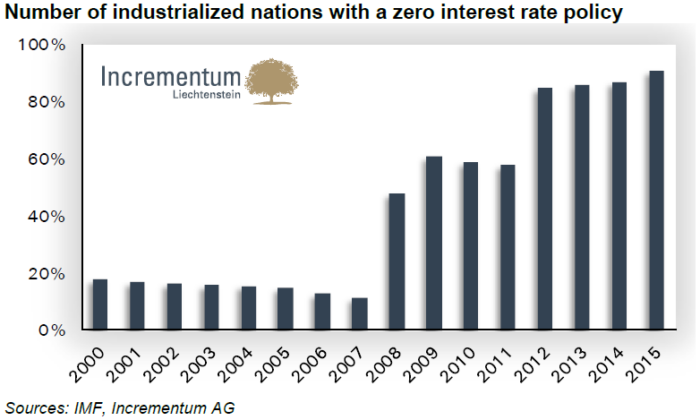
Despite years of aggressive monetary stimulus, central banks in 2015 were still struggling to generate inflation.
For policymakers committed to a world of continuously rising consumer prices, this was a frustrating development. Notwithstanding, from a broader economic perspective, especially from the viewpoint of the Austrian School of Economics, falling prices are hardly harmful.
In most cases, they simply reflect productivity gains and technological progress. Nevertheless, the inability of central banks to generate sustained inflation remained one of the defining macroeconomic challenges of the time.

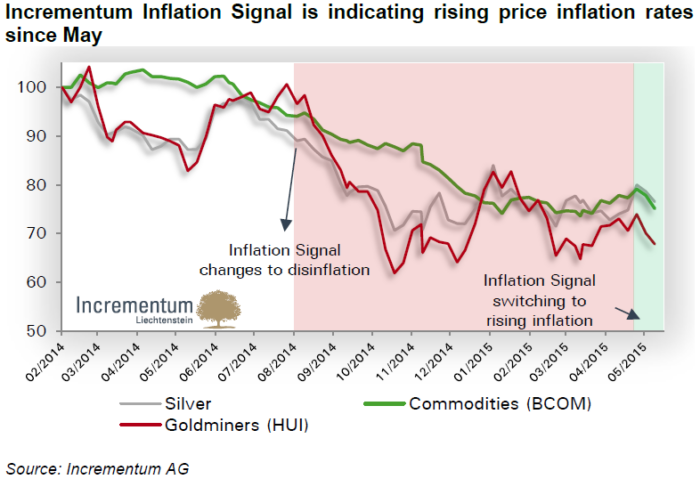
One important indicator discussed in the report was our proprietary Incrementum Inflation Signal.
At the time, the model suggested that inflationary pressures were beginning to emerge after years of disinflation. If correct, this development would significantly improve the outlook for inflation-sensitive assets such as gold and commodities, which tend to benefit when inflation expectations rise.
After several overly optimistic forecasts in previous years, the 2015 report adopted a more cautious stance. We projected that the gold market could experience one final sell-off, potentially pushing the price down to USD 1,140 per ounce.
Such a decline would mark the final stage of the bear market before the next major upward cycle. What we would later dub as a Golden Decade would sooner or later emerge.
Interestingly, reality turned out to be remarkably close to that projection. Gold eventually bottomed at USD 1,046 in December 2015, only months after the report’s publication.
From that point onward, the long recovery began. While no forecast is ever perfect, identifying the approximate bottom of a bear market is a rare achievement in financial markets.
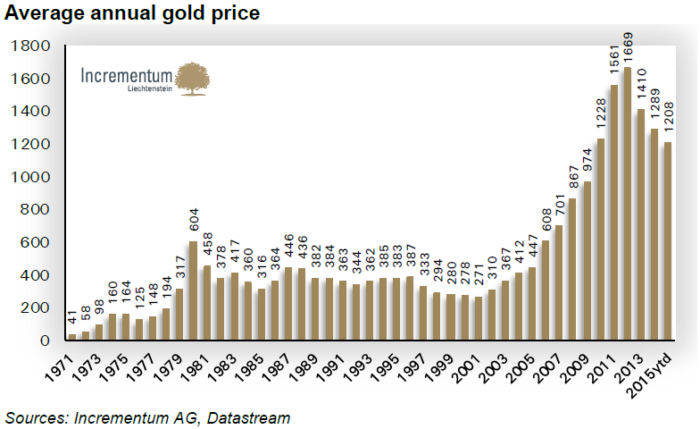
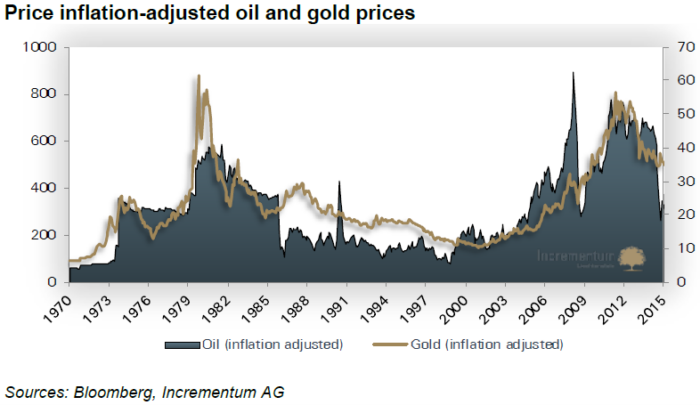
Our long-term price target remained unchanged at USD 2,300 per ounce. This level roughly corresponds to the inflation-adjusted peak of the 1970s gold bull market.
However, markets rarely move on convenient timelines. The target was only reached in April 2024, nearly nine years after the report’s publication.
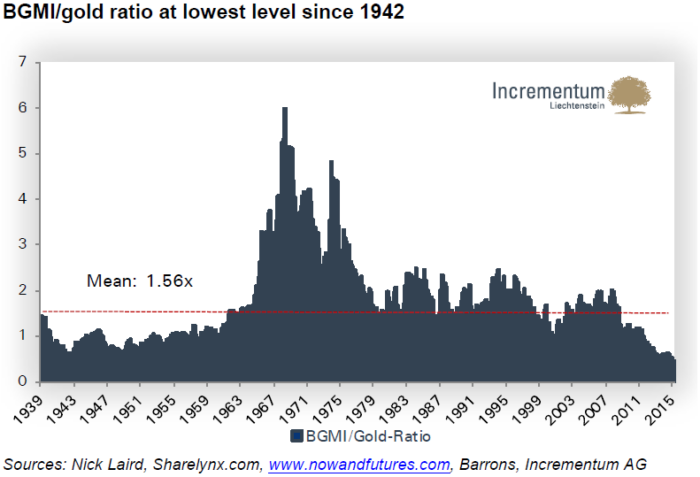
Another topic explored in the report was the underperformance of gold mining stocks.
During the 2000s bull market, mining companies delivered extraordinary returns. However, once gold prices began to fall, the sector dramatically underperformed.
Understanding the reasons behind this divergence – including capital allocation issues and rising costs – became an important theme in the analysis.

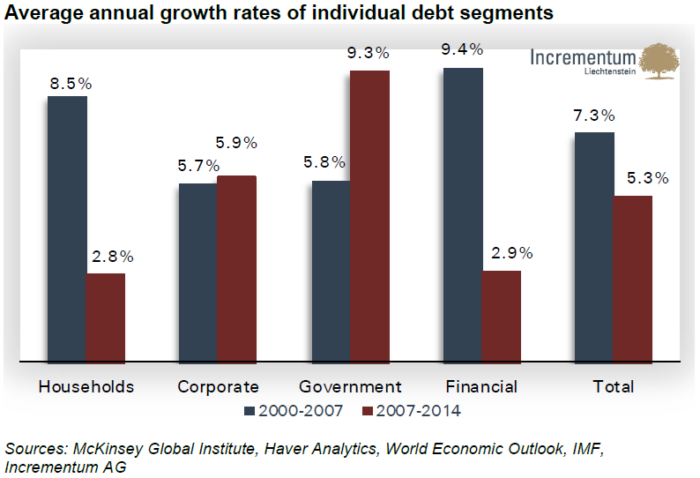
Following the global financial crisis, the private sector began to reduce leverage.
Naturally, governments stepped in and took the “lion’s share” of new debt, effectively stabilizing the credit-based financial system. While this prevented an immediate collapse, it also created growing systemic fragility.

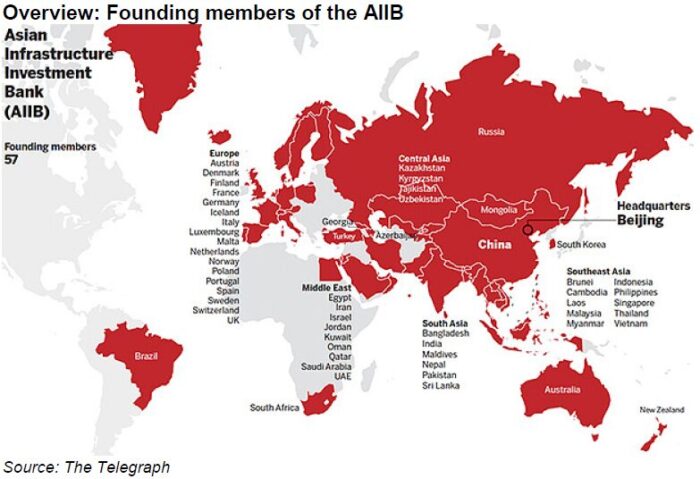
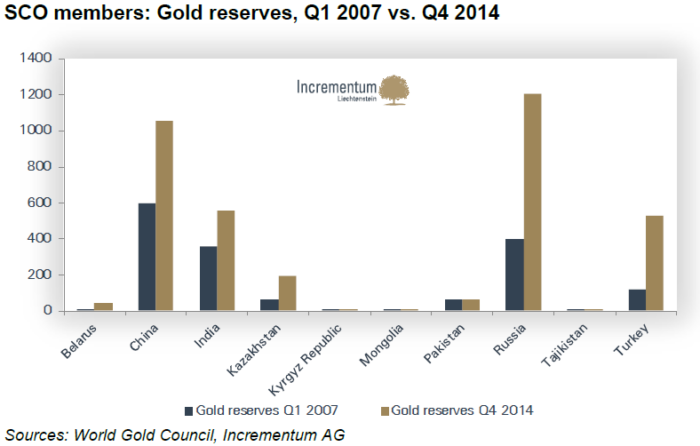
The report also examined geopolitical developments, including the emergence of institutions designed to challenge the Western-led financial order:
Asian Infrastructure Investment Bank
New Development Bank
Shanghai Cooperation Organization
Although these institutions generated considerable hype at the time, they have not fundamentally disrupted Western financial dominance, no matter how much gold their central banks have purchased.
Still, they hinted at the gradual emergence of a more multipolar global landscape, even if they weren’t planning on backing their currencies with gold, which is what we surmised about China’s case.
The late prolific economist Murray Rothbard summarized the unpredictability of inflation dynamics in a passage we cited in the report:
“There is no scientific way to predict at what point in any inflation expectations will reverse from deflationary to inflationary. The answer will differ from one country to another, and from one epoch to another, and will depend on many subtle cultural factors, such as trust in government, speed of communication, and many others.” – The Mystery of Banking
This insight remains just as relevant today.

Looking back today, the 2015 report delivered a mixed, though insightful set of forecasts.
What it got right:
The bottom of the gold bear market was identified fairly accurately.
What it got wrong:
The timeline for the next bull market proved far too optimistic.
All the same, the report’s core thesis remained intact: monetary instability ultimately favors gold.
The 2015 In Gold We Trust report explored monetary tectonics, inflation dynamics, geopolitics, and the gold market in depth.
📘 Head over to our Content Vault to read the full report.
#20Years20Threads #InGoldWeTrust #GoldReport #GoldInvesting #CommodityCycle #BearMarket #FundFlows #MarketSize #GoldRatio #CentralBanks #MonetaryPolicy #PriceStability #Keynesianism #SoundMoney #InflationHedge #SafeHaven #HardAssets #MacroIndicators #MarketSignals #GoldBottom #GoldForecast #GoldMiners #MiningStocks #GlobalDebt #FiscalPolicy #DebtDynamics #Geopolitics #EmergingMarkets #GlobalSouth #Multipolarity #MarketLessons #PortfolioStrategy #AssetAllocation #FinancialHistory #MarketSentiment #InvestorConfidence #InvestmentInsights #MacroResearch #MarketAnalysis #AustrianEconomics #IGWT15 #AnniversarySeries