Stock-to-flow: The special anomaly of gold stocks
Attentive readers of our reports are by now well versed with the concept of the stock-to-flow ratio. This year, we have once again emphasized this extraordinary characteristic of these monetary precious metals. Due to this characteristic, gold and silver represent monetary or investment assets. It is important to us at this juncture to bring this special characteristic into context with gold stocks.
Gold is quite unlike consumable commodities (i.e., also from precious metals like platinum and palladium) in that the bulk of the amount mined is hoarded and not consumed. The total amount of gold hoarded is kept in the form of coins, bars, and some indirectly in fabricated form including jewelry and works of art. The large stocks held in reserve are like a giant “warehouse” and one consequence of this is that long periods of excess supply are possible.
Under certain circumstances, the price can fall well below the cost of production, should industrial demand be supplied from existing stocks. It is often asserted that the price of gold cannot fall below the cost of production. This often-cited argument regarding a natural lower price limit is not applicable in gold’s case.
This is also an important difference to all other commodity producers. The demonetization of a metal results typically in a decline in stocks held in reserve. One example for this is the transition from the bi-metallic standard to the gold standard. Silver was demonetized, and the monetary stock was released in subsequent decades for industrial purposes. The loss of monetary demand had a corresponding negative effect on prices. This can be seen in the gold/silver ratio.
Gold/silver ratio since 1800
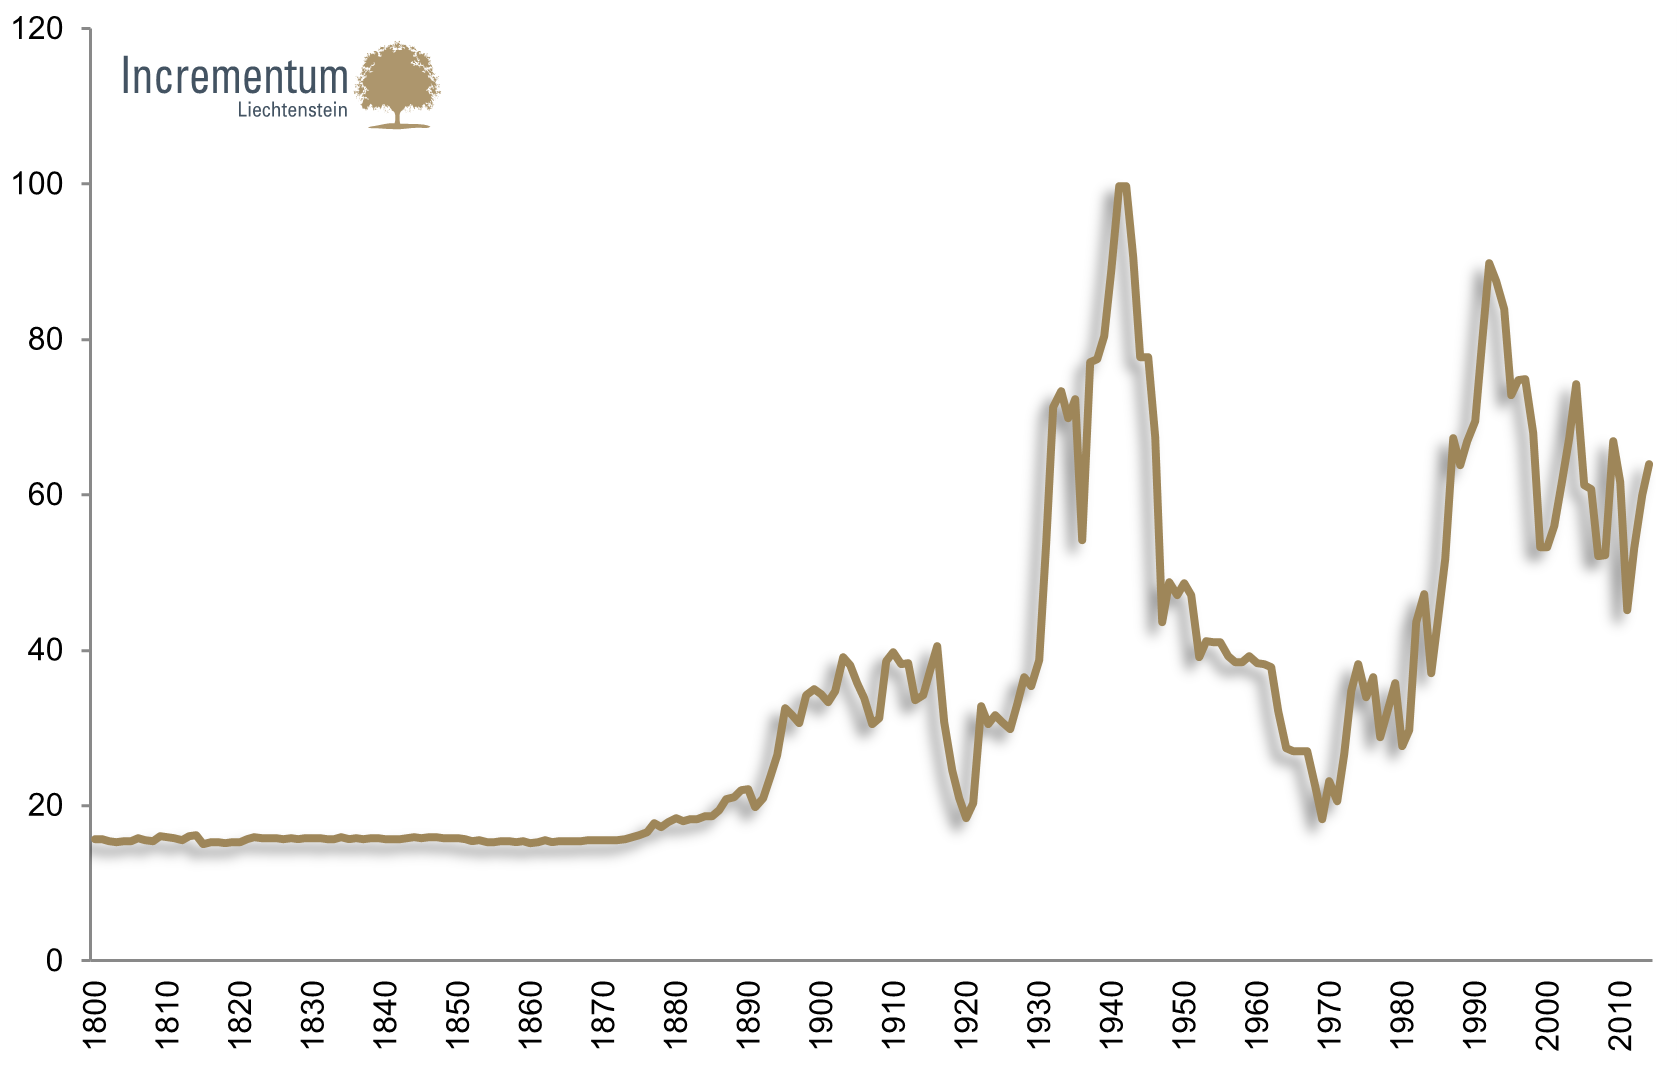
Source: Measuringworth.com, Incrementum AG
Remonetization, on the other hand, leads to a massive structural demand imbalance. For instance, if a paradigm shift in monetary policy occurs in a fiat money system after decades of stable monetary policy, massive monetary demand for gold and silver can ensue. The 1970s provided a good example of this. In such a case, the price will rise significantly above production costs and gold mining stocks can rally for many years.
This monetary commodity anomaly therefore also leads to anomalies with respect to their producers. Such a super-cycle is in our opinion triggered first and foremost through long-term changes in the financial order. For mining companies and investors in mining companies this has the following important consequences:
- Historically, bull and bear markets of above average length can be detected in gold stocks
- the super cycle is triggered by fundamental changes in the monetary framework
- trends that are sustained over the long-term tend to affect corporate governance
- after extended boom periods, structurally high margins often lead to a sub-optimal handling of corporate resources
- extended periods of depression bring about massive consolidation in the sector and the remaining companies are forced to operate extremely efficiently
- for investors the most interesting entry points are offered after years of consolidation
- the extraordinarily strong top-down influence of monetary policy-related events on this asset class argues for active timing of investment in mining stocks
The following chart illustrates that gold stocks are anything but “buy and hold” investments and must be actively managed. This is also confirmed by the saying: “Market and sector forces together typically cause 80% of the price movement in a stock. That means the company fundamentals usually account for less than 20% of a stock’s price movement. This is the reason a company’s stock price sometimes seems to move independently of the fundamentals”.[1]
Amex Gold Bugs Index: bull and bear market cycles since 1999
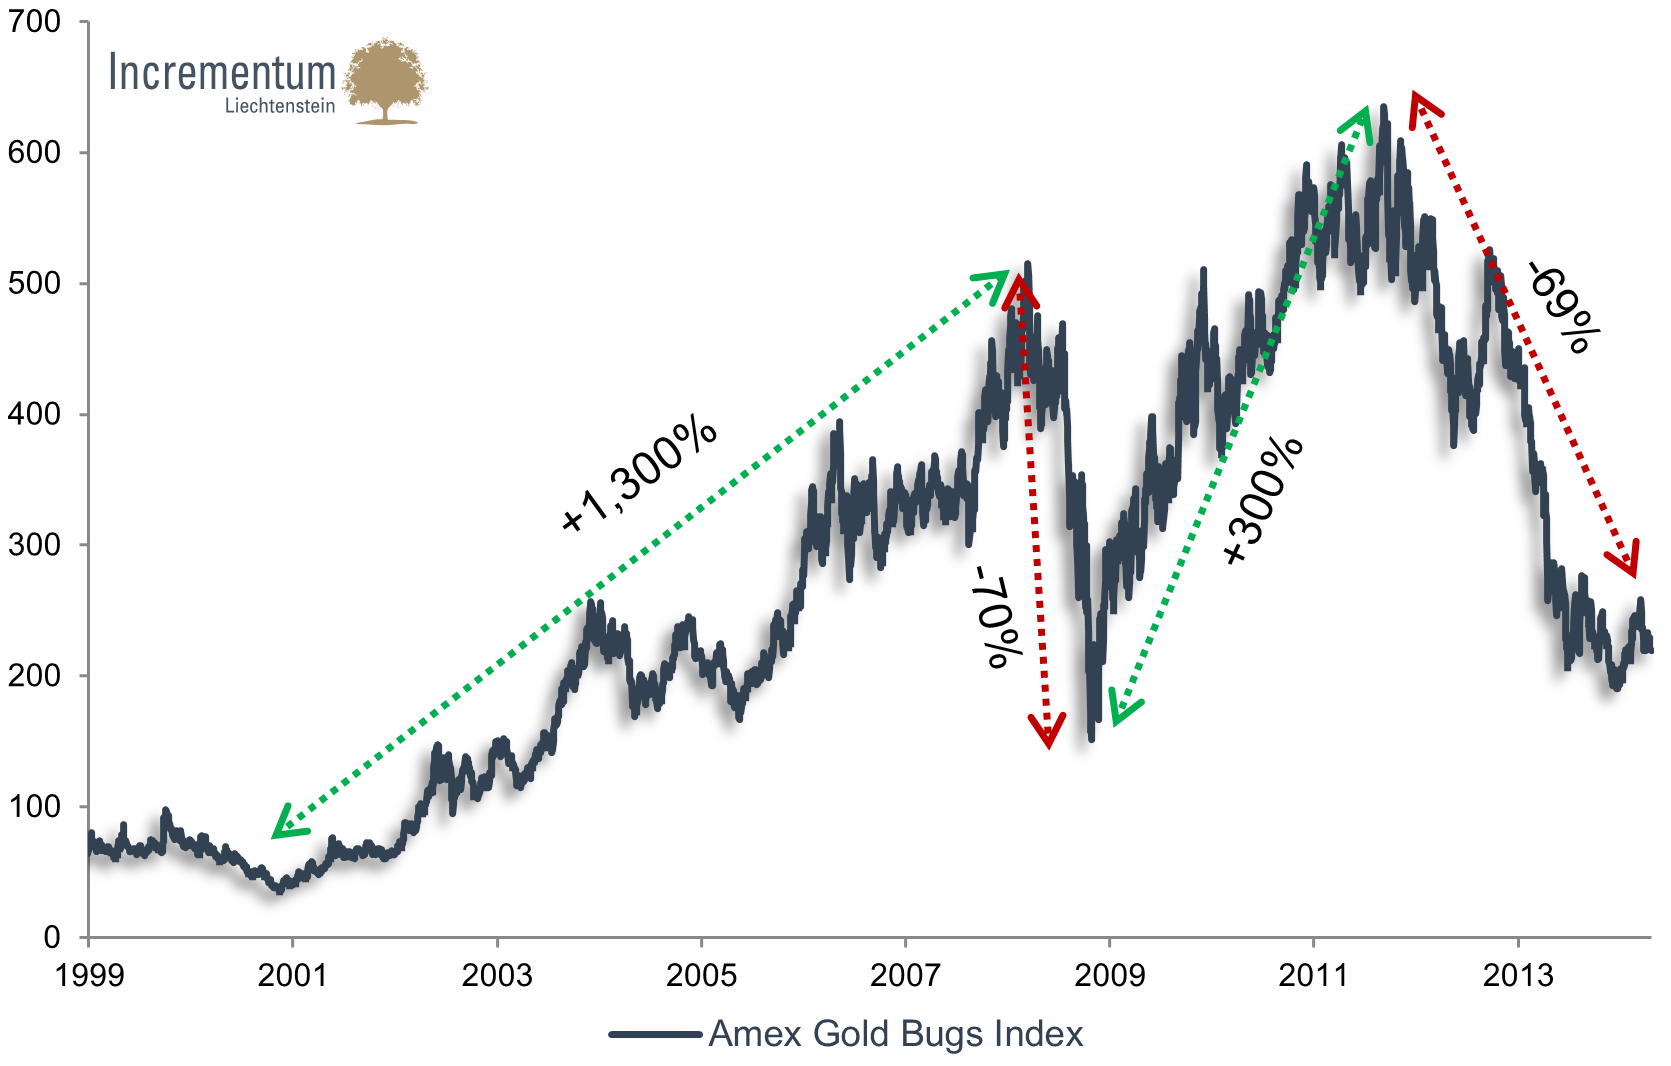
Source: Datastream, Incrementum AG
[1] “The Latent Statistical Structure of Securities Price Changes” Benjamin F. King