The Renaissance of Gold Allocation
“Gold has begun to replace some US Treasury holdings as the riskless asset in many portfolios, most importantly in central banks and large institutional portfolios.”
Ray Dalio
- Central banks and private investors are increasing their gold allocations, while the traditional role of bonds as a risk-free portfolio anchor is increasingly being called into question.
- The stock-bond correlation is positive again, real bond yields are under pressure, and the risk of a lost decade for traditional balanced portfolios is palpable.
- De-dollarization, demographic-driven fiscal pressure, high government debt, geopolitical fragmentation, and recurring inflation shocks are increasing demand for scarce, liquid, and counterparty-free real assets.
- The IGWT Gold Allocation 2045 Model forecasts a gold price of up to USD 20,800 and a gold market capitalization of USD 210trn by the end of 2045.
Fiscal Singularity
The leitmotif of this report – Back to the Monetary Future – also contains a reference to a monetary paradox of our time: The further the financial system drifts from its old anchors – technologically, politically, and on the balance sheet – the greater the need for precisely those characteristics that have defined good money for centuries. In other words, the more pronounced the effects of money’s dematerialization become, the greater the need for an asset whose value is based not on promises but on substance.
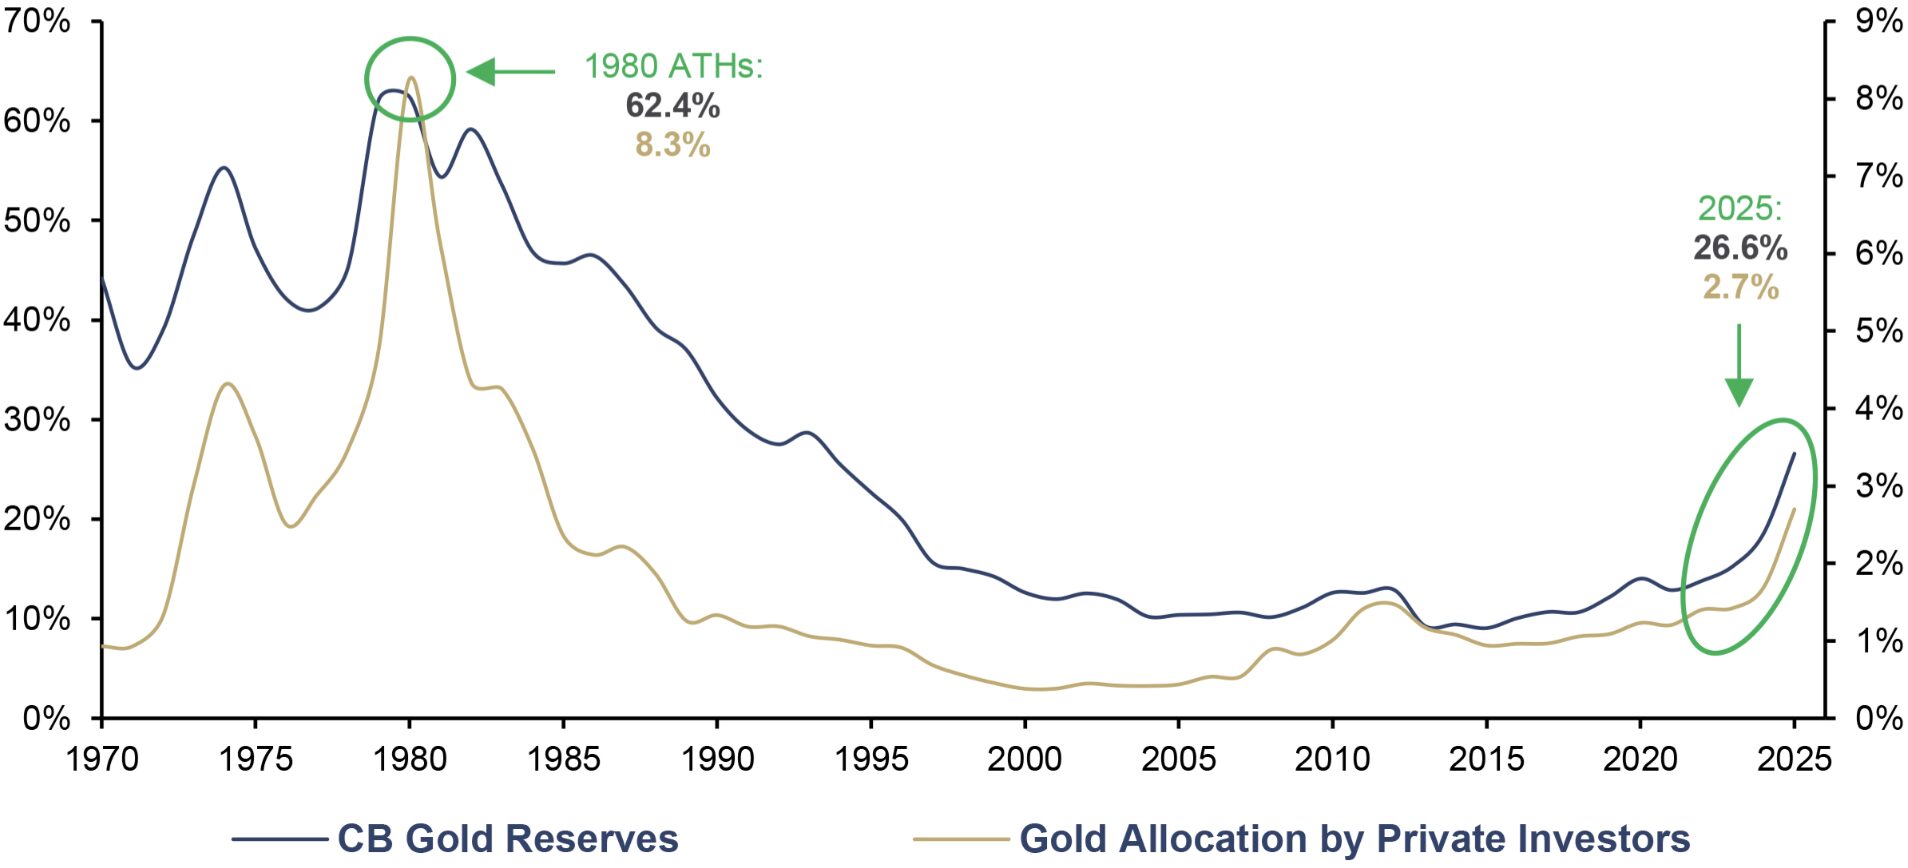
CB Gold Reserves (lhs), as % of Total Reserves, and Gold Allocation by Private Investors (rhs), 1970–2025
Source: Bloomberg, ICE Benchmark Administration, IMF, WFE, World Gold Council, Incrementum AG
We are currently likely only at the beginning of a global renaissance in gold allocation. Both central banks and private investors have rediscovered gold, yet by historical standards, the potential for growth remains substantial. To reach the all-time high of 8.3% in private gold allocations, private investors would need to more than triple their current allocation of 2.7%. Central banks, in turn, would need to more than double their current share of gold in total reserves – 26.6% – to return to the previous peak of 62.4%.
Underlying this paradox is a structural escalation of the global debt crisis, which is causing the conflicting objectives of the existing monetary system to intensify ever further and is gradually pushing the global economy toward fiscal singularity. In a physical sense, a singularity refers to a point at which known laws and models fail because quantities such as density, curvature, or energy tend toward infinity, and the existing framework of order can no longer hold. In the context of the debt situation, this means that the higher the debt burden rises, the more sensitive the system becomes to interest rates. At the same time, persistent inflationary pressure ensures that the interest burden continues to increase and that the conflicting objectives of price stability, debt sustainability, fiscal policy flexibility, and financial market stability become increasingly acute.
Over the years, ever-new layers of liabilities, guarantees, implicit government promises, and accounting workarounds have been piled up. Interest rates were pushed down to near zero and, in some places even below, to make the burden appear manageable. But an artificially pacified volcano is not extinct. It is merely politically pacified until the next eruption. The euro crisis, the gilt crisis in the United Kingdom, the crisis of US regional banks: None of these were isolated events but rather harbingers of a deeper fragility. The bond market, the engine of today’s financial system, has long since begun to lose its structural resilience.
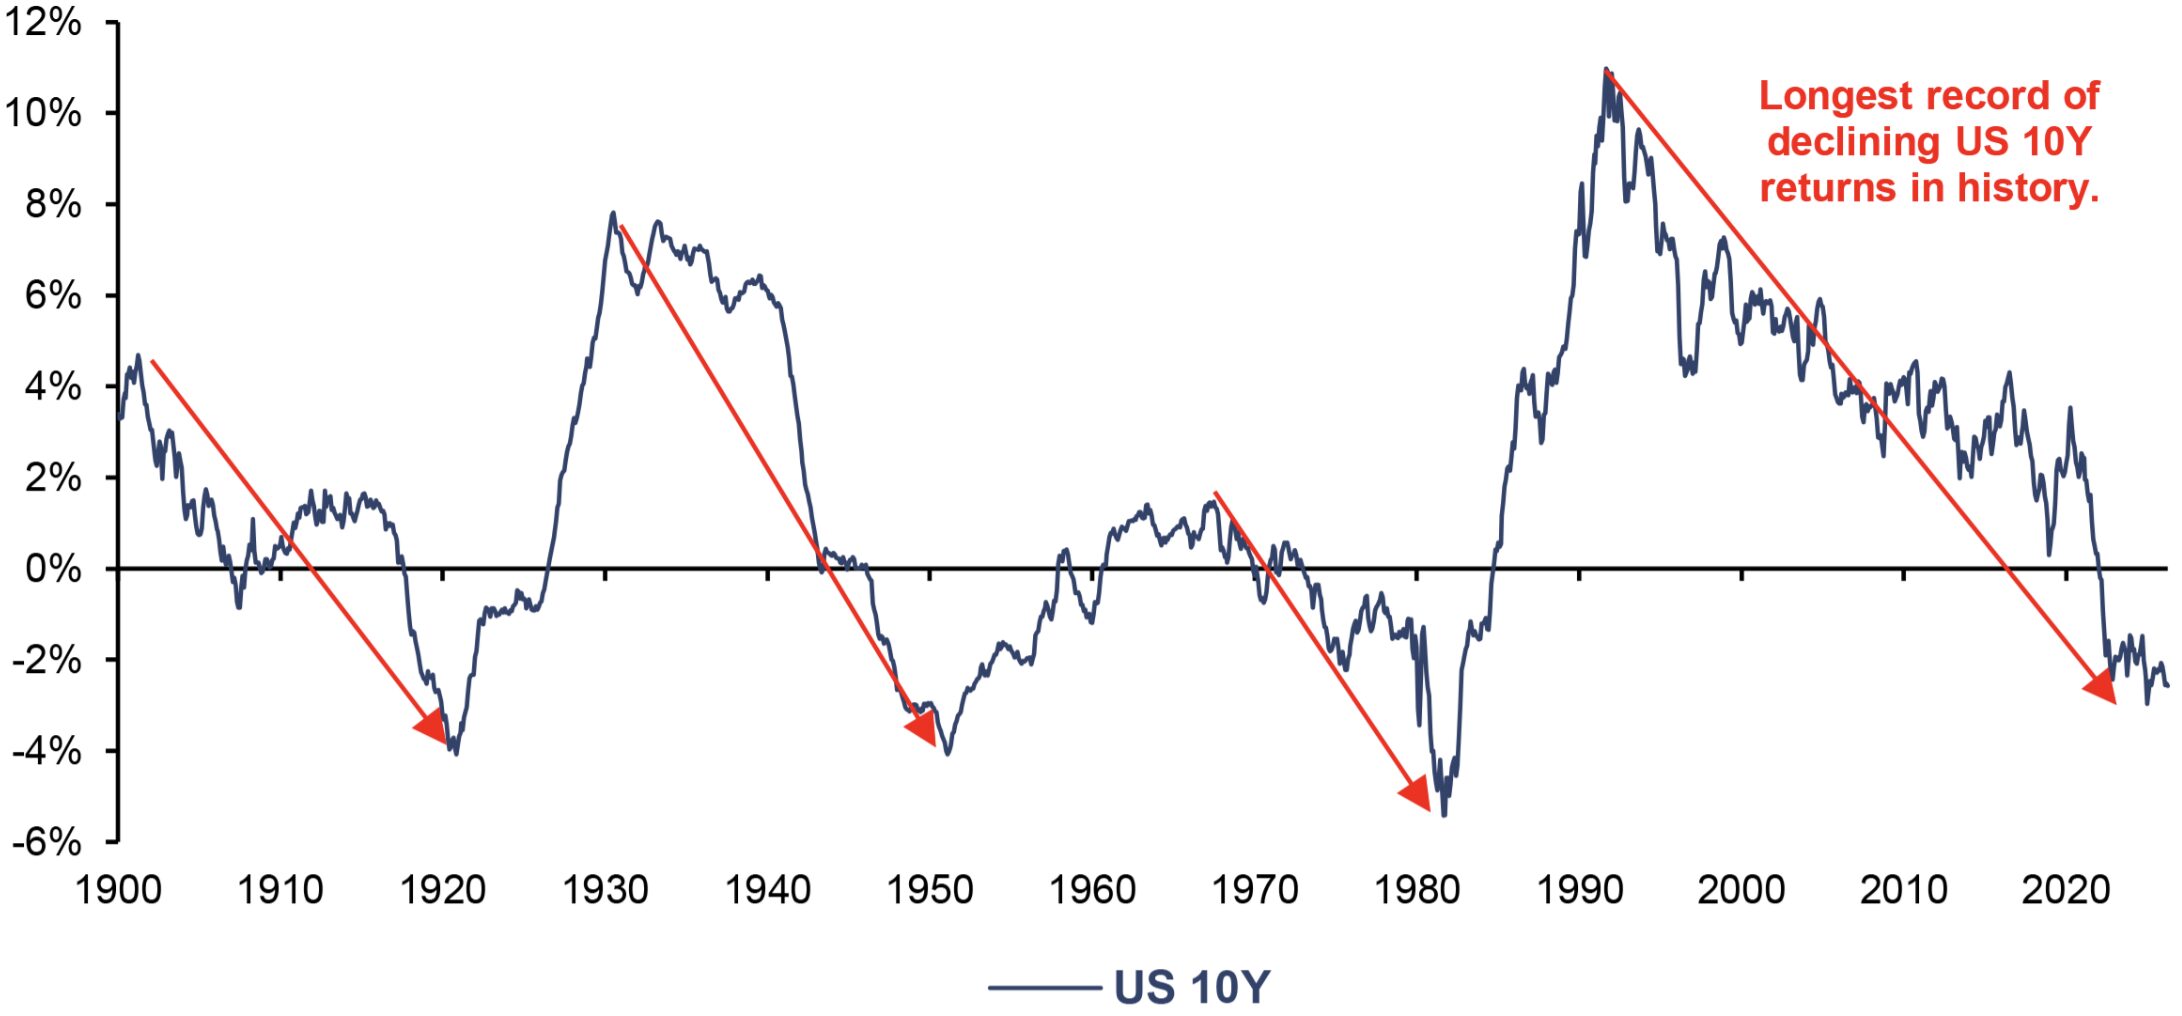
US 10Y, Rolling Real 10 Year CAGR, 01/1900–04/2026
Source: Robert J. Shiller, LSEG, Incrementum AG
The rolling 10-year annualized inflation-adjusted performance of 10-year US Treasury bonds has fallen to -2.58% as of April 2026. A similarly weak level was last reached in the early 1980s. However, the historical cycle lows were significantly lower, at least -4% in each case. Furthermore, as of April 2026, the real 10-year performance has only been in negative territory for 51 months, which represents a relatively short phase by historical standards. Further downside potential cannot therefore be ruled out, even though the structural downtrend has been in place for 37 years and thus already marks the longest phase of declining real performance since the start of the data series. The chart thus underscores that US Treasuries have recently been unable to fulfill their traditional role as a store of real value over long periods.
The fact that many institutional investors still interpret this as a temporary market disruption is telling. The allocation data presented later in this chapter support this assessment. Looking back has conditioned them to draw the wrong lesson, as explained in detail from a behavioral economics perspective in this In Gold We Trust report in chapter 14, “The Psychology Behind Gold’s Underallocation”.
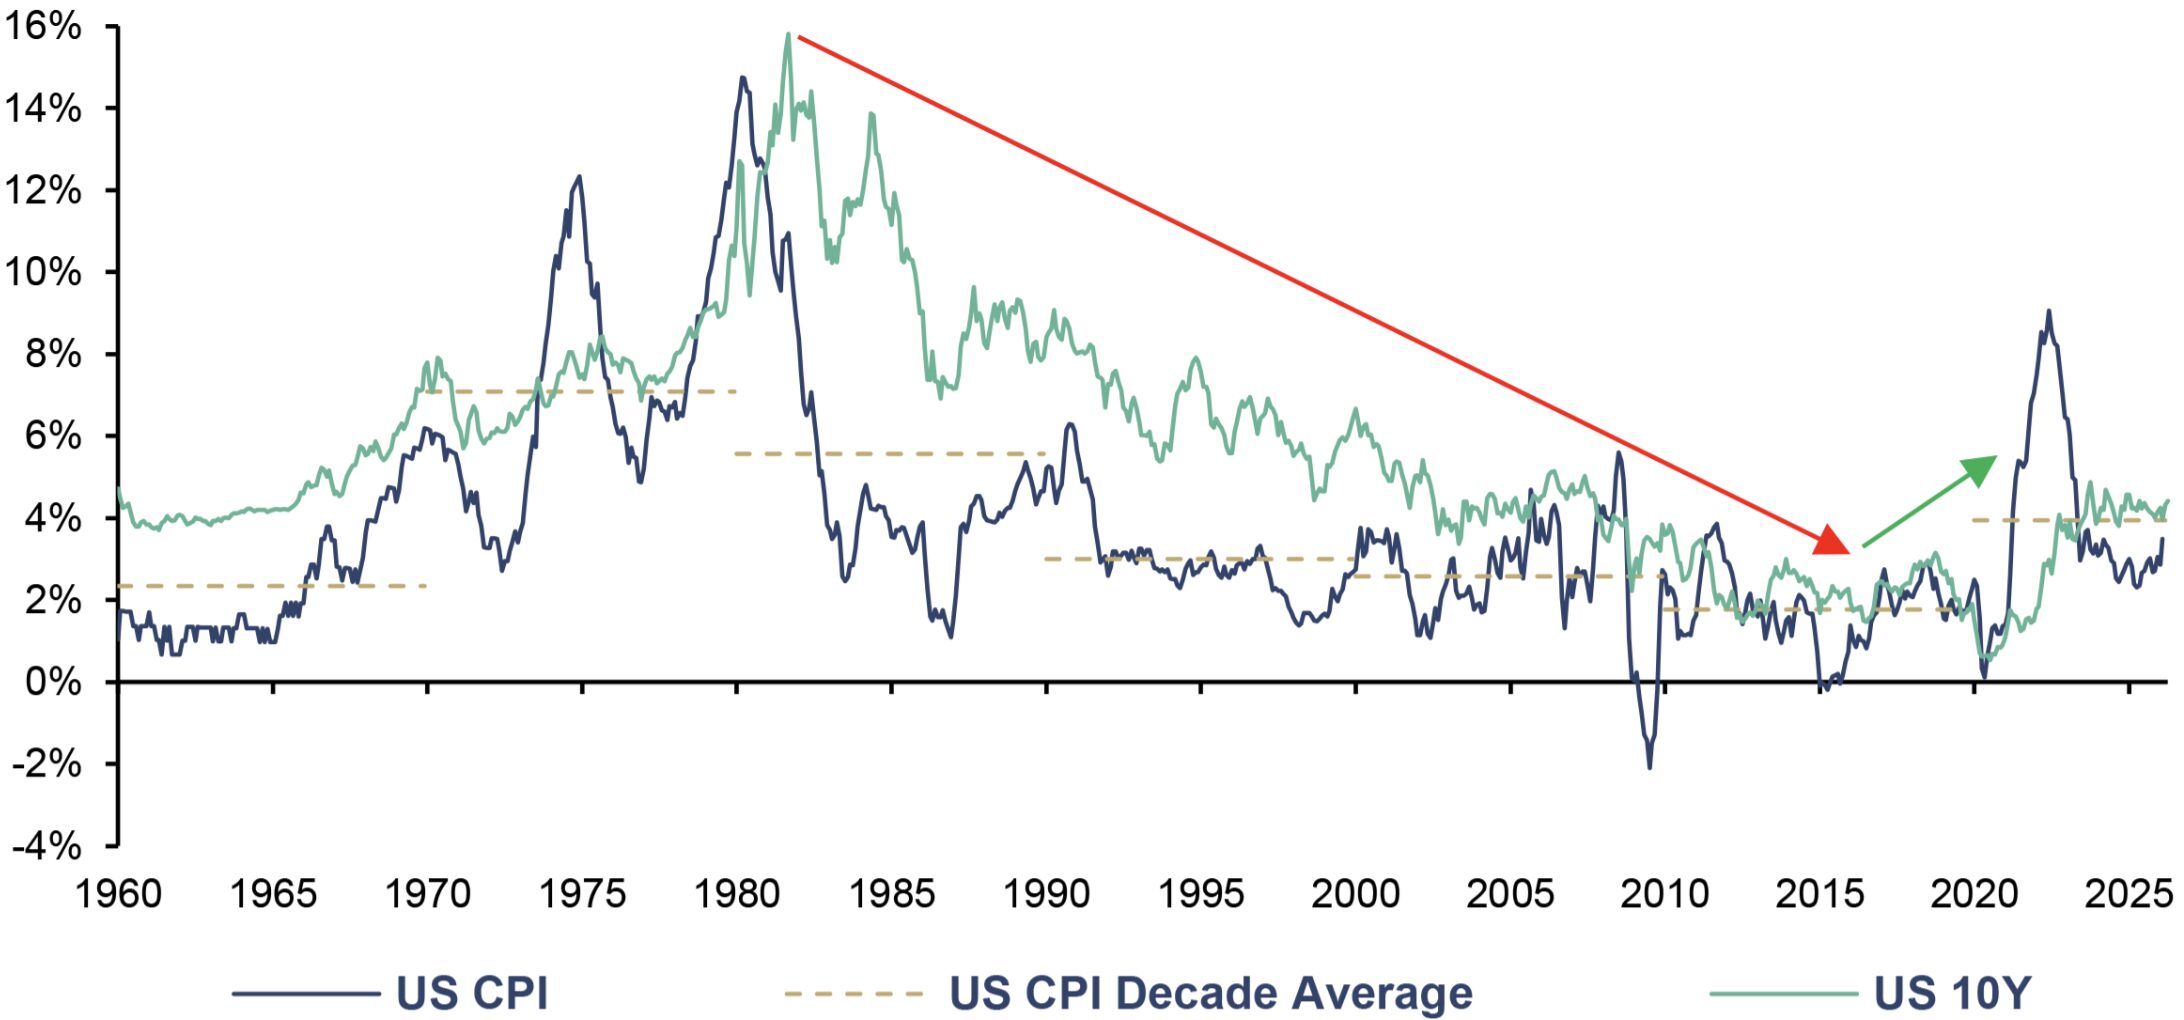
During the era of major disinflation, duration was almost always the right answer, and the 60/40 portfolio was the photosynthesis of that era. Stocks provided the light, bonds the water, and falling interest rates seemingly effortlessly transformed both into oxygen in the form of returns. Until new, unstable elements such as inflation volatility, fiscal dominance, and geopolitical fragmentation disrupted the order. The following chart illustrates not only the nature of the regime but also its breakdown: After inflation and yield averages had fallen for decades, the current decade-long inflation average of 3.94% is now noticeably higher than in the 1990s, 2000s, and 2010s.
US CPI, yoy, and US 10Y, 01/1960–04/2026
Source: LSEG, Incrementum AG
Regimes age. And sometimes they collapse faster than institutional habits can adapt. The monetary future, however, might be less new than many believe, and this is precisely why gold is gaining structural significance.
Gold vs. Bonds: A Duel for the Ages or One with an Expiration Date?
Gold and bonds share a peculiar commonality: Both thrive on trust, but in completely different ways. Government bonds represent a claim to future cash flows within a political regulatory framework. Gold, on the other hand, is not a promise but an asset without a counterparty, without a maturity structure, and without issuer risk. Gold is, so to speak, the monetary antithesis. While bonds depend on the integrity and solvency of the system, gold gains relative appeal precisely when that integrity is called into question.
The following chart corrects one of the most persistent misconceptions in modern portfolio theory: Government bonds are not fundamentally negatively correlated with stocks. The negative stock-bond correlation was less a law of nature than a regime phenomenon. Since 1970, the rolling 2-year correlation between the S&P 500 and the US 10-year Treasury has been positive for long stretches. On average, it stands at around +0.10. This means that, historically, bonds have by no means always reliably cushioned equity risks.
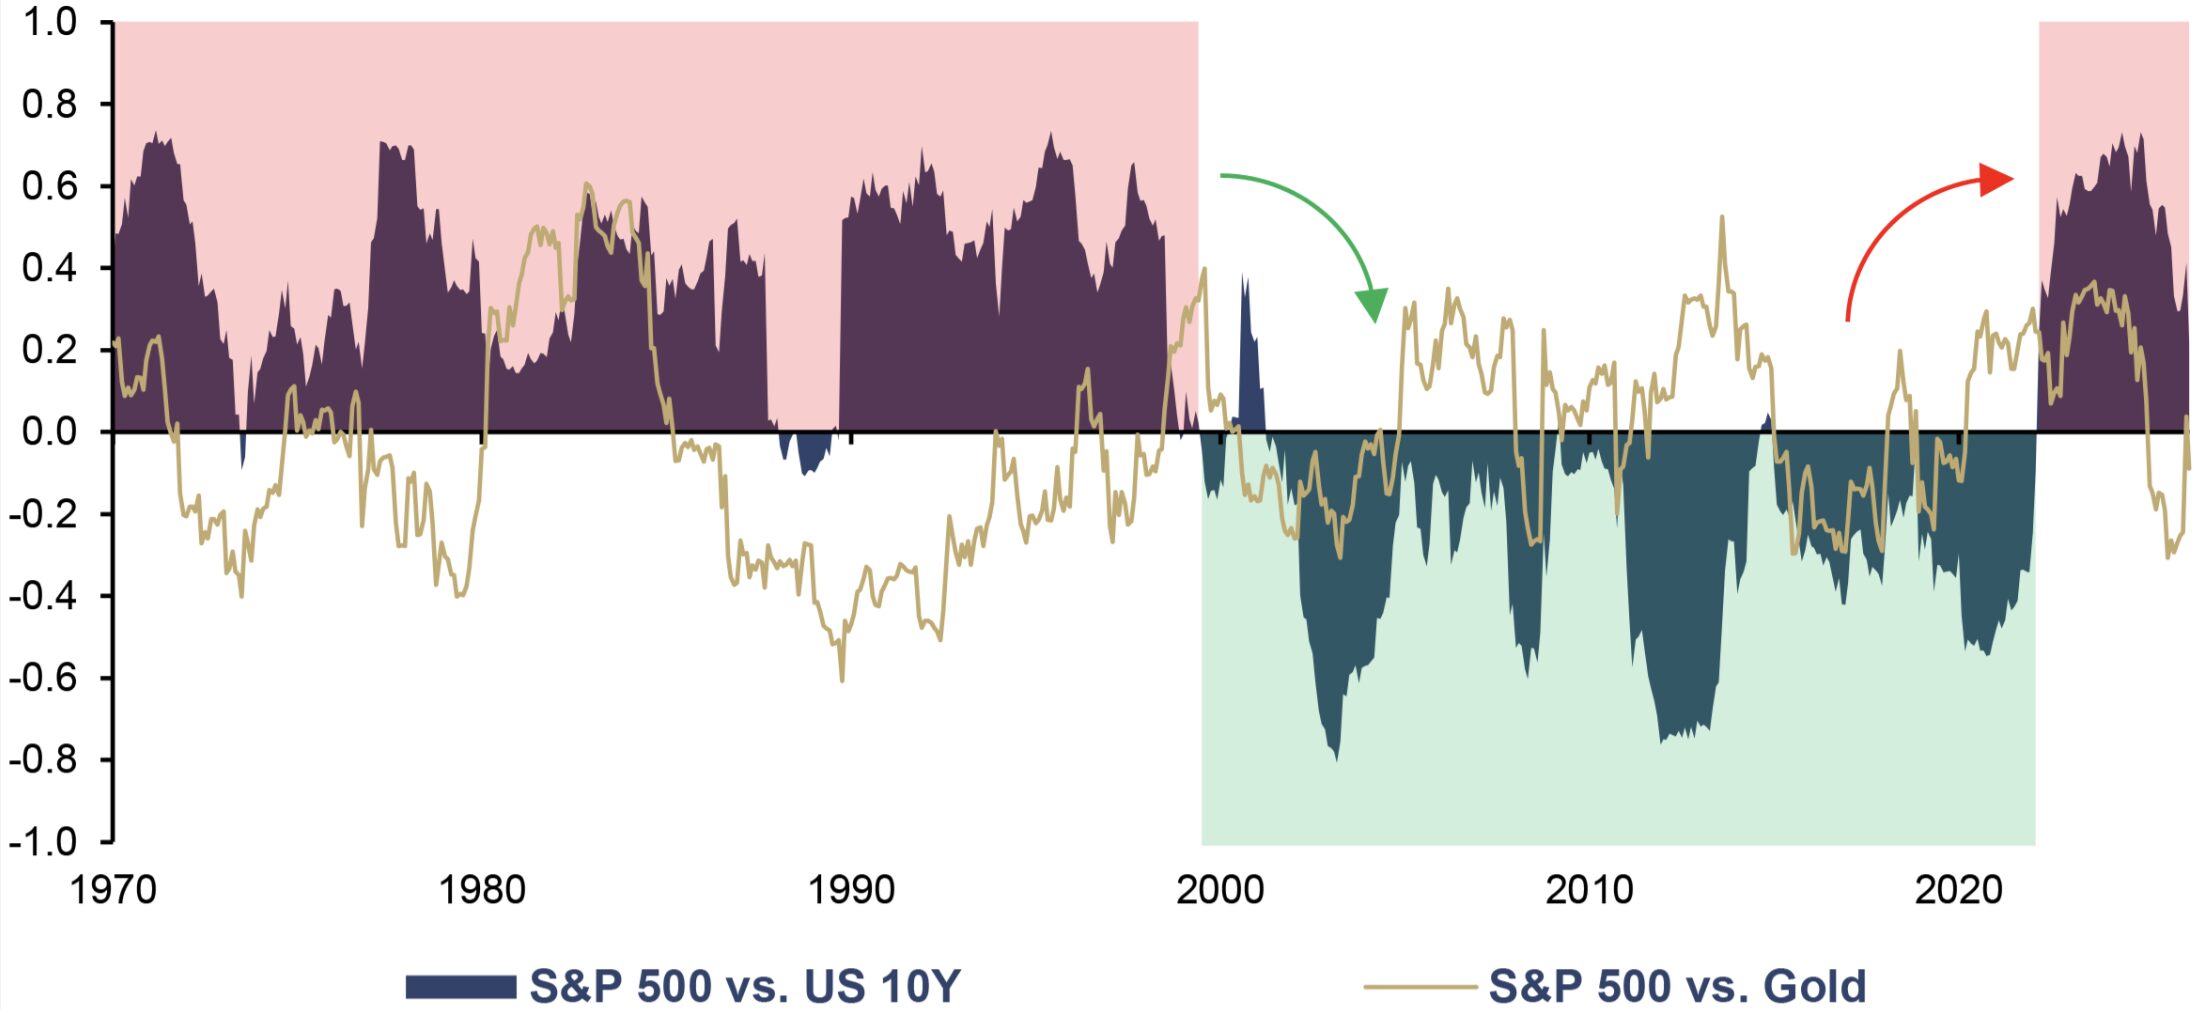
Rolling 2-Year Correlation of S&P 500 vs. US 10Y and vs. Gold, 01/1970–04/2026
Source: LSEG, Incrementum AG
After roughly two decades of predominantly negative correlation, the stock-bond correlation has clearly returned to positive territory. Stocks and bonds have thus forgotten the “catenaccio” of the classic 60/40 portfolio: Instead of defensively hedging each other, they now move in lockstep – they charge forward together and retreat together. If the striker falls, the defender is no longer there to cover. As a result, the classic 60/40 portfolio loses the very characteristic that made it so attractive in past decades: the automatic diversification effect. When stocks and bonds can fall simultaneously, the supposed risk balance turns into a shared dependence on the same macroeconomic factors – inflation, real interest rates, fiscal dominance, and monetary policy credibility.
While the rolling correlation between the S&P 500 and gold also fluctuates, its longterm average since 1970 has been around -0.02, which is lower than that of stocks and bonds. In several periods of market stress, it has even been negative. Gold is therefore not a perfect hedge in every market environment, but a structurally independent portfolio component that gains importance when bonds lose their role as a reliable counterweight to stocks.
In disinflationary and deflationary shocks, the protective function of high-quality government bonds generally remains intact. In such phases, duration acts as a classic “flight to quality” mechanism. Therefore, it would be analytically incorrect to prematurely write off government bonds. But that is only half the story. The other half is this: In inflationary and stagflationary environments, during periods of negative real interest rates, fiscal dominance, or geopolitically induced supply and energy shocks, the diversification power of nominal bonds structurally erodes.
The next chart illustrates the consequences of this erosion of correlation in real performance data. In 2022, the inflation-adjusted 60/40 portfolio suffered one of the worst setbacks in modern capital market history, with a return of -17.1%. Should 2026 also end in the red, this would mark the fifth consecutive year of losses for bonds over the past six years. The supposedly defensive portfolio component has thus become a liability, much like Loris Karius did for Liverpool in the 2018 Champions League final.
Historically, this pattern is by no means unprecedented. Between 1966 and 1981, the 60/40 portfolio recorded seven years of negative real returns, including five years with losses exceeding 10%. This period was marked by inflationary pressures, rising interest rates, and macroeconomic instability – in other words, the very conditions that are once again coming to the fore today.
Inflation-adjusted Annual Performance of a 60/40 Portfolio*, in USD, 1900–2026 YTD
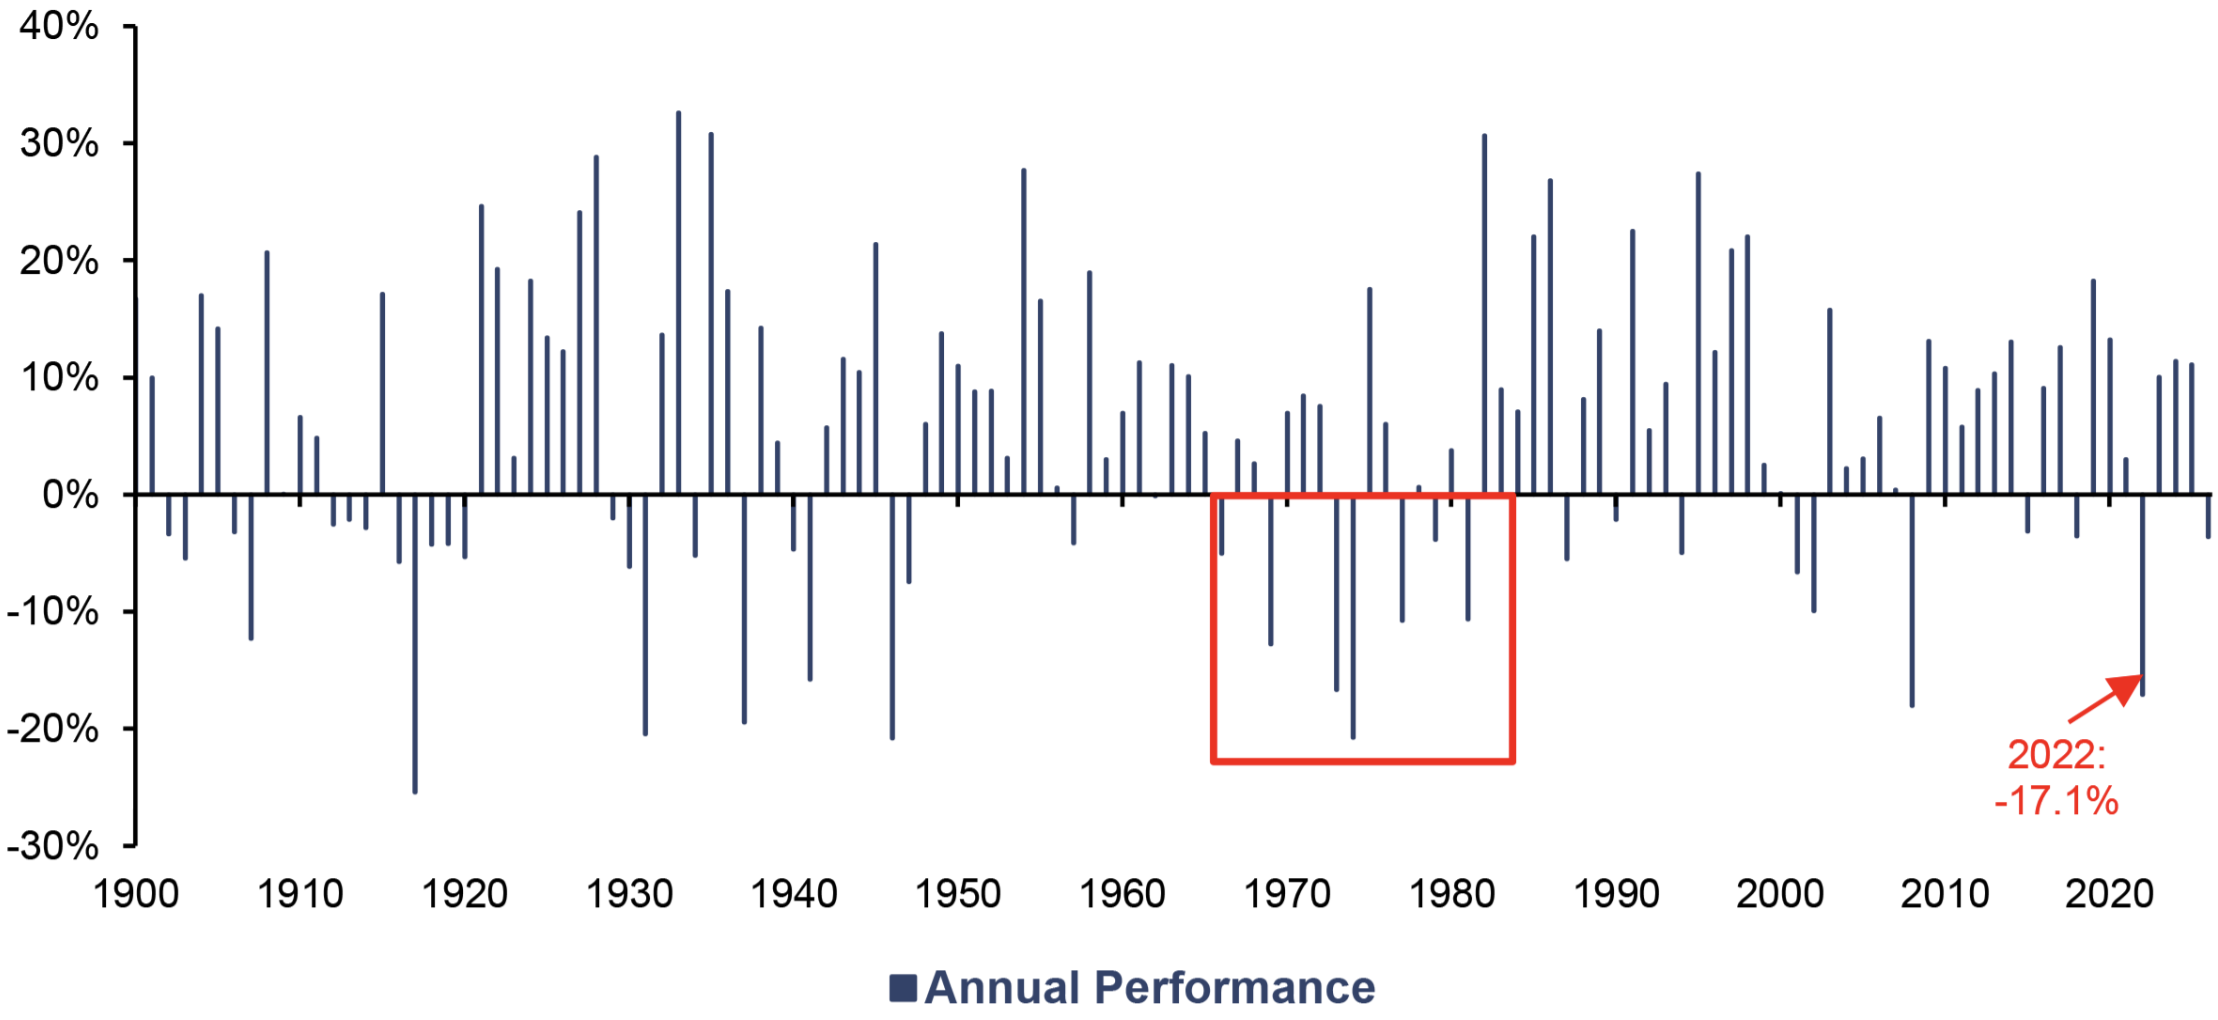
Source: LSEG, Incrementum AG, *60% S&P 500 TR and 40% US 10Y TR
The long-term cumulative performance of a 60/40 portfolio shows that, while it has indeed generated significantly positive real returns since 1900, it by no means delivered the steady returns it appears to have when looking exclusively at the last few decades of the disinflationary phase. For long stretches, real performance was characterized by extended sideways phases in which investors achieved little or no gains in purchasing power. About half of the time was accounted for by such lost periods. The question of whether the 60/40 portfolio entered a new lost decade at the end of 2021 is therefore historically legitimate.
Inflation-adjusted Performance of a 60/40 Portfolio* (log), in USD, 1 = 01/1900, 01/1900–04/2026
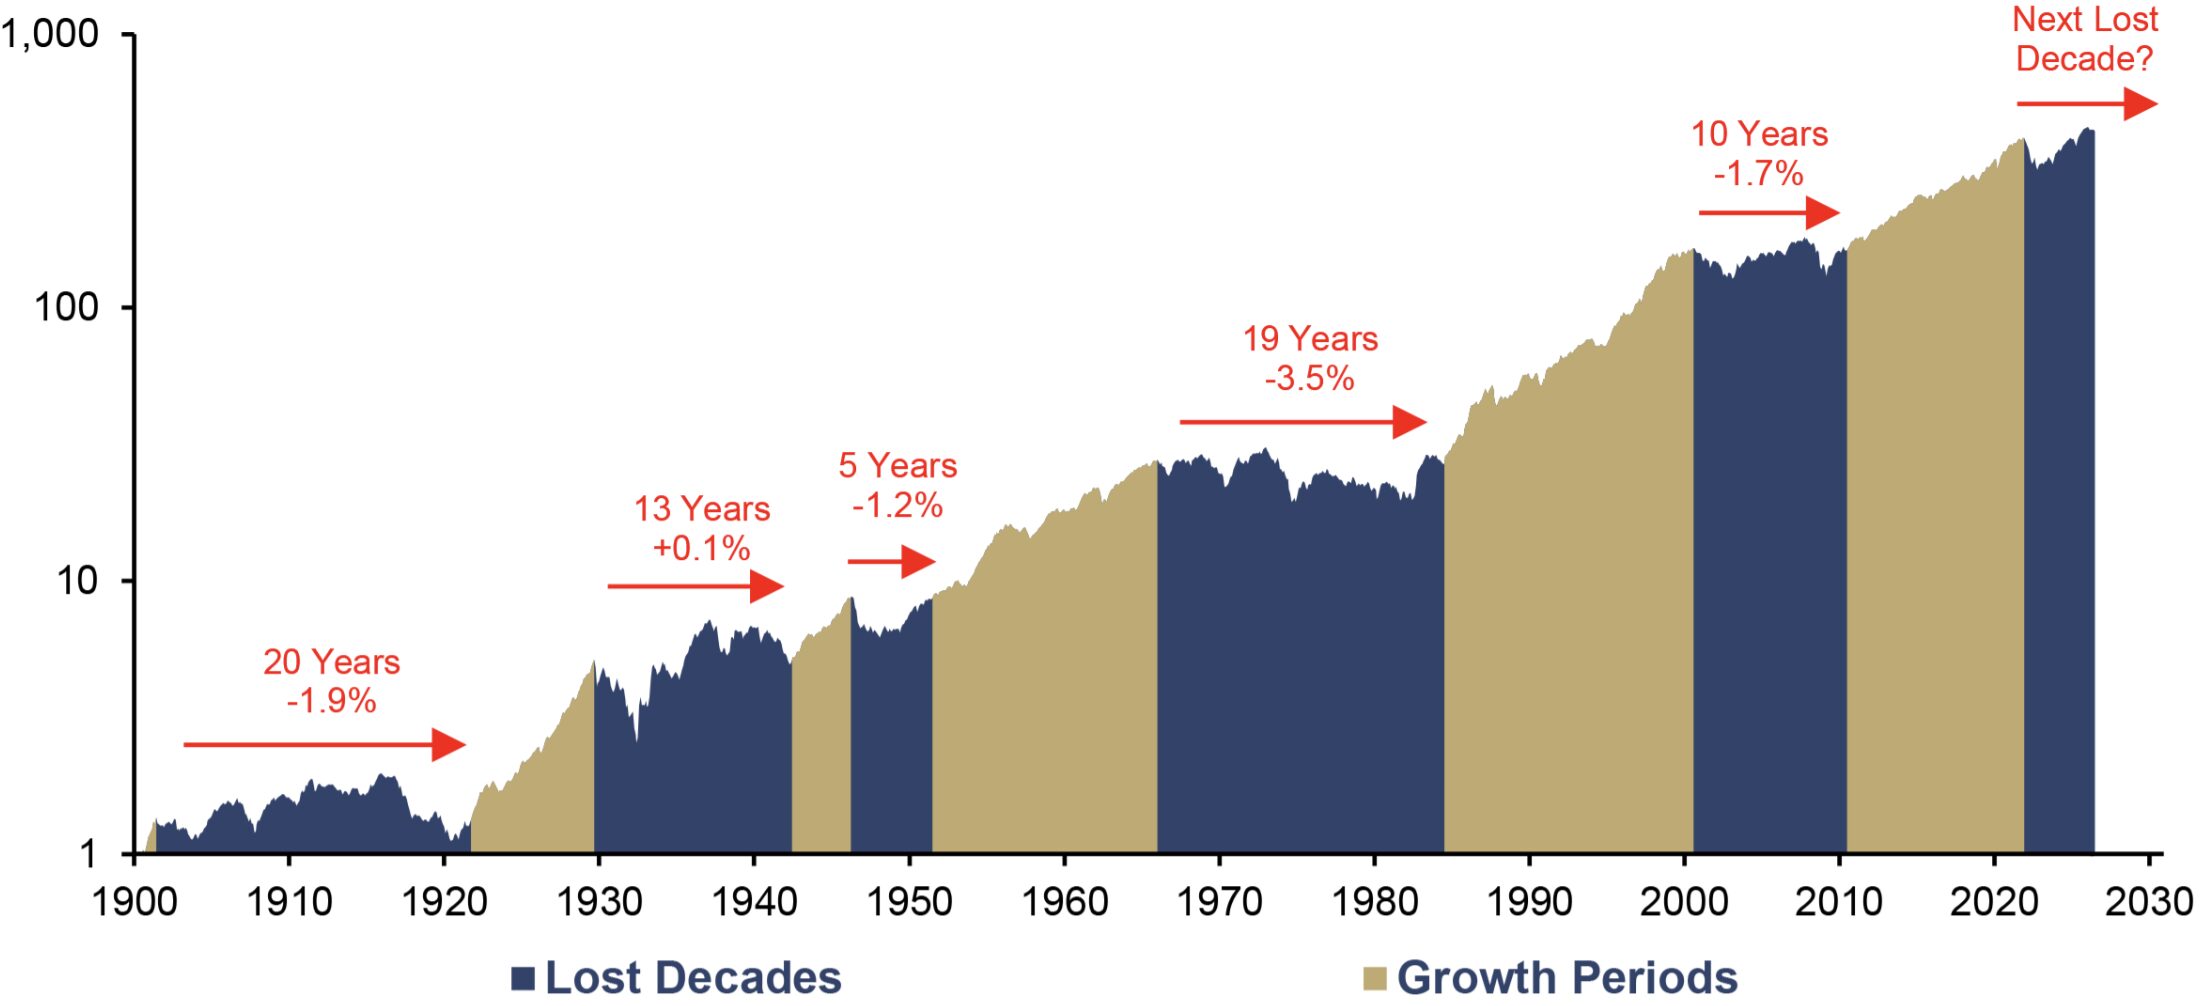
Source: Robert J. Shiller, Incrementum AG, *60% S&P 500 TR and 40% US 10Y TR
We have already demonstrated in previous In Gold We Trust reports that the traditional 60/40 model is not a law of nature.[1] Neither the analysis of the “new 60/40 portfolio” nor our work on optimal gold allocation ever viewed gold as a mere ornament. Rather, it was already suggested there that gold gains strategic relevance precisely in those scenarios where nominal bonds lose their protective effect in real terms. The decisive point for this chapter, however, is another: It is not primarily about an optimization exercise but about the realization that the macroeconomic coordinate system has shifted.
The bond market in the headwinds of the new macro regime
When it comes to the correlation between stocks and bonds, differentiation is crucial: Long-term correlation is not the same as short-term correlation. Furthermore, it is too simplistic to equate correlation with diversification across the board. In practice, the benefits of diversification are significantly more complex and must always be assessed within the respective macroeconomic context. For the bond market, several countervailing forces are currently accumulating, and their simultaneous occurrence makes them particularly problematic.
Debt
The bond market is suffering from a structural overload of the debt system. In recent decades, bonds have benefited from falling interest rates, declining inflation expectations, and high monetary policy credibility. Under the new regime, however, they face headwinds from a debt dynamic that demands low real interest rates, while precisely these low real interest rates can undermine investors’ purchasing power.
US GDP and Total Public Debt, in USD, 100 = Q1/1960, Q1/1960–Q4/2026
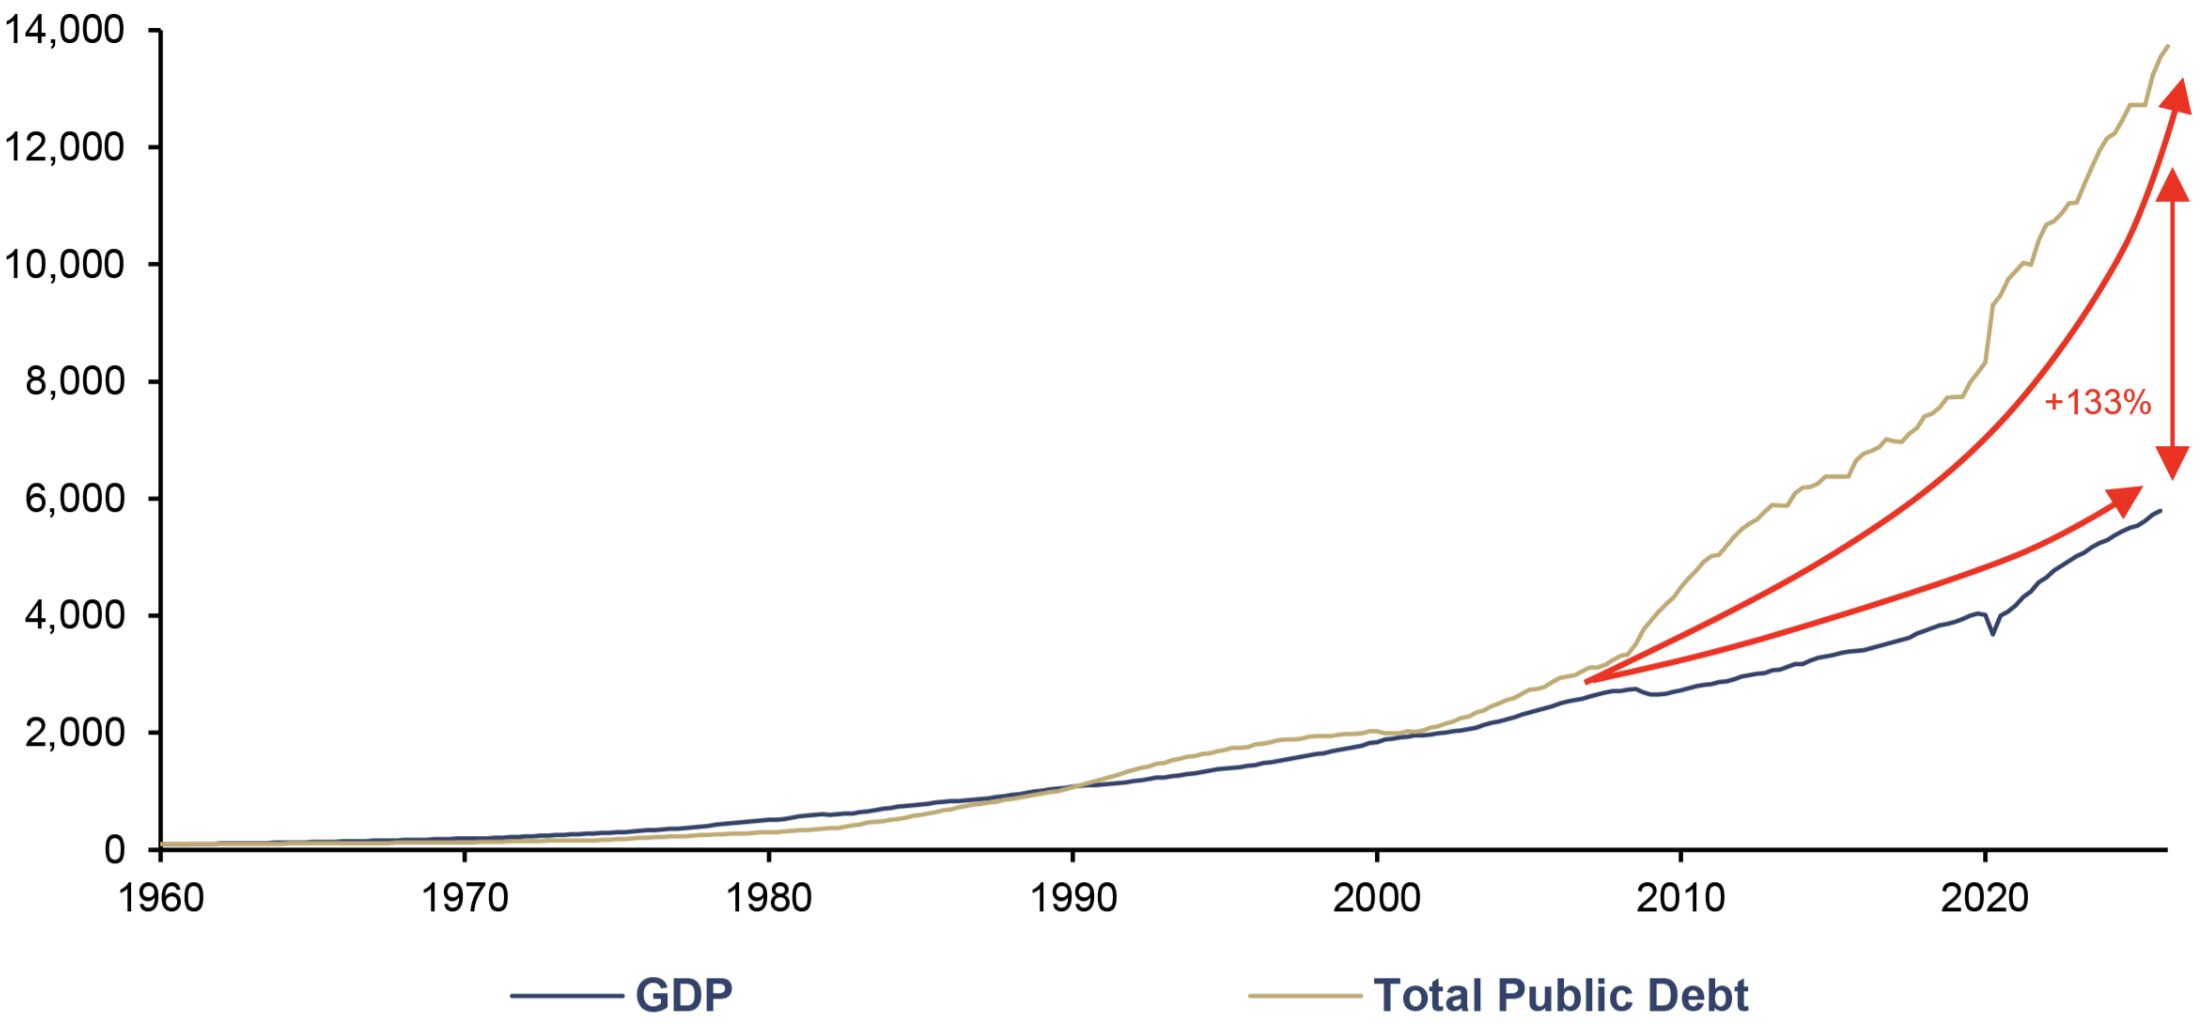
Source: LSEG, Incrementum AG
The chart illustrates one of the central fault lines of the new macroeconomic regime: Since 1960, total US debt has not only grown significantly faster in absolute terms than economic output but has also gradually decoupled from it. Until the mid-1970s, GDP was expanding even more dynamically than debt. Since then, the relationship has gradually reversed. Credit-financed growth has increasingly turned into debt that requires further growth.
By the end of 2025, the cumulative growth of total US debt will have exceeded that of GDP by 133%. Only during the 2020 COVID crisis was this divergence even more pronounced. Thus, the chart shows not merely a long-term rise in debt but a creeping shift in macroeconomic dynamics: The debt foundation is growing faster than the real economic framework it is meant to support.
For the bond market, this development is of fundamental importance. The further debt and economic output diverge, the more the political response function changes. High debt levels increase the pressure to keep nominal financing costs under control and real financing costs as low as possible. What was once regarded as the bond market’s disciplining function is increasingly becoming a political imposition in such an environment.
This puts government bonds in a paradoxical position. They remain the government’s primary refinancing instrument, yet precisely because of this, they lose part of their role as a nonpolitical portfolio anchor. If the system’s sustainability depends on persistently low real interest rates, the bond market becomes more vulnerable to financial repression, fiscal dominance, and higher inflation volatility.
Inflation and interest-rate trends
Stagflation refers to a macroeconomic scenario in which the traditional monetary policy response loses its effectiveness. Economic growth slows down, while price pressures do not ease sufficiently. For central banks, stagflation is what a clay court is to Daniil Medvedev: the most unpleasant playing field. Interest rate cuts can exacerbate inflation risks, while rate hikes weigh on growth, debt sustainability, and financial markets. It is precisely this dilemma that lies at the heart of the new macroeconomic regime.
The next chart shows that the stagflation debate is by no means a relic of the 1970s and has not only returned to the macroeconomic spotlight in the current decade but also in people’s minds. Indeed, the term stagflation has recently been invoked with significantly greater frequency. Following 2022, when we deliberately titled our In Gold We Trust report “Stagflation 2.0”, the perception of stagflation has thus reached a significantly higher level for the second time this decade. It is becoming a latent concept in the collective market memory.
Google Trends: Stagflation, 01/2004–04/2026
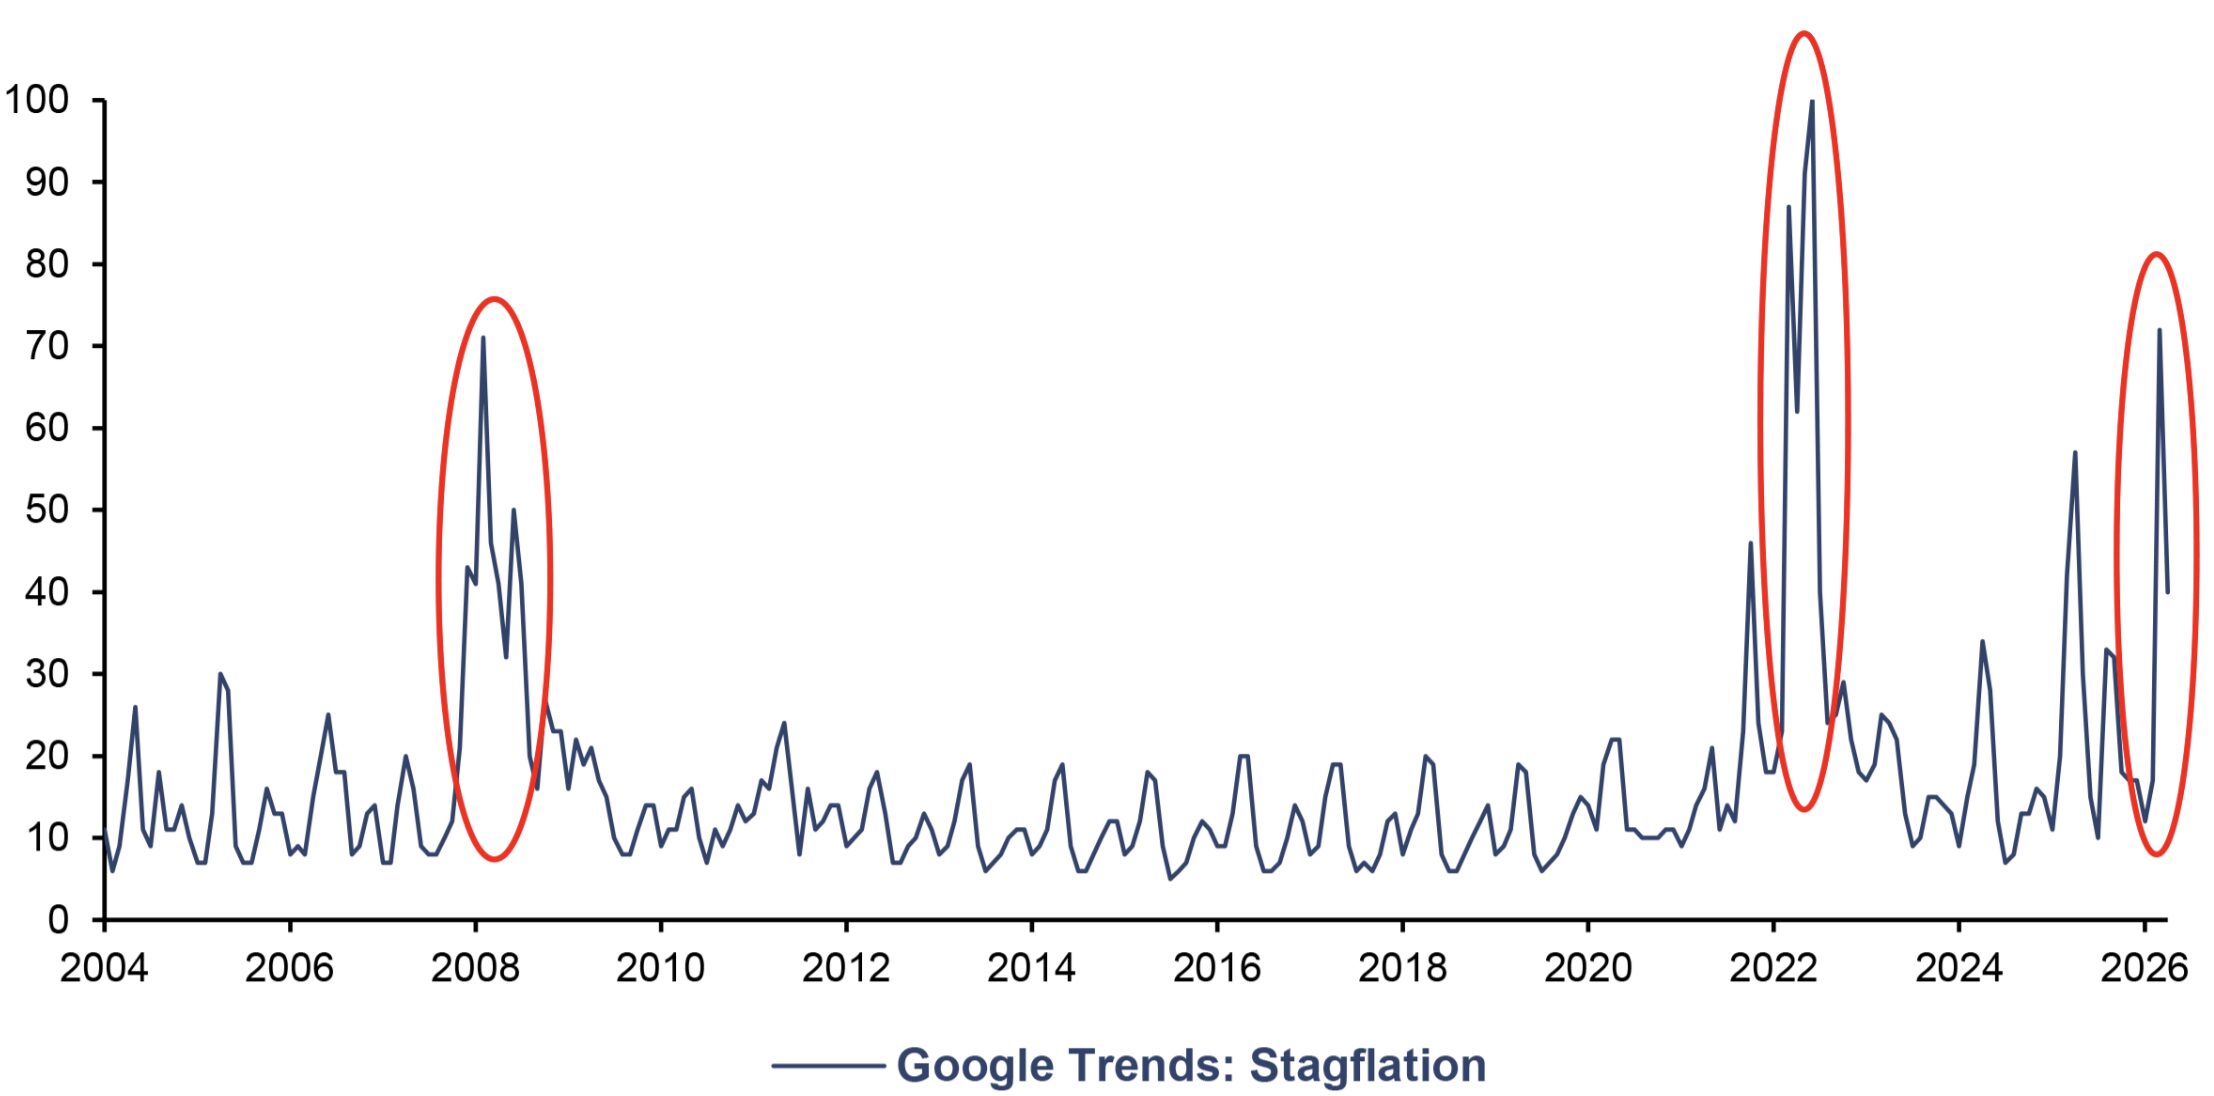
Source: Google, Incrementum AG
The following chart illustrates how this trend is being transmitted through the market via energy prices and interest rate movements. The pattern following 2021 is particularly striking: The oil price surged ahead, while yields on 10-year US Treasury bonds followed with a lag. The WTI oil price rose sharply from its COVID low and at times reached levels of around USD 120 in 2022. This energy price shock, combined with the drastic expansion of the money supply, fueled inflationary pressure and forced monetary policy into the fastest cycle of interest rate hikes in history. As a result, the US 10-year yield rose from its COVID low near 0.5% to the range of over 4%.
US 10Y (lhs), and WTI (rhs), in USD, 01/2015–04/2026
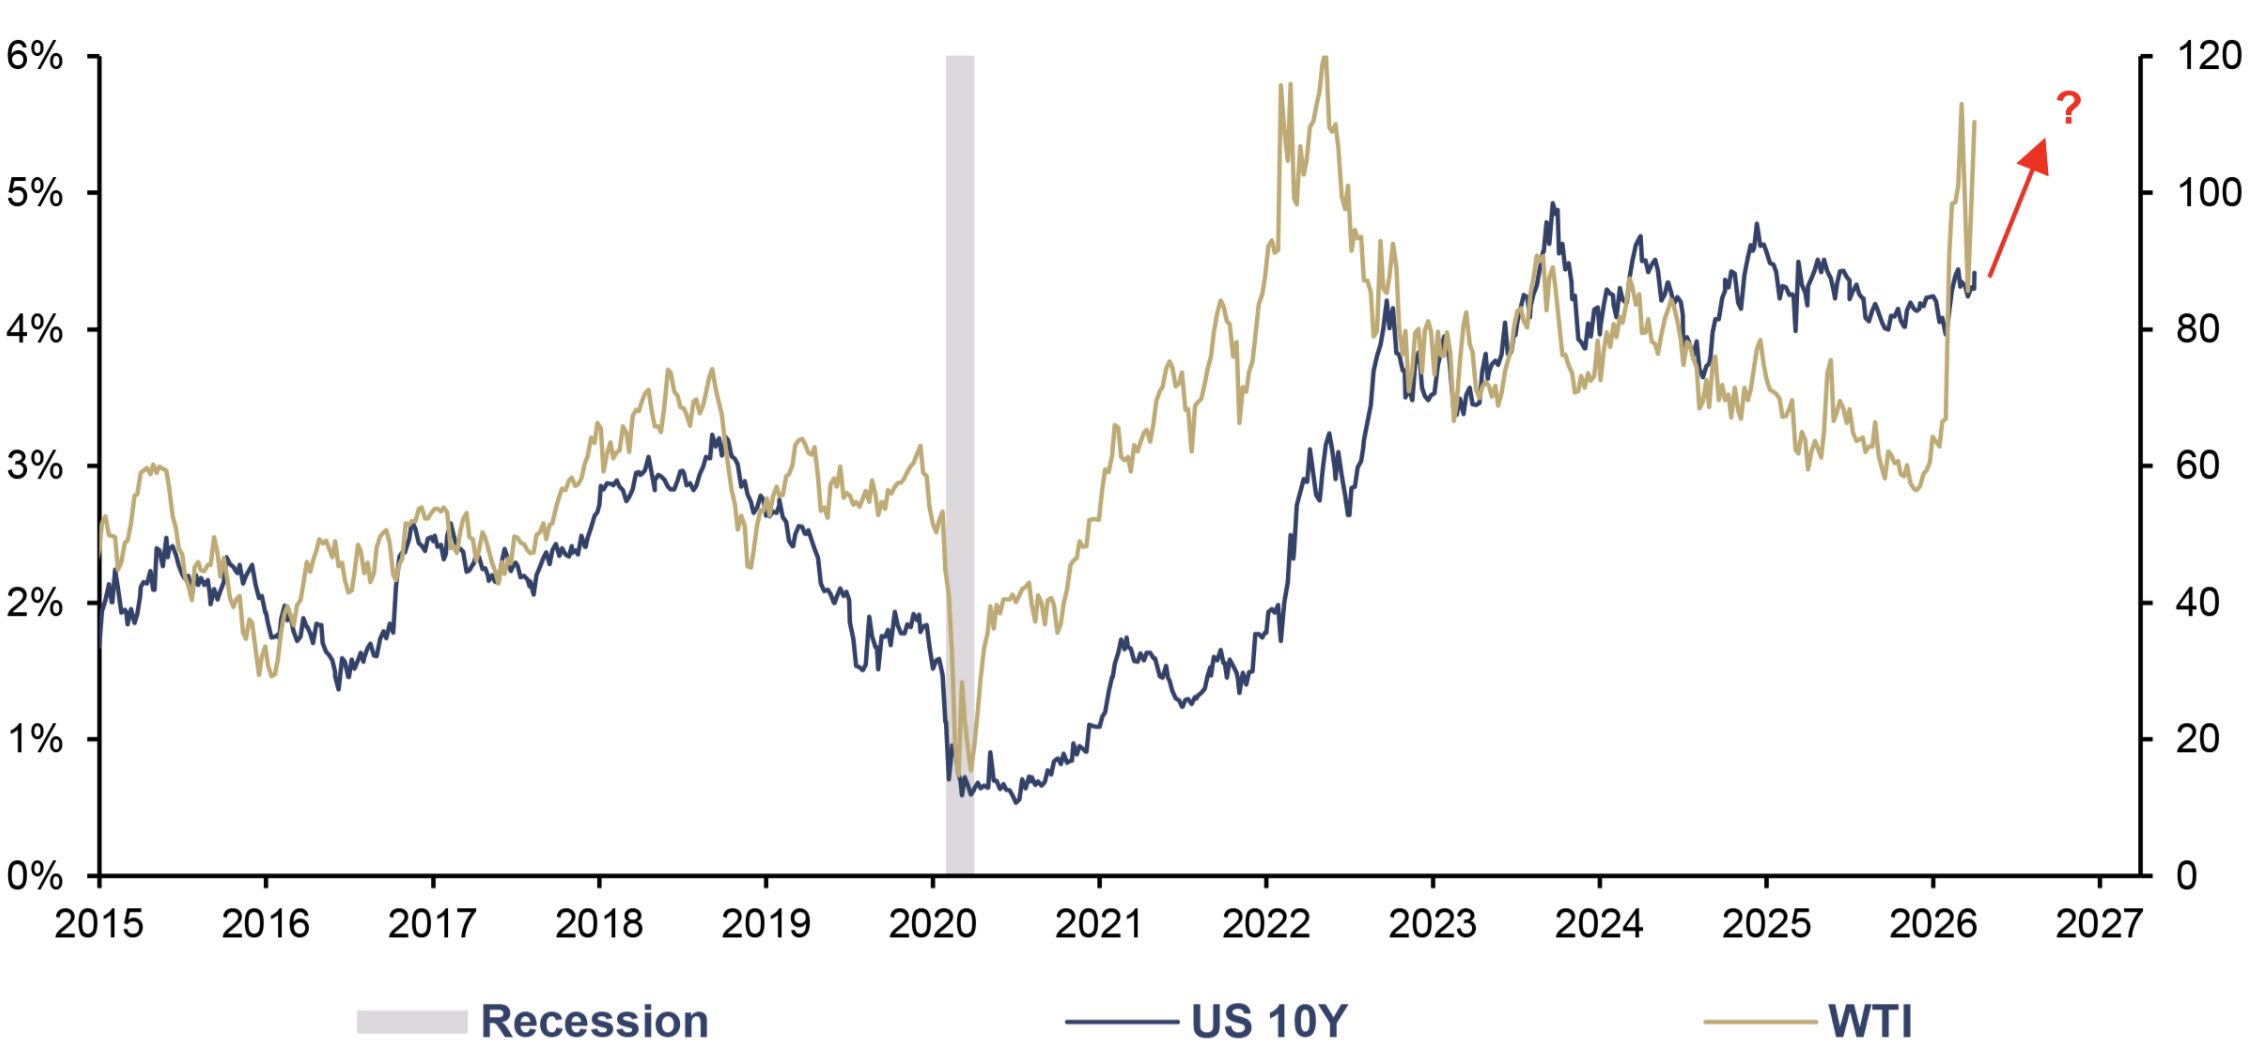
Source: LSEG, Incrementum AG
This pattern is crucial for the current outlook. Should the oil price rise sustainably again, this would not only be a warning sign that inflation could once again be less “transitory” than central banks would like but would also imply rising bond yields. For central banks, this would once again intensify the conflict of objectives: To maintain credibility in the fight against inflation, they would have to remain more restrictive or accept further interest rate hikes, even if growth and debt sustainability are already under pressure.
If inflation and interest rates remain high or rise again simultaneously, stocks come under pressure from margin compression and valuation multiples, while bonds are weighed down by rising yields and negative real returns. The new macro regime is not necessarily characterized by persistently high inflation but rather by higher inflation volatility and recurring inflation shocks. Those who continue to rely on the old 60/40 playbook are implicitly betting on the return of the old disinflationary world. But those who wait for the return of the old realities are waiting like an Elvis fan outside the gates of Graceland – with great longing but likely in vain.
Geopolitics & war economy
In a fragmented world order, bonds are no longer merely interest-bearing instruments and diversifiers, but increasingly also serve as a canvas for geopolitical power politics.
The historical analysis by Greenwood et al. shows that wars are not merely humanitarian and real-economy disasters but also leave deep scars on government bond markets. Based on monthly observations of government bond prices since 1822, the authors document that a global war shock of one standard deviation reduces the yields of a global bond portfolio by around five percentage points within a year.
Crucially, however, it is not the war itself that moves the markets. Even explicit military threats – whether verbal or through physical demonstrations of power – depress the bond prices of the threatened states. The study thus shows that geopolitical risk is a systematic driver of government bond markets not only as a realized conflict but already in its anticipated form. A military threat thus becomes more than mere rhetoric. It can act as an instrument of geo-economic influence by worsening a country’s refinancing conditions and restricting its fiscal maneuvering room.
Global Economic Policy Uncertainty Index and Geopolitical Risk Index, 100 = 01/1997 (log), 01/1997–03/2026
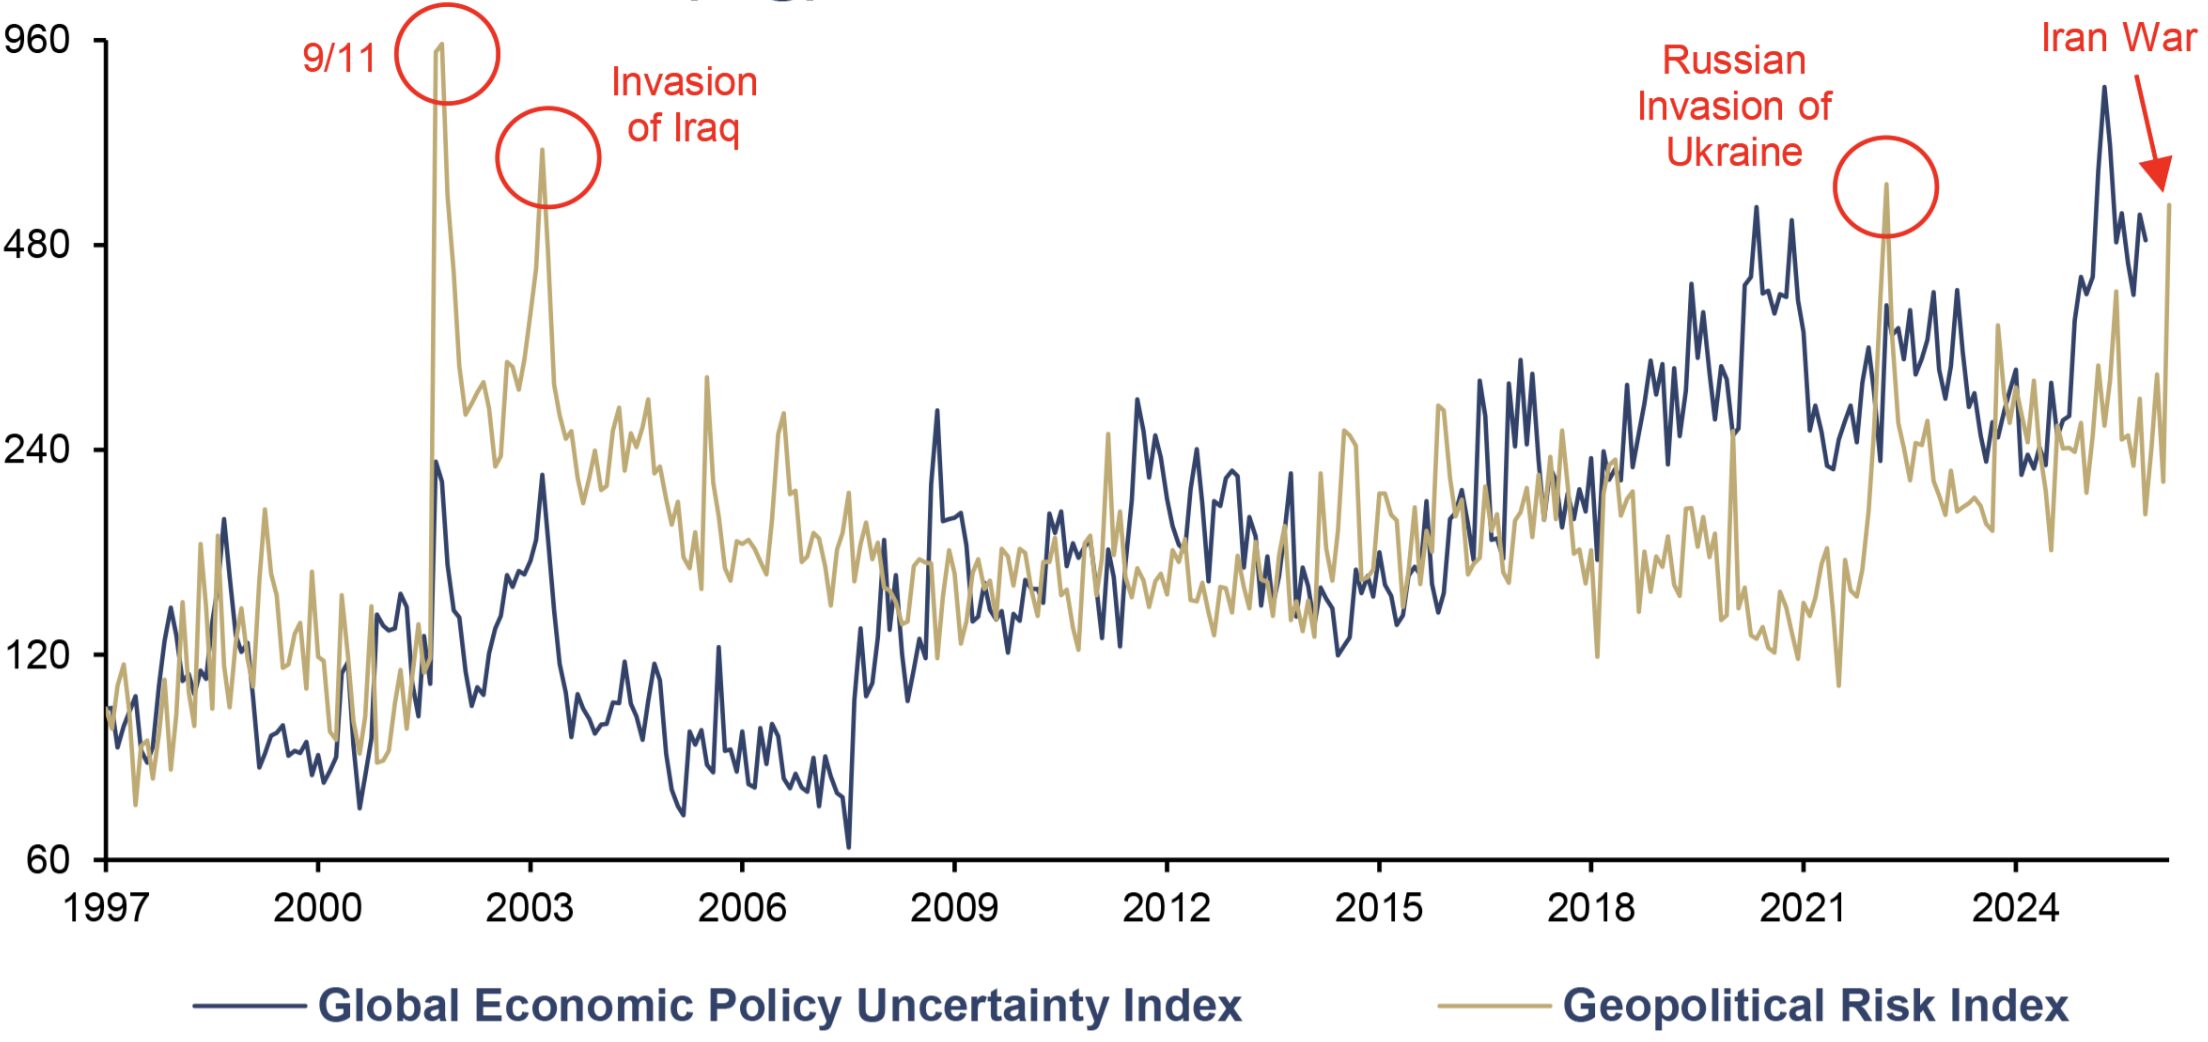
Source: Economic Policy Uncertainty, Incrementum AG
A reliable barometer of geopolitical uncertainty on a global scale is the Geopolitical Risk Index, which has already hit a high for the second time this decade following 2022 and, with a percentile rank of 98.5, underscores the precarious global geopolitical situation. A comparison with the Global Economic Policy Uncertainty Index also shows that geopolitical escalations are often accompanied by economic policy uncertainty. They frequently spill over into the economic policy sphere through sanctions, emergency fiscal measures, protectionist reflexes, conflicting monetary policy objectives, or an abrupt reassessment of global capital flows.
Taken together, these factors show that uncertainty at these two levels has risen in a trend-like and structural manner since the late 1990s. Since the chart above is on a logarithmic scale, extreme fluctuations are visually smoothed out. The visible trend should therefore not be viewed as linear but rather exhibits an exponential character.
This trend is confirmed by the annual global military expenditure figures provided by the SIPRI Institute. The year 2024 marked not only the eighth consecutive year of rising military spending but also the sharpest year-over-year increase in military spending on record. Of course, these figures do not yet account for the consequences of the Iran War, which means that further increases in military spending are to be expected.
Global Military Expenditures, yoy, 1988–2024
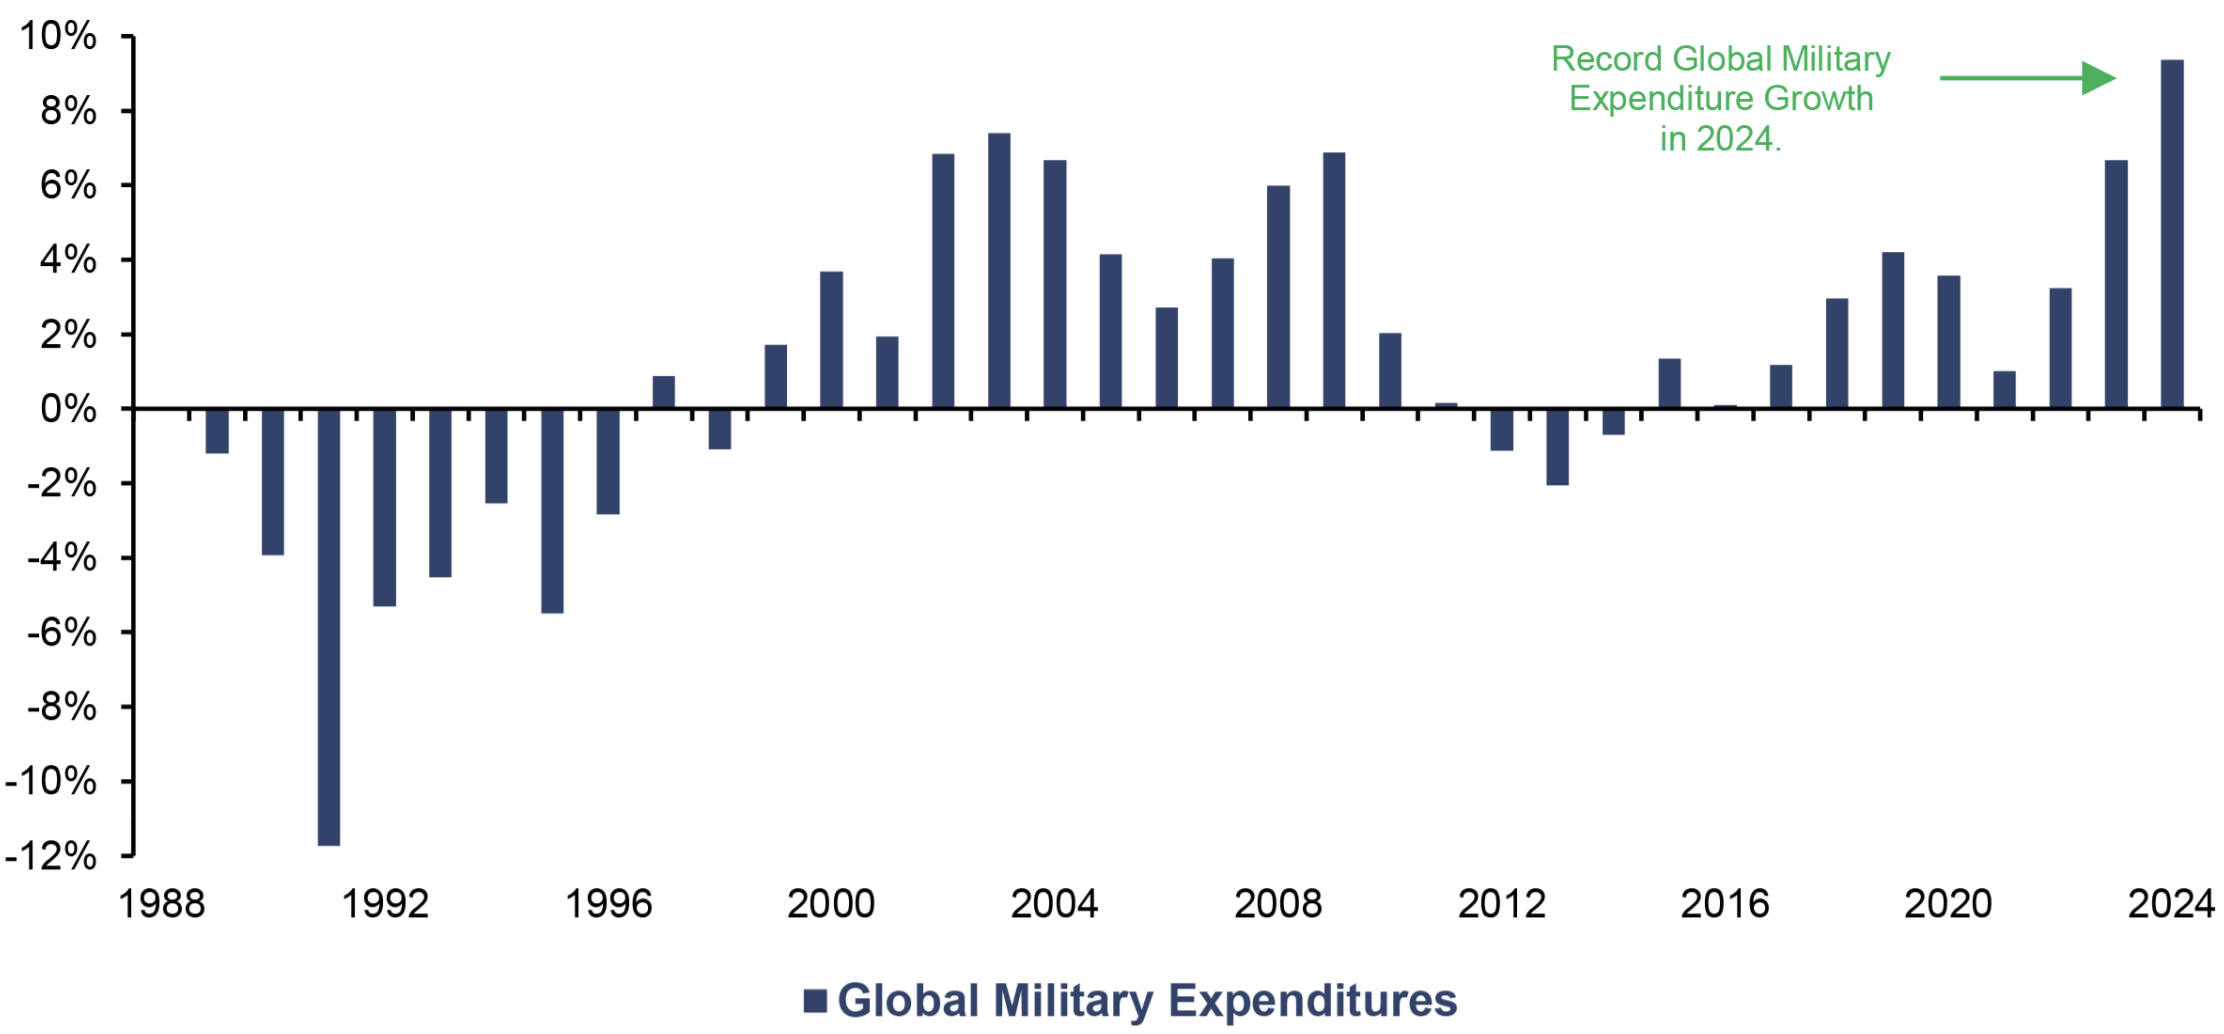
Source: SIPRI, Incrementum AG
For investors, this insight is of central importance. Even though major wars are rare in financial centers, the global economy is virtually constantly shaped by geopolitical flashpoints and risks of escalation. It is precisely this latent uncertainty that must be continuously priced into the bond market. While war is a rare event for individual countries, it represents the macro-financial worst-case scenario when it occurs: a multi-crisis comprising fiscal stress, rising financing costs, increased default risk, inflation, and disruptions to trade and capital flows. Furthermore, geopolitical threats alone can already function as hybrid instruments of economic warfare. This makes the government bond market itself part of the geopolitical playing field. For the traditional understanding of government bonds as a supposedly stable portfolio anchor, this is an uncomfortable but crucial realization.
The gravity of scarcity: gold’s structural advantage in the new macro regime
The eternal duel between gold and bonds remained balanced for so long only because it was fought under exceptionally favorable conditions for bonds. The past forty years were the golden age of disinflation.
The roles of bonds and gold are shifting in a macro regime characterized by high debt, recurring inflation concerns, and geopolitical fragmentation. In such phases, nominal security comes at an increasingly high price: Bonds can stabilize their nominal value but lose purchasing power in real terms. Gold, on the other hand, is not a debtor’s promise but a scarce, liquid real asset without counterparty risk.
According to data from the World Gold Council, above-ground gold reserves amount to approximately 220,000 t, or about USD 31trn, but are growing by only about 1.8% per year. At the same time, the market is large enough to absorb institutional capital flows: The investable gold market comprises approximately USD 14trn, of which about USD 9trn is in bars, coins, ETFs, and OTC holdings of private investors, and about USD 5trn is held by central banks and official institutions. Gold is thus scarce but not illiquid, which is a unique combination. The gravity of this scarcity can be seen in the structural revaluation on the demand side.
ETF, Bar and Coin, and Total Investment Demand, in Tonnes, 2010–2025
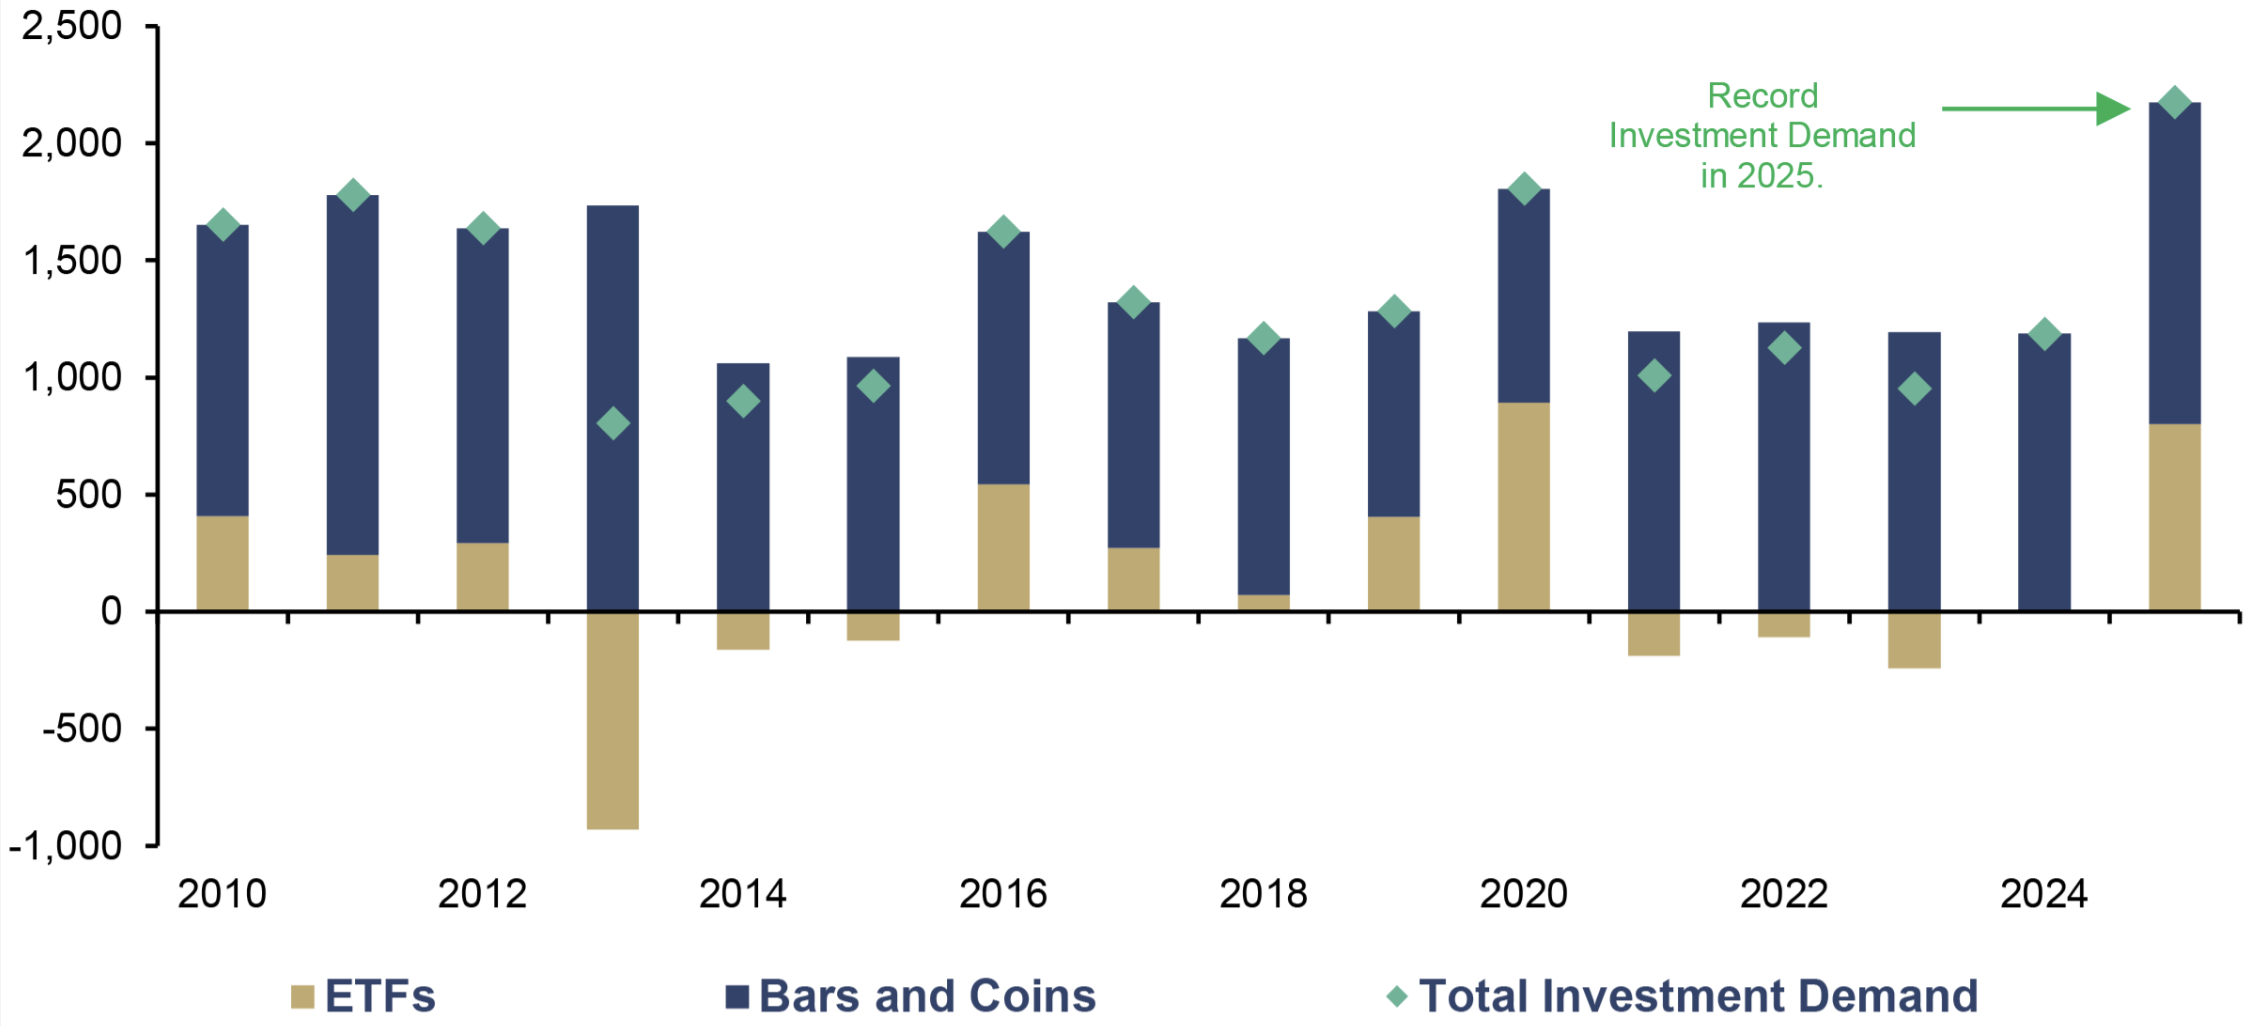
Source: World Gold Council, Incrementum AG
Total investment demand for gold reached 2,175 t in 2025, the highest level in the entire time series since 2010. Of particular note, alongside the fairly constant and inelastic demand for bars and coins, are the renewed ETF inflows of 800 t. This signals that gold is not only in demand among long-term-oriented retail investors but is also making a stronger return to the institutional allocation process. Gold is no longer merely hoarded but is being strategically reallocated and remonetized.
The more debt becomes a systemic limiting factor, the more problematic the bond market itself becomes. Duration is then no longer just a bet on interest rates and a hedge against crises, but implicitly a bet on political credibility, inflation discipline, and the absence of fiscal overreach. This is where the structural appreciation of gold lies. Debt and repression do not mechanically affect the price of gold, but they do affect the desired gold allocation in the system.
It’s All a Matter of Allocation
Gold surpassed the USD 1,000 per ounce mark in 2009, reached USD 1,900 by 2011, consolidated for nearly a decade, and then broke through the USD 2,000 threshold in 2020 and the USD 2,500 threshold in 2024. Each of these milestones was accompanied by a corresponding – albeit often delayed – shift in the way the research community began to think about gold allocations.
What the data shows
As gold rose above USD 1,500 amid sovereign debt fears in the early 2010s, a few voices began recommending more substantial allocations. Sprott recommended 10 to 15%, of which 10% should be in physical gold and up to 5% in gold-related instruments such as mining stocks. Van Vliet and Lohre identified 13% as the allocation at which gold most effectively counteracted downside risks over a ten-year investment horizon.
The failure of the traditional 60/40 portfolio in 2022 accelerated this reassessment. WisdomTree concluded that a gold allocation of 16 to 19% maximizes risk-adjusted returns. A peer-reviewed study by the University of Zurich’s Department of Finance, covering the period from 1972 to 2024, concluded that active rebalancers should hold 15 to 27% in gold. The same study also showed that gold’s market capitalization relative to global equities implies a CAPM-consistent allocation of around 12%, which translates to a model portfolio of approximately 52% equities, 35% bonds, and 12% gold. In contrast, Swiss households held less than 1% of their financial assets in gold in practice.
The In Gold We Trust position
In August 2024, we published an independent quantitative analysis titled “The Optimal Gold Allocation: How Much Gold Does Your Portfolio Need?” The analysis was based on monthly return data from January 1970 to April 2024 for gold, the S&P 500, and 10year US Treasuries. Our research found that a gold allocation of 14% to 18% over this period maximizes the Sharpe ratio in a mixed stock-bond portfolio. Beyond 18%, the Sharpe ratio declined.
Optimal Gold Allocation for Risk-Adjusted Returns Maximization: Gold Allocation (x-axis), and Sharpe Ratio (y-axis), 01/2010–04/2024
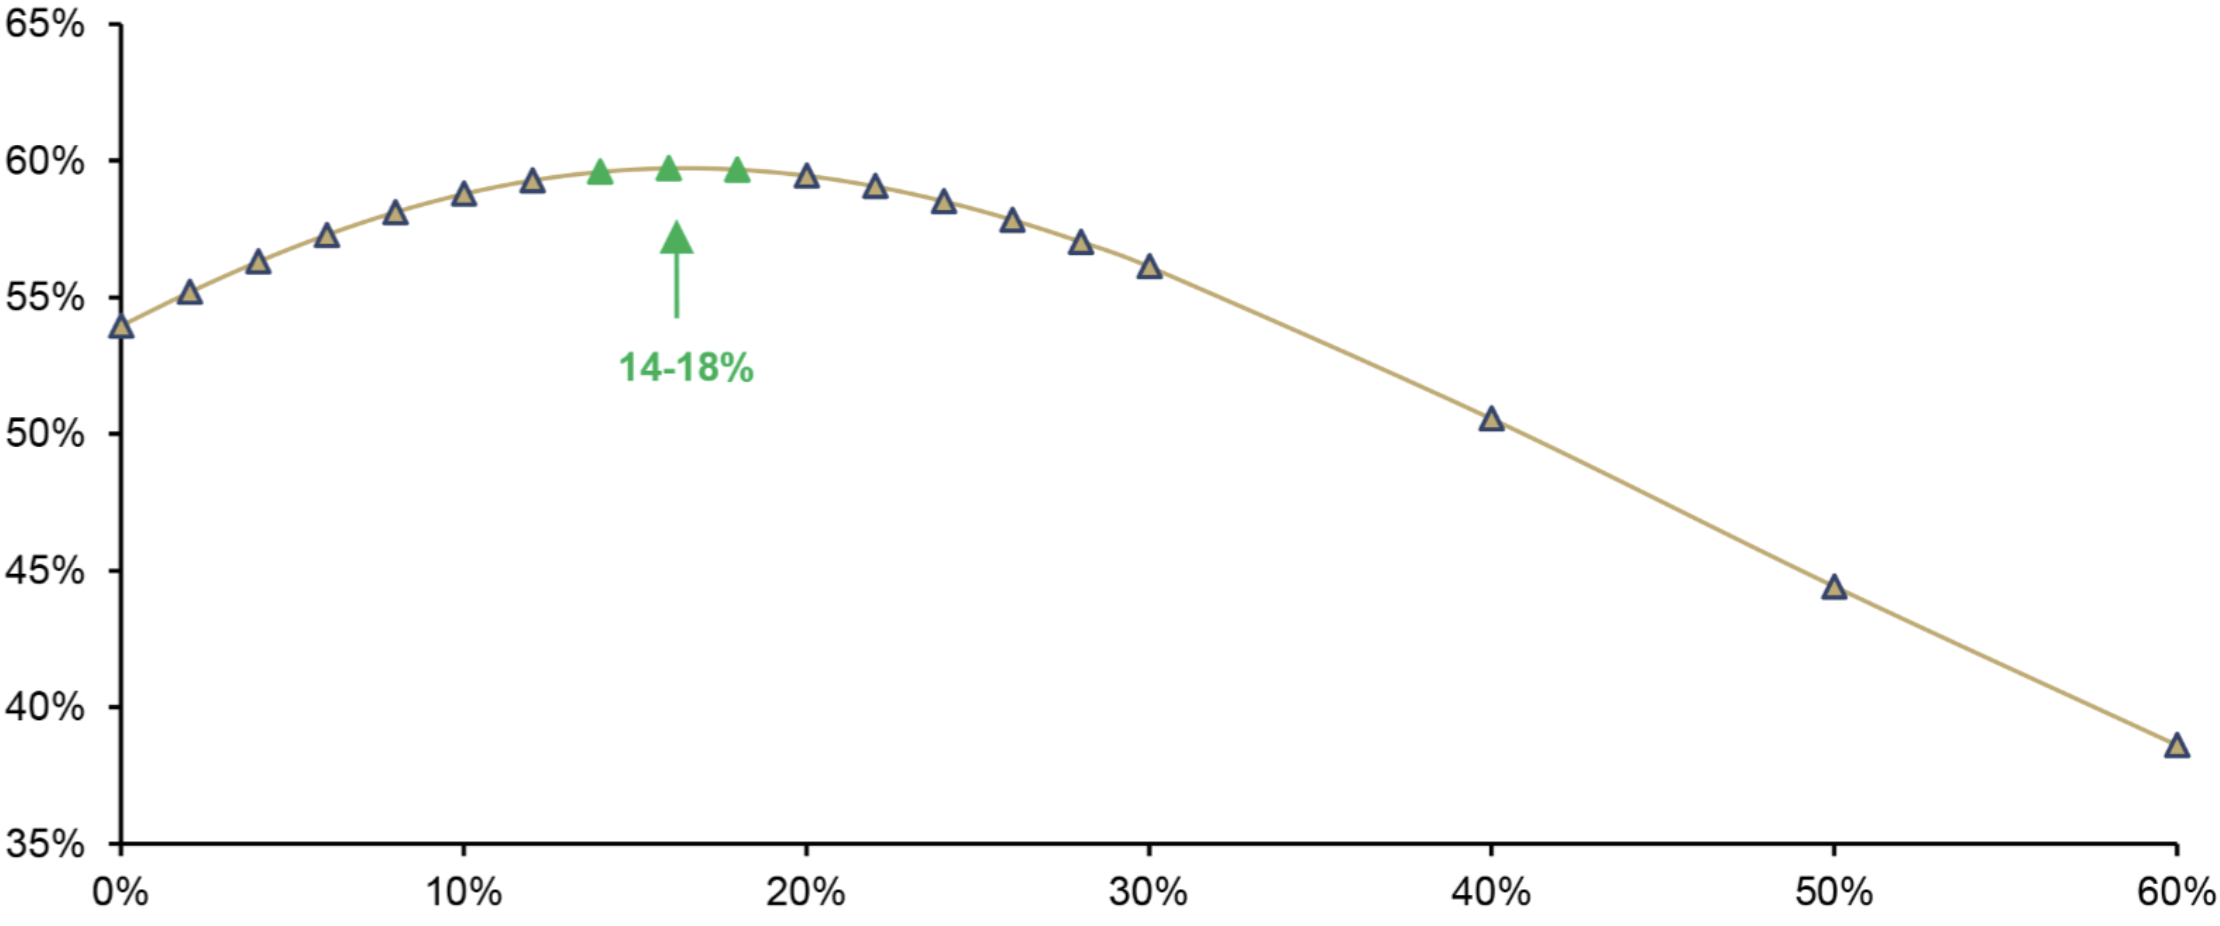
Source: Robert J. Shiller, LSEG, Incrementum AG
At the upper end of the spectrum, a 40% gold allocation did achieve the highest annualized performance in the dataset – namely, 9.75% p.a. – but at the cost of significantly higher volatility and deeper drawdowns. On a risk-adjusted basis, such a high weighting was therefore not recommended. The table below shows performance metrics across various gold weightings and illustrates the trade-off between return, volatility, and drawdown.
Optimal Gold Allocation in an Equity/Bond Portfolio, 1970–2024
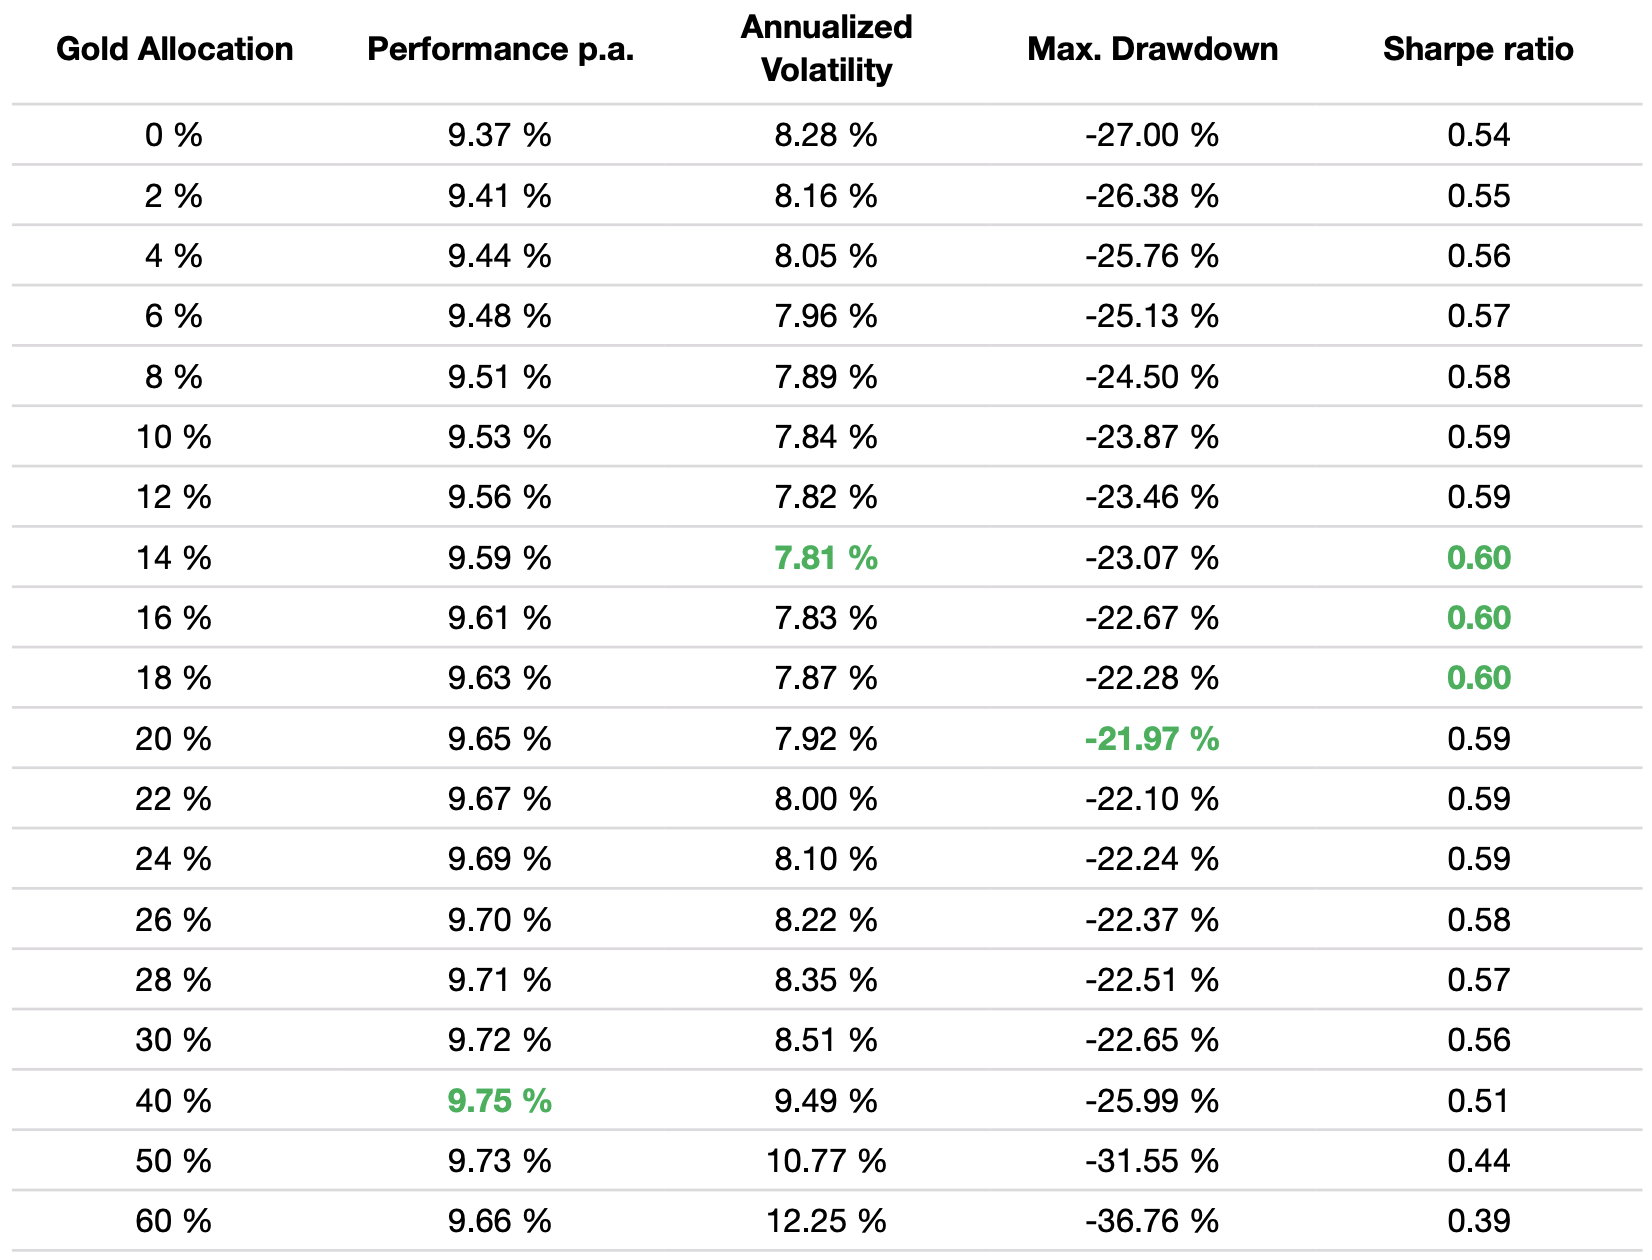
Source: Robert J. Shiller, LSEG, Incrementum AG
At the time of publication in August 2024, however, our recommendation for the market environment at that time – characterized by geopolitical tensions, recession fears, fiscal erosion, and rising debt burdens – was 25%. This was higher than all third-party recommendations cited in the same report. To put this in context: At that time, 71% of US investment advisors held less than 1% in gold, and 75% of the managers surveyed had minimal or no gold exposure; none of them held more than 10%.
Wall Street joins the party
In the fall of 2025, prominent investors began to issue explicit allocation recommendations. Jeffrey Gundlach of DoubleLine recommended 25% and described this weighting as “not excessive.” Michael Hartnett of Bank of America proposed an equal-weighted allocation across stocks, bonds, cash, and gold – 25% each. Ray Dalio recommended 15% as “storehold of wealth” in an environment he compared to the early 1970s. Jamie Dimon, for his part, stated that it was “semi-rational” to hold some gold in the portfolio.
During the same period, Mike Wilson, Chief Investment Officer at Morgan Stanley, proposed a 60/20/20 model: 60% stocks, 20% bonds, and 20% gold. Wilson argued that bonds had lost their status as a safe haven and pointed out that institutional gold allocations, on average, remained at just 0.5% to 2%.
All of this occurred more than a year after we published our analyses on optimal gold allocation and the new 60/40 portfolio. Gundlach’s 25%, Dalio’s 15%, and Morgan Stanley’s 20% all fall within the range we had previously defined for the recommended gold allocation.
Gold allocation by institutional investors
Pension funds
The institutional shift toward gold is not limited to well-known investors and large asset managers. Pension funds – among the most conservative capital allocators of all – are also moving in this direction, and the Swiss pension system offers perhaps the clearest insight into this trend.
According to the consulting firm Complementa, Swiss pension funds that hold gold typically allocate between 3% and 5% of their total assets, while the average across all Swiss pension funds remains close to 1%. Several well-known institutions have built up or expanded their gold positions in recent years. Publica, the Swiss federal pension fund with assets of CHF 42.5bn, increased its gold allocation in 2024 from 2.6% to 3.5%, with approximately 80% held physically and 20% via swaps. PKBS, the pension fund of the City of Basel, and compenswiss are each aiming for a gold allocation of 3%.
The World Gold Council’s August 2024 study on Swiss pension funds provides a useful quantitative context: A 5% allocation to gold reduces the required reserve ratio for Swiss pension funds from 14.8% to 13.8%, while expected returns remain largely stable. The case for gold is not about chasing performance. It is about structural resilience.
Even beyond Switzerland, sentiment among institutional investors is shifting in the same direction. A survey by NTree International of 150 European institutional investors found that 67% intend to increase their commodity allocation, with gold being by far the preferred commodity category at 73%. State Street’s 2025 analysis of public pension funds documents that the share of alternative investments rose from 11% of assets in 2008 to 23% in 2024 – a trend reflecting a broader institutional willingness to move beyond traditional equity and bond portfolios.
However, the most significant structural development may take place in India. In December 2025, the Indian Pension Fund Regulatory and Development Authority published new investment guidelines allowing National Pension System funds, for the first time, to invest up to 5% of their assets in gold and silver ETFs. With the NPS’s assets under management totaling around INR 16trn by the end of 2025 – equivalent to approximately USD 170bn – even a moderate allocation represents a significant new channel of institutional demand.
Family offices
The picture for family offices mirrors the data on pension funds in one key respect: The gap between articulated macroeconomic concerns and actual gold allocations remains wide. However, it is beginning to close.
The Goldman Sachs 2025 Family Office Investment Insights Report, which surveys 245 family offices with an average net worth of at least USD 1bn, shows that commodity allocations have remained stable at 1% since 2023. Geopolitical conflicts ranked as the greatest investment risk, cited by 61% of respondents. Gold appears in the report primarily as a hedge against tail risks; some family offices increased their allocations to gold and other real assets as part of geographic diversification. The overall picture, however, is one of stability rather than a broader reallocation.
The UBS Global Family Office Report 2025, based on 317 family offices with an average net worth of USD 2.7bn, shows that gold and precious metals account for an average of 2% of portfolios worldwide – up from 1% in 2023. Even more notable is that 21% of family offices stated they intend to increase their precious metals allocation significantly or moderately over the next five years – the highest planned increase across all asset classes in the survey. The head of portfolio strategy at UBS also emphasized that the average gold allocation of 2% is expected to rise further over the course of 2025.
The WisdomTree 2025 European Investor Survey, which included 802 participants, found that gold is perceived as the most important safe haven: 41% of respondents cited it as their preferred store of value – ahead of Bitcoin and the US dollar. Participants’ average gold allocation stood at 5.7%, a figure that, according to the study, matched holdings in developed-market government bonds.
The JPMorgan 2026 Global Family Office Report, which covers 333 single family offices from 30 countries with an average net worth of USD 1.6bn, highlights the central paradox: Inflation ranks among the top investment concerns, yet capital is flowing more into macro hedge funds and infrastructure than into gold. 72% of the family offices surveyed in this study held no gold at all; among those that did hold gold, the average allocation was just 0.9%. The concern is there. In most cases, the corresponding allocation response is not yet.
Another survey confirms this pattern. The RBC and Campden Wealth 2025 North America Family Office Report, which covers 317 family offices with combined assets of USD 285bn, shows that inflation is among the respondents’ top concerns, yet gold is still not cited as a preferred response tool. 48% stated they wanted to improve their liquidity, and 33% were actively reducing risk, while capital continued to flow into AI, defense, and the “Magnificent Seven.”
When the trajectory of allocation slowly shifts
By early 2025, gold had surpassed the USD 3,000 per ounce mark and was hitting new all-time highs with a frequency last seen during the bull market of the 1970s. Geopolitics ranks as the number one investment risk worldwide, and yet gold holdings among private investors remain at a modest level.
The shift among institutional investors, while slow, is nonetheless visible. BlackRock positions gold in its 2026 investment outlook as a key diversifier alongside hedge funds and private markets, noting that traditional diversifiers such as long-term US Treasuries no longer provide the same portfolio buffer as they once did. Goldman Sachs has raised its price target for gold to USD 5,400 by the end of 2026, up from USD 4,900 in January 2026.
Michael Widmer, Head of Metals Research at Bank of America, forecasts an average gold price of USD 4,538 for 2026 and a breach of USD 5,000 during the course of the year. He emphasized that both central banks and institutional portfolios benefit from greater diversification into gold. Citi raised its short-term target to USD 5,000, citing heightened geopolitical risks, shortages in the physical market, and renewed uncertainty regarding the Federal Reserve’s independence. JPMorgan, UBS, and Deutsche Bank have raised their price targets for 2026 to USD 6,300, USD 6,200, and USD 6,000 per ounce, respectively.
Central banks were ahead of pension funds, family offices, and many private investors in this reassessment, as data from the World Gold Council shows. In 2025, they purchased 863 t of gold, and a record 43% of central banks plan to further increase their reserves over the next twelve months – up from 29% in 2024. Meanwhile, 95% of central banks expect the share of gold in global reserves to continue rising over the next five years – compared to 81% in 2024 and 52% in 2021. Total gold demand exceeded the 5,000-tonne threshold for the first time in recorded history in 2025. It thus reached a value of USD 555bn, representing a 45% increase over the previous year.
Every percentage point between what the evidence suggests and what portfolios actually hold is capital that is still on its way. Gold is not returning to the mainstream – in our view, it never left. The question is not whether portfolios will catch up. The question is when.
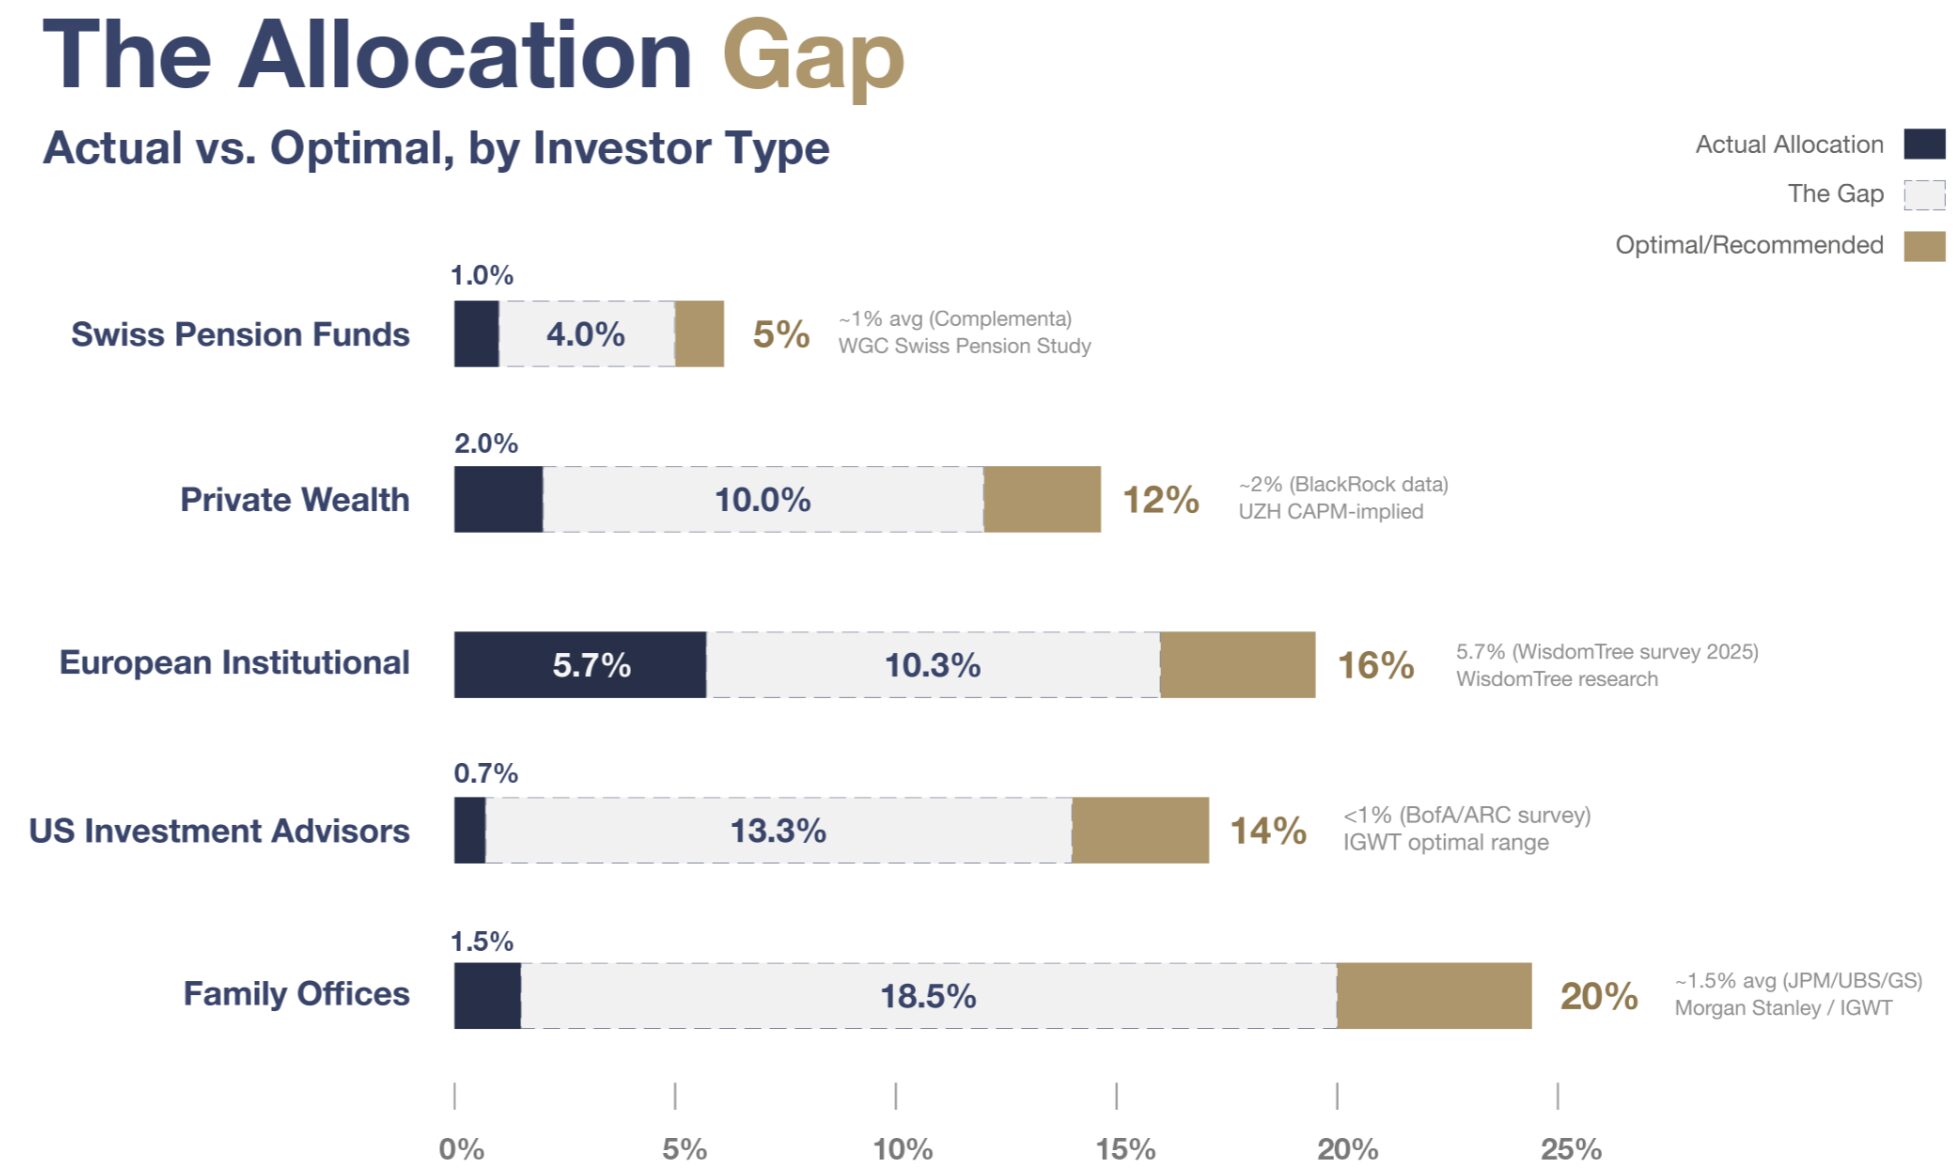
Source: Optimal: IGWT Special (Aug 2024); Morgan Stanley Wilson (Oct 2025); WGC Swiss Pension Study (Aug 2024); WisdomTree research; UZH Hens & Amstein (Jan 2025). Actual: JPMorgan 2026 FO Report; UBS GFO 2025; Goldman Sachs FO 2025; Complementa; WisdomTree European Investor Survey 2025. Chart by: MiningVisuals, Incrementum AG
IGWT Gold Allocation 2045 Model
A serious 20-year outlook does not require exact point forecasts for gold prices or returns. It requires driving forces robust enough to shift the probability weights of different scenarios. Anyone who, 20 years ago, in the first In Gold We Trust report, looked at the pure mathematics of debt, the geology of gold mining, or the demographics of the West, was not surprised by reality but rather confirmed.
On the occasion of our 20th anniversary – marking our transition out of adolescence – we venture a 20-year projection. At its core is the question of what proportion of global liquid assets could plausibly be allocated to gold by the end of 2045 – and what scale of gold market capitalization and gold price this would result in.
Our IGWT Gold Allocation 2045 Model is based on a deliberately simple equation:
Gold price = Global liquid assets × Target allocation / Investment gold holdings
This formula clearly separates three levels. Global liquid assets define the potential capital pool. Investment gold holdings define the physical supply base. The target allocation is the decisive macroeconomic variable. It is influenced by the driving forces shaping the new macroeconomic regime and is a function of demographics, GDP growth, debt, geopolitics, war economies, currency fragmentation, and de-dollarization.
The inertial factors behind the gold allocation
For target allocation, we distinguish between factors with high, medium, and low inertia. Some trends resemble a heavy ocean liner: Even when slamming on the brakes, it continues moving straight ahead for miles. These include demographics, gold geology, and debt dynamics. Other developments resemble tankers: They can change course but only slowly. These include shifts in GDP power, de-dollarization, and geopolitical tensions. Finally, there are speedboats – political and technological shifts such as AI or the development of CBDCs – that can turn more quickly, but whose direction is more open-ended.
For a 20-year model, ocean liners and tankers are particularly decisive. They do not determine tomorrow’s gold price, but they shift the probability that the share of gold in global liquid assets will be higher in the future than it is today.
Demographics and GDP growth
The demographic and economic landscape of the coming decades points to a structural shift in global growth drivers. The following chart illustrates this macroeconomic divergence over the past decade. Between 2015 and 2025, GDP per capita in emerging markets grew at a 10-year CAGR of around 5.0%, while the population increased by 0.7% per year. In developed economies, by contrast, GDP per capita growth stood at just 1.5%, with population growth at 0.4%. Emerging markets thus not only grew faster but also combined income convergence with a continued positive demographic contribution.
10-Year-CAGR of GDP per Capita, and Population in Developed and Emerging Markets, 2015–2025
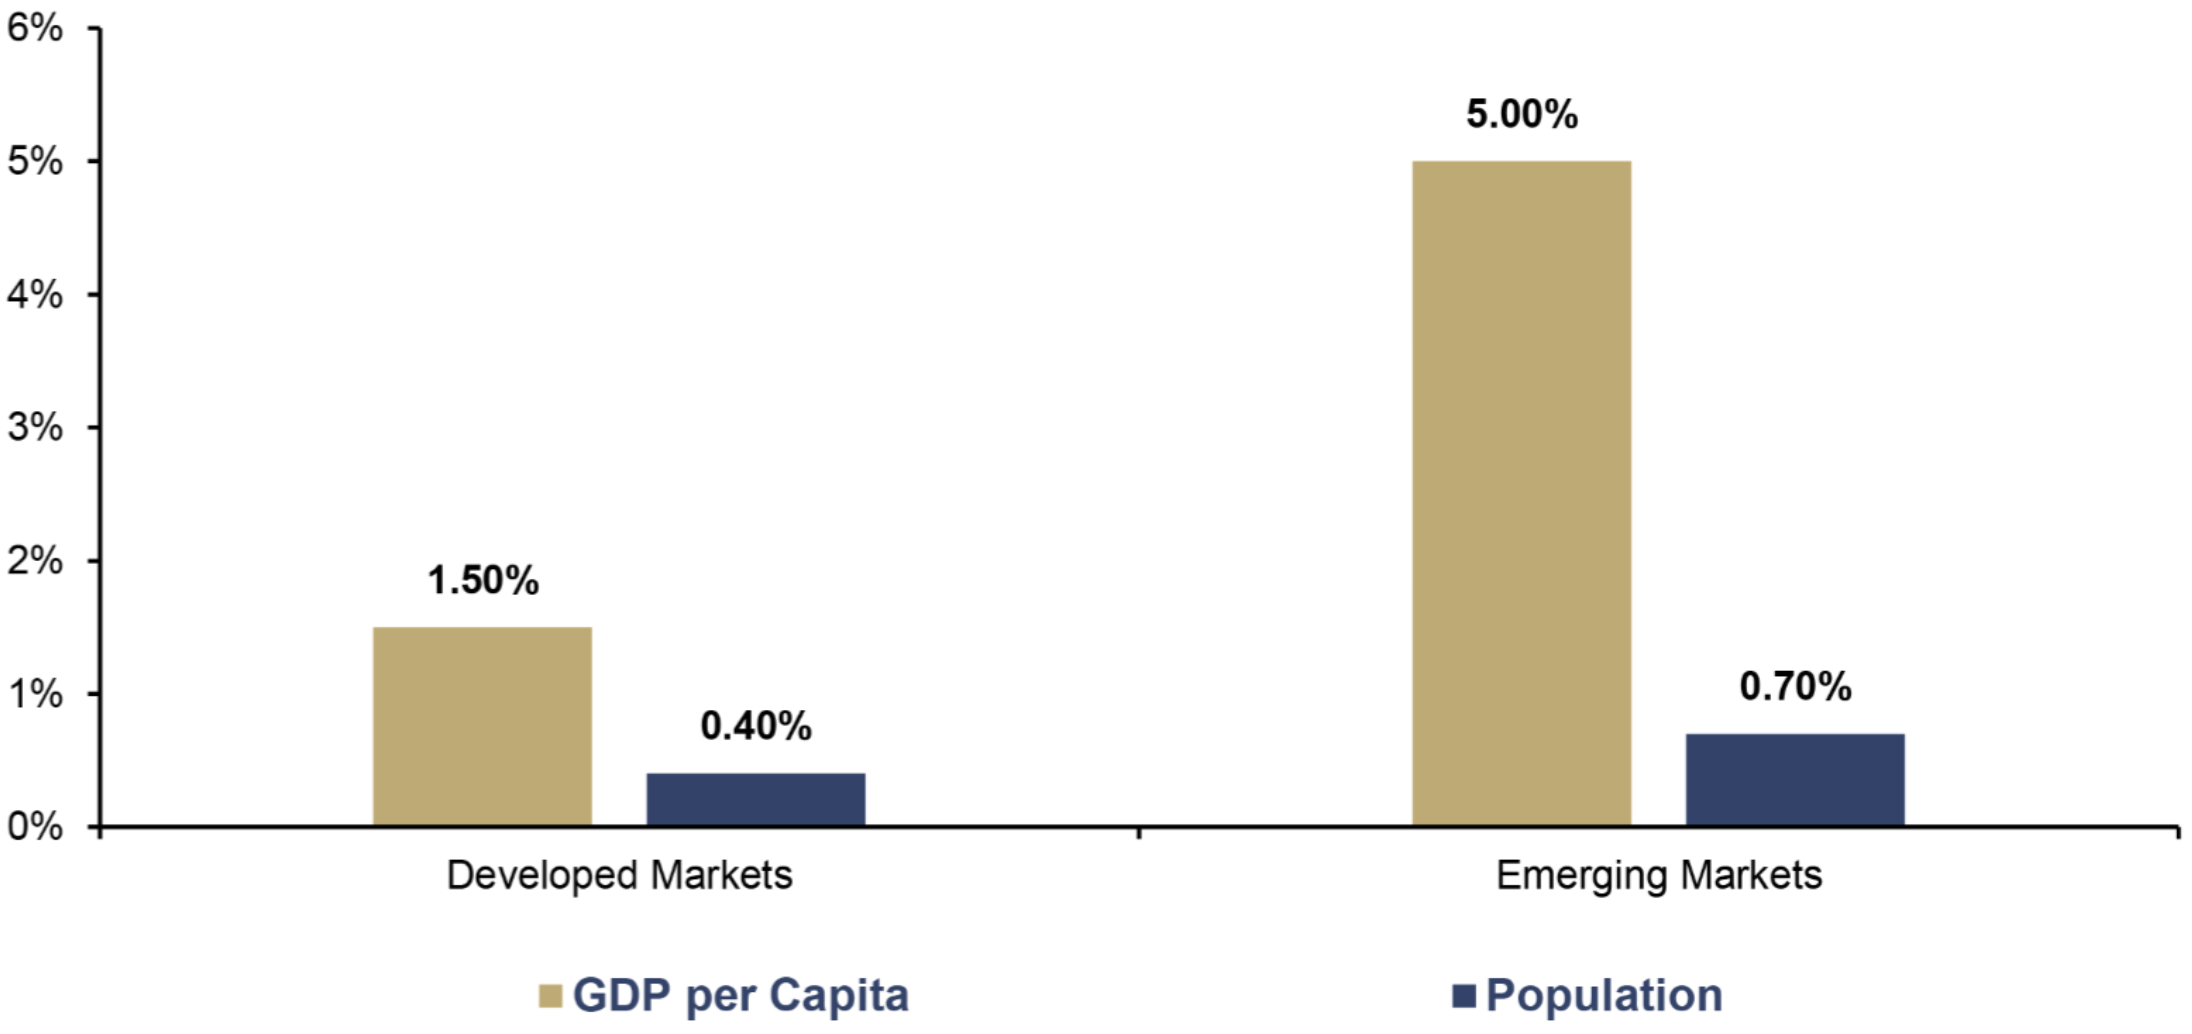
Source: worldeconomics.com, Incrementum AG
The second chart extends this logic through 2050. In PwC’s projections on long-term growth drivers, emerging markets clearly dominate among the countries with the highest expected real GDP growth rates. It is particularly striking that growth is often fueled by two sources: on the one hand, positive population dynamics, and on the other, rising real GDP per capita.
At the same time, PwC expects negative population growth by 2050 for some industrialized nations such as Japan and Germany — shifting the demographic average age from an open-air rave to an opera premiere. This widens the macroeconomic gap not only between growth and stagnation, but between demographic expansion and demographic burden.
Projected Real GDP Growth Composition at PPP until 2050
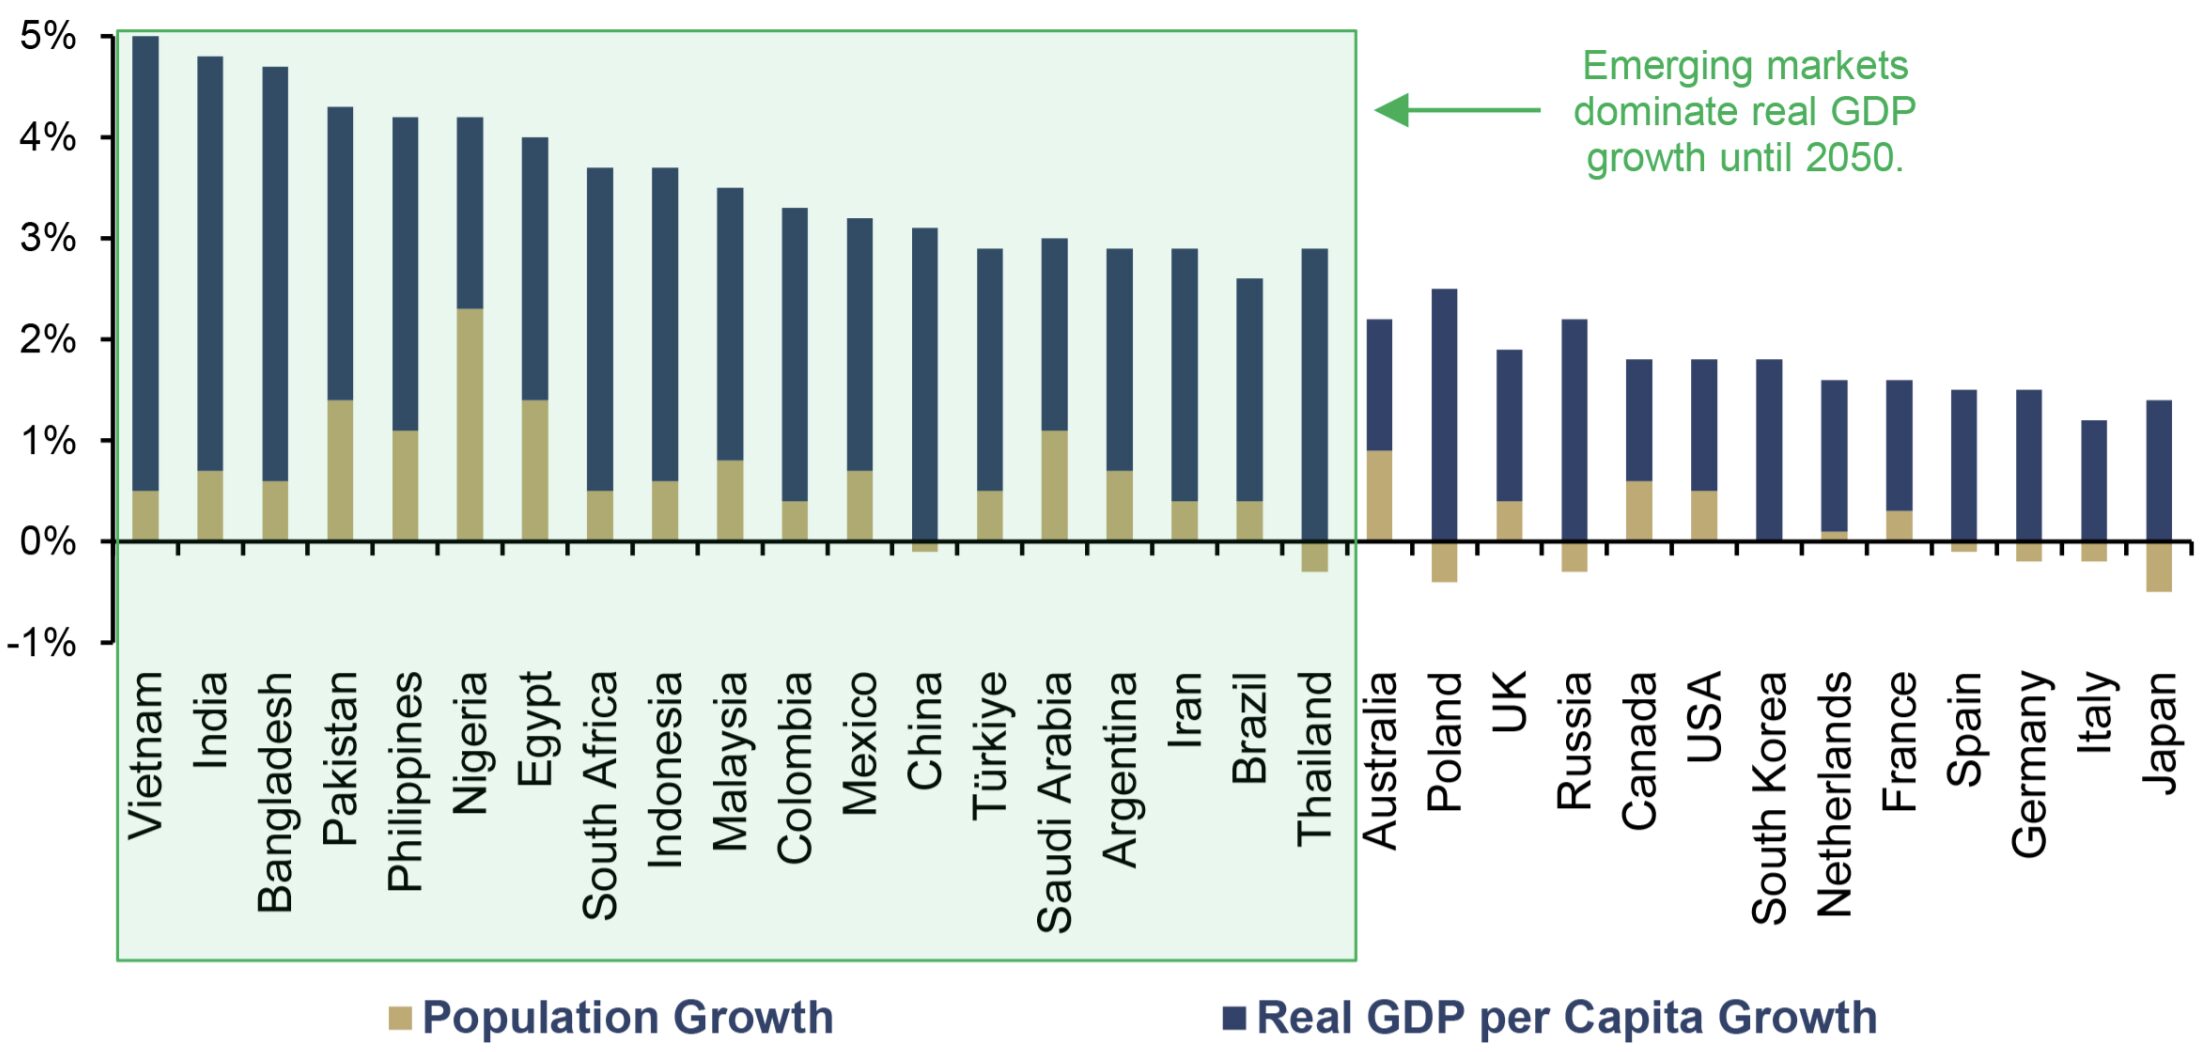
Source: PwC, Incrementum AG
The implications for gold run in two directions. On the one hand, aging populations in industrialized nations increase structural spending pressures on government budgets. Pensions, healthcare, and long-term care are becoming permanent fiscal burdens. On the other hand, the population and purchasing power tend to grow more strongly in regions where gold traditionally plays a greater role as a private store of value. Demographics and economic growth thus affect the gold allocation not only through debt and government spending but also through the long-term private demand base.
Debt and deficits
A second trend with high inertia is the debt trajectory. According to the Congressional Budget Office, the US debt-to-GDP ratio will continue to rise from its current level of 123.1% toward 160% of GDP by the end of 2045, while the budget deficit is projected to increase from its current level of around 5.8% to about 7.6% of GDP. Financing costs are also moving in a problematic direction. Interest costs of around 3.3% in 2026 will rise to about 5.6% by the end of 2045.
US Total Debt (lhs), and US Budget Balance (rhs), as a % of GDP, 1970–2045
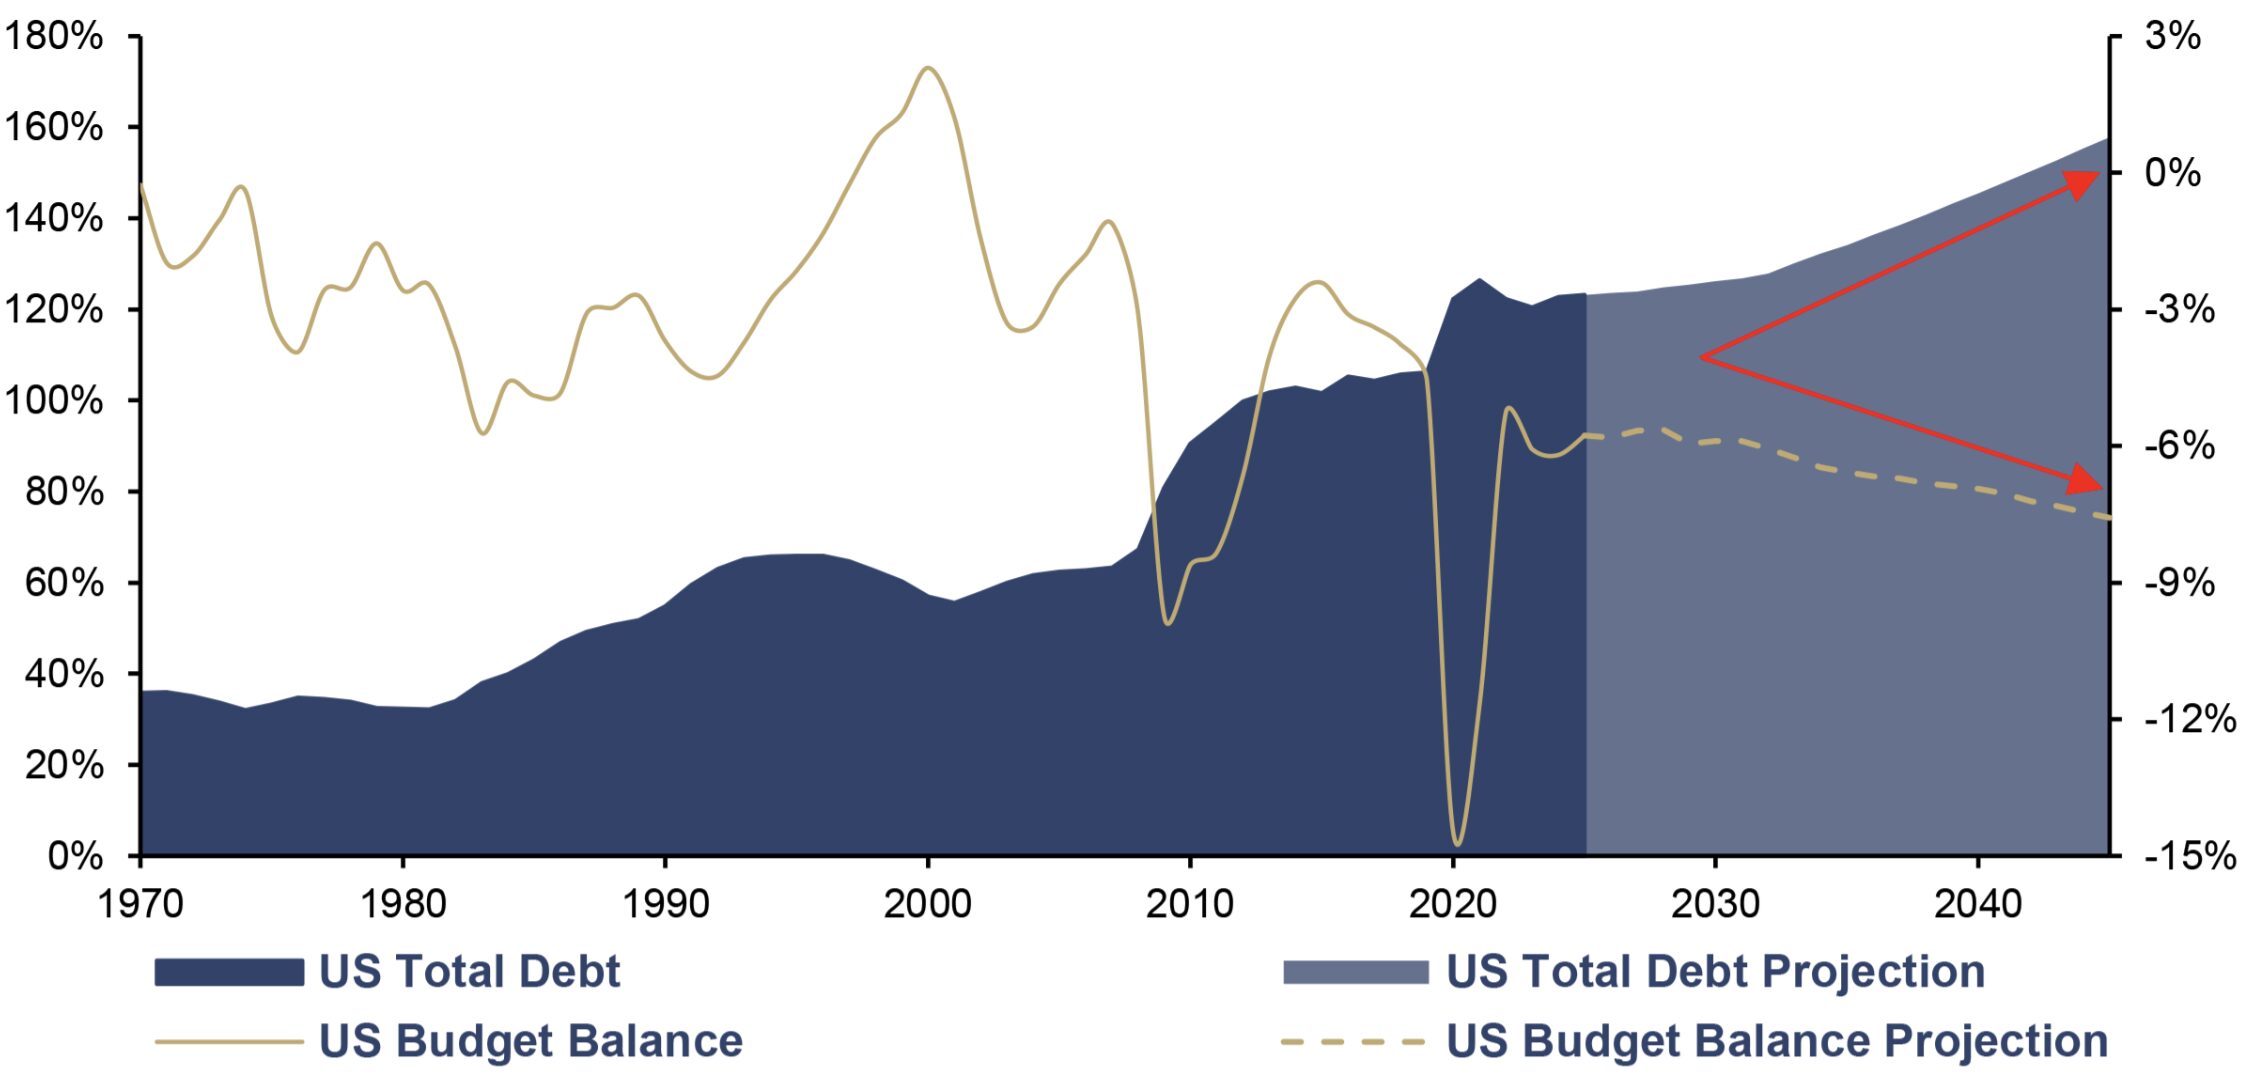
Source: CBO, LSEG, Incrementum AG
However, this development is not a purely American phenomenon. According to the IMF, global debt stood at around USD 251trn in 2024, or slightly above 235% of global GDP. This shifts the role of government bonds. They remain the government’s primary refinancing instrument but lose some of their status as a nonpolitical portfolio anchor. This is a positive development for the gold allocation, because the more debt sustainability depends on negative or capped real interest rates, the higher the strategic value of an asset that does not represent a claim against a debtor.
Geopolitics and war economy
Due to geopolitical escalation and the return of military deterrence to the center of Western security policy, NATO members agreed at the summit in The Hague in June 2025 to spend 5% of GDP annually on core defense requirements, as well as defence- and security-related spending, by 2035. The US is already at a high level, while the remaining NATO countries would have to catch up significantly to reach the targeted 5% goal by 2035. This would require an annualized growth rate in defense spending of around 8.7% for the remaining NATO countries. For the US, it would be around 3.6%.
Defense Expenditures of the USA and the Rest of NATO, as a % of GDP, 2014–2035
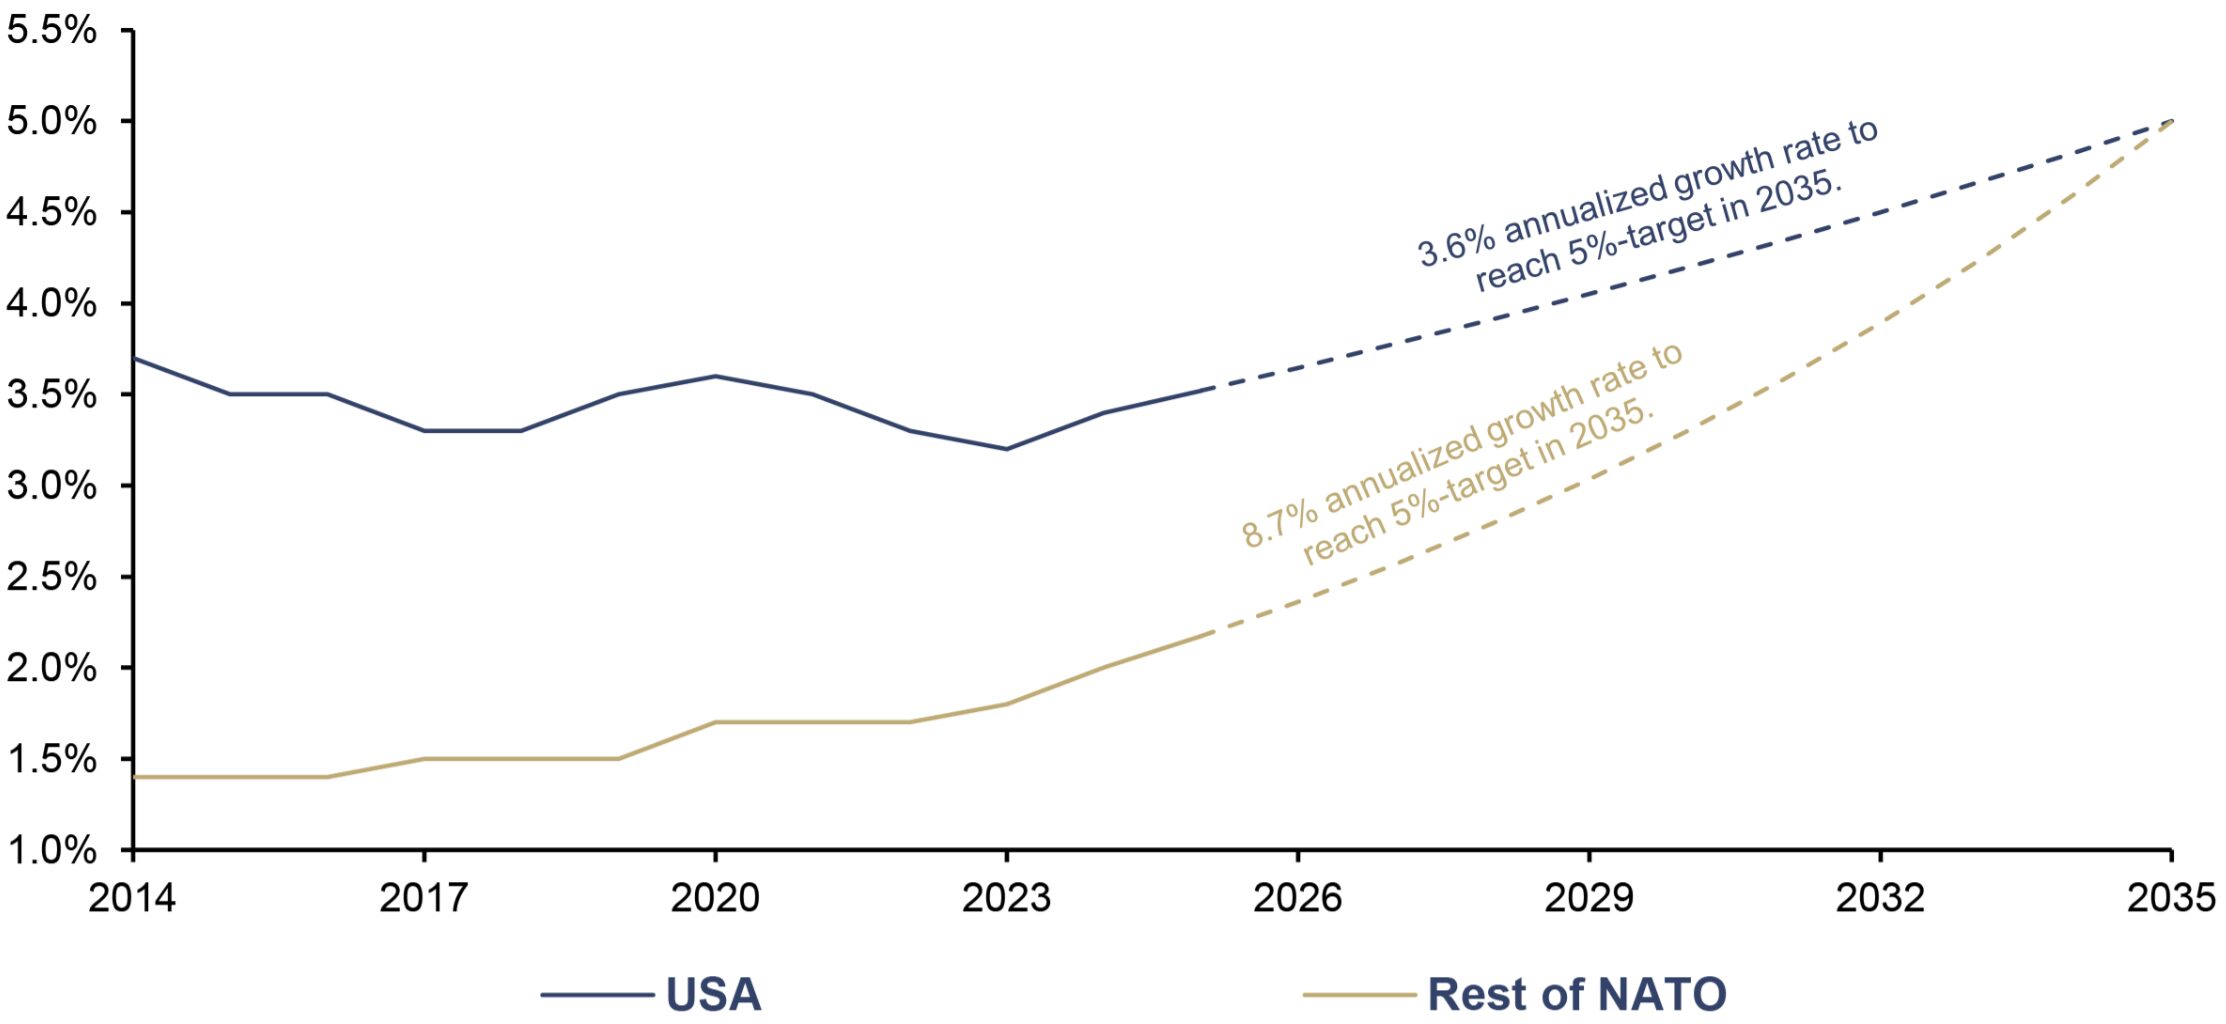
Source: NATO, SIPRI, Incrementum AG
Whether the 5% target is met exactly is secondary to the model’s logic. What matters is the overarching trend. Security is becoming fiscally relevant again. A war economy means higher government demand, potential supply and energy price shocks, rising refinancing needs, and a higher risk premium on capital flows. It does not have to escalate first for the financial markets to react. Even geopolitical threats can shift risk premiums, as explained earlier in this chapter. For bonds, this is headwind. For gold, it is a structural demand driver that points to a rising gold allocation.
Reserve fragmentation and de-dollarization
Reserve fragmentation and de-dollarization are no longer merely theoretical debates but are visible in central bank balance sheets. The US dollar remains the dominant reserve asset, yet its exclusivity is waning.
For instance, the share of US bonds held by foreign central banks has been declining since the mid-2010s. At the same time, the share of gold in currency reserves is rising significantly. The World Gold Council estimates official gold holdings at the end of 2025 to be just under 39,000 t, or approximately USD 5trn, which corresponds to about 26% of globally allocated reserves.
CB Gold Holdings, as a % of Currency Reserves, and US Debt Held by Foreign CBs, as a % of Total Debt, Q1/1970–Q3/2025
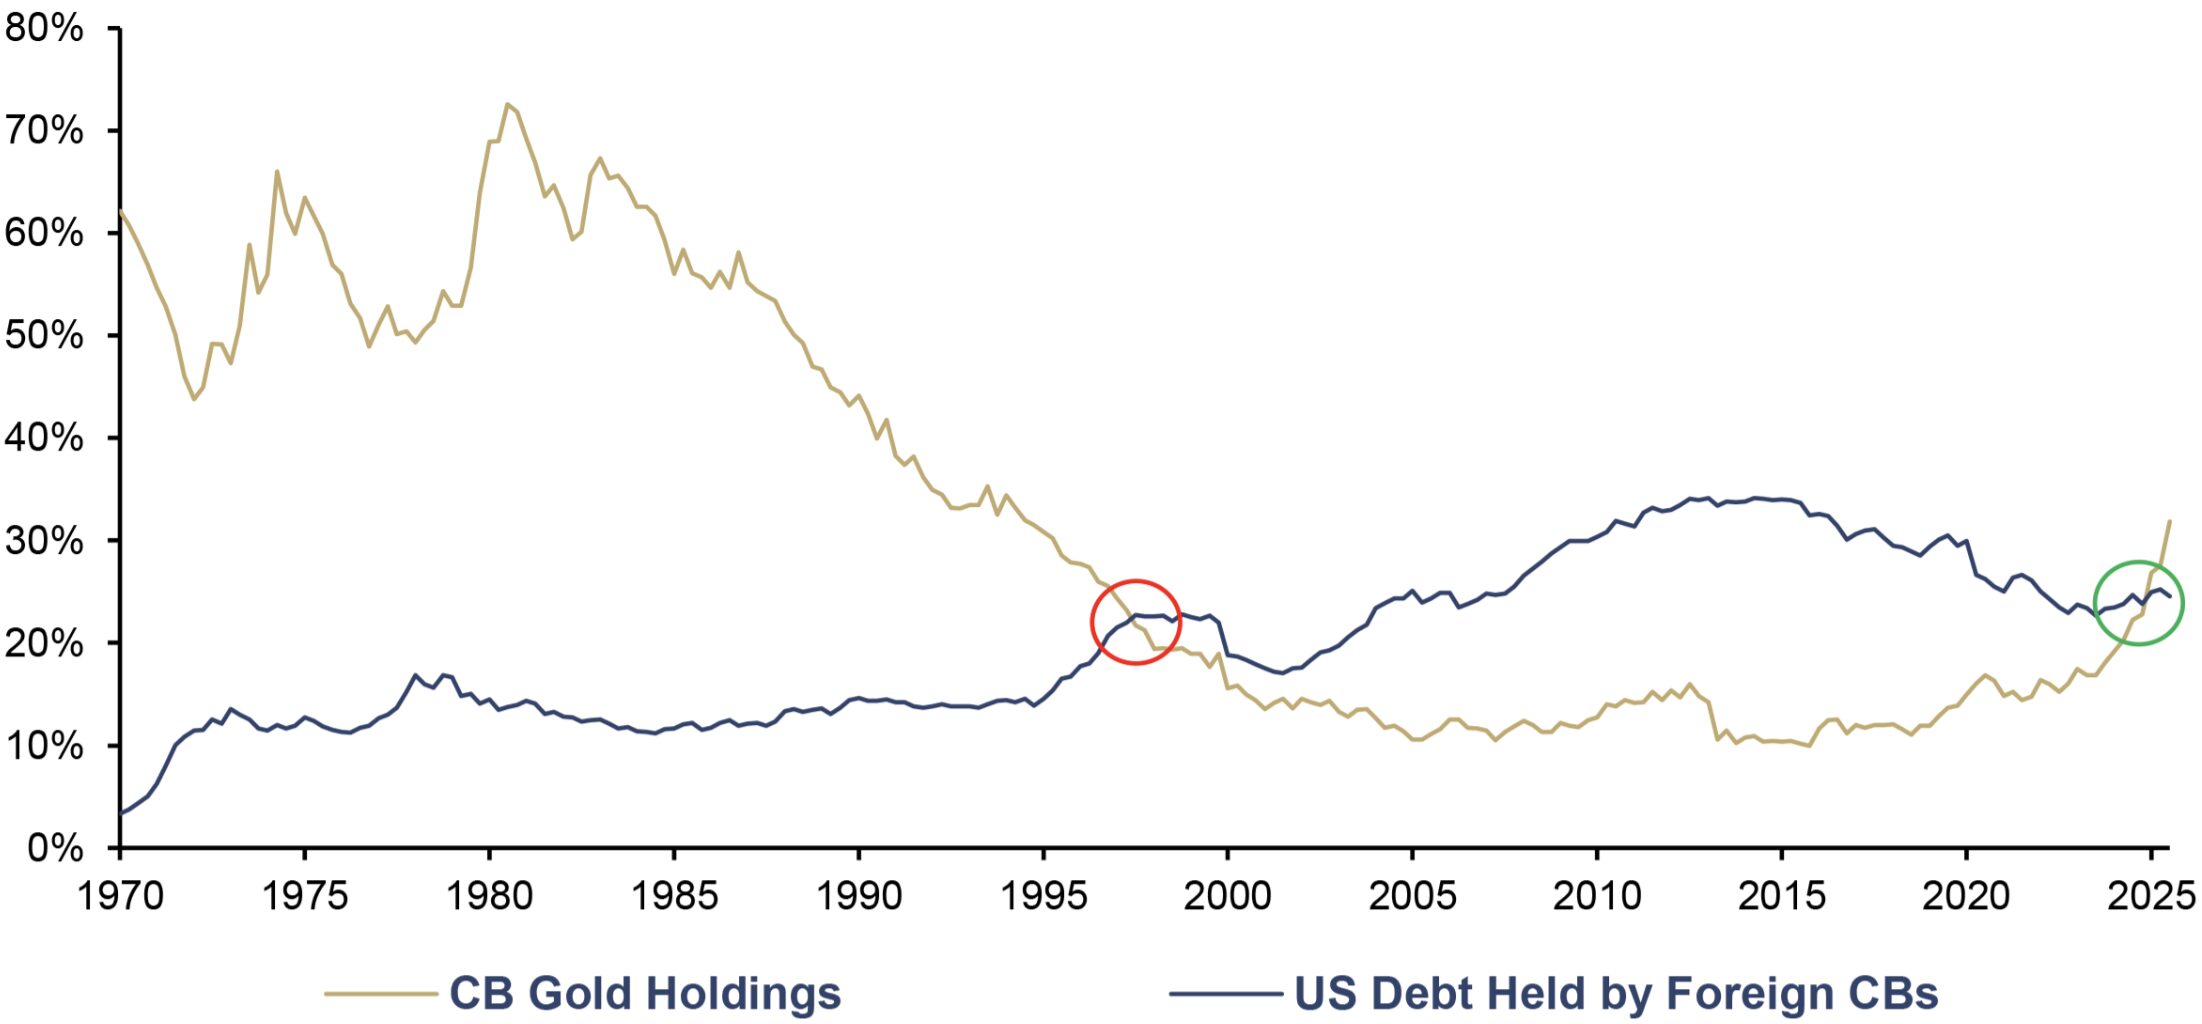
Source: Crescat Capital, Federal Reserve St. Louis, World Gold Council, Incrementum AG
Gold is attractive to central banks in a fragmented world order because it has no issuer, carries no default risk, has no duration, and does not depend on the political reliability of another state. Therefore, the significantly more strategic and slower-moving central bank demand must be interpreted differently than ETF flows or short-term futures positioning.
This development is relevant to our model for two reasons. First, it has a direct, endogenous effect on physical demand for gold via the price channel. According to JPMorgan, an additional annual demand boost of around 600 t from central banks since 2022 has already contributed significantly to the gold price rally. Second, it has an indirect effect via the signaling channel. When official institutions revalue gold as a reserve anchor, this lowers the cognitive barrier for investors to view gold not merely as crisis insurance but as a structural allocation.
The two model variables outside the allocation
The factors described so far primarily affect the target allocation. They answer the question of how high the gold allocation of global liquid assets could be in different macro scenarios.
Two additional variables must be distinguished: investment gold holdings and global liquid assets. They do not determine the gold allocation itself, but rather the price dynamics resulting from a given gold allocation.
Investment gold holdings
The supply side of the model is characterized by physical inertia, as gold is not a freely scalable market. Above-ground gold reserves are growing only slowly. Major new discoveries are becoming rarer, permitting processes are taking longer, production costs are rising, and gold production cannot be expanded at the push of a button.
The average rate of growth in above-ground gold reserves has been 1.8% over the past ten years and around 1.7% since 1900. The geological expansion of the gold supply thus remains stable over very long periods. For the projection through the end of 2045, we therefore assume a constant stock inflation rate of 1.8% per annum, i.e., the pace of the past decade.
Above-Ground Gold (lhs), in Tonnes, and Inflation Rate of Gold (rhs), 1900–2045
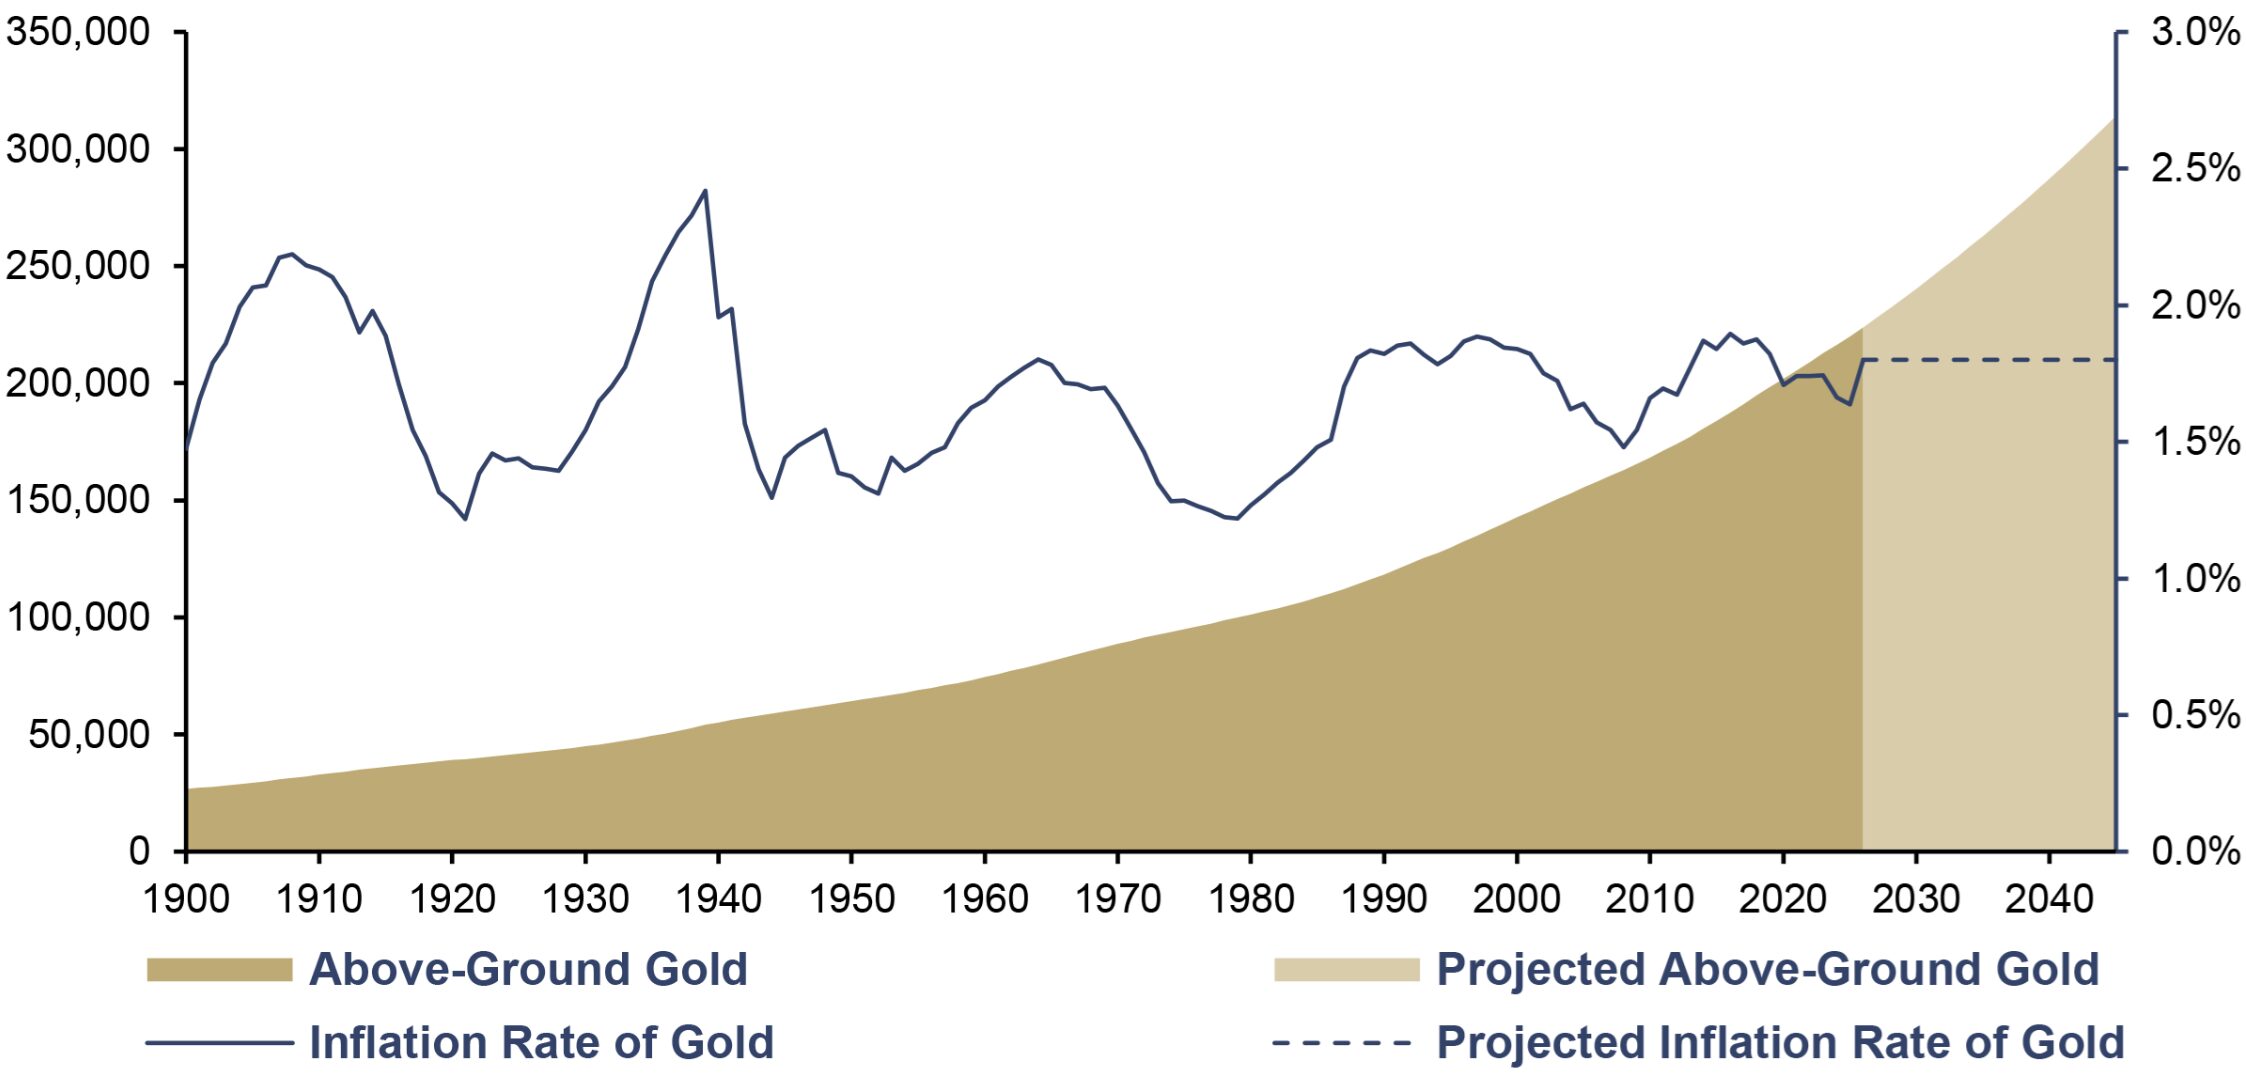
Source: USGS, World Gold Council, Incrementum AG
Based on current reserves of 220,000 t of gold as of the end of 2025, according to the World Gold Council, this results in an additional stock of nearly 100,000 t by the end of 2045. Above-ground gold reserves would thus rise to approximately 314,000 t.
However, for our model calculation, it is not the entire above-ground gold stock that is decisive, but rather the portion held by private and institutional investors. This includes:
- Bars and coins
- Physically backed ETFs
- OTC investment holdings
As of December 2025, 21.4% of the total stock consists of bars and coins, 1.8% of physically backed ETFs, and 4.6% of OTC investment holdings. In total, this amounts to 27.8% of the above-ground gold stock, or approximately 61,000 t of gold, which is currently held by private and institutional investors.
Above-Ground Gold by Use, in Tonnes, 2025
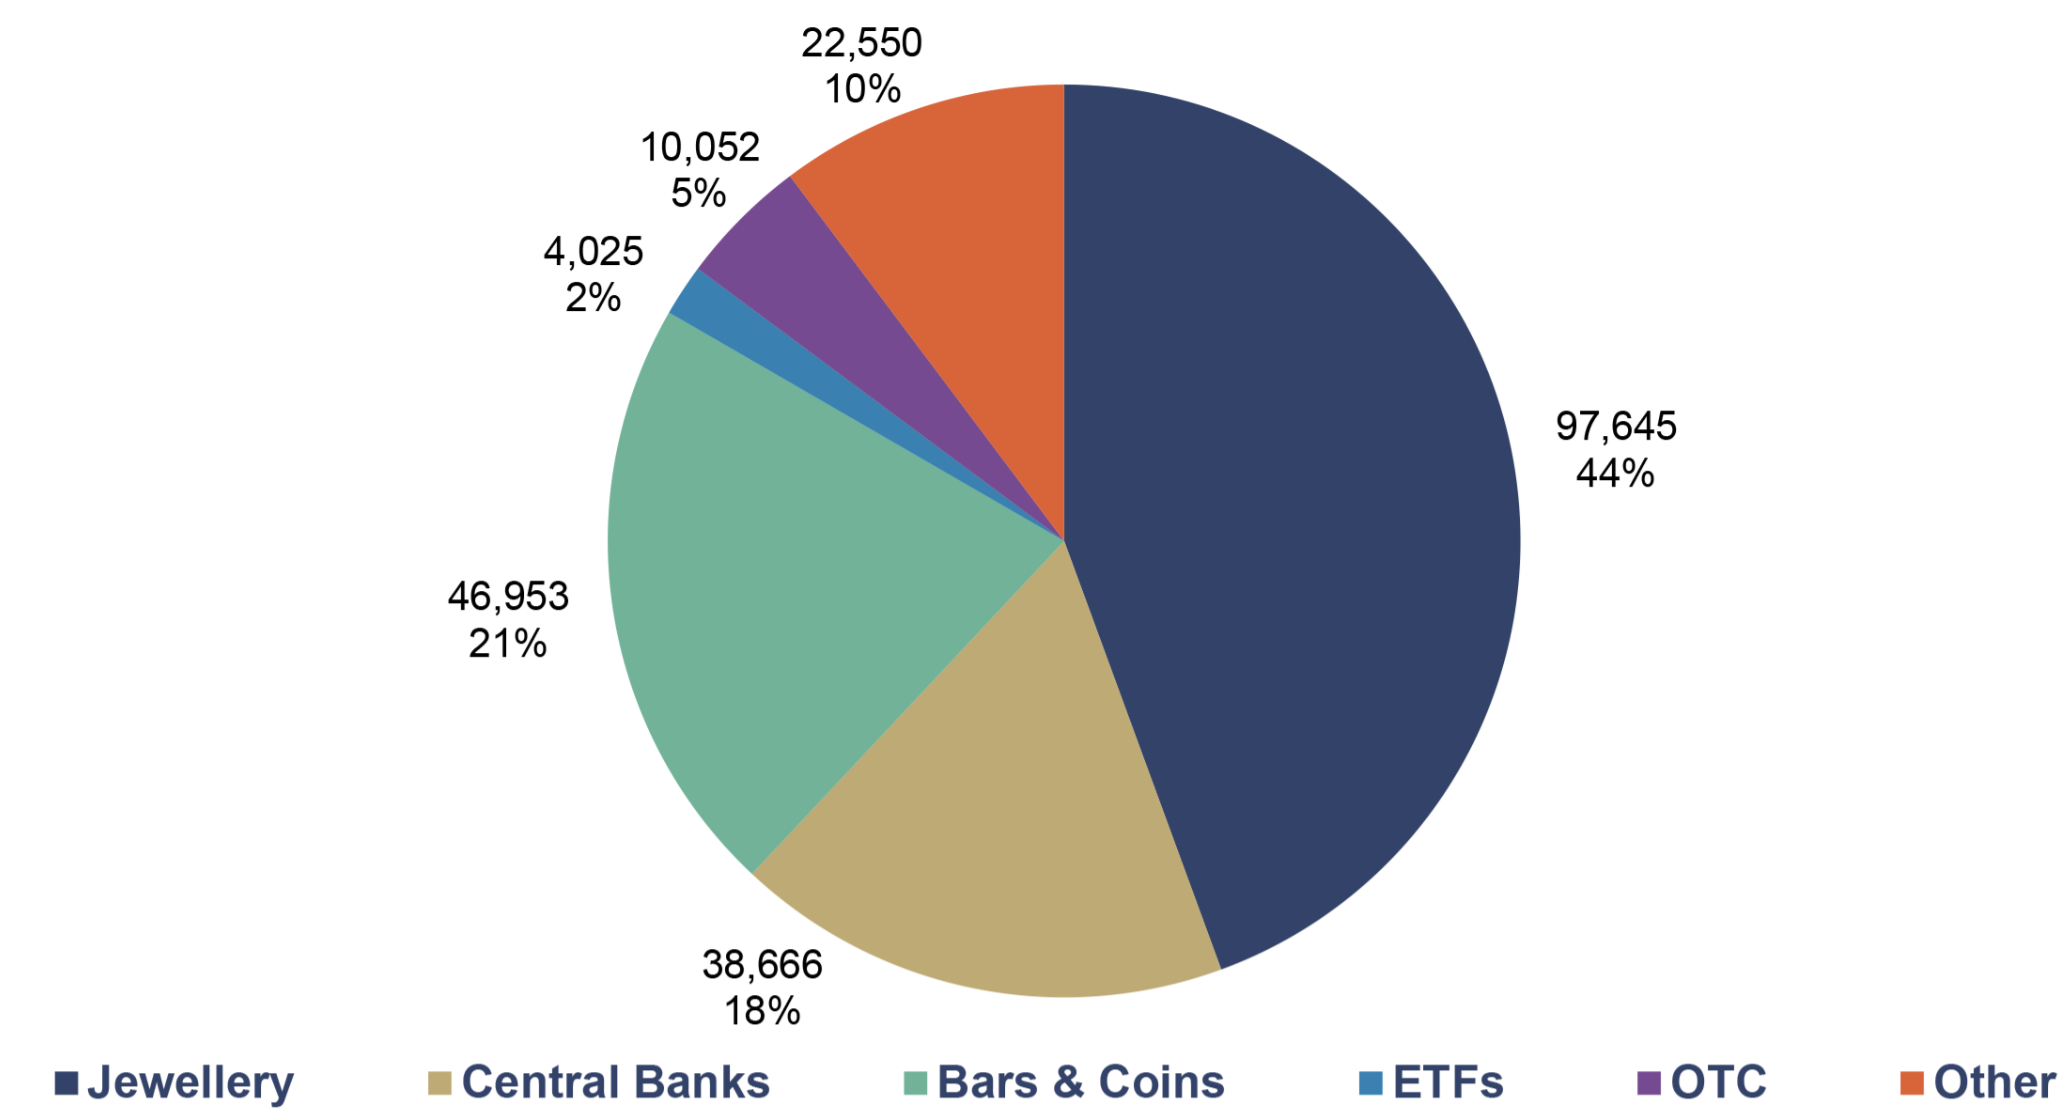
Source: World Gold Council, Incrementum AG
It is striking that this investment share has grown steadily over the past 15 years. Between 2010 and 2025, the share of investment gold rose from 22.2% to 27.8%. This corresponds to an annualized growth rate of 1.5%. Assuming this trend continues through the end of 2045 and an increasing portion of the gold stock shifts into investment-relevant categories, the share of investment gold will rise to around 37.4% by the end of 2045. In this case, investors would hold approximately 118,000 t of gold by 2045 – nearly twice as much as today.
For the sake of model clarity, we deliberately do not take into account possible feedback effects of a higher gold allocation. On the one hand, it would be plausible that a rising gold price or a higher gold allocation in global liquid assets would increase the investment share, as gold is perceived more strongly as a strategic allocation. On the other hand, this relationship is not a clean ceteris paribus effect: Stronger demand from central banks or robust jewelry demand can also influence the distribution of above-ground gold stocks. Historical data also provide no compelling evidence for this. For example, between 2010 and 2015, the share of gold in global liquid assets declined, while the share of investment gold in total gold holdings rose. The shift in holdings toward investment gold thus does not appear to depend exclusively on the short-term gold price or the current share of gold but rather stems from a longer-term remonetization and financialization of gold holdings.
Global Liquid Assets
Global liquid assets constitute the capital pool from which a strategic gold allocation can be drawn. In defining global liquid assets, we follow the World Gold Council’s framework, according to which these assets consist of gold, bonds, equities, and alternative assets. As of the end of 2025, global liquid assets amount to approximately USD 321trn. Within this investment universe, gold has so far played only a marginal role. According to the WGC, gold held by investors accounts for just 2.7%. By contrast, 46.5% is allocated to equities, 44.7% to bonds, and 6.2% to alternative investments.
Composition of Global Liquid Wealth, in USD trn, 2025
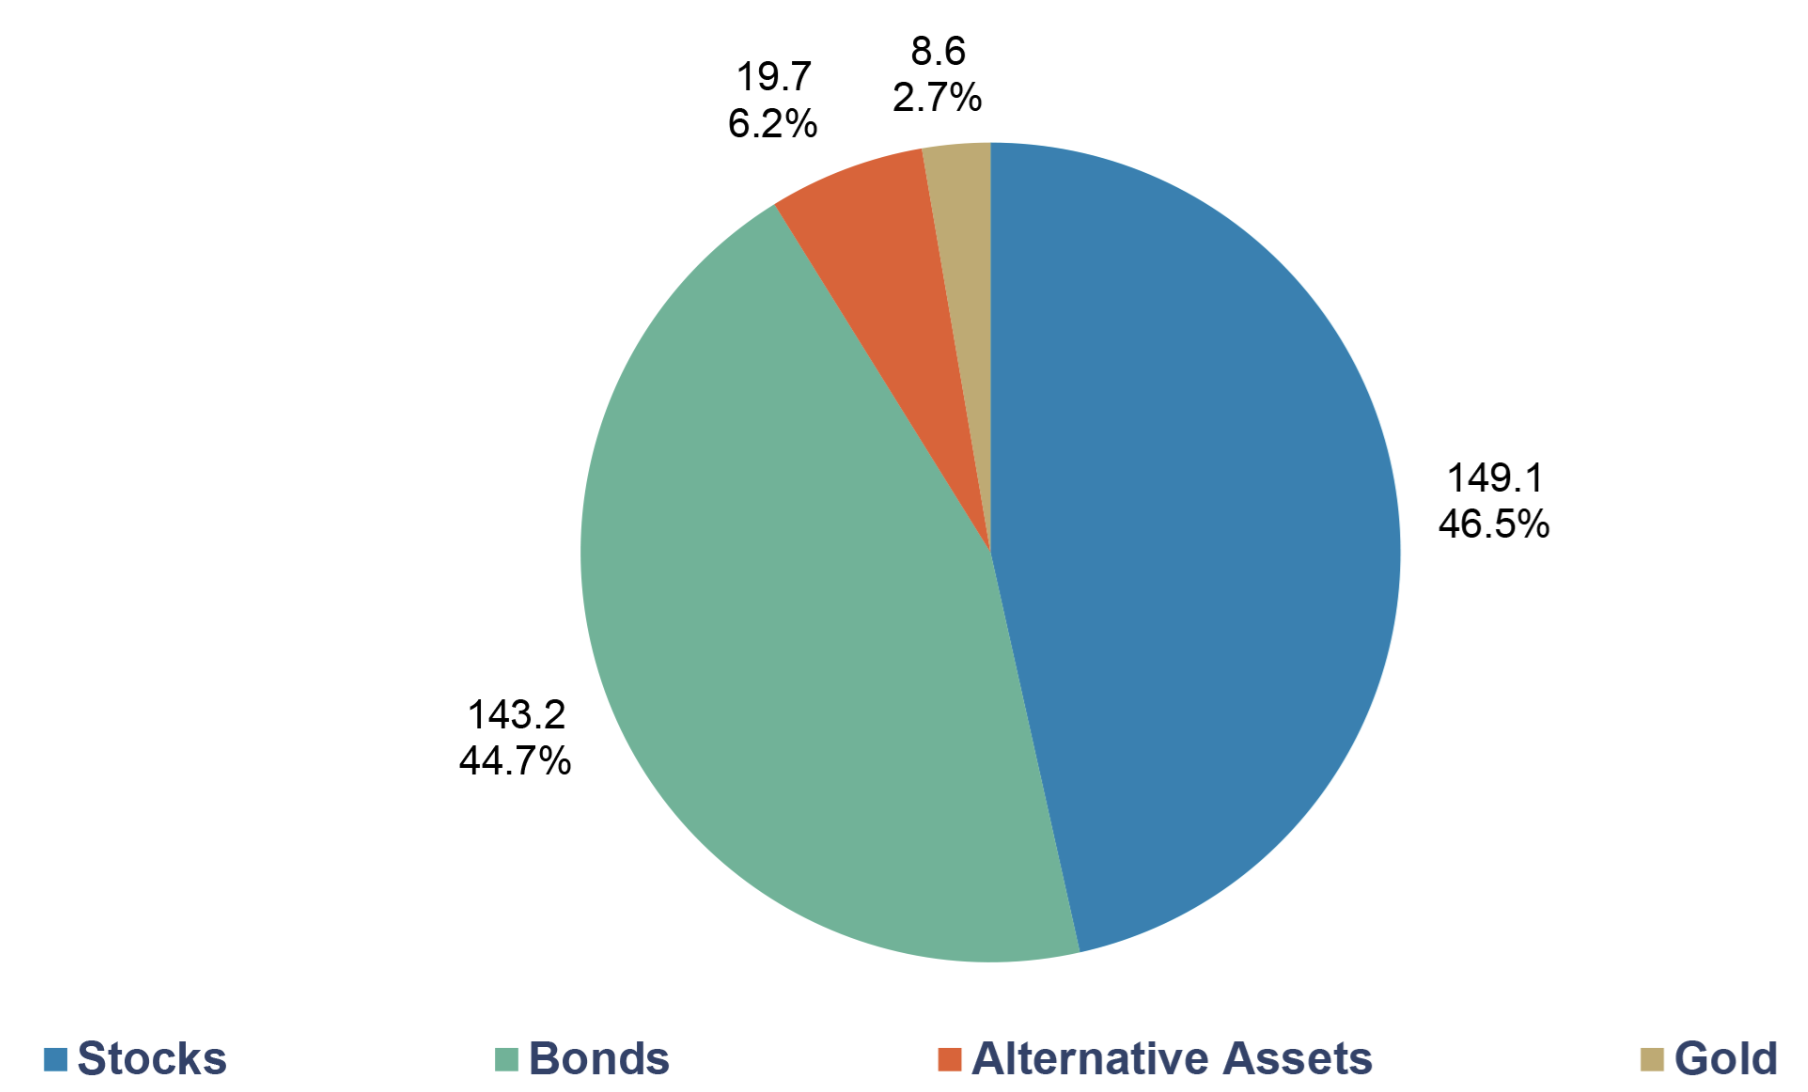
Source: BIS, ICE, Metals Focus, Preqin, SIFMA, WFE, World Gold Council, Incrementum AG
For the projection through the end of 2045, the key variable is naturally the growth of the total asset pool. Ex ante, this cannot be determined with certainty. Historically, there have been repeated phases of significant asset losses, so any projection must remain an assumption. A sober look at long-term trends therefore serves as a suitable starting point for projecting global liquid assets. Between 2004 and 2025, global liquid assets grew at a CAGR of approximately 6.1%. This pace does not appear excessive. By comparison, the CAGR of the global M2 money supply since 2000 has been 6.8%, and that of the US 6.2%. The assumed continuation of the current trend thus falls within a range that is well-grounded in monetary terms.
Global Liquid Wealth, in USD trn, 2004–2045
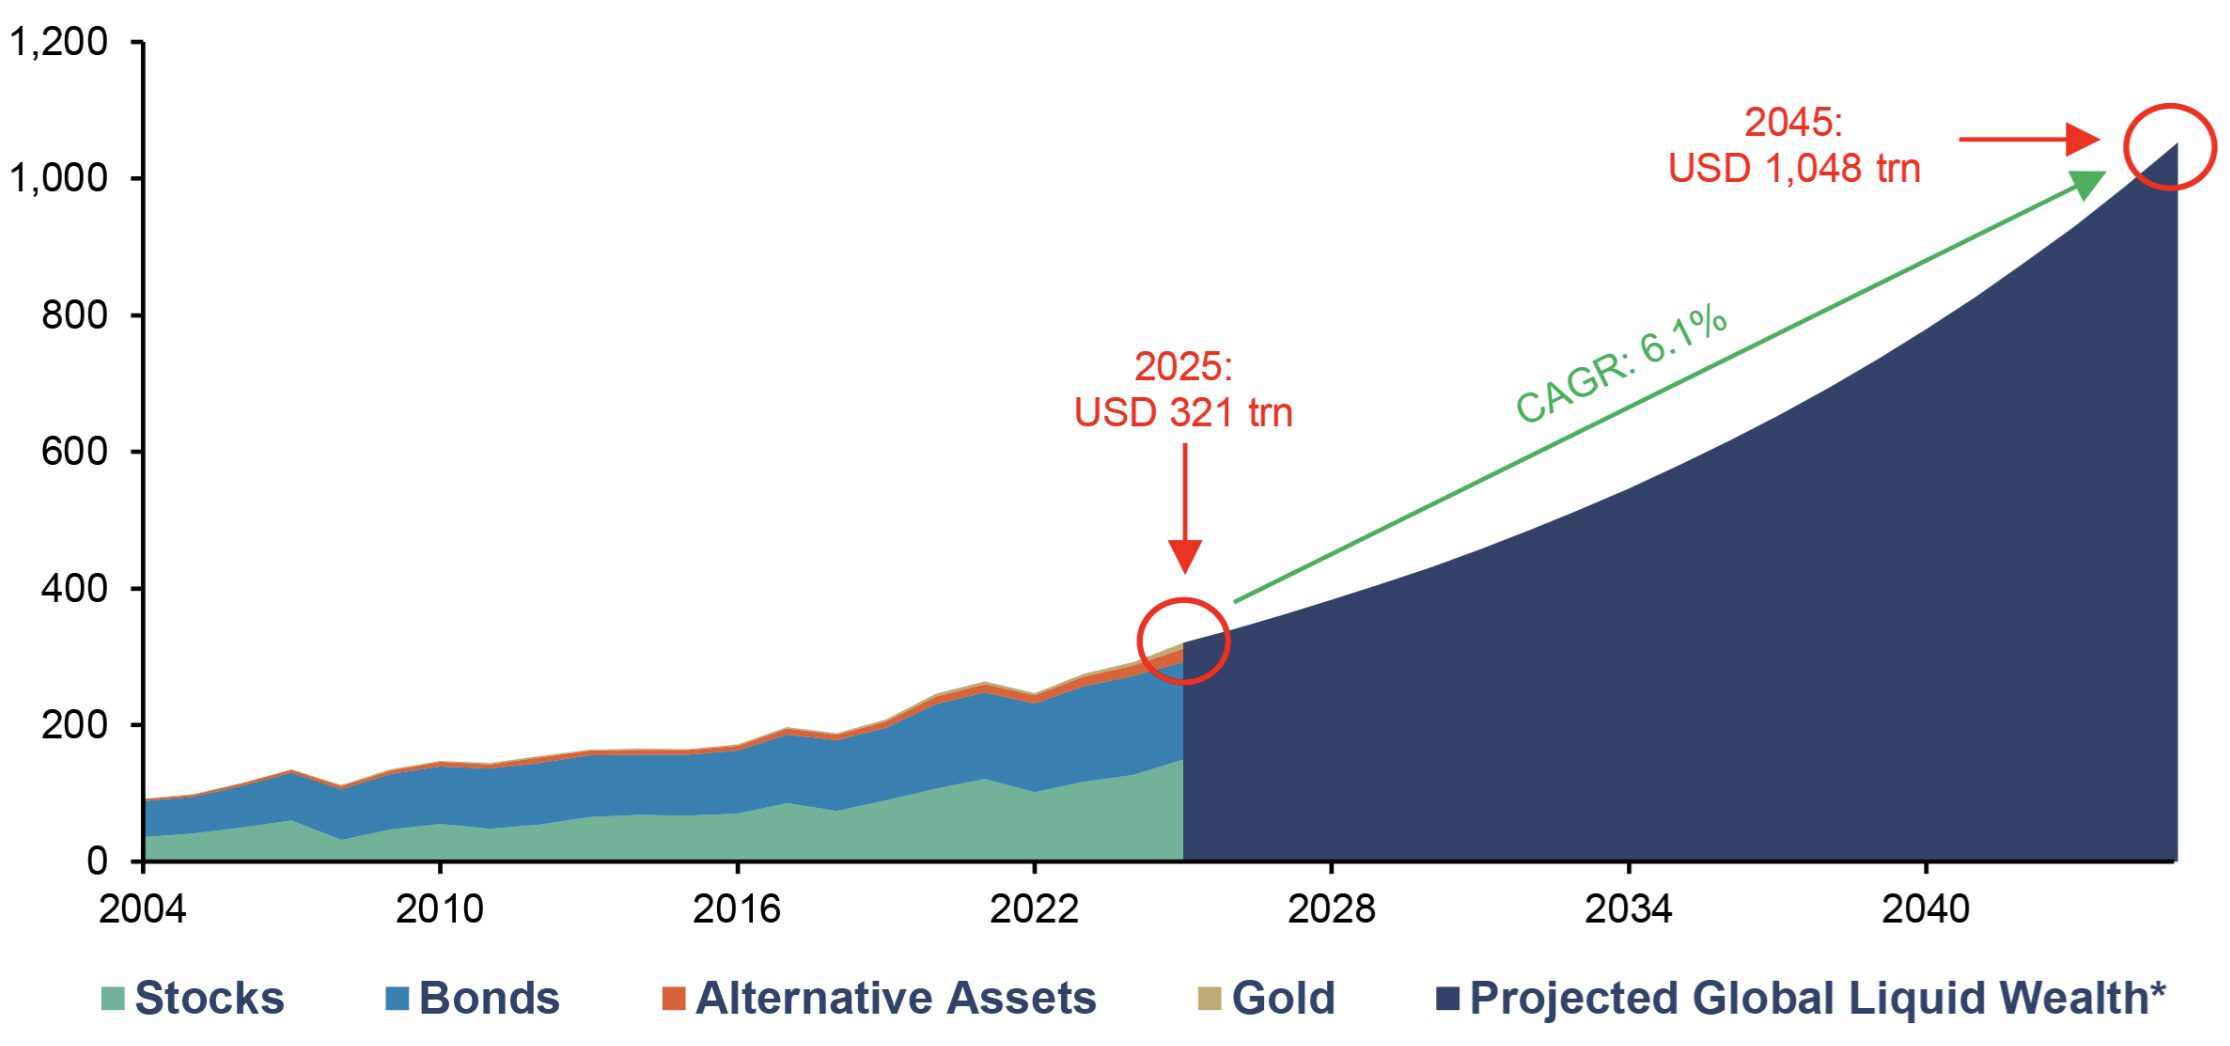
Source: BIS, ICE, LSEG, Metals Focus, Preqin, SIFMA, WFE, World Gold Council, Incrementum AG, *assuming the 2004–2025 CAGR of 6.1%.
Assuming a continued expansion of global liquid assets at 6.1% per year, the investable capital pool would grow to approximately one quadrillion USD by the end of 2045. The absolute magnitude is less critical than the implication this has for gold.
Gold reserves grow predictably – but at a geological pace. That is the key point. Compared to the physical gold supply, which resembles a tasting menu with fixed courses, the global capital pool behaves like an all-you-can-eat buffet where dishes are constantly replenished as soon as plates are empty. As global liquid assets grow, the potential demand base expands. If the target allocation to gold increases at the same time, this effect is amplified.
The key point is not that large portions of these assets would need to be shifted into gold. Even small percentage shifts in allocation can trigger significant price effects in a scarce monetary asset. JPMorgan notes that foreign investors hold approximately USD 57trn in US financial assets and that the first signs of a reallocation of these holdings are becoming apparent. Even a reallocation of just 0.5% of these holdings into gold would amount to approximately USD 273.6bn, or about 2,500 t of gold. This asymmetry is what makes gold so interesting in the current macro regime. The market is large and liquid but remains small relative to the global financial asset base. Small shifts in allocation can therefore have major price effects.
Three scenarios for the gold allocation
Three scenarios can be derived from the driving forces described above. The basic assumption is simple: the more adverse the macroeconomic environment, the higher the plausible gold allocation. The starting point is the current gold allocation of private investors, which stands at 2.7% as of the end of 2025. From there, we assume a gradual increase in the gold allocation through the end of 2045 toward the respective target allocation. The three scenarios, which we have defined based on these driving forces and assigned empirically plausible probabilities to, are presented in the table below.
Three Scenarios for the Gold Allocation
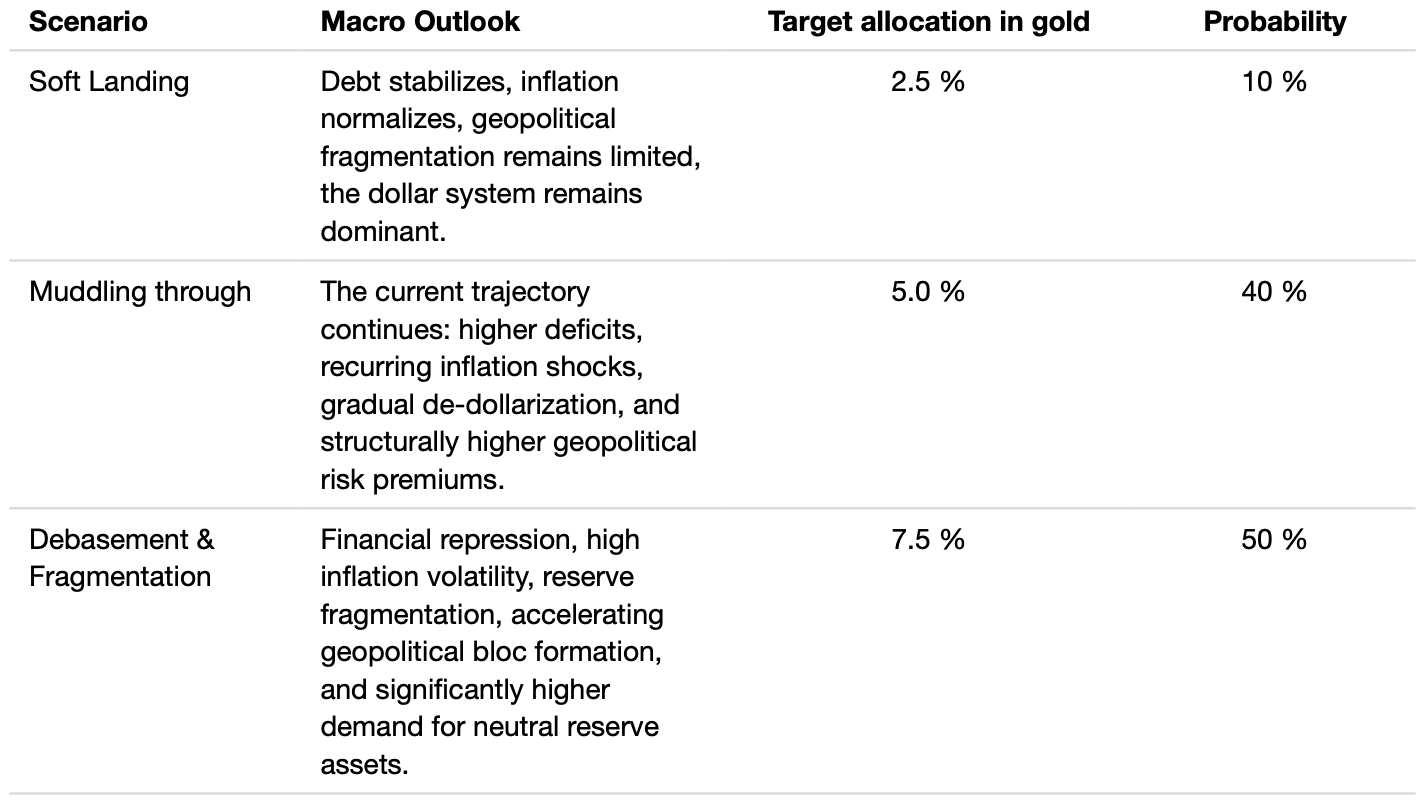
Source: Incrementum AG
- In the soft-landing scenario, gold remains a strategic diversifier. The old disinflationary world does not return fully, but the key stress factors remain manageable. The debt-to-GDP ratio stabilizes, inflation normalizes, and geopolitical fragmentation remains limited. In this case, private investors aim for a moderate gold allocation of 2.5%.
- In the muddling-through scenario, gold becomes a structural portfolio anchor. The world does not tip into a full-blown crisis, but the key stress factors persist: high deficits, volatile inflation, positive equity-bond correlations, a politicized bond market, and creeping reserve fragmentation. In this scenario, a gold allocation of 5.0% appears plausible. The reallocation occurs not least at the expense of nominal government bonds, whose role as a diversifier is structurally losing its appeal.
- In the debasement-and-fragmentation scenario, gold becomes the monetary safe haven. Financial repression, increased inflation volatility, the formation of geopolitical blocs, and a loss of confidence in the existing reserve system lead to significantly higher strategic allocations. In this environment, a target gold allocation of 7.5% for private investors appears realistic.
From today’s perspective, the sum of inertial factors points most strongly toward the realization of the moderate or adverse scenario. Neither debt trajectories, demographic trends, nor reserve fragmentation suggest a rapid return to the old world of disinflation. The soft-landing scenario remains possible, but it requires a remarkable combination of fiscal discipline, a productivity boost, geopolitical détente, and credible inflation normalization. The debasement-and-fragmentation scenario, on the other hand, is not a Cassandra-like warning from the fringes of the market, but a realistic tail risk whose probability of occurrence rises with every further breach of trust in the monetary and reserve system.
20 Years into the Future: Gold Price Projection Through the End of 2045
Based on the input factors described projections for the gold price and its market capitalization through the end of 2045 can now be calculated. The parameters of the formula are known: the magnitude of global liquid assets, the target allocations of the three scenarios, and the estimated investment gold holdings through the end of 2045.
Gold price = Global liquid assets × Target allocation / Investment gold holdings
So let’s hop into the DeLorean and take a double trip through time: 20 years back and 20 years forward, to estimate what price paths might emerge by 2045.
Incrementum Gold Allocation Model 2045: Gold, and Price Projections by Target Allocations, in USD, 12/2005–12/2045
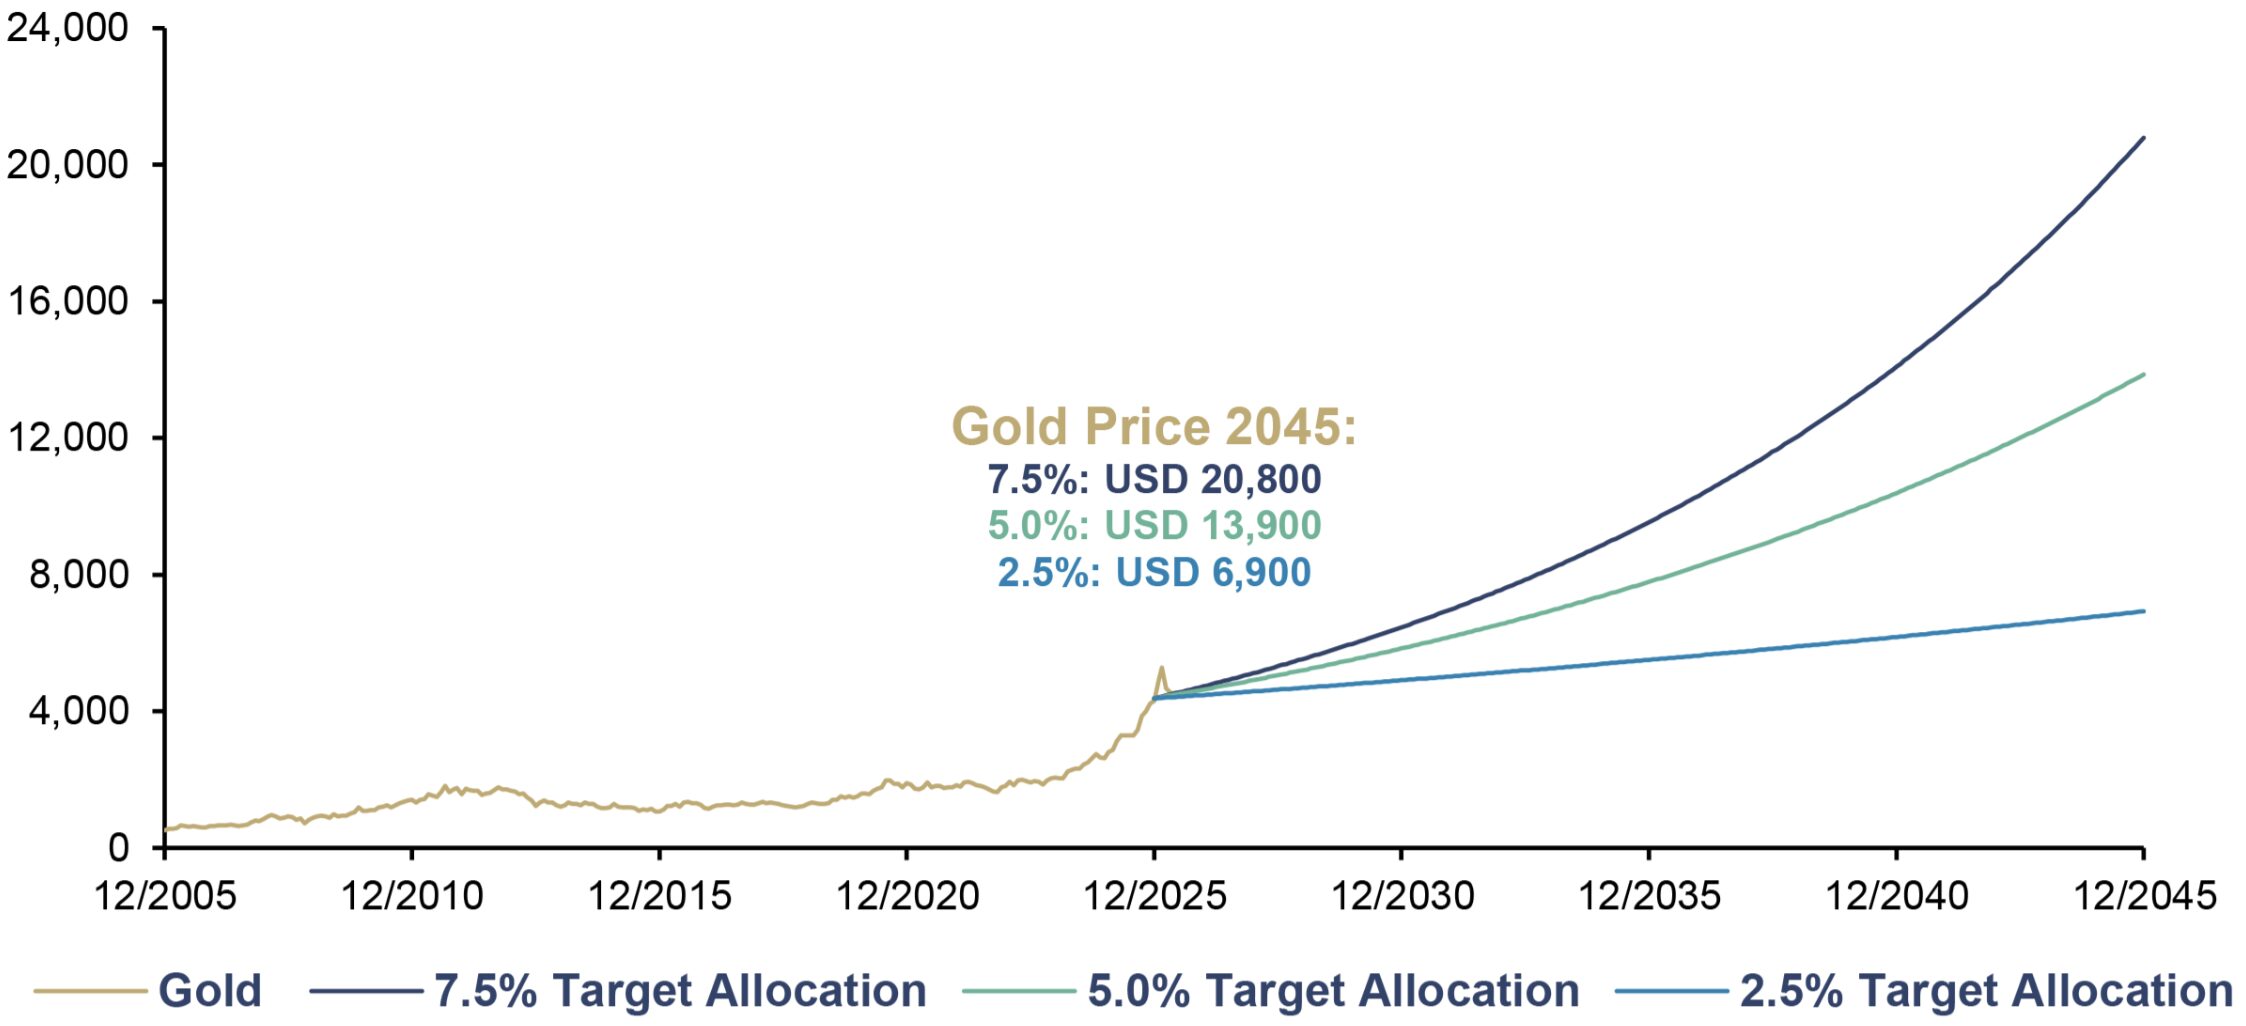
Source: BIS, ICE, LSEG, Metals Focus, Preqin, SIFMA, WFE, World Gold Council, Incrementum AG
In our three scenarios, the price of gold at the end of 2045 ranges from approximately USD 6,900 to USD 20,800 per ounce. In the soft-landing scenario, gold reaches around USD 6,900. This represents a return of about 58% from the starting level. In this scenario, the share of gold held by private investors would decline slightly from 2.7% to 2.5%, as macroeconomic conditions largely stabilize and strategic pressure in favor of gold eases. In the muddling-through scenario, the price of gold rises to around USD 13,900, representing a return of approximately 217%. In our scenario deemed most likely – the debasement & fragmentation scenario – the gold price rises to USD 20,800, corresponding to a 375% return.
Gold Price, in USD, and CAGR through 2045, by Scenario
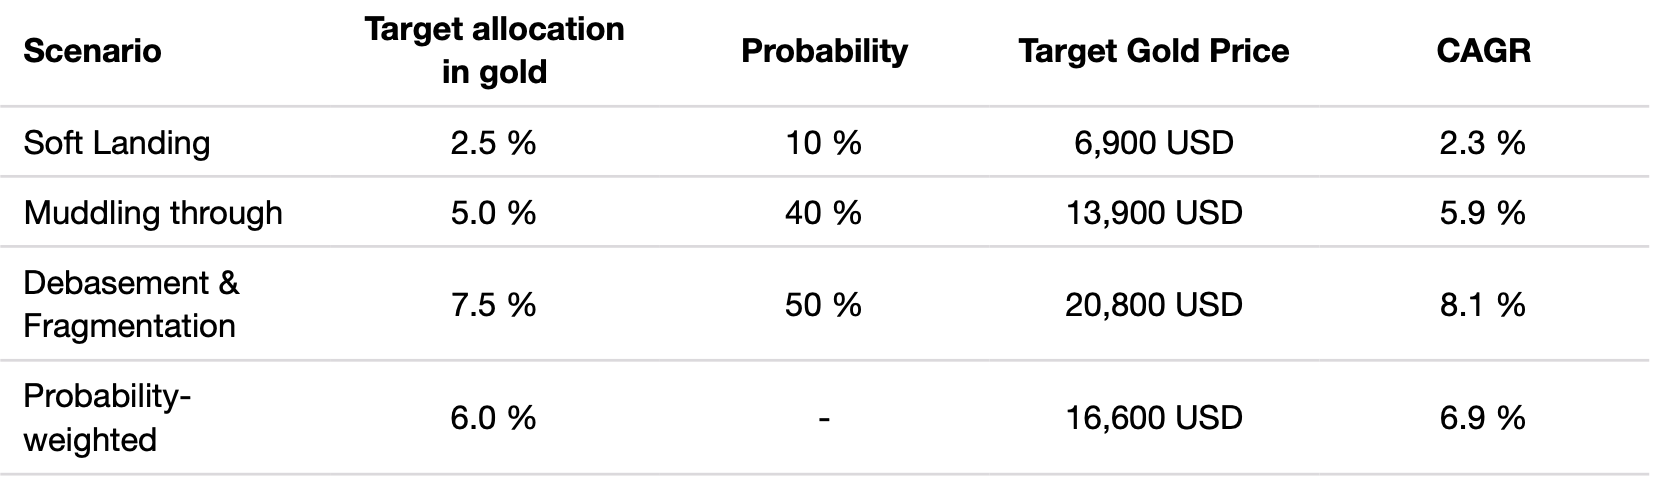
Source: Incrementum AG
Probability-weighted, this results in a gold allocation of around 6.0% by the end of 2045 and an implied gold price of approximately USD 16,600. This corresponds to an annualized return of around 6.9%. By comparison: Over the past 20 years, the gold price has increased nearly eightfold. The CAGR from 2006 to 2025 was around 11.2%.
Recent developments, in particular, have been extraordinary. Over the past two years, gold has risen by 27.2% and 64.4% in US dollars, respectively. The latter marked the fourth-strongest year in history. So, a lot has already happened. And yet, the logic of long-term remonetization suggests that the renaissance of gold allocation still has significant upside potential.
These targets provide a realistic framework for assessing price expectations. When we published our 10-year gold price forecast through the end of the “golden decade” in the In Gold We Trust report 2020, “The Dawning of a Golden Decade” – USD 4,800 in the base scenario and USD 8,900 in the inflationary scenario – these targets were dismissed as utopian by many market participants. Today, analysts seem to be outdoing one another with bullish gold price forecasts on a weekly basis.
Our gold price paths from the IGWT Gold Allocation 2045 Model remain within the corridor we defined back in 2020 for the end of this decade, with prices reaching around USD 4,900 in the soft-landing scenario and around USD 6,500 in the debasement-and-fragmentation scenario by the end of 2030. We therefore view our targets as confirmed, but at the same time consider it unrealistic and implausible that no major correction – or even a multi-year bear market – will occur within the next 20 years. In the 1970s, gold experienced drawdowns of around 50% at times, and in the 2000s, around 30%. The current bull market has so far been spared corrections of this magnitude.
For gold market capitalization, the results imply that the value of above-ground gold could rise to as much as USD 210trn by the end of 2045. This corresponds roughly to a sevenfold increase in the current market capitalization of USD 30.8trn. In the most bearish scenario, market capitalization would still more than double – to approximately USD 70trn.
Incrementum Gold Allocation Model 2045: Gold Market Cap, by Target Allocations, in USD trn, 12/2015–12/2045
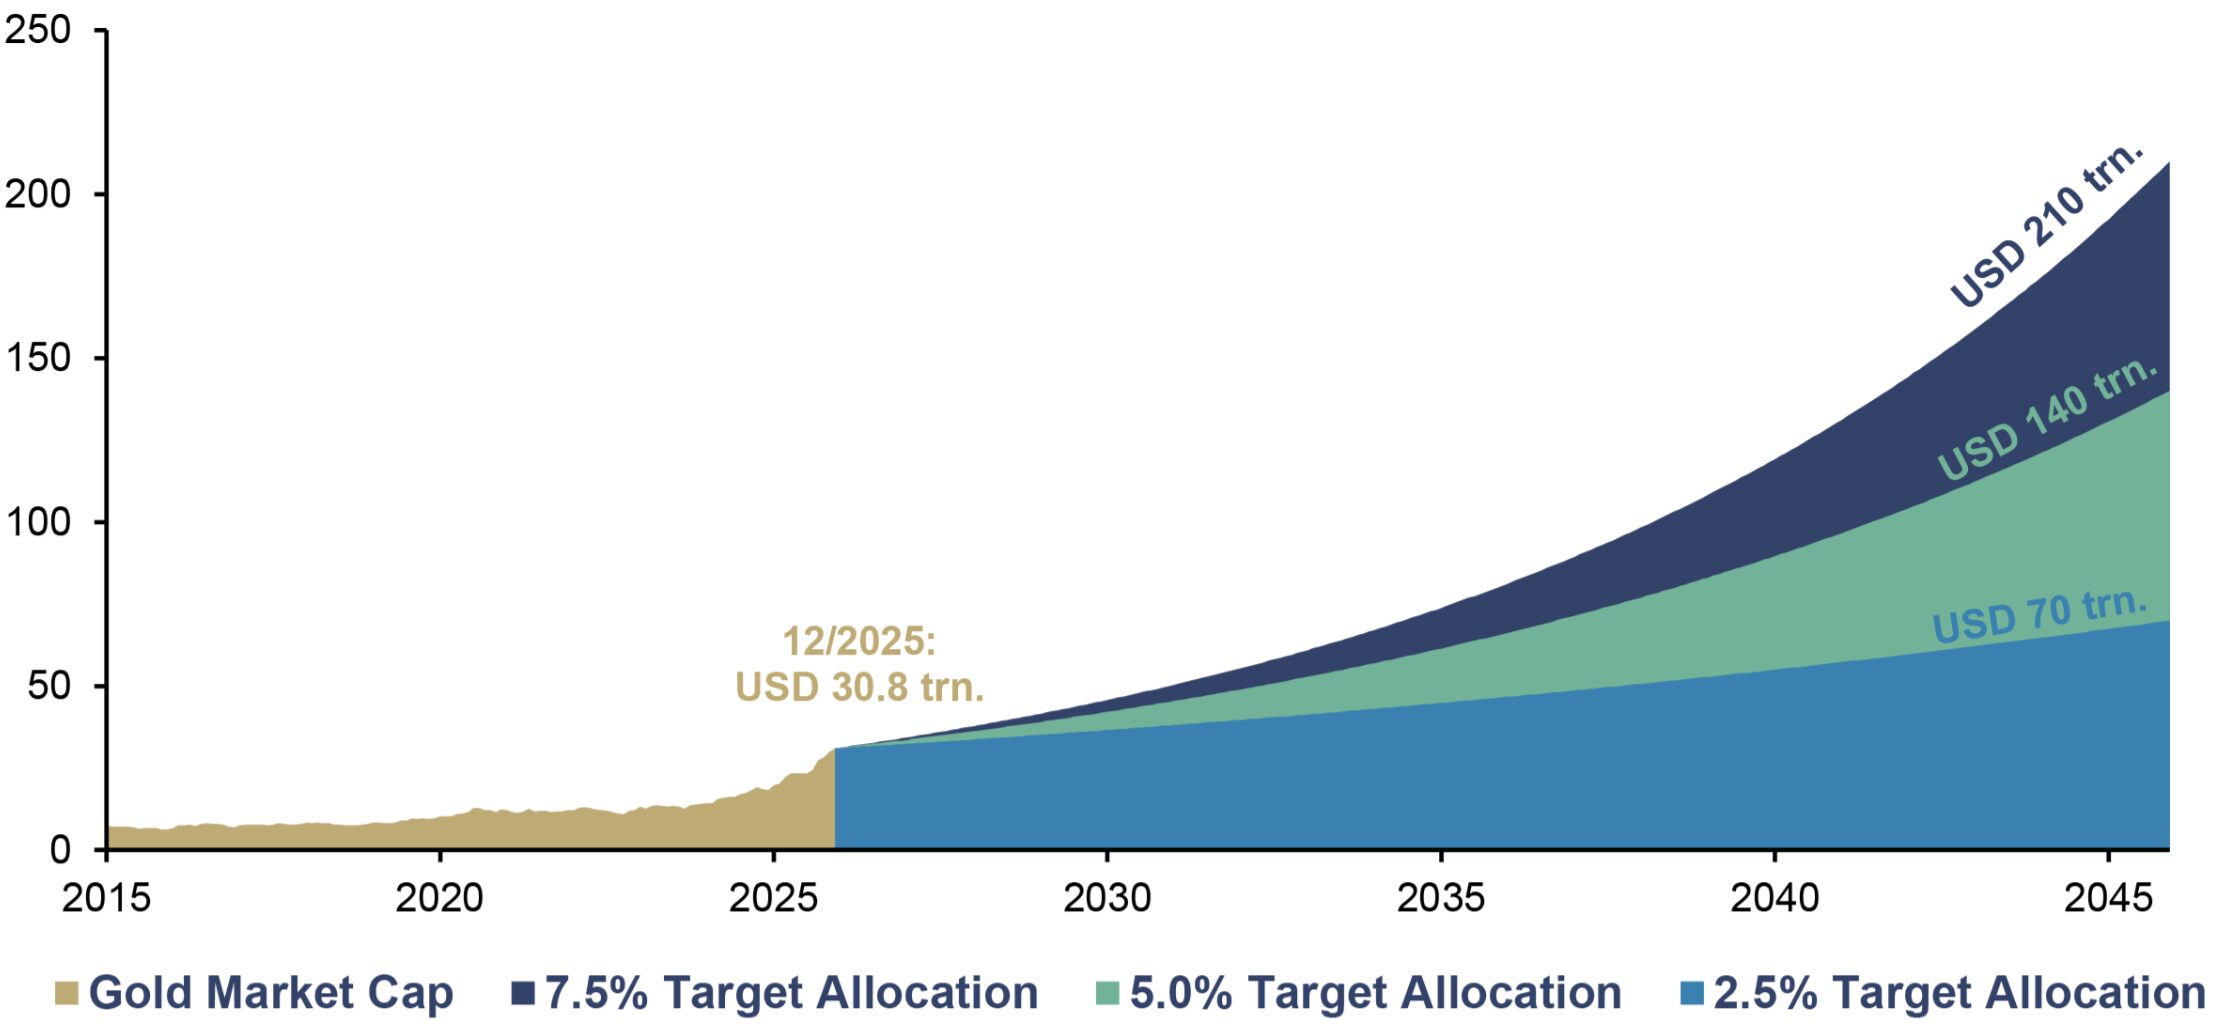
Source: BIS, ICE, LSEG, Metals Focus, Preqin, SIFMA, WFE, World Gold Council, Incrementum AG
Thus, the model’s message is clear: The gold allocation does not need to surge to trigger significant price effects. Even a gradual increase in the target allocation, combined with growing liquid assets and only slowly growing gold reserves, can push the gold price significantly higher.
Conclusion
The IGWT Gold Allocation 2045 Model is not a point forecast but a regime compass. It does not ask what price gold should have tomorrow, but what price gold can reach if a growing portion of global liquid assets demands a scarce, neutral, and highly liquid monetary real asset, thereby further driving the renaissance of gold allocation.
The decisive variable is the gold allocation. Demographics, debt, geopolitics, and reserve fragmentation suggest that this allocation is more likely to rise than fall over the next two decades. Liquid assets form the growing capital pool. Monetizable gold reserves form the inert physical supply base. Gold’s long-term price dynamics arise from this difference between financial elasticity and physical scarcity. The analysis shows where gold could be headed once institutional investors have caught up with the future.
Incrementum Gold Allocation Model 2045: Projected Gold Price Range, and Probability-weighted Gold Price, in USD, 12/2005–12/2045
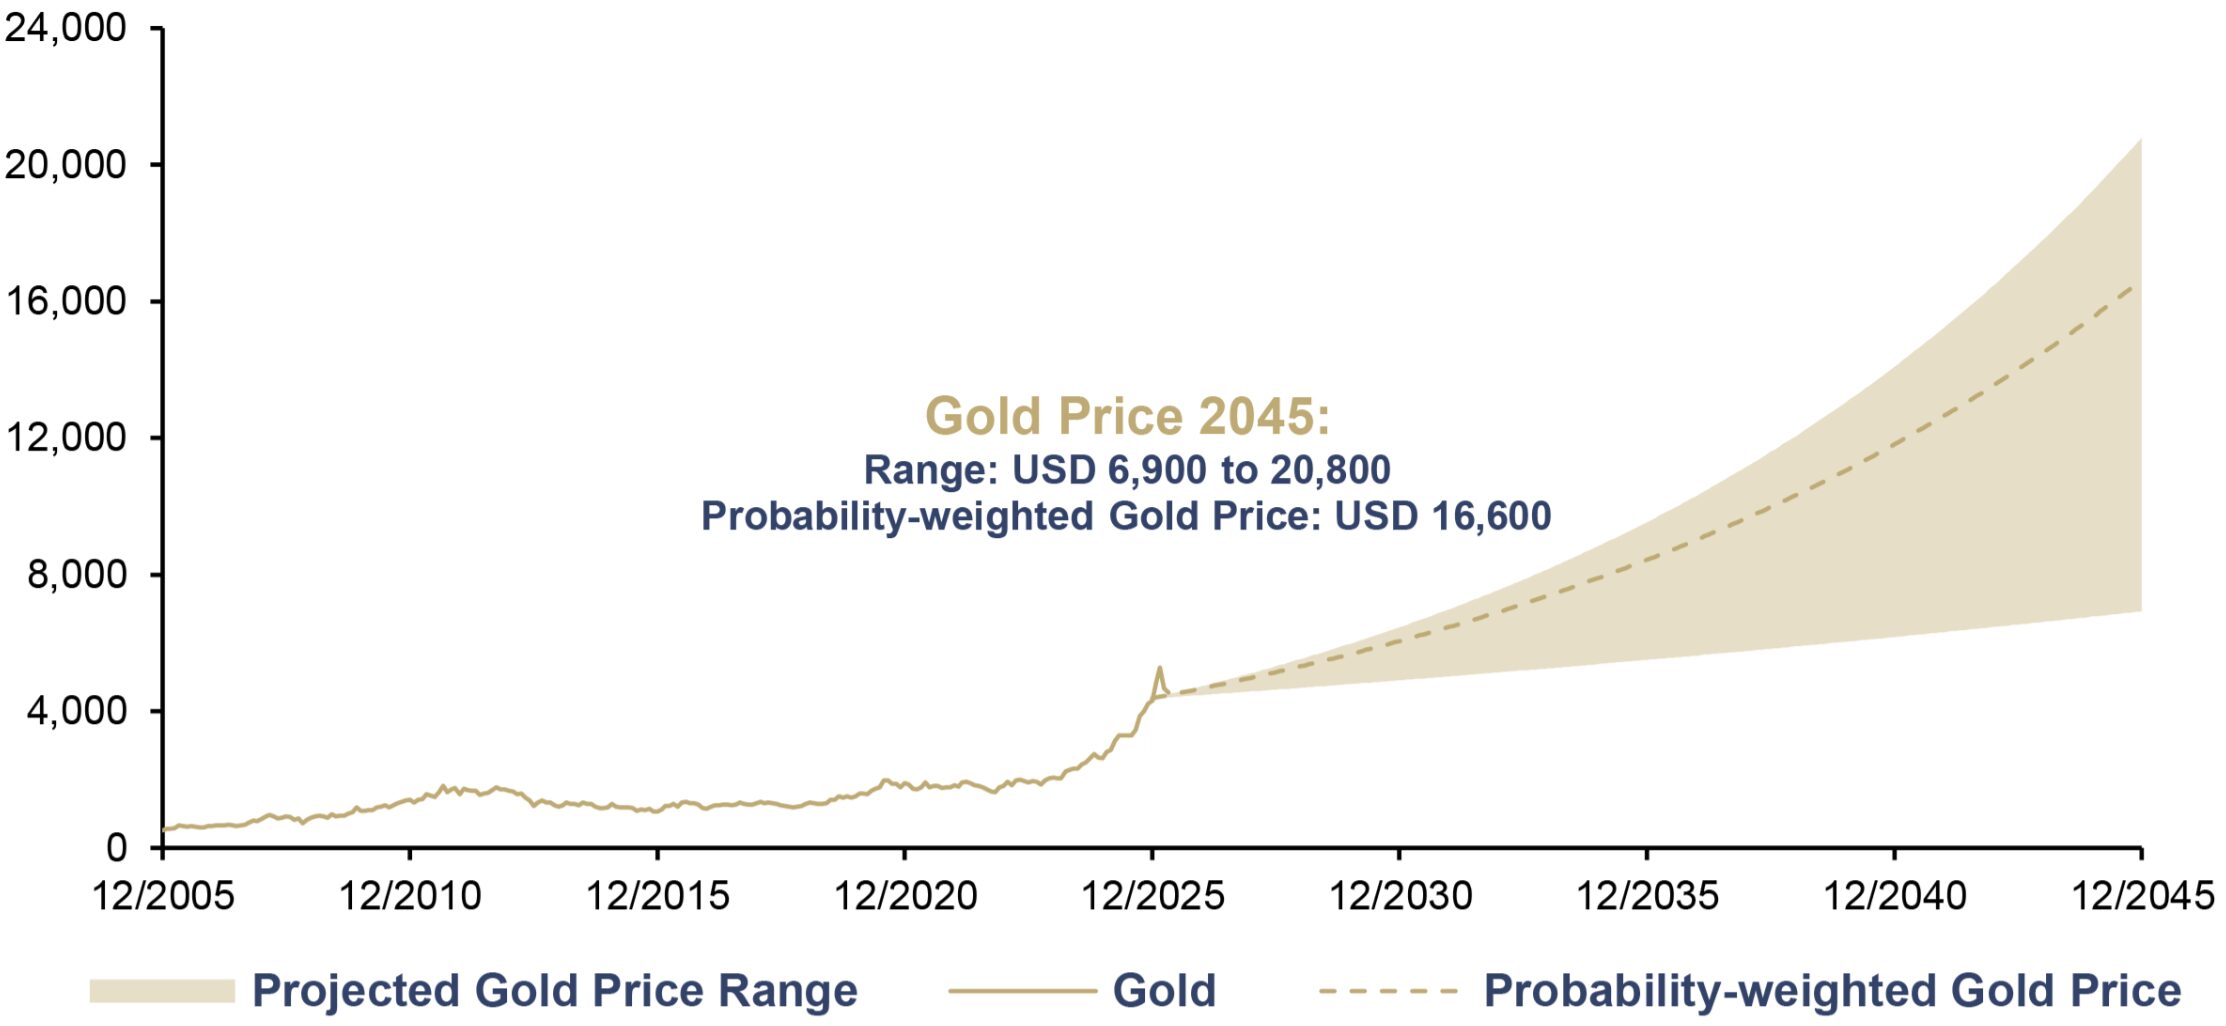
Source: BIS, ICE, LSEG, Metals Focus, Preqin, SIFMA, WFE, World Gold Council, Incrementum AG
Crucially, this reallocation will be funded not by idle cash but by liquidating the asset class that has been the bedrock of institutional portfolios for forty years: nominal government bonds. In this environment, gold is not a substitute for all bonds but an increasingly necessary counterweight to a bond market that is becoming more part of the problem than part of the solution.
Institutional capital is the supertanker of financial markets: slow to turn but unstoppable once it does. The greater the pressure from inflation, debt, geopolitical fragmentation, and positive stock-bond correlations becomes, the more difficult it will be for pension funds, insurance companies, and other institutional investors to stick to traditional allocation patterns. Retail ETF buyers also took some time to jump on the gold bandwagon. But compared to pension funds, they seem almost like high-frequency traders on Red Bull.
Further remonetization of gold is also quite likely. In such a scenario, gold would once again play a significantly more prominent role in monetary policy. A look at the long history of money shows that gold, after all, has by far the longest history as a currency. Although it has not been the official anchor of the global monetary system since the end of Bretton Woods in 1971, it has certainly not lost its monetary character in the meantime and continues to serve as a reserve asset for most countries.
Lifespan of Various Currencies, 0–2026
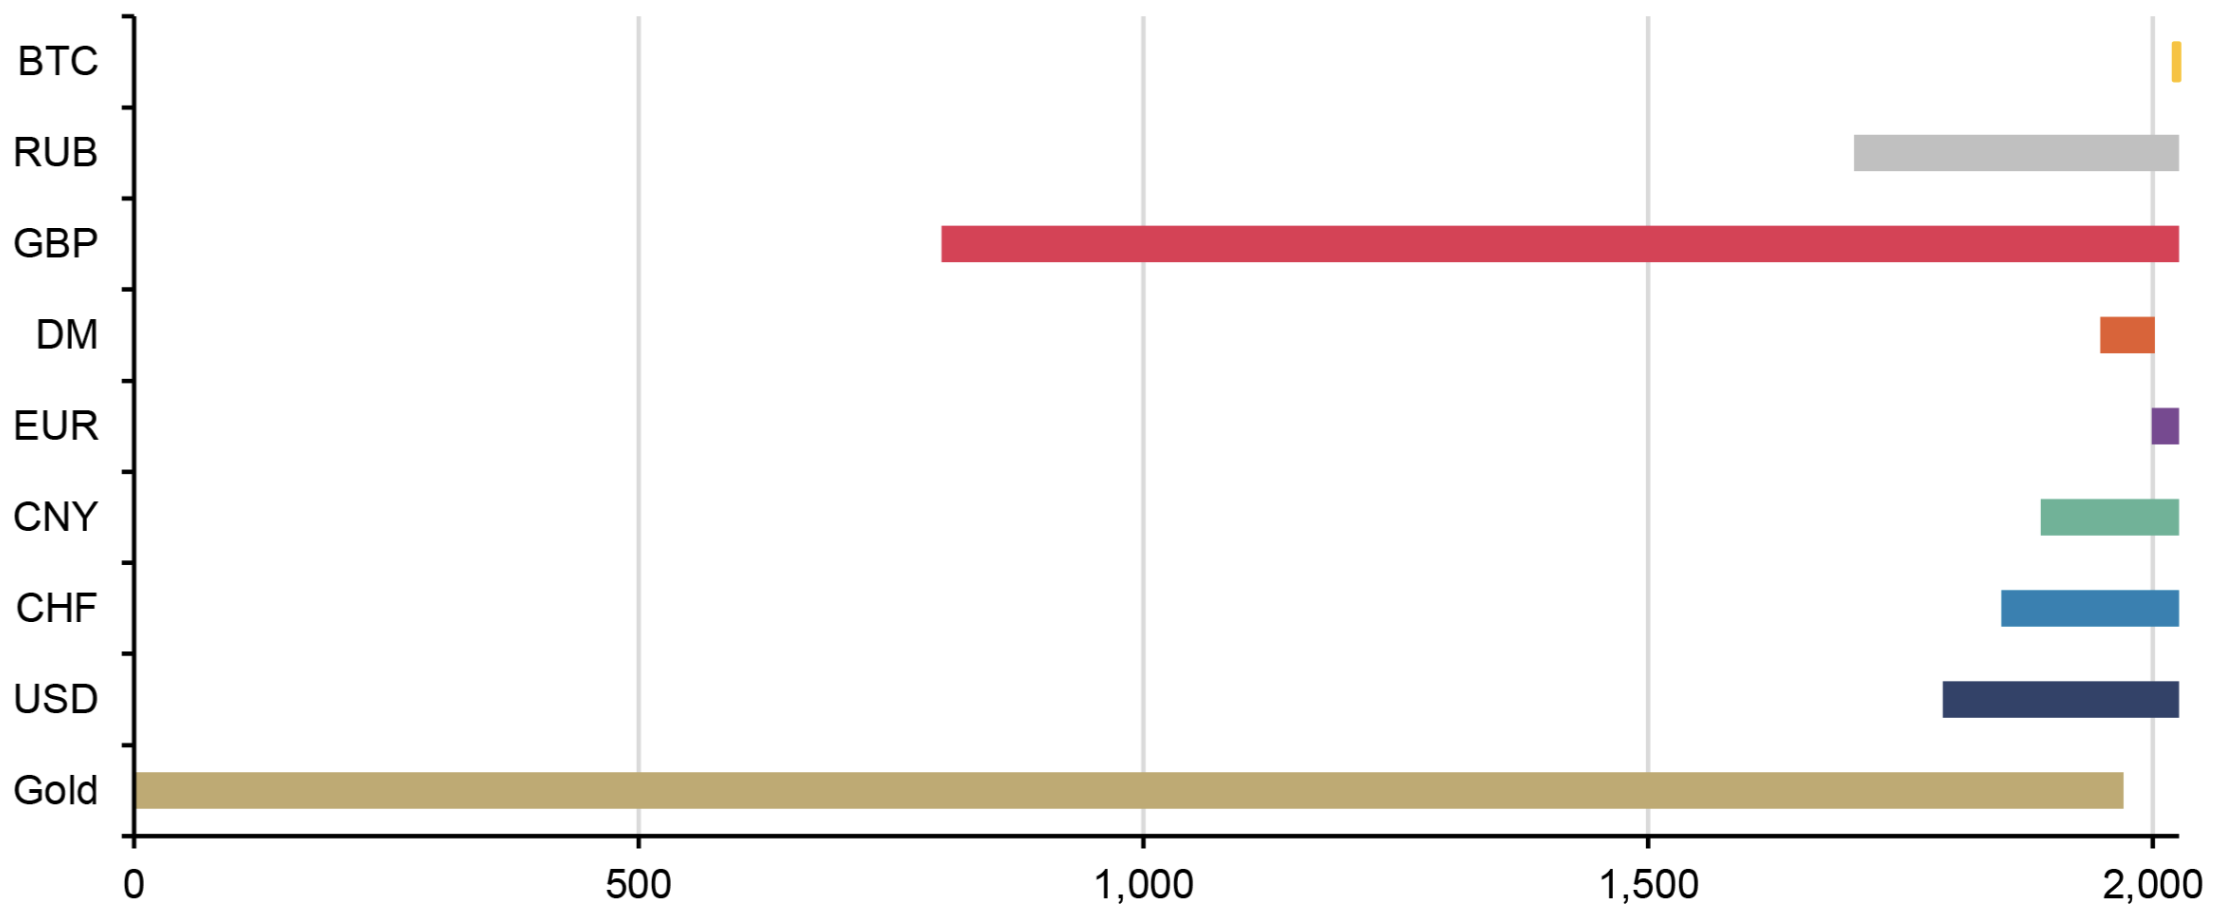
Source: Wikipedia, Incrementum AG
Is the monetary policy shifting away from gold? In any case, a renaissance of gold as a monetary anchor is emerging, as central banks are increasingly seeking to acquire gold.
At the same time, the emergence of Bitcoin shows that the demand for scarce, neutral, and nondilutable money has not disappeared. In 2021, El Salvador became the first country to adopt Bitcoin as legal tender, although mandatory acceptance was later significantly restricted as part of agreements with the IMF. In the US, meanwhile, a strategic Bitcoin reserve was established in 2025. This is further evidence that neutral monetary assets are increasingly being discussed at the institutional level. Anyone who had claimed in 2009 that Bitcoin would appear on government balance sheets a little over a decade later would likely have been taken about as seriously as Leonardo da Vinci presenting his flying-machine design to a medieval city council.
Whatever the monetary order of the coming decades may look like, the likelihood that today’s monetary system will remain unchanged appears slim. Perhaps we will find that, the closer we get to the future of money, the more it seems surprisingly familiar to us in crucial respects. For the monetary future may not emerge from a radical break with its past, but rather from a return to its most robust principles: scarcity, neutrality, and trust. In this sense, gold is not backward-looking. Rather, it is an asset of the future with a very long past.
[1] See “The New Gold Playbook,” In Gold We Trust report 2024;