

The Status Quo of Gold Demand and Gold Supply
“Gold is the ultimate means of payment in extreme circumstances.”
Adam Glapinski, President of the National Bank of Poland (NBP)
- Central banks bought 863 t of gold in 2025 – worth a record USD 95.2bn – and the Central Bank Gold Reserves Survey 2025 found that 95% expect global reserves to rise further, with zero respondents anticipating a decline.
- Gold is no longer a passive reserve asset, as central banks are increasingly treating gold as an active balance-sheet tool. This is a form of “silent remonetization” without the political cost of debt issuance.
- Investment demand surged 84% yoy to 2,175 t in 2025, driven by record ETF inflows of USD 89bn (800 t) and physical bar-and-coin demand of 1,374 t – a decade high.
- Asia’s weight in the gold market is reaching a tipping point. Asian gold ETF inflows in 2025 alone (USD 25bn) exceeded the cumulative total from the launch of the first Asian gold ETF in 2007 through 2024. In Q1/2026, Asian ETFs posted their strongest quarter on record.
- O n the supply side, total gold supply reached 5,002 t in 2025, with mine production at a new record of 3,672 t, yet the muted recycling response to record prices is remarkable – suggesting that holders have internalized expectations of further monetary debasement.
We now turn to the most critical gold supply and demand developments, focusing on central banks and private investors. For further insights, we recommend the World Gold Council’s (WGC) Gold Demand Trends.
Gold Demand
Central bank gold demand
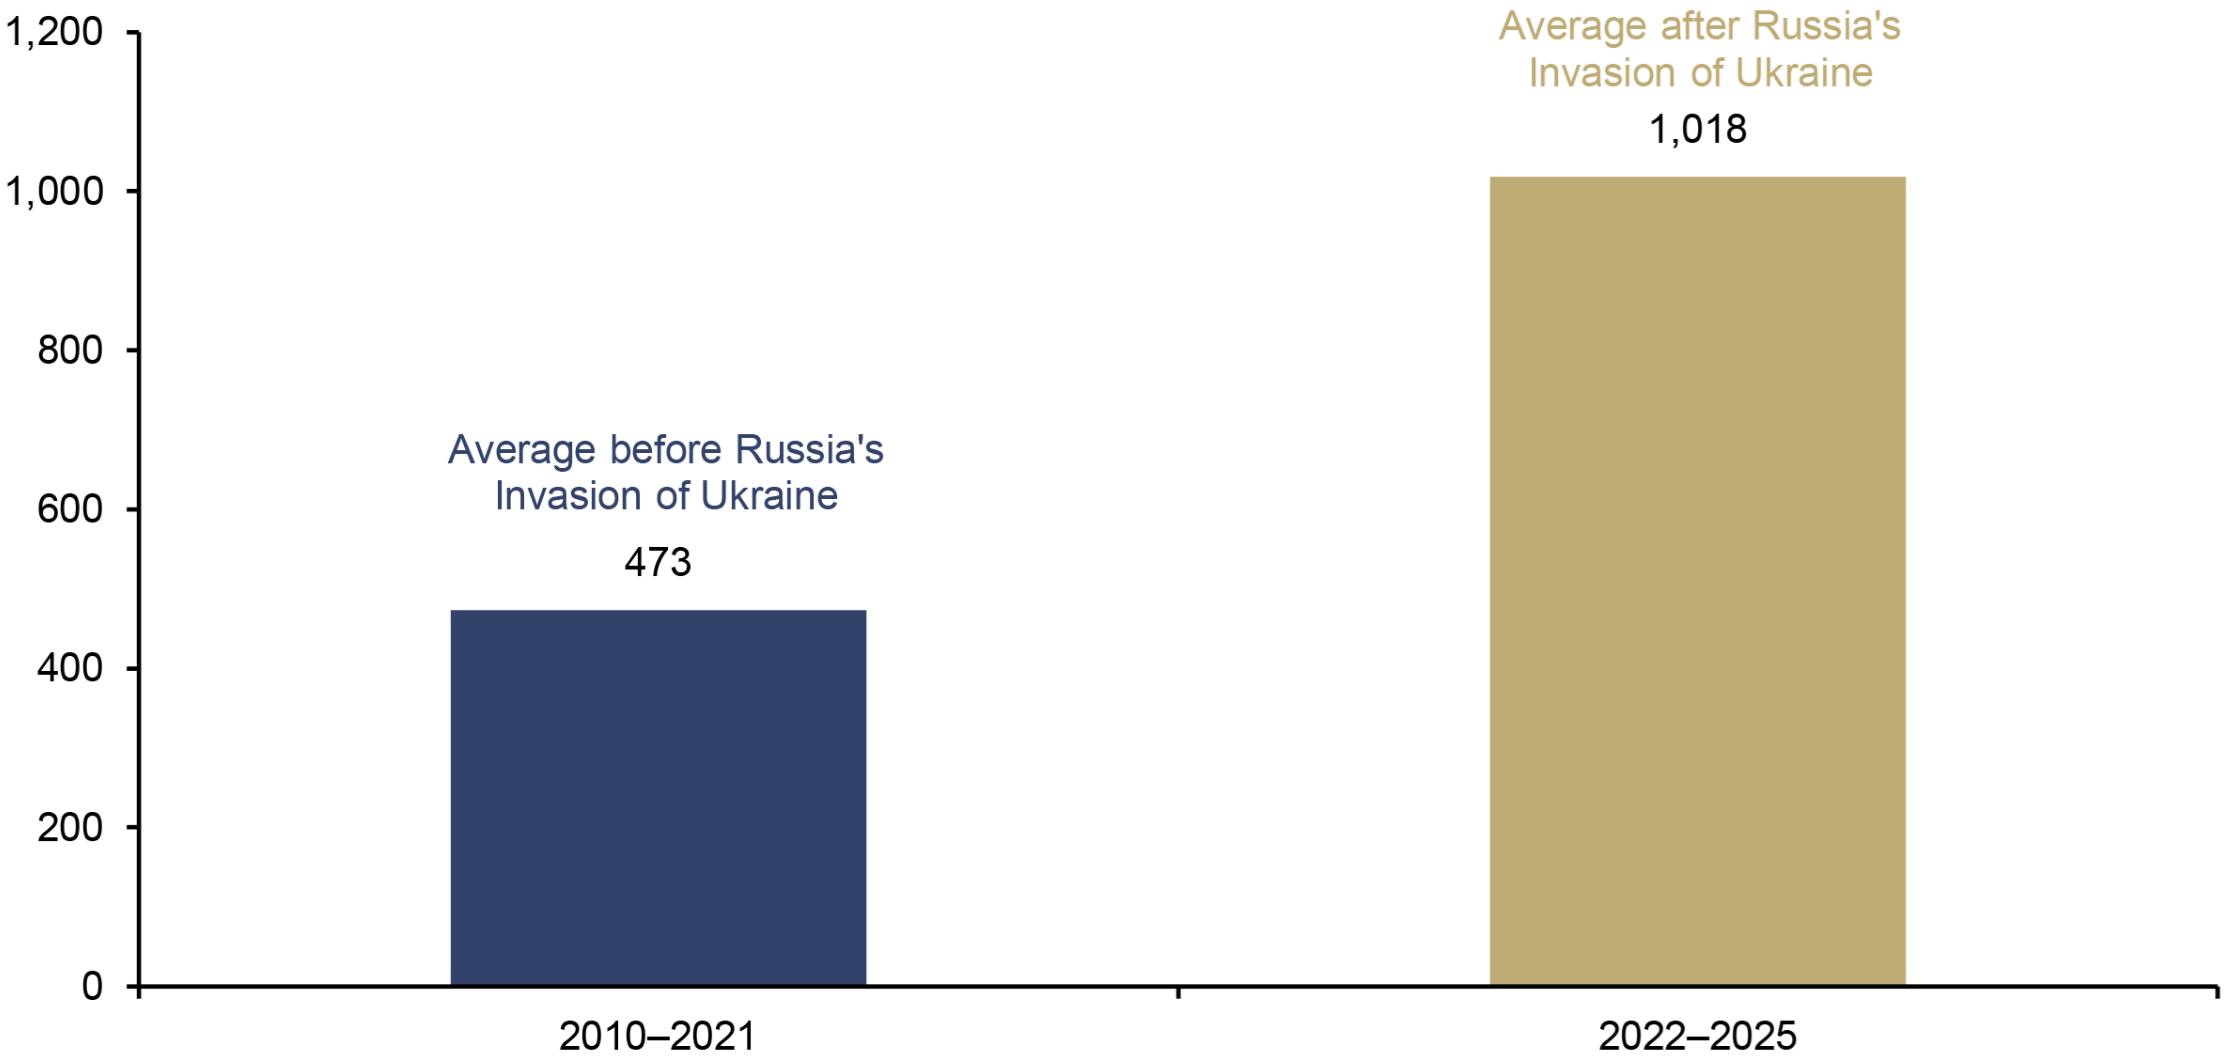
Central banks have remained the structural anchor of gold demand, despite the moderation in the pace of gold purchases. For three consecutive years, from 2022 to 2024, official sector purchases exceeded 1,000 t, marking a decisive break from the pre-2022 regime. What began as a gradual diversification trend has evolved into a strategic repositioning of reserves in response to a more fragmented and politicized monetary order.
Then, in 2025, the total amount of gold purchased by central banks amounted to “just” 863 t. As a reminder, the 2010–2021 period averaged 473 t per annum. In terms of monetary value, last year’s purchases by global central banks totaled around USD 95.2bn, which broke 2024’s record of USD 83.8bn, thereby becoming the new all-time high level.
Average Annual Global Central Bank Gold Purchases, in Tonnes, 2010–2025
Source: World Gold Council, Incrementum AG
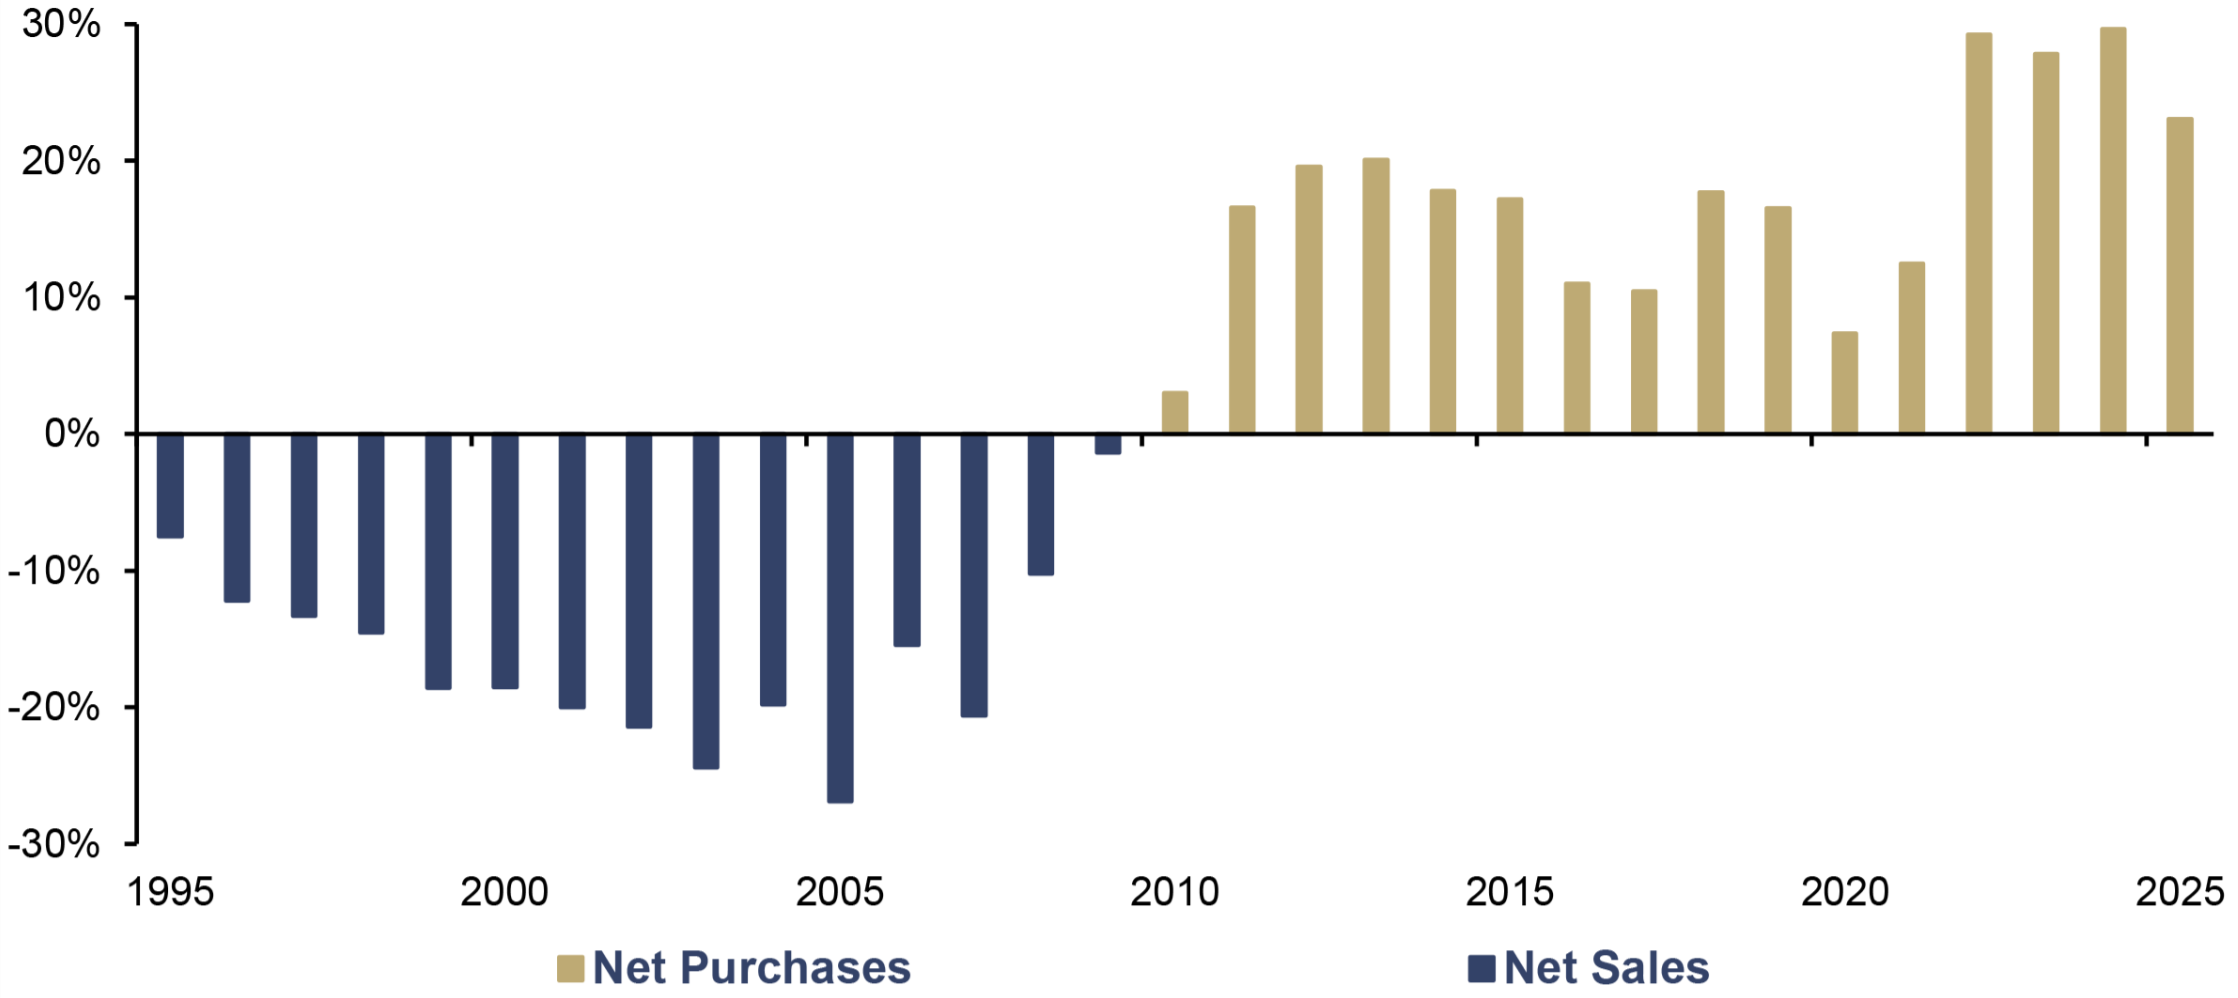
In relative terms, after a series of three years of central bank demand representing almost a third of the annual gold mine production, in 2025 the official acquisitions amounted to roughly a fourth of the gold mined. In spite of the moderation from the record pace, last year still ranked among the highest levels in modern history.
Global Central Bank Gold Purchases, as a % of Mine Production, 1950–2025
Source: ICE Benchmark Administration, Metals Focus, Refinitiv GFMS, World Gold Council, Incrementum AG
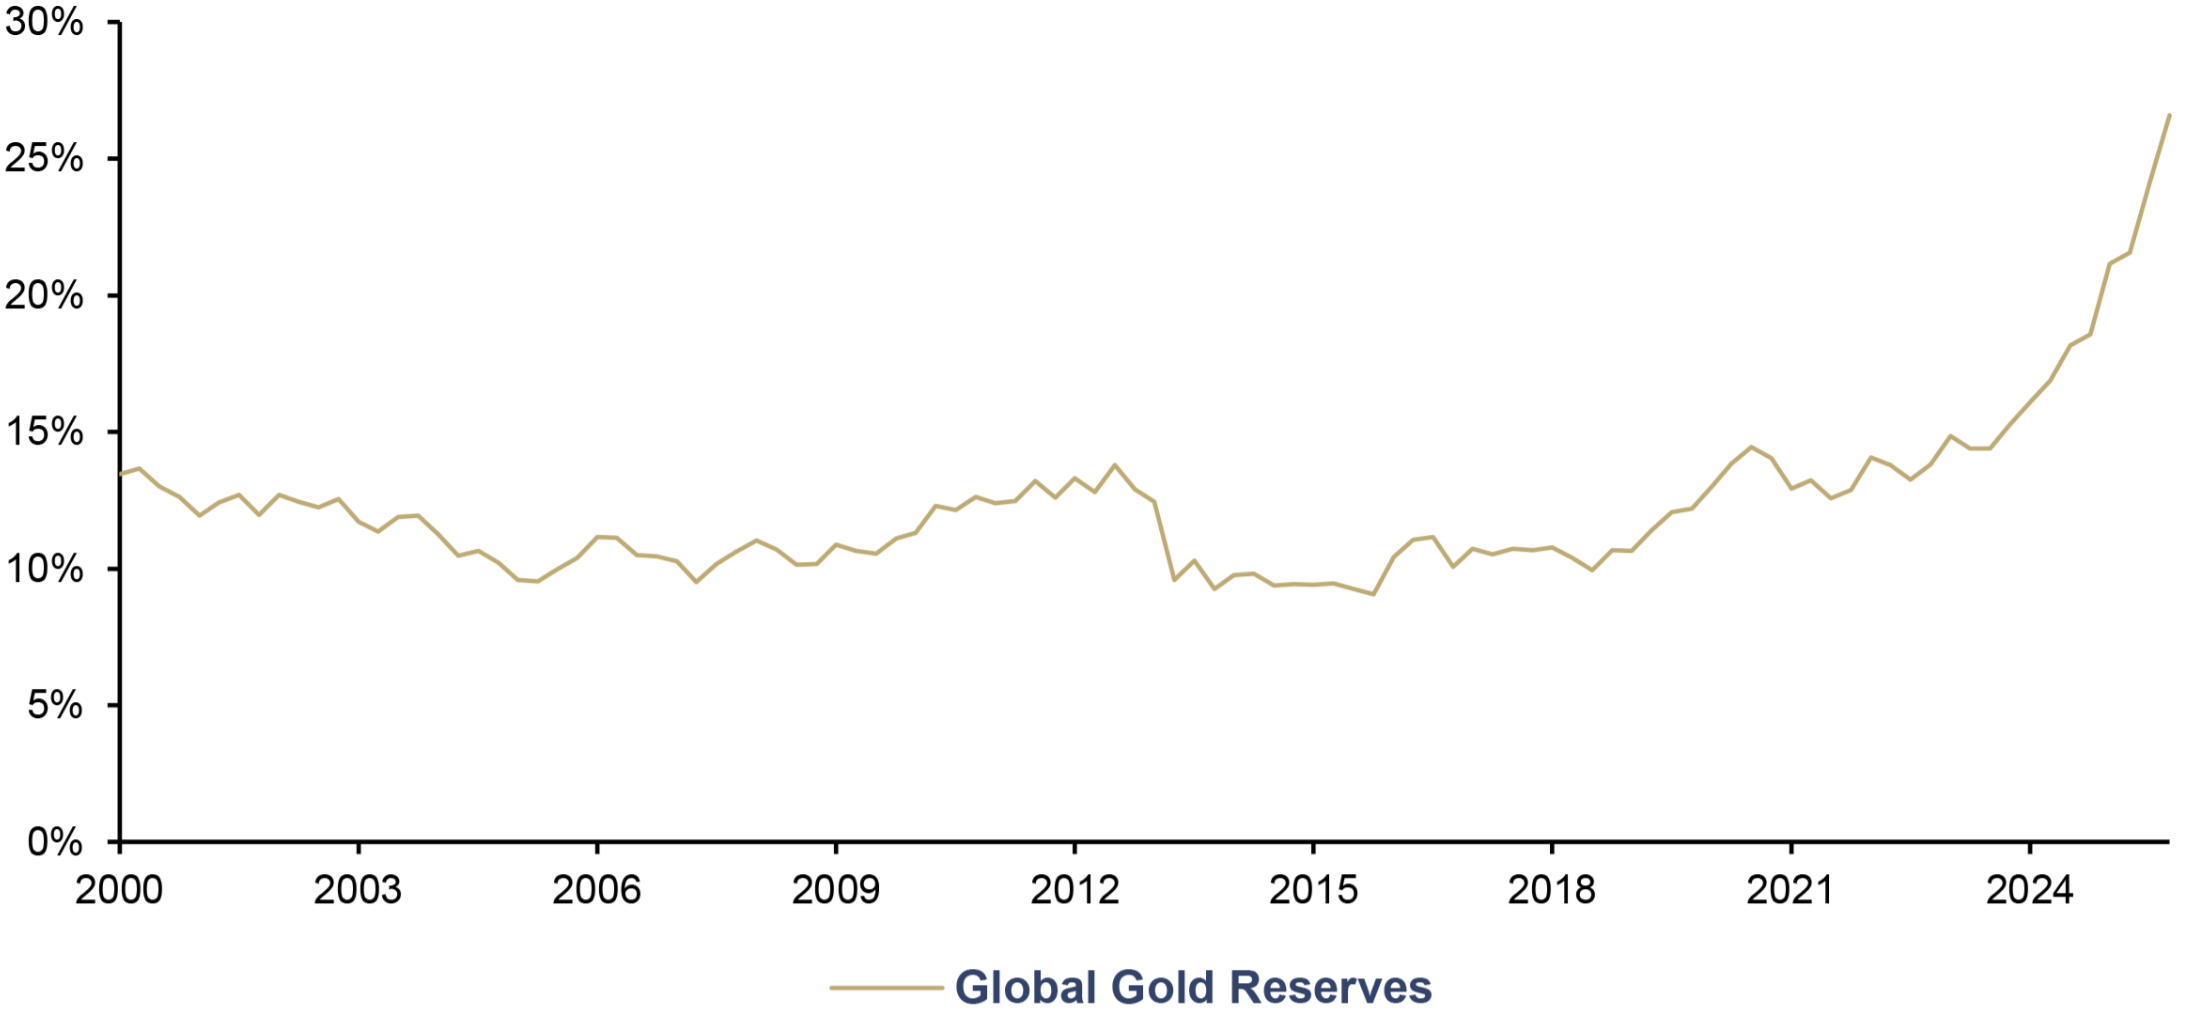
Therefore, the strategic trend remained unmistakable: Gold continues to gain importance as a reserve asset, because of its neutrality and the lack of a counterparty risk. The share of gold in global foreign exchange reserves has continued to increase, gradually moving back toward levels last seen in the early 1990s.
Global Gold Reserves, as a Share of Global Total Reserves, Q1/2000–Q4/2025
Source: World Gold Council, Incrementum AG
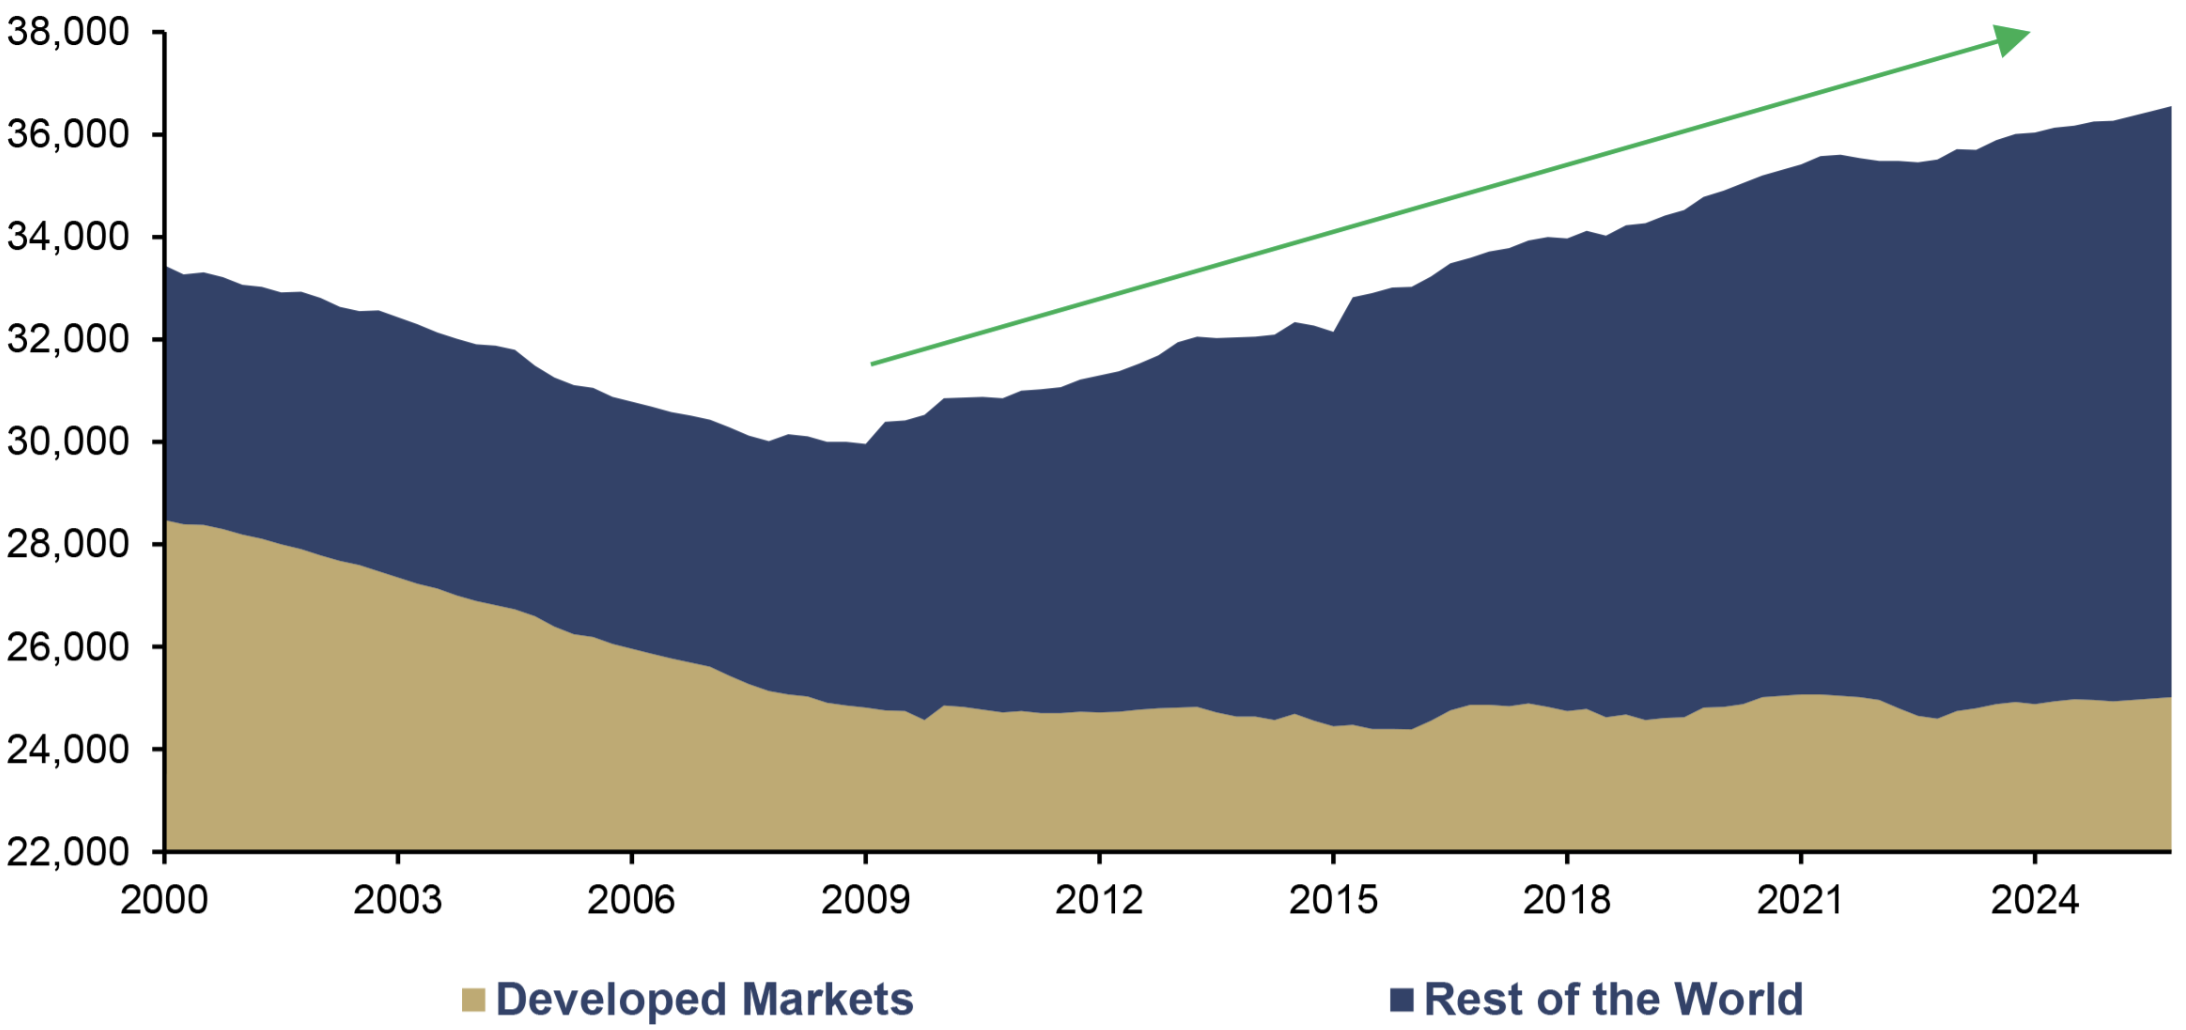
One of the most remarkable developments of recent years has been the divergence between emerging markets and developed economies in their approach to gold reserves. Emerging market central banks have significantly increased their gold holdings as part of a broader effort to diversify away from traditional reserve currencies and to strengthen financial resilience. In contrast, gold reserves among advanced economies have remained largely stagnant, reflecting the fact that many developed countries had already accumulated the bulk of their gold reserves decades ago.
Gold Reserves, in Tonnes, Q1/2000–Q4/2025
Source: World Gold Council, Incrementum AG
Seemingly, central banks haven’t purchased enough gold yet. According to the Central Bank Gold Reserves Survey 2025, which was published almost a year ago, in June 2025, a record 95% of central banks expect global gold reserves to increase over the next 12 months. Notably, 2025 was the first year in the survey’s history in which zero respondents expected gold reserves to decline – a unanimity that speaks volumes about the shift in institutional consensus. The motivations are consistent and telling: gold’s performance in crises, its role as a store of value, and its function as a diversifier in a world where trust in fiat assets is increasingly conditional.
Interestingly, central banks are becoming more active managers of their gold holdings, in order to use this monetary hedge as well as possible against systemic risk. At any rate, gold is hardly regarded as a passive reserve asset insofar as operational sophistication has increased.
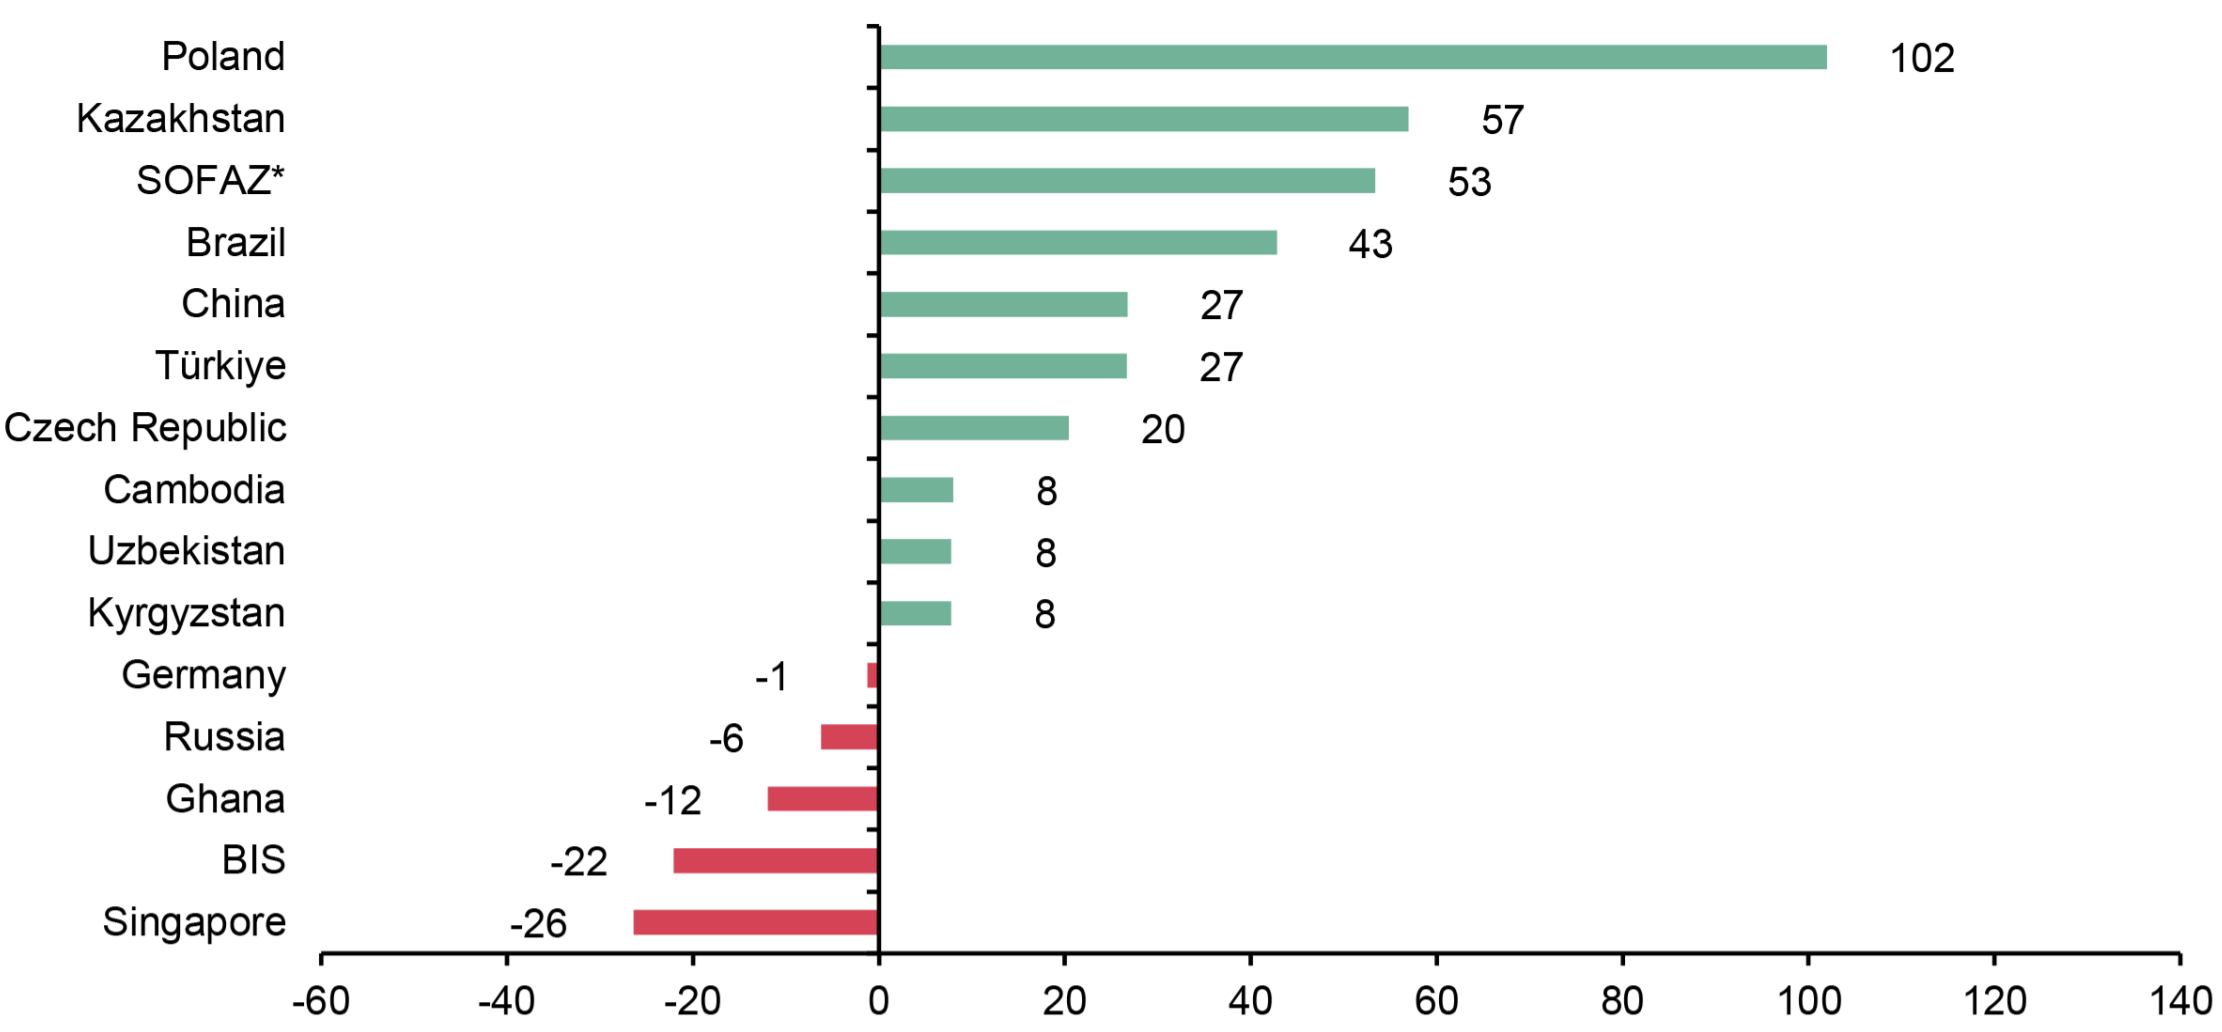
The most significant central bank buyers in 2025 were mostly from emerging markets.
Top 10 Buyers and Top 5 Sellers of Gold Reserves, in Tonnes, 2025
Source: World Gold Council, Incrementum AG
*State Oil Fund of the Republic of Azerbaijan
Yet, one developed-market central bank once again proved a striking outlier. For the second year in a row, Poland stood out as the most aggressive buyer. The Polish central bank added 102 t in 2025, continuing a multi-year strategy of strengthening its gold position. Notably, Poland has announced plans to purchase another 150 t, which would raise its total gold reserves to approximately 700 t, placing it among the top ten gold-holding nations globally.
This recent pivot by the Polish central bank can be traced back to a distinct moment: the Russian invasion of Ukraine. According to the president of the National Bank of Poland (NBP), Adam Glapiński,
we [the NBP] will keep buying gold until we reach 700 tons, because that’s where we are on the political map…. A country that borders a war zone is subject to special scrutiny. Investors and international institutions assessing our credibility take our reserves into account.
On the flip side, Russia appeared among the sellers in 2025. This development is notable because the Russian central bank had been one of the most consistent buyers of gold between 2006 and 2021. The recent sales likely reflect the need to monetize reserves in order to finance the ongoing war effort, effectively allowing Russia to “sell the rally” in gold prices. All in all, owing to the gigantic accumulation of gold bullion coupled with the tremendous rally in the gold price, gold reserves are now, broadly speaking, the predominant asset held in the central banks’ balance sheets.
The importance of gold for central bank balance sheets was highlighted by the experience of the Bundesbank in 2025. Rising interest rates caused losses on the central bank’s bond holdings, leading to an annual loss of EUR 8.6bn. However, the surge in the gold price dramatically increased the value of the Bundesbank’s gold reserves.
Indeed, the valuation of the Bundesbank’s gold position on the revaluation account increased by EUR 125bn, which more than compensated for the decline in other assets. As a result, despite the losses recorded on the income statement, the Bundesbank’s net equity increased by EUR 112bn to EUR 363bn.
In Italy, political pressure has mounted to assert greater state control over the central bank’s gold reserves, framing them explicitly as part of national wealth available for public purposes. Undoubtedly, this debate is revealing that gold is being reconsidered, from an untouchable reserve asset to a funding source, even if temporarily.
Evidently, Poland provides an even clearer example of this emerging paradigm. Having been the largest central bank buyer since 2024, the National Bank of Poland has signaled a willingness to actively manage its gold holdings. Governor Adam Glapiński recently floated the idea of generating up to USD 13bn through gold transactions to finance defense spending, potentially selling gold with the intention of repurchasing it later. While details remain undefined, the message is unmistakable: Gold is increasingly seen as a balance sheet tool that can be mobilized in times of fiscal strain.
This marks an important shift in central banks’ working procedures and mentality. Besides viewing gold as a strategic reserve, they are beginning to recognize its optionality as a source of liquidity and fiscal flexibility. In this sense, gold is being quietly and discreetly remonetized, as it can be activated without the political and market consequences associated with conventional debt issuance.
Strikingly, Poland once again leads the buying side, adding approximately 20 t in January and February alone. Uzbekistan has extended its accumulation streak to five consecutive months, bringing year-to-date purchases to 16 t. China continues its steady and methodical approach, adding a further 2 t and marking its 16th consecutive month of purchases. Meanwhile, the Czech National Bank has quietly built one of the most consistent accumulation programs globally, with 36 consecutive months of buying and 4 t added so far this year.
On the selling side, Russia has liquidated roughly 15 t, while Tü rkiye has emerged as the most active tactical operator. After selling 8 t in February, the Turkish central bank significantly increased its activity in March, with estimates suggesting around 50 t were mobilized for liquidity provision and FX operations. Importantly, Turkish officials emphasized that a substantial portion of these transactions consists of gold-currency swaps, implying that much of the gold may eventually return to reserves.
Crucially, these developments illustrate that central bank demand is increasingly characterized by the dual dynamic of strategic buying on one hand and tactical liquidity management on the other.
Conviction Buyers vs. Opportunistic Buyers
To better understand the evolving dynamics of gold demand, it is useful to distinguish between conviction buyers and opportunistic buyers.
Due to their accumulation being largely insensitive to price fluctuations, conviction buyers are driven instead by strategic considerations such as inflation hedging, currency debasement, and protection against systemic risk. When these actors enter the market, they tend to absorb supply in a relatively inelastic manner, thereby setting the direction of the gold price.
Opportunistic buyers, by contrast, are highly price-sensitive, as they tend to increase purchases during price corrections and step back during rallies. Importantly, however, they rarely sell. In short, their behavior introduces a stabilizing mechanism into the market, providing a floor during downturns while naturally capping excessive upside during periods of strong price appreciation.
Investment Demand for Gold
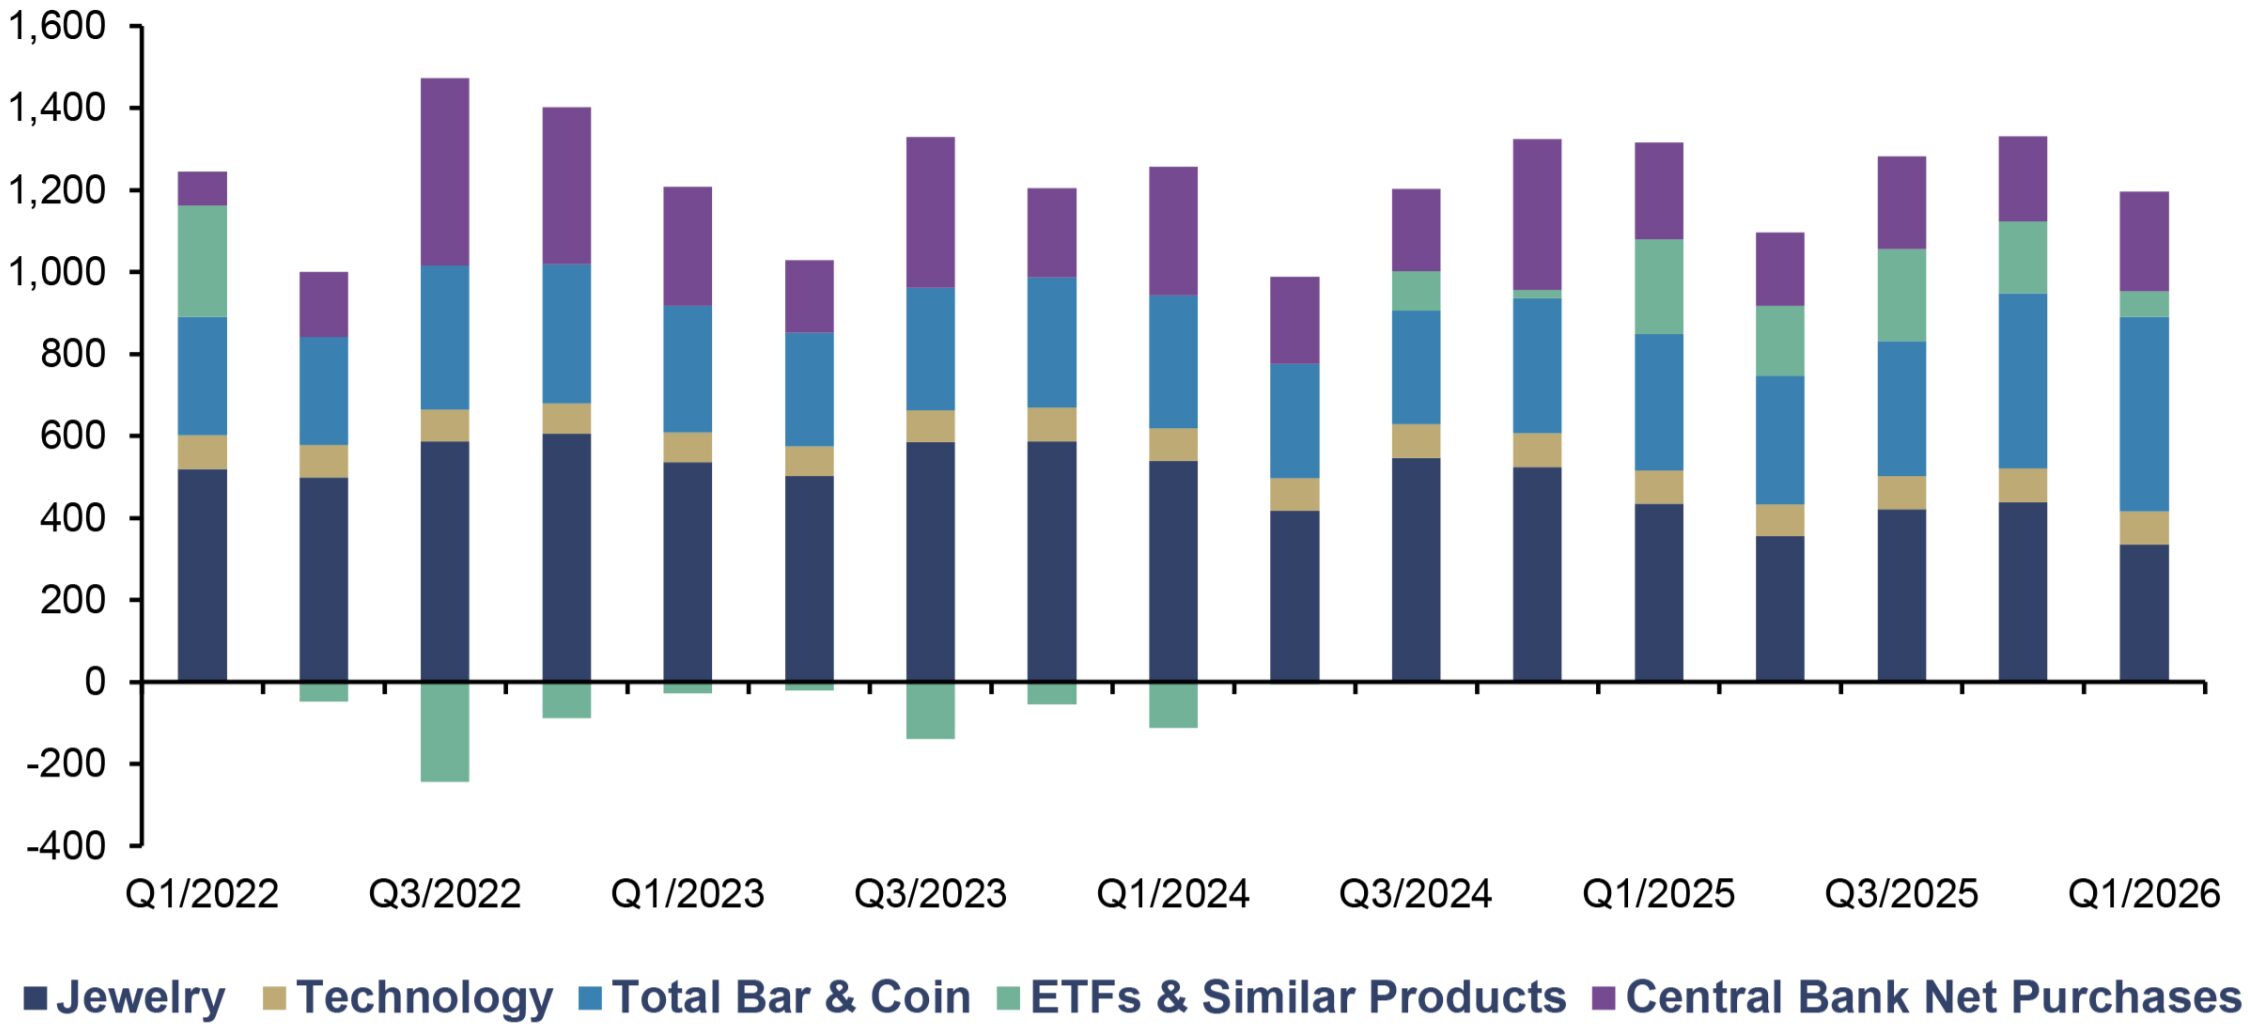
While central banks provide the structural foundation of gold demand, private investors determine the marginal price dynamics. This became particularly evident in 2025, when investment demand surged to 2,175 t – an increase of roughly 84% yoy – driven by record ETF inflows and robust physical buying.
Global Gold Demand by Sector, in Tonnes, Q1/2022–Q1/2026
Source: World Gold Council, Incrementum AG
This resurgence reflected a powerful convergence of macroeconomic forces: persistent inflation, geopolitical fragmentation, rising concerns over sovereign debt sustainability, and growing doubts about the resilience of the international monetary system. At the same time, declining real yields and a weaker US dollar reduced the opportunity cost of holding gold, while the strong price momentum itself attracted additional inflows.
Structurally, investment demand remains bifurcated. Despite Asia continuing to dominate physical gold investment, particularly through bars and coins, Western financial markets, especially North America, remain the epicenter of ETF activity. That said, this division is gradually evolving, as Asian participation in ETF markets accelerates. Viewed through the lens introduced earlier, Western investors, particularly ETFs and macro-oriented capital, tend to behave as conviction buyers, while households in emerging markets, primarily in Asia, represent the core of opportunistic demand, accumulating primarily during periods of price weakness.
Q1/2026 offered a textbook illustration of how investment demand behaves in a mature bull market. Within less than 30 days, gold prices surged by more than 20%, pushing volatility above 30%.
This rapid ascent triggered significant profit-taking, with more than 150 t liquidated by February, pushing outflows to levels not seen since the pandemic. However, the subsequent correction in March was not driven by a deterioration in fundamentals but by a shift in financial conditions.
A stronger US dollar, rising bond yields, and increasing uncertainty surrounding Federal Reserve policy weighed on investor positioning. Likewise, broad equity market selloffs forced investors to liquidate gold holdings to raise cash, reinforcing the decline. As repeatedly observed in previous cycles, gold’s liquidity makes it one of the first assets to be sold in periods of financial stress, even when the underlying drivers remain intact.
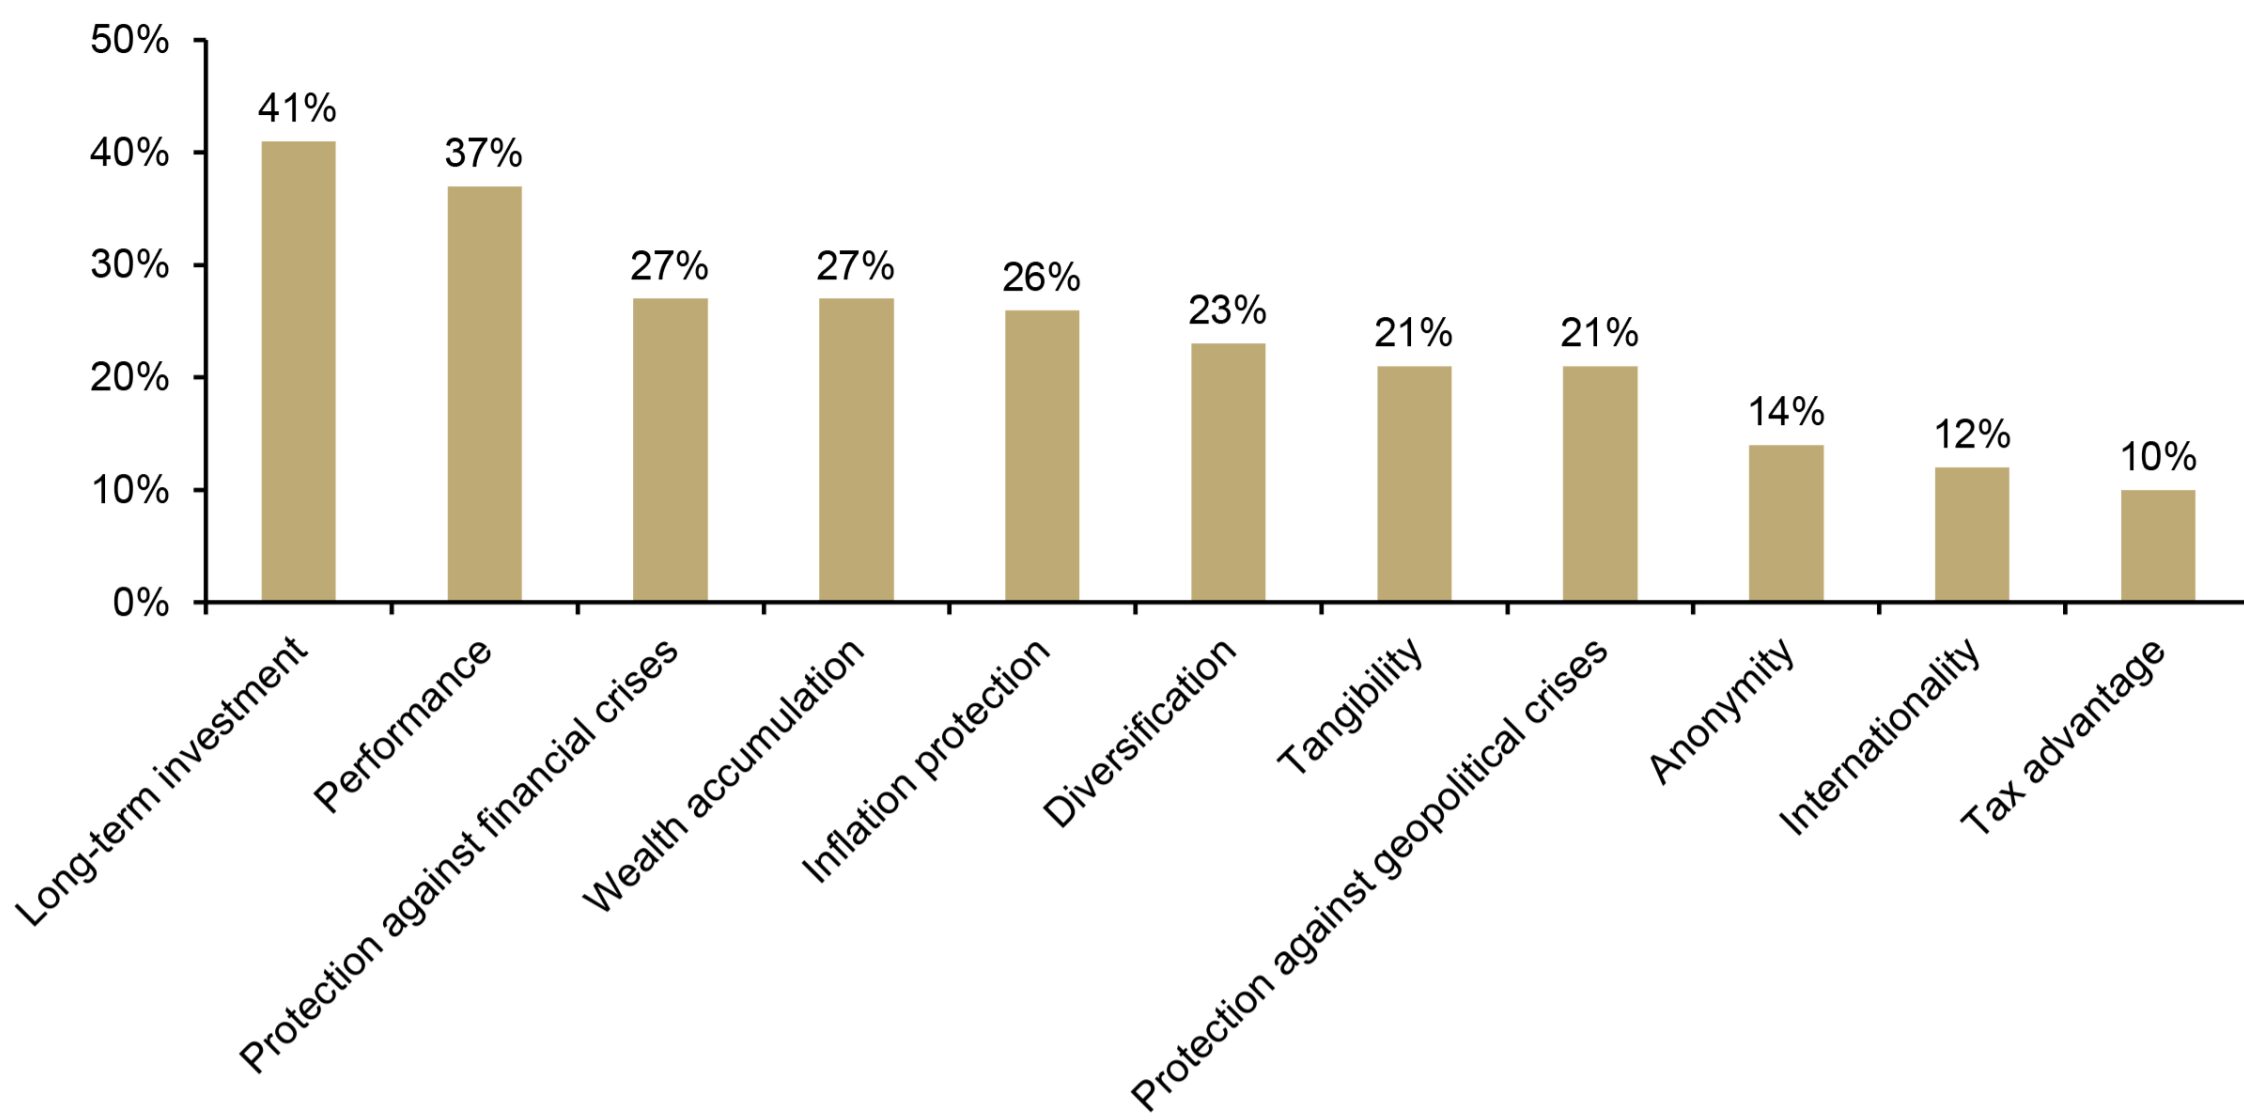
At its core, gold investment demand continues to be driven by a consistent hierarchy of motives centered on wealth preservation and financial resilience. This is confirmed by the Precious Metals Study Switzerland 2025 (Schweizer Edelmetall-Studie 2025), conducted by the University of St. Gallen for ph iloro, which finds that investors primarily view gold as a long-term store of value, complemented by its role as a hedge against inflation, economic crises, and geopolitical instability. While factors such as portfolio diversification, performance potential, and the tangible nature of gold also contribute to its appeal, these remain secondary to its fundamental purpose as a safeguard against systemic risk. Essentially, regardless of geography or investment vehicle, gold is acquired not merely to generate returns but to preserve purchasing power in an increasingly uncertain monetary environment.
Reasons for Investing in Precious Metals, 2025
Source: Philoro, Incrementum AG
Bar and Coin Demand
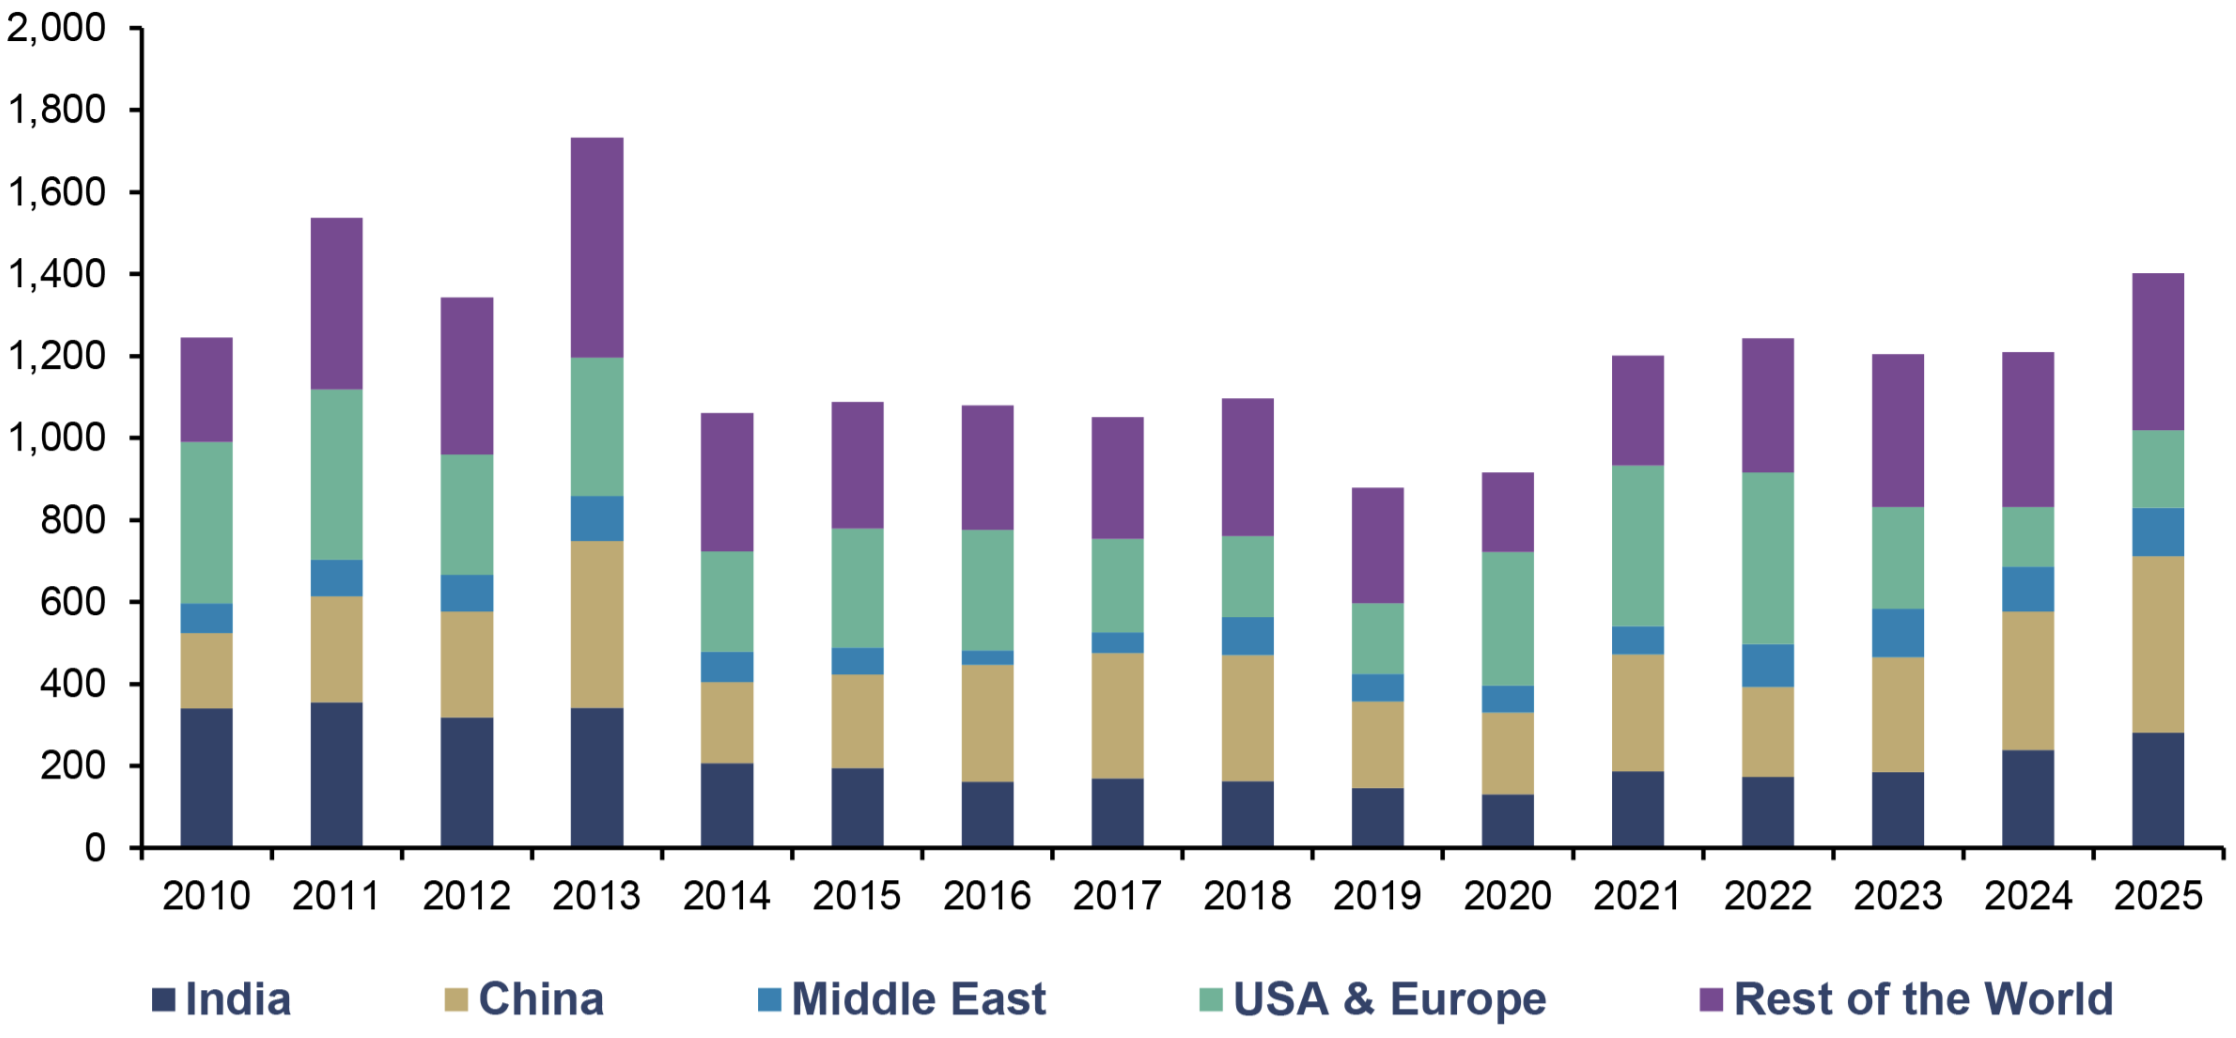
Unquestionably, physical investment demand remains the most stable component of the gold market. In 2025, bar and coin demand reached 1,374 t, making it the highest level in more than a decade.
Notably, Asia was once again at the center of this development. Zooming in, Chinese demand alone amounted to 444 t, while India recorded 280 t, with both marking multi-year highs.
Gold Bar & Coin Demand, in Tonnes, 2010–2025
Source: World Gold Council, Incrementum AG
The drivers behind this demand are both structural and cyclical. In China, the prolonged weakness of the property sector, declining yields on traditional financial assets, and rising geopolitical tensions have reinforced gold’s role as a preferred store of value. In India, cultural affinity, rising incomes, and increasing financial uncertainty continue to underpin demand, with a noticeable shift from jewelry toward investment products.[1]
Beyond these two Asian countries, the Middle East has also emerged as an increasingly important center of physical demand. Last year was its strongest on record, with bar and coin demand reaching 118.2 t, reflecting the region’s growing role as both a financial hub and a trading nexus. This segment of the market behaves differently from financial investors. In essence, households rarely liquidate their gold holdings in response to short-term price movements. Instead, they tend to accumulate on dips, effectively creating a structural floor beneath the market. This characteristic has already been visible in early 2026, when continued buying in China and India helped absorb selling pressure during the double-dip corrections in February and March.
ETF Demand
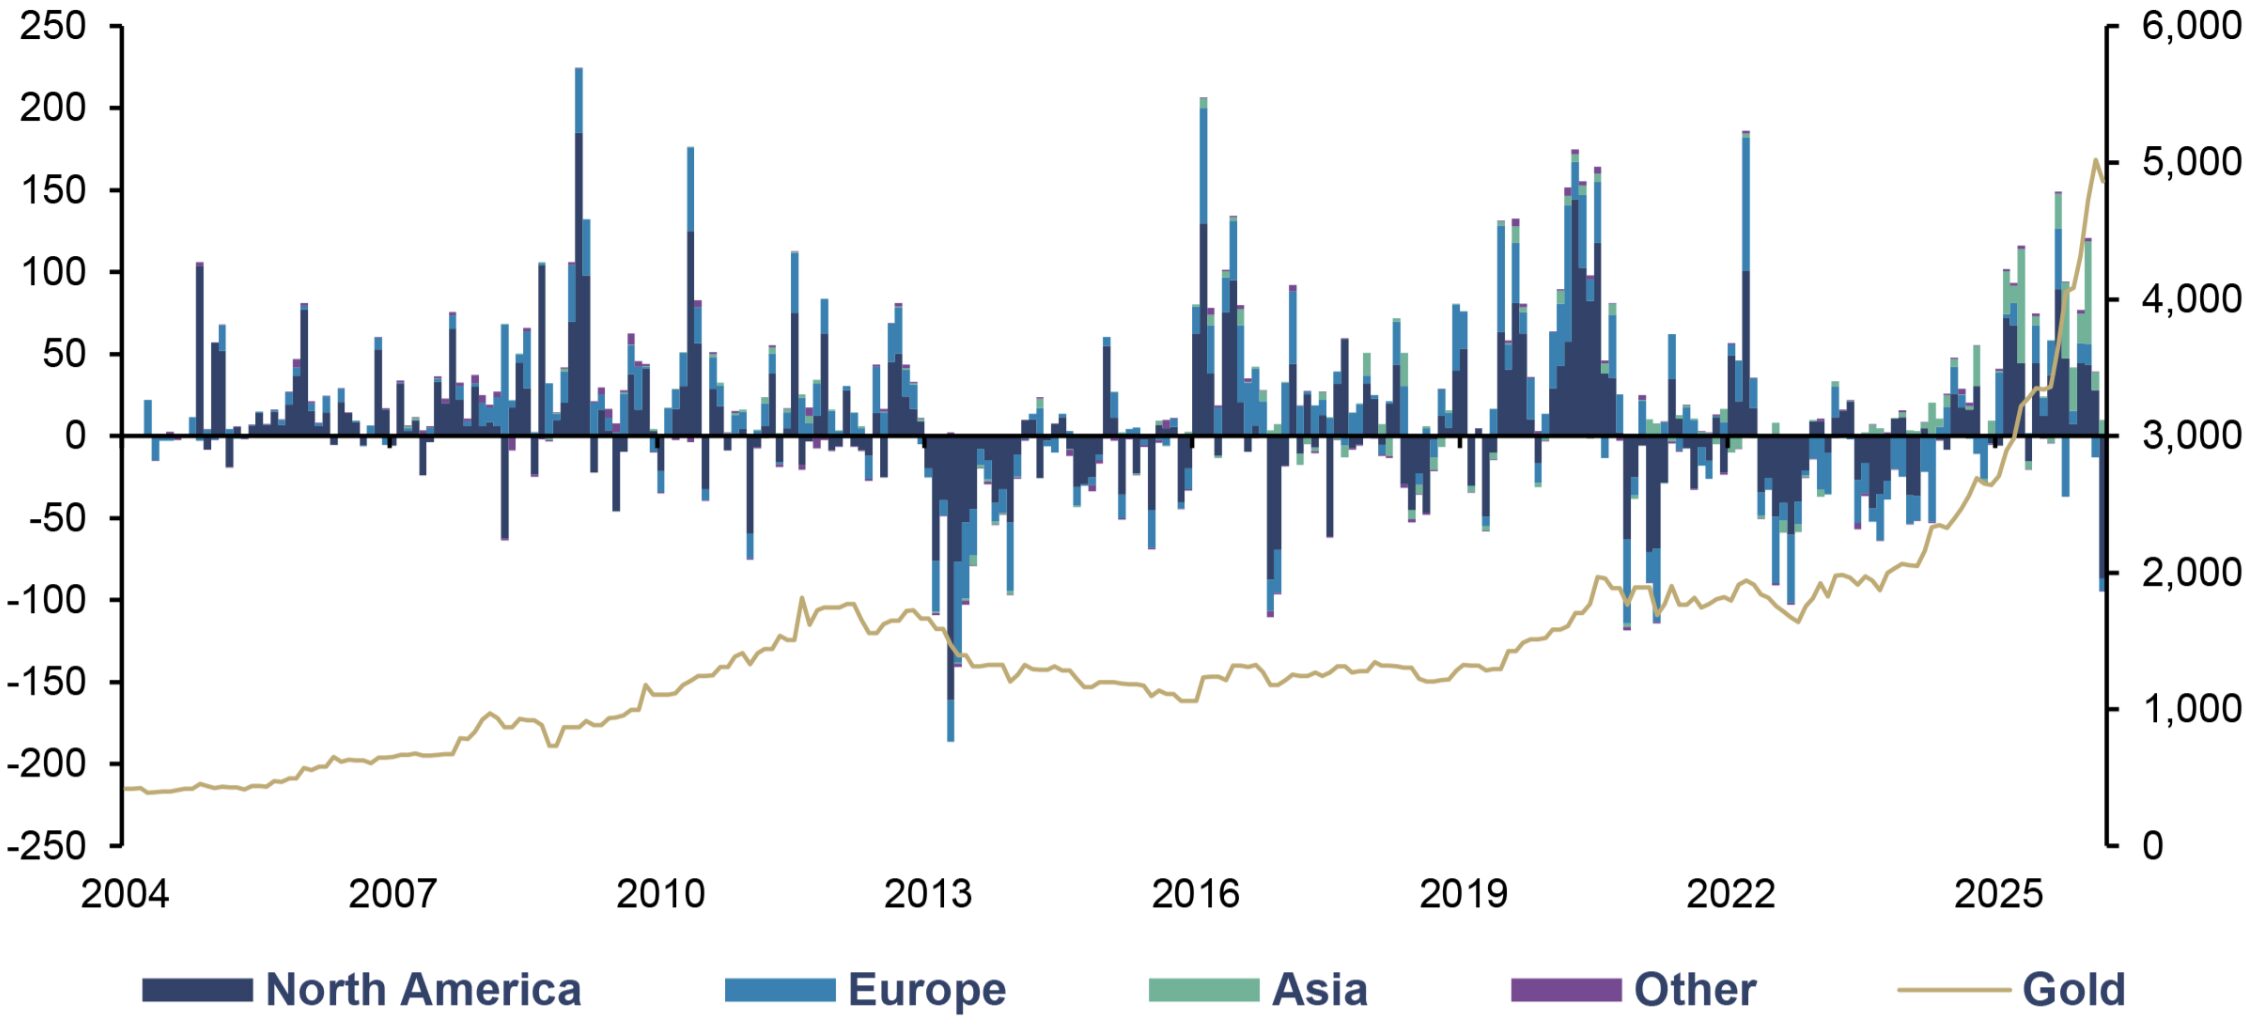
Nevertheless, nowhere was the conviction vs. opportunistic buyers’ dichotomy more visible than in the ETF market recently. While in 2025 physical investment demand remained heavily concentrated in Asia, the ETF market continued to be dominated by Western financial centers, particularly North America.
2025 marked a turning point for ETF demand. Global physically backed gold ETFs recorded net inflows of approximately USD 89bn, or 801 t, the second strongest annual inflows ever recorded. These inflows pushed global ETF holdings to 4,025 t, with assets under management reaching a new all-time high.
Of note, North American funds played the leading role in this surge. In fact, North American ETFs accounted for roughly 57% of total global inflows, highlighting the continued importance of the United States as the primary hub for gold-related financial investment.
Monthly Gold ETF Flows by Region (lhs), in Tonnes, and Gold (rhs), in USD, 01/2004–03/2026
Source: World Gold Council, Incrementum AG
Nevertheless, the structure of ETF demand is gradually evolving. While North America continues to dominate in absolute terms, Asia is gaining increasing prominence in ETF flows and holdings. Asian gold ETFs experienced a record year in 2025, attracting USD 25bn in inflows, an amount that exceeds the cumulative inflows recorded in the region between 2007, when the first Asian gold ETF was launched, and 2024.
If there were still any doubts about the rise of Asia, this year’s opening quarter cleared them all. In March, following the Iran war that began at the end of February, global gold ETFs experienced record monthly outflows of approximately 84.8 t, the largest decline since September 2022. This reversal was overwhelmingly driven by Western markets.
North American ETFs alone saw holdings decline by 87 t in March, resulting in net outflows of 15.7 t for the quarter. Similarly, European ETFs recorded outflows of 7.3 t in March, extending February’s weakness and bringing total quarterly outflows to 7.5 t.
Yet, despite this pronounced Western selling, the global picture remained constructive. Gold ETFs still recorded net inflows of 62 t in Q1/2026, as strong demand from Asia more than offset Western outflows.
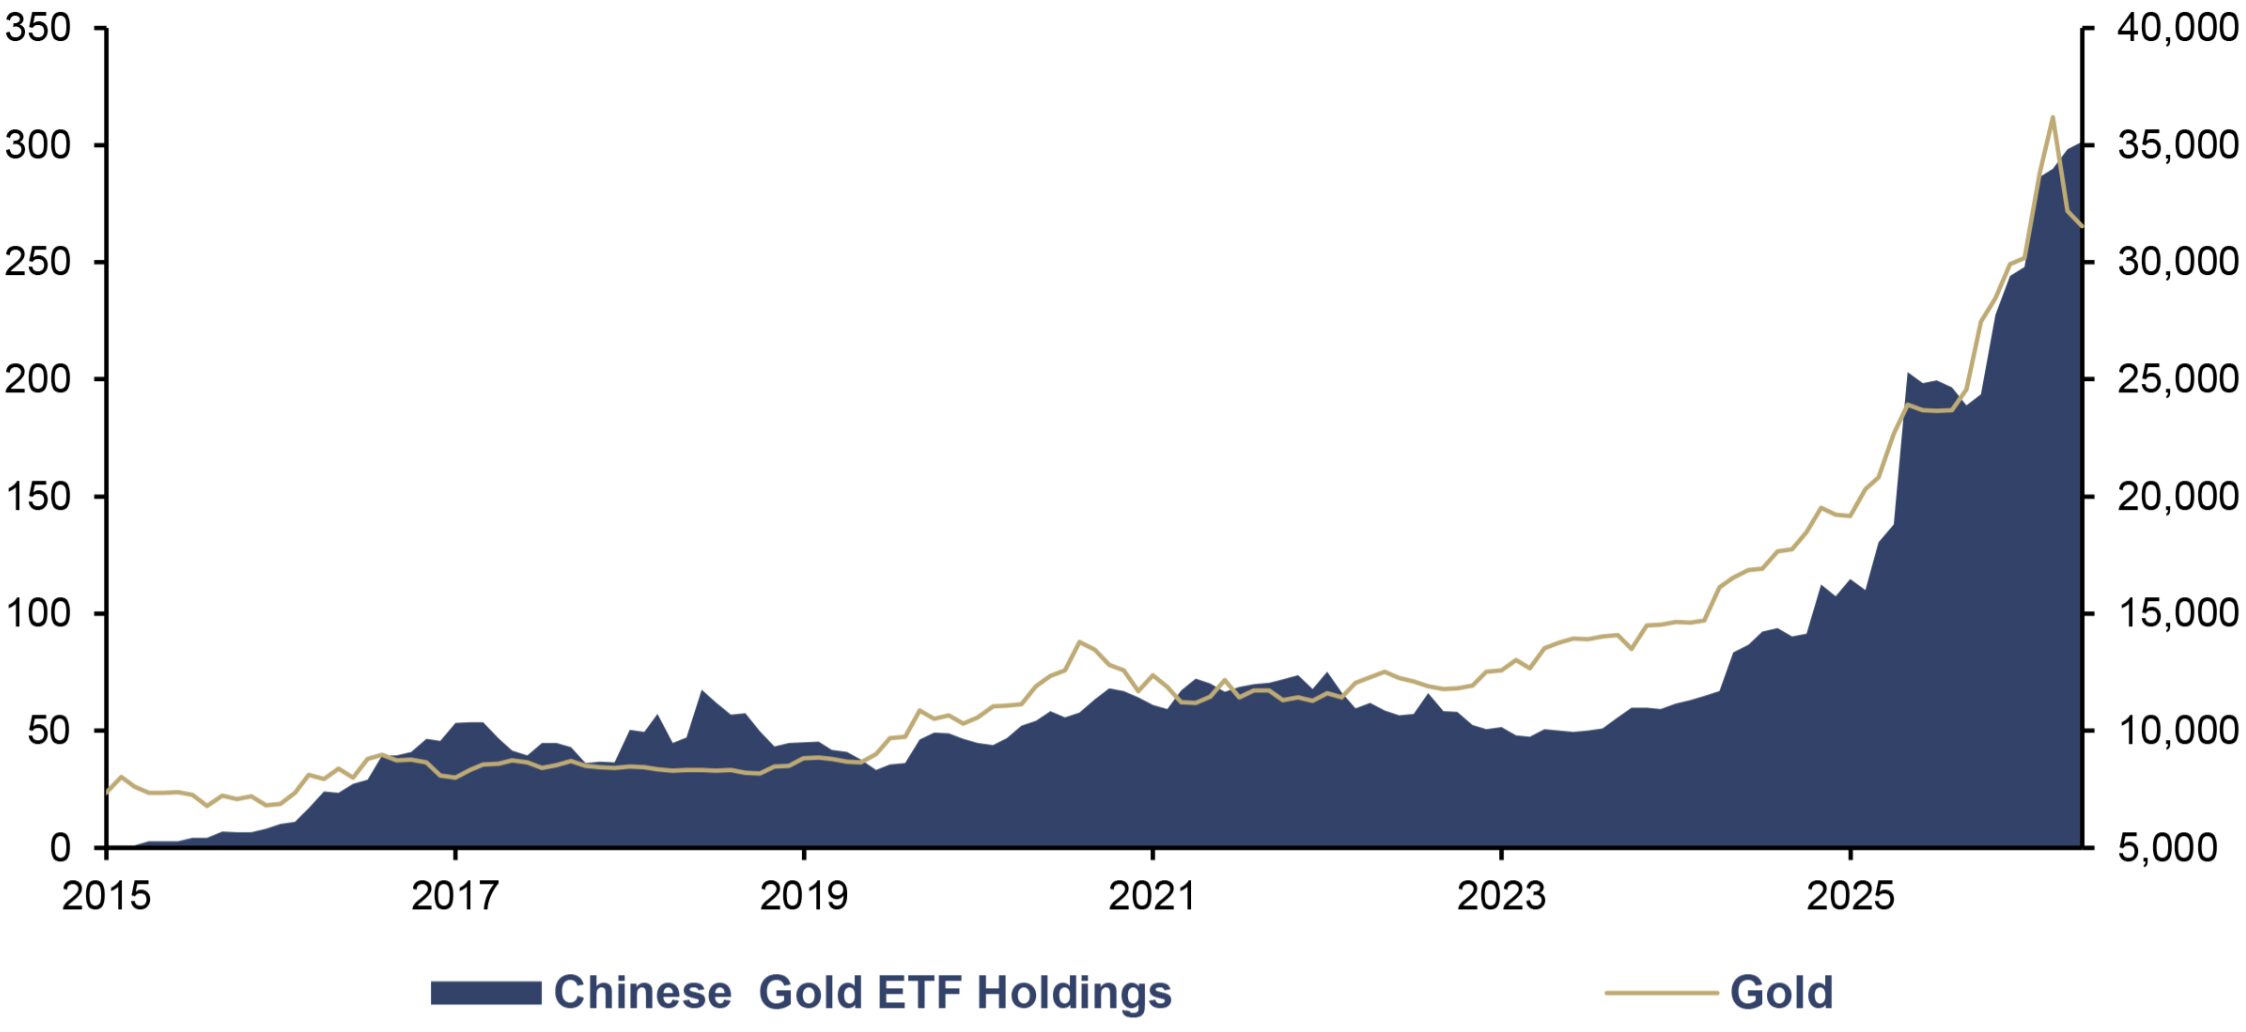
Incredibly, Asian ETFs delivered their strongest quarter on record, led by China and India. Chinese funds alone accounted for the majority of regional inflows, driven by a combination of safe-haven demand, equity market weakness, and currency depreciation.
Chinese Gold ETF Holdings (lhs), in Tonnes, Gold (rhs), in CNY, 01/2015–04/2026
Source: World Gold Council, LSEG, Incrementum AG
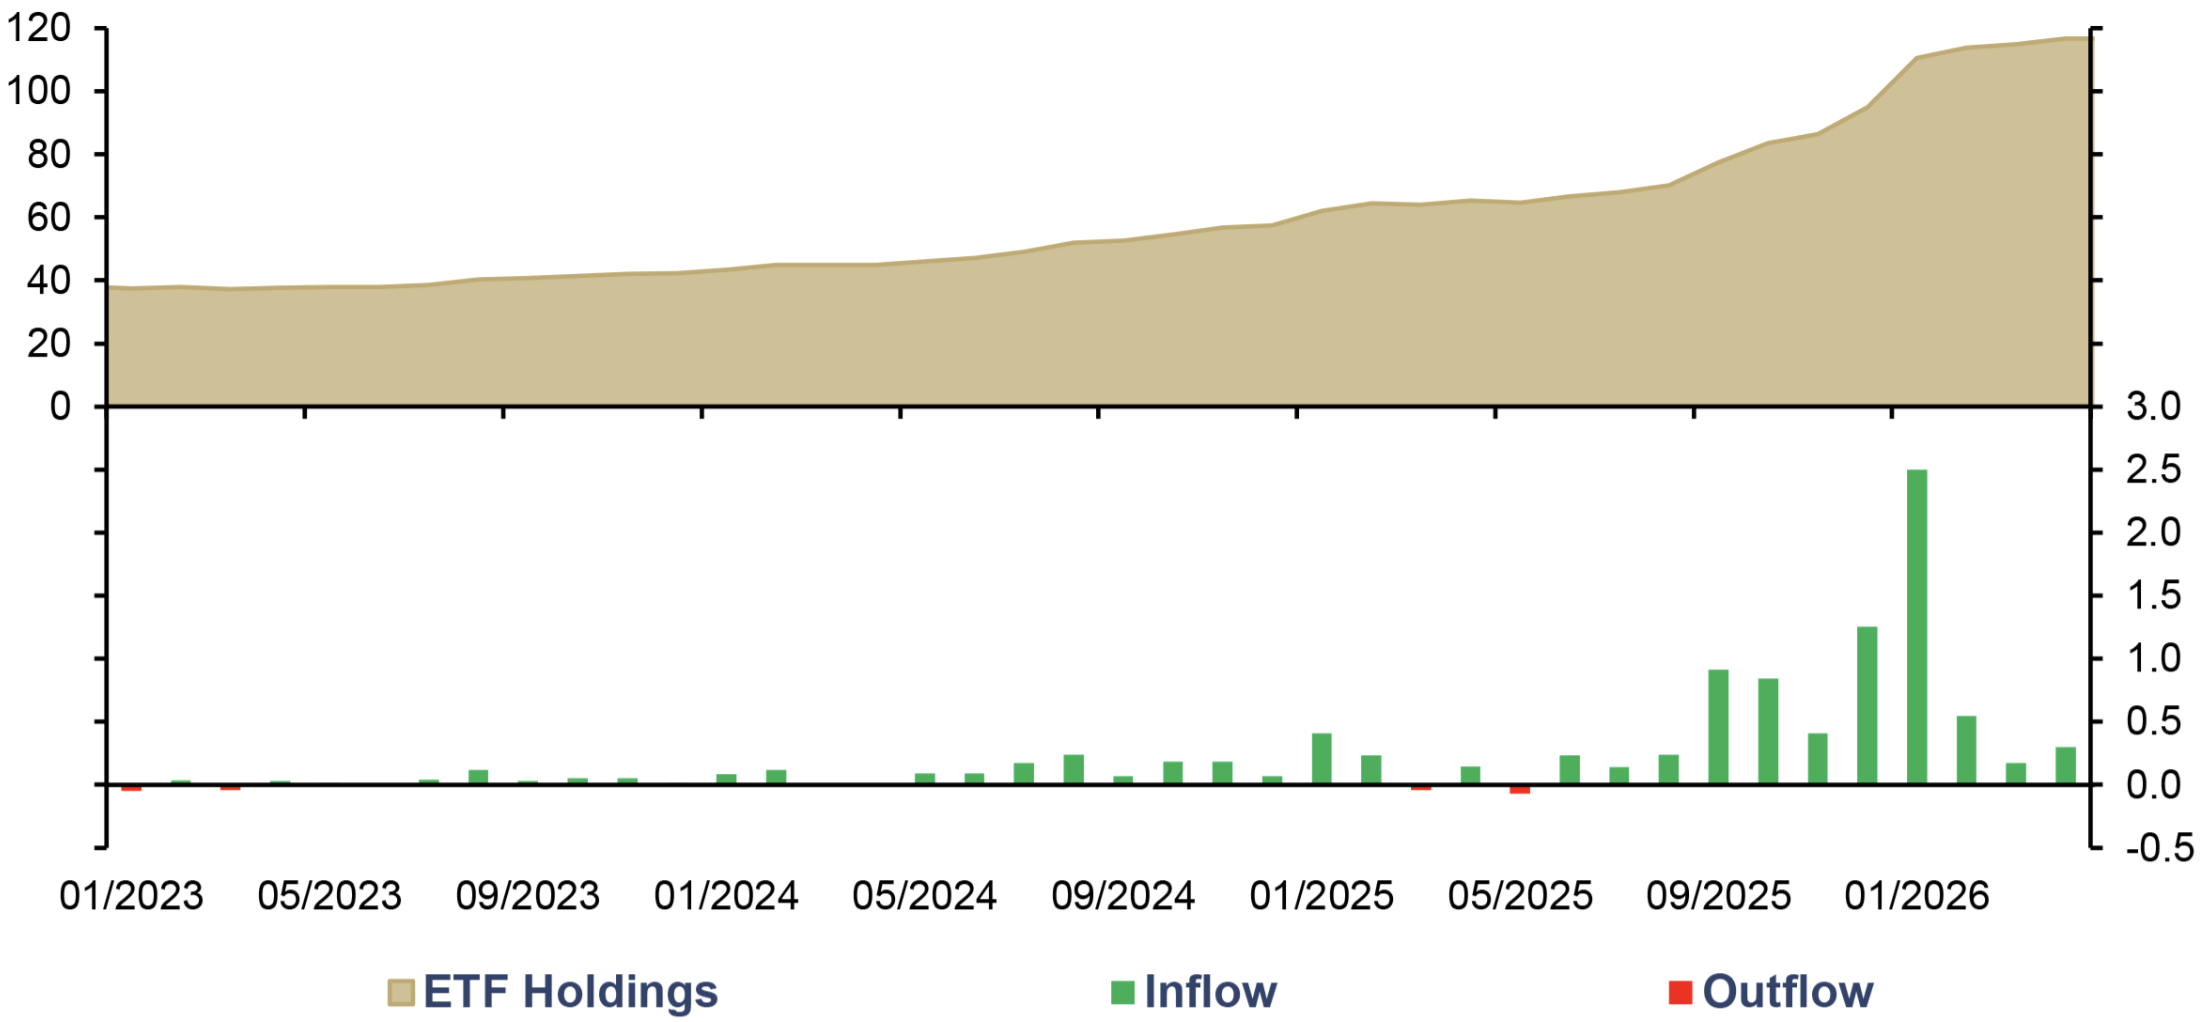
On the same note, Indian investors continued to increase allocations, supported by both structural and cyclical factors.
Indian Gold ETF Holdings (lhs), in Tonnes, and Flows (rhs), in USD bn, 01/2023–04/2026
Source: World Gold Council, Incrementum AG
This divergence neatly reflects the interaction between different investor types. Western ETF investors, acting as conviction buyers, drove both the earlier rally and the subsequent liquidation, while Asian investors increasingly stepped in during the correction, reinforcing their role as opportunistic buyers and helping to stabilize the market.
Liquidity and Market Depth: A Bull Market Under Stress
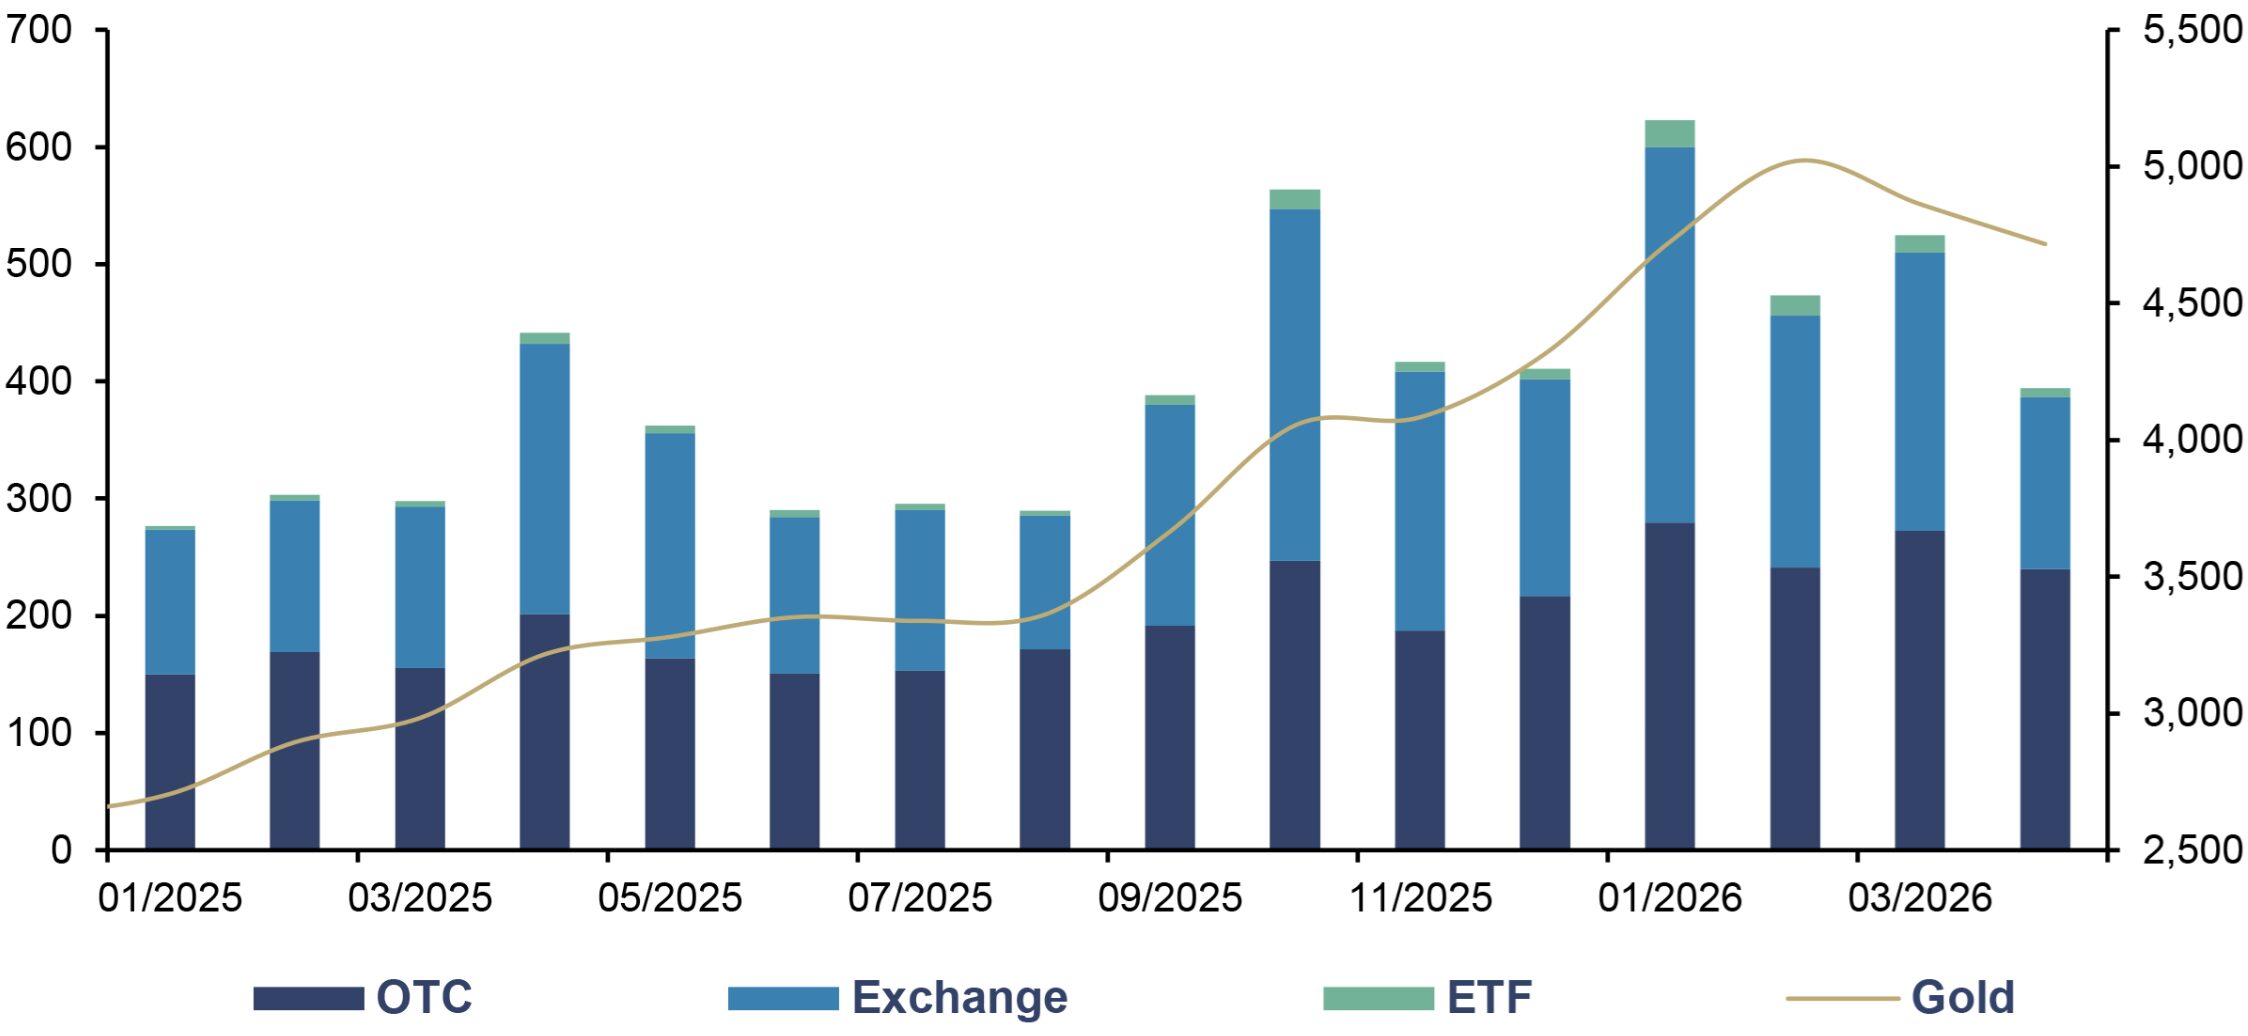
Another notable feature of Q1/2026 was the continued expansion of gold market liquidity. Despite the sharp correction in March, trading activity remained exceptionally strong. Global gold trading volumes averaged approximately USD 525bn per day, making March the third-highest month on record in dollar terms. In all trading segments, from OTC, exchanges, and ETFs, activity has expanded gradually.
This resilience underscores an important point: The gold market is not only deep but is becoming increasingly liquid across all venues. Far from signaling weakness, the surge in trading volumes during the correction reflects heightened engagement from both institutional and retail participants.
Daily Gold Trading Volumes, in USD bn, 01/2025–04/2026
Source: World Gold Council, Incrementum AG
Jewelry Demand
While investment demand surged in 2025, jewelry demand declined in volume terms as a direct consequence of record-high gold prices. Global jewelry demand fell to 1,543 t, representing a decline of approximately 18% compared with the previous year. The decline was particularly pronounced in China and India, the two largest jewelry markets. Chinese jewelry consumption dropped to 386.1 t, while Indian demand amounted to 430.5 t, after both had already fallen, slightly in India and significantly in China in 2024. In fact, China recorded its lowest jewelry demand since 2010, while India experienced its second-lowest demand on record, surpassed only by the pandemic year of 2020.
Global Gold Jewelry Demand, in Tonnes, 2024–2025

Source: World Gold Council, Incrementum AG
Gold Supply
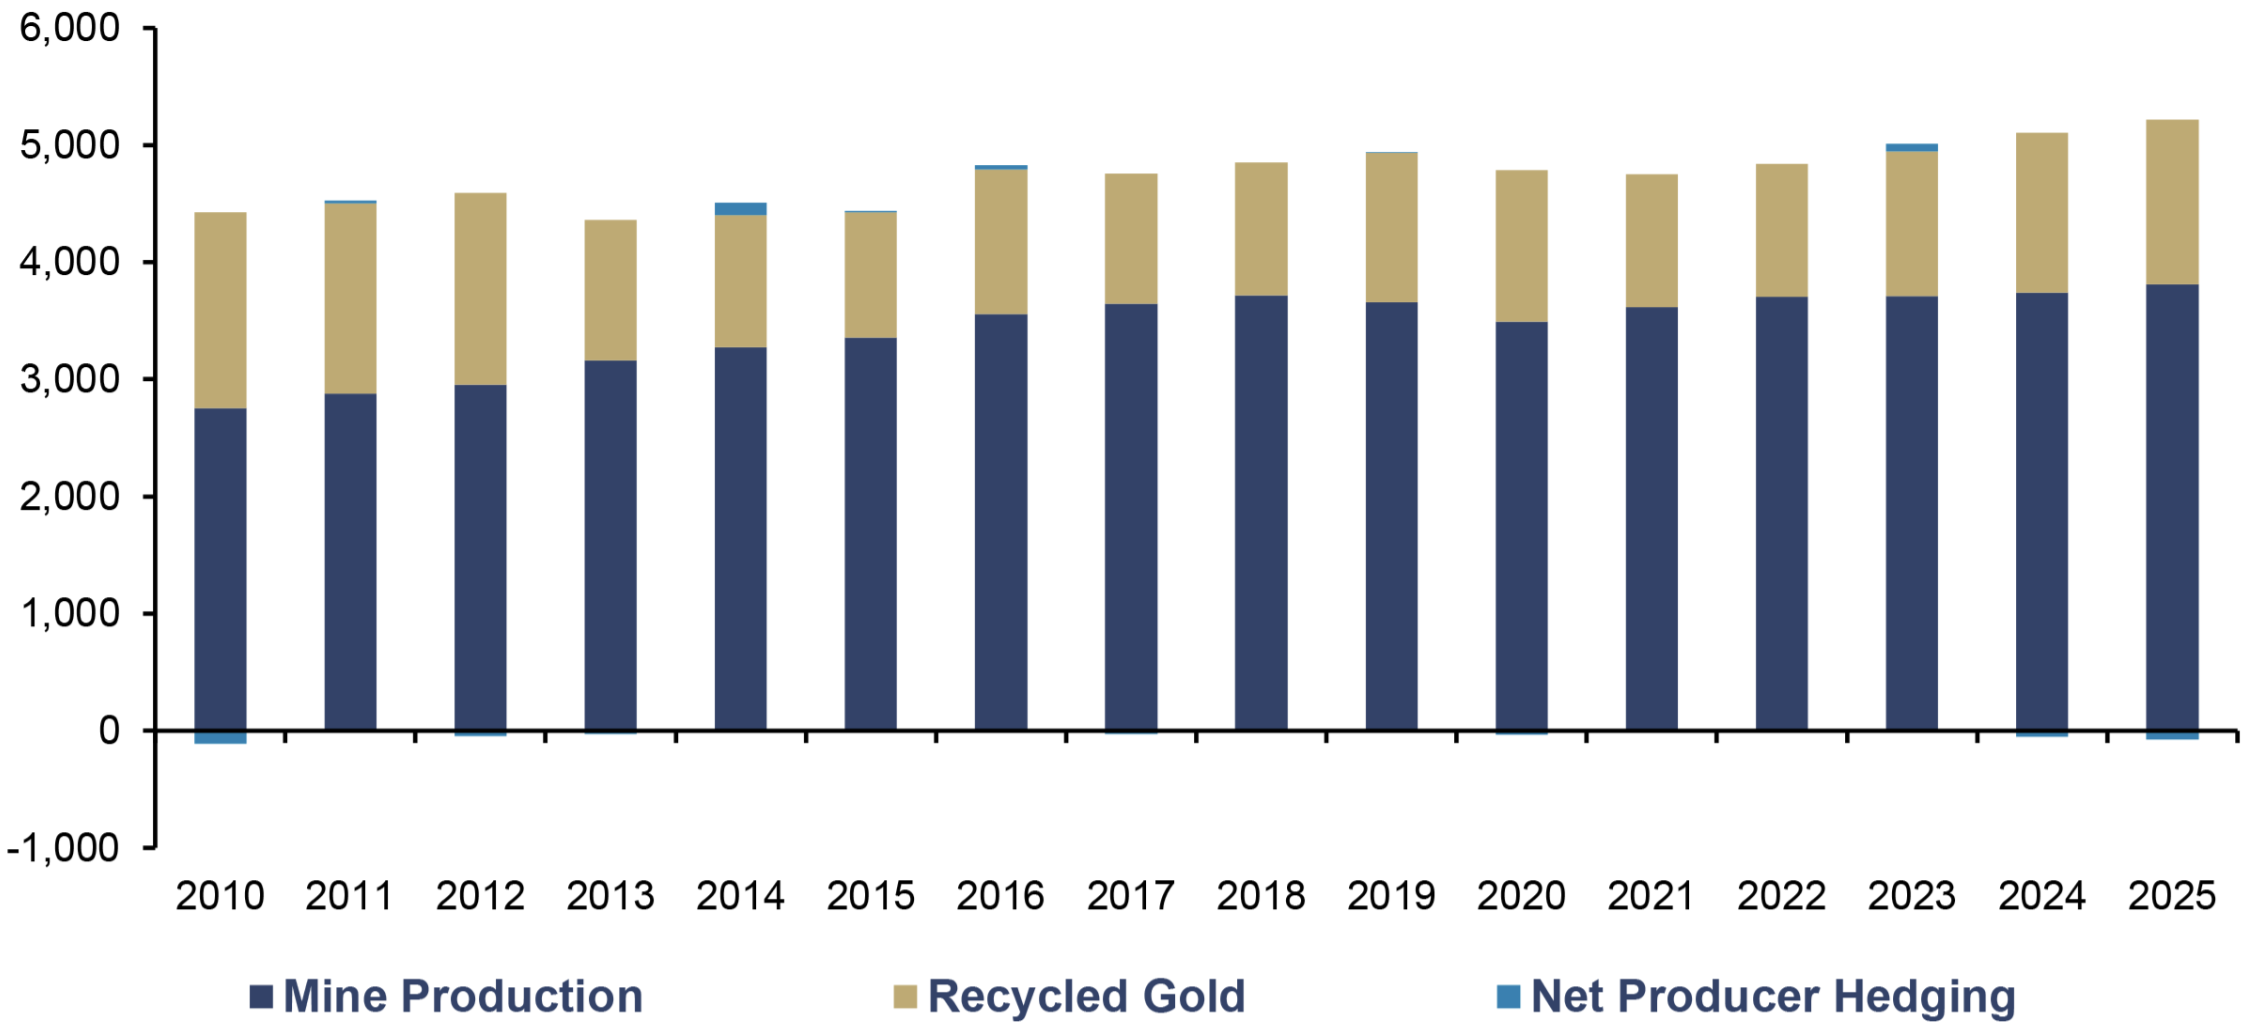
On the supply side, the gold market remained relatively stable in 2025. Total gold supply amounted to 5,002 t, representing a modest increase of around 1% compared with 2024, as mine production continued its gradual ascent to a new record.
The supply breakdown was as follows:
- mine production: 3,672 t
- recycled gold: 1,404 t
- net producer hedging: –74 t
Global Gold Supply by Source, in Tonnes, 2010–2025
Source: World Gold Council, Incrementum AG
The subdued response of recycling to record-high prices remains one of the more intriguing features of the current cycle. Historically, rising prices have incentivized holders to sell, boosting secondary supply. This time, however, the reaction has been muted. It is as if homeowners in a red-hot housing market collectively decided not to sell, not because they couldn’t but because they expected prices to continue rising.
In other words, expectations of further appreciation, combined with the absence of acute financial stress, reduced the incentive to liquidate existing gold holdings. However, the developments of the last quarter certainly altered the sentiment of gold holders.
Conclusion
Breaking down the structure of global gold demand reveals the evolving architecture of the gold market. In 2025, total demand consisted of several major components:
- jewelry: 1,638 t
- technology: 323 t
- bars and coins: 1,374 t
- ETFs and similar products: 801 t
- central banks: 863 t
The structure of the gold market is undergoing a profound transformation that increasingly mirrors the broader transition toward a multipolar global economy. Indeed, the resilience of Asian demand was evident in early 2026.
In a nutshell, geopolitical events, in addition to influencing demand, are increasingly affecting the physical flow of gold, markedly in emerging markets. The intensification of conflicts in the Middle East has significantly disrupted air transport routes, with cargo prioritization shifting toward essential and perishable goods. On this account, gold shipments, particularly to key consumer markets, have been constrained.
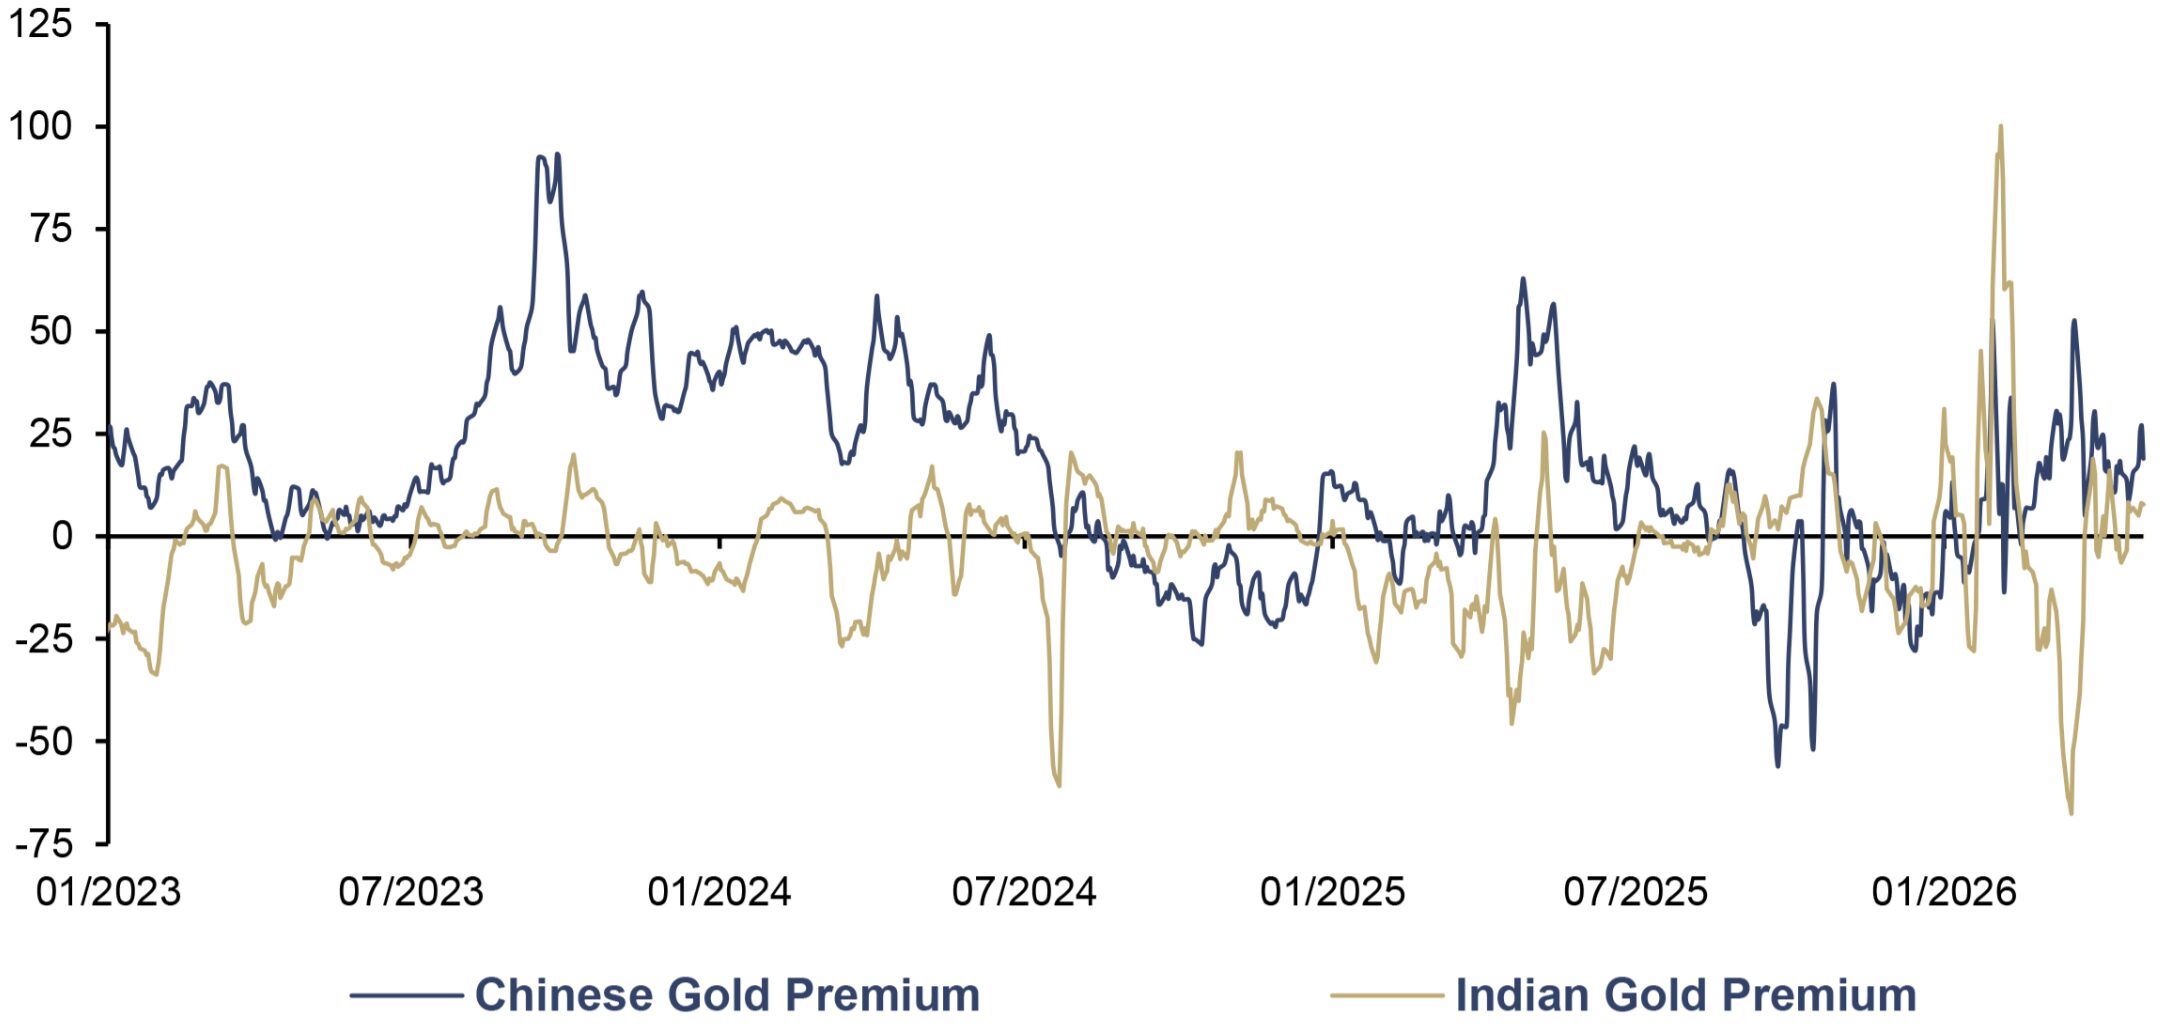
The United Arab Emirates, a crucial refining and trading hub, has been exceptionally affected. Given that India sources approximately one-third of its gold imports from the UAE, logistical bottlenecks are likely to weigh on demand in the Indian subcontinent. Unmistakably, these frictions are producing observable market distortions, with premiums in China and India rising, while those in Dubai are declining.
Gold Premium/Discount in China and India, in USD, 01/2023–04/2026
Source: World Gold Council, Incrementum AG
Evidently, there is a geographical division in the global gold market. Intriguingly, this regional asymmetry seems to parallel the global economy itself. Demand has shifted East, where gold is accumulated, held, and culturally embedded; while the “financial services” layer remains firmly anchored in the West, where capital flows, leverage, and price formation are concentrated.
This hybrid structure of pricing dynamics has become clearly apparent. In recent years, gold has frequently traded at premiums in Chinese and Indian markets relative to Western benchmark prices.
Understanding the structure of the global gold market becomes far clearer when viewed through the lens of conviction buyers and opportunistic buyers.
On the one hand, conviction buyers, who are primarily central banks and Western institutional investors, set the direction of the market. Central banks accumulate gold largely independent of price, driven by long-term strategic considerations such as monetary sovereignty and reserve diversification. Western investors, particularly through ETFs and macro-oriented strategies, tend to reinforce trends, allocating capital aggressively during periods of price momentum. Together, these actors create powerful directional moves, absorbing supply and pushing prices higher.
On the other hand, opportunistic buyers are predominantly households in emerging markets, especially in China, India, and the Middle East. Their behavior is markedly different: Highly price-sensitive, they tend to accumulate gold during corrections and step back during rallies, but seldom sell. This creates a stabilizing force within the market, providing a floor during downturns and moderating excessive upside.
This dynamic has become clearly visible. The sharp correction in March, driven by Western ETF outflows and tightening financial conditions, was met with renewed physical demand in Asia, preventing a more severe decline. What might have otherwise evolved into a deeper sell-off instead proved to be a contained and ultimately constructive correction.
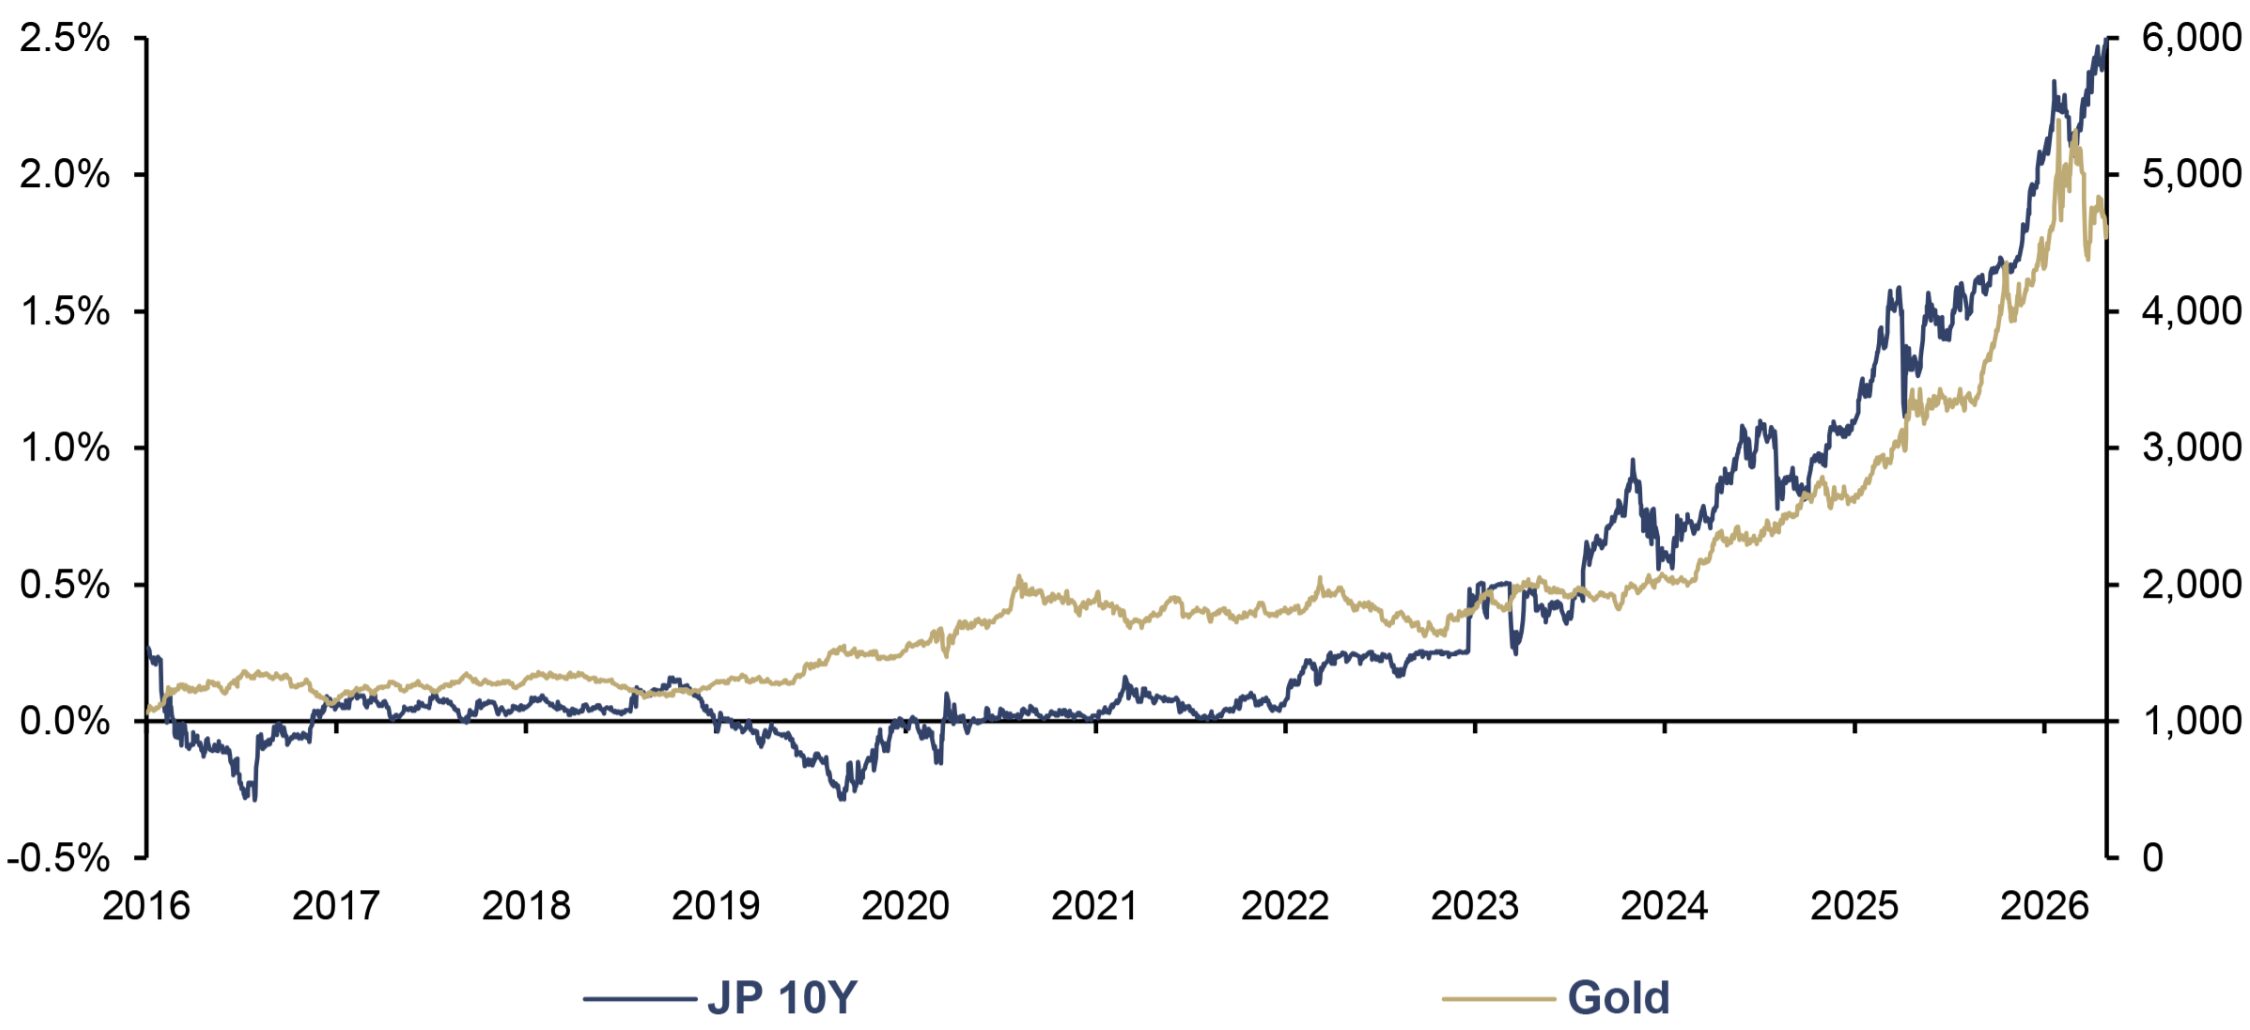
Beyond the physical dynamics, developments in global bond markets may be reinforcing gold’s role within the financial system. In particular, Japan’s government bond market, long considered one of the most stable pillars of global finance, is showing signs of strain. This matters because the JGB market is the second-largest sovereign bond market in the world and a cornerstone of global financial stability. If confidence in such a market begins to erode, the implications extend far beyond Japan. That being said, the observed correlation between rising JGB yields and the gold price reflects a deeper shift. As traditional safe haven assets come under pressure, gold increasingly reasserts itself as the ultimate store of value.
The bear market in Japanese government bonds – with the 40-year yield breaking above 4% for the first time since 2007 and the 10-year yield reaching levels not seen since 1999 – provided a real-time illustration of this dynamic. When the world’s second-largest sovereign bond market trembles, the flight to gold is not merely a portfolio rebalancing; it is a verdict on the sustainability of the global debt architecture.
JP 10Y (lhs), and Gold (rhs), in USD, 01/2016–04/2026
Source: LSEG, Incrementum AG
For several years, we have been expecting that the Chinese exchanges might eventually challenge Western dominance in price discovery. Notwithstanding, current developments suggest that this transition may be slower than anticipated.
Inventories held by the Shanghai exchanges have been declining, indicating persistent physical withdrawals from the system. Meanwhile, holdings in Western vaults, particularly those linked to the LBMA and COMEX, remain elevated or continue to increase.
In conclusion, the modern gold market is evolving into a globally integrated investment ecosystem, where both physical ownership and financial instruments contribute to the metal’s enduring appeal. Needless to say, this dual structure that is becoming more blurred has important implications for the future of this market.
As Asian wealth deepens and the center of gravity of physical demand continues its eastward migration, the gold market’s dual structure – Western pricing, Eastern accumulation – faces a reckoning. The question is not whether this balance will shift, but when. And if history is any guide, those who hold the physical metal, not paper claims, will define the terms of that transition.
[1] See chapter “India – Structure, Dynamics and Future of the World’s Largest Gold Ecosystem” in this In Gold We Trust report