


The Status Quo of Gold – Conclusion
“All roads lead to gold.”
Kiril Sokoloff
- Five pillars support the gold bull market: the rapid deterioration of government finances, growing anti-US -dollar sentiment, the eroding credibility of the Federal Reserve, the expanding role of institutional investors, and inflation volatility.
- Government bonds: The “risk-free investment” is becoming the “yield-free risk investment”: Global debt reached a record high of USD 348trn at the end of 2025, and the US surpassed the USD 39trn mark in March 2026.
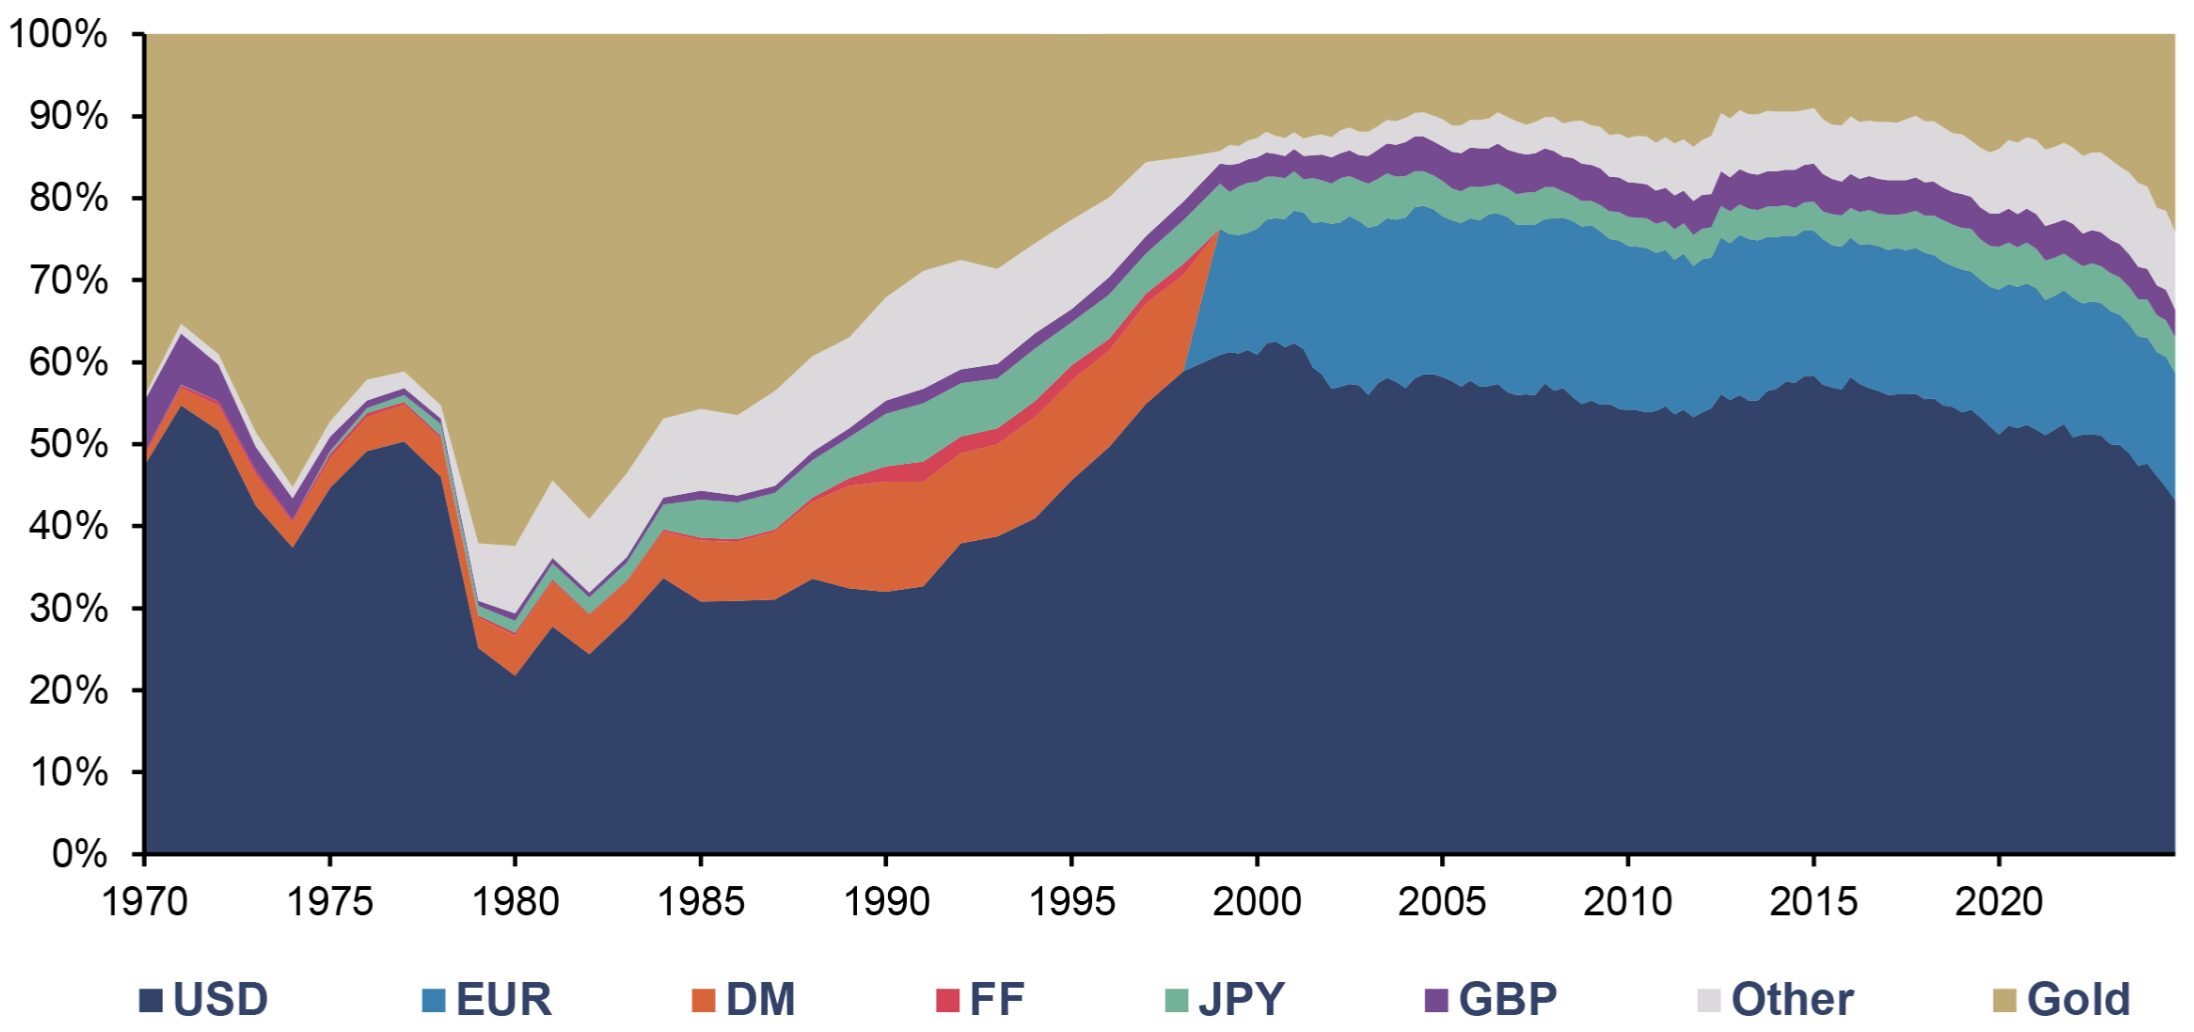
- De-dollarization has entered the mainstream: At 56.9%, the US dollar’s share of global currency reserves is at its lowest level in roughly three decades. Even if the recent decline is partly due to exchange rates, the structural diversification trend remains unmistakable.
- The allocation gap remains wide: Our long-term analysis places the optimal gold allocation between 14% and 20%; Morgan Stanley now recommends 20% gold in a 60/20/20 portfolio. However, institutional investors’ allocations remain in the low single digits. Gold is evolving from a satellite investment to a core investment.
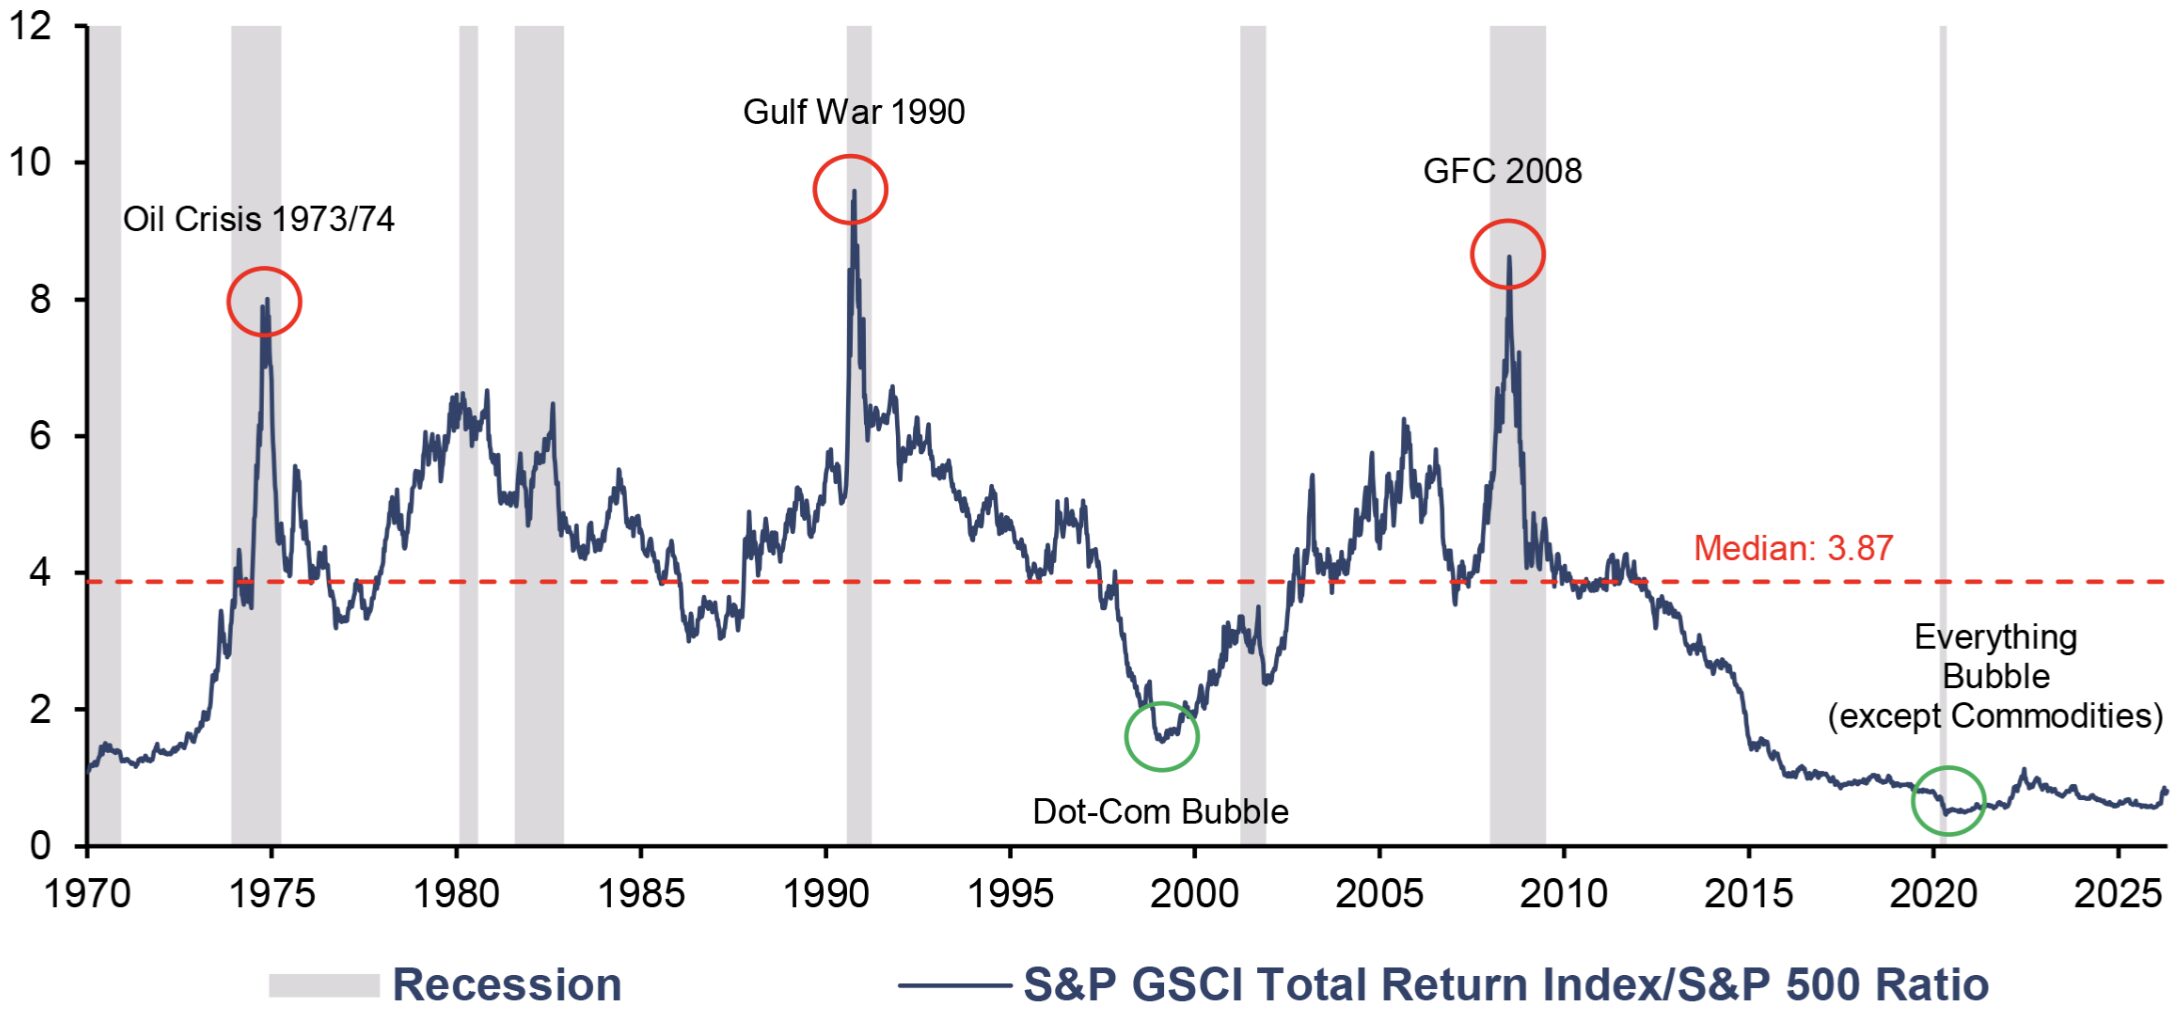
- Commodities remain historically cheap: The GSCI/ S&P 500 ratio stands at 0.81 – well below the longterm median of 3.87. Rarely have real assets been so undervalued relative to financial assets.
- The system is not collapsing; it is melting: Denominator decay makes gold the Switzerland of the currency world – not cheap, but reliable, neutral, and trustworthy.
- The Incrementum Ratios (Oktoberfest beer, iPhone, ski pass) confirm: Gold’s purchasing power is rising steadily.
After our tour de force through the diverse world of gold, we would like to conclude by summarizing the key points. The gold bull market is no flash in the pan, but rather the visible result of tectonic shifts in the global financial system. 2025 and the first months of 2026 did not merely alter individual data points; they shook entire foundations: the sustainability of government finances, the US dollar’s status as a global reserve currency, the credibility of the Federal Reserve, the portfolio architecture of institutional investors, and the inflation expectations of an entire generation of investors. Five pillars, five tipping points – and gold is the common thread that connects them.
The 5 Pillars of the Gold Bull Market
1. Rapid deterioration of public finances
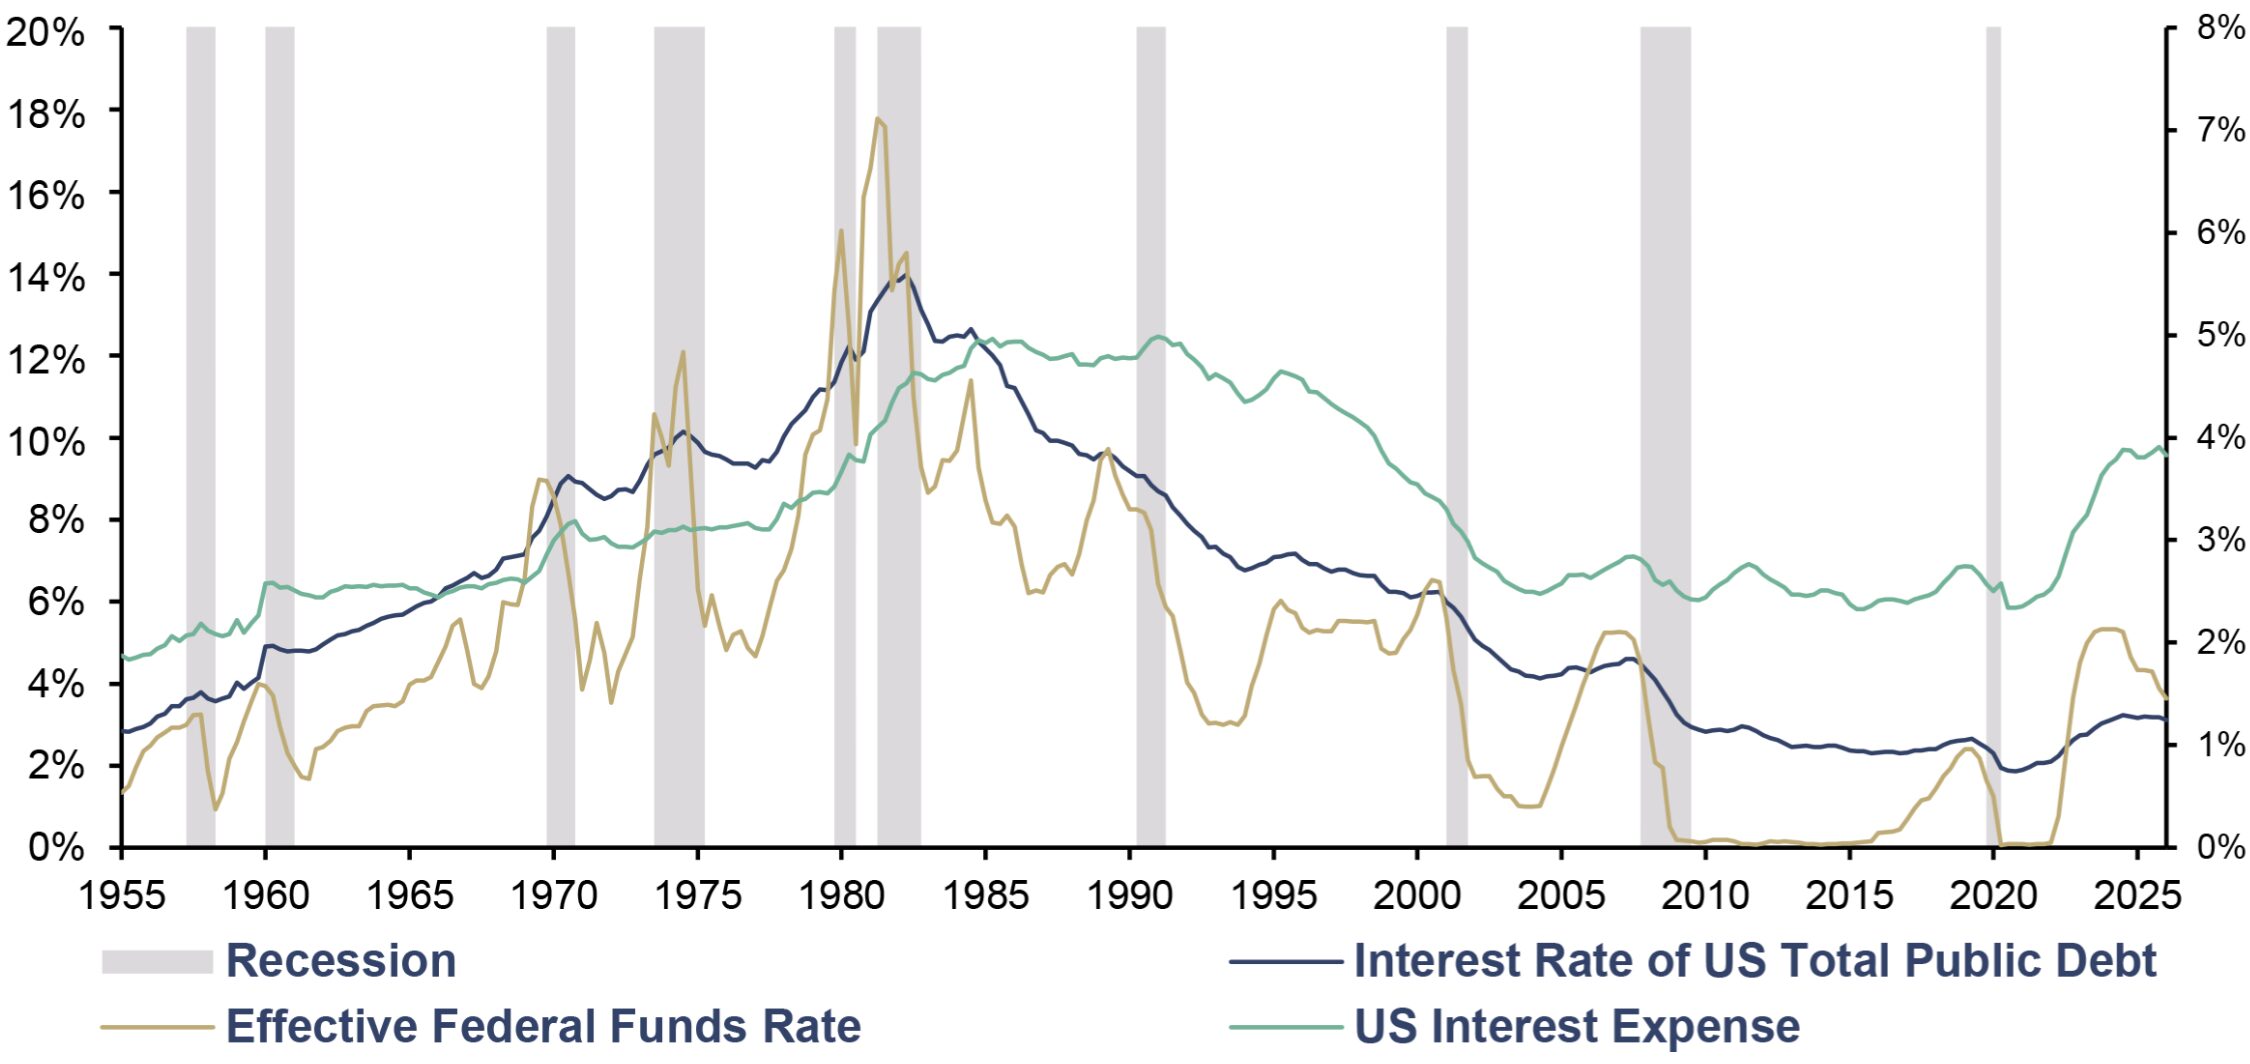
Global debt reached a new record high of USD 348trn in Q4/2025, increasing by USD 29trn over the course of a year. On March 17, 2026, the US surpassed the USD 39trn mark with a public debt-to-GDP ratio of more than 120%; fiscal year 2025 closed with a deficit of USD 1.8trn, and net interest payments once again exceeded the defense budget. Wherever one looks in the OECD world: government debt-to-GDP ratios well into the triple digits, Germany’s departure from its role as a fiscal model – the risk-free investment is increasingly mutating into a yield-free risk investment.
Interest Rate of US Total Public Debt and Effective Federal Funds Rate (lhs), and US Interest Expense (rhs), as a % of US GDP, Q1/1955–Q1/2026
Source: CBO, Federal Reserve St. Louis, LSEG, Incrementum AG
2. Acceleration of anti-US-dollar sentiment
The freezing of Russian currency reserves in 2022 was the paradigm shift that pushed the matter over the edge. Suddenly, the uncomfortable truth could no longer be ignored: US Treasuries were neither “risk-free” nor readily available. Since then, emerging-market central banks in particular have been accelerating their diversification away from the dollar and toward gold – the only reserve asset without counterparty risk.
The statistics confirm this monetary U-turn from two perspectives: Including gold, the US dollar’s share of global central bank reserves has fallen to around 43% – the lowest level since 1994. Excluding gold, i.e., looking purely at foreign exchange reserves, the figure stands at 56.9% – the lowest it has been in about 30 years. Whichever lens you choose, de-dollarization has entered the mainstream.
Composition of Global Total Reserves, 1970–Q3/2025
Source: IMF, World Gold Council, Incrementum AG
3. Eroding credibility of the Federal Reserve
Since September 2024, the Federal Reserve has cut the benchmark interest rate by a cumulative 175 basis points – from 5.25–5.50% to 3.50–3.75%. However, the 10-year Treasury yield has risen by around 50 basis points over the same period. Such a constellation – interest rate cuts accompanied by all-time highs in the S&P 500, M2, government debt, and gold – is historically unprecedented.
The Federal Reserve has effectively buried the implicit 2% inflation target – without ever holding a funeral. The bond market has long understood this: The yield curve no longer prices in credibility, but mistrust. The new Federal Reserve Chair, Kevin Warsh – barely a few days in office – left no doubt at his Senate hearing on April 21, 2026, where he announced a “regime change” and a “new framework for inflation.” The verdict is self-evident: Anyone who needs a new framework has tacitly abandoned the old one.
4. Institutional investors are slowly waking up
Gold ETFs account for just 0.17% of US retail portfolios, which is 6 basis points below the 2012 peak. JPMorgan sees potential for an increase in allocation from the current 2.8% to 4–5%, and Morgan Stanley now recommends a 60/20/20 portfolio consisting of 60% stocks, 20% bonds, and 20% gold. For us, one thing is clear: Gold is evolving from a satellite investment to a core investment.
5. Inflation: the fiscal accelerator
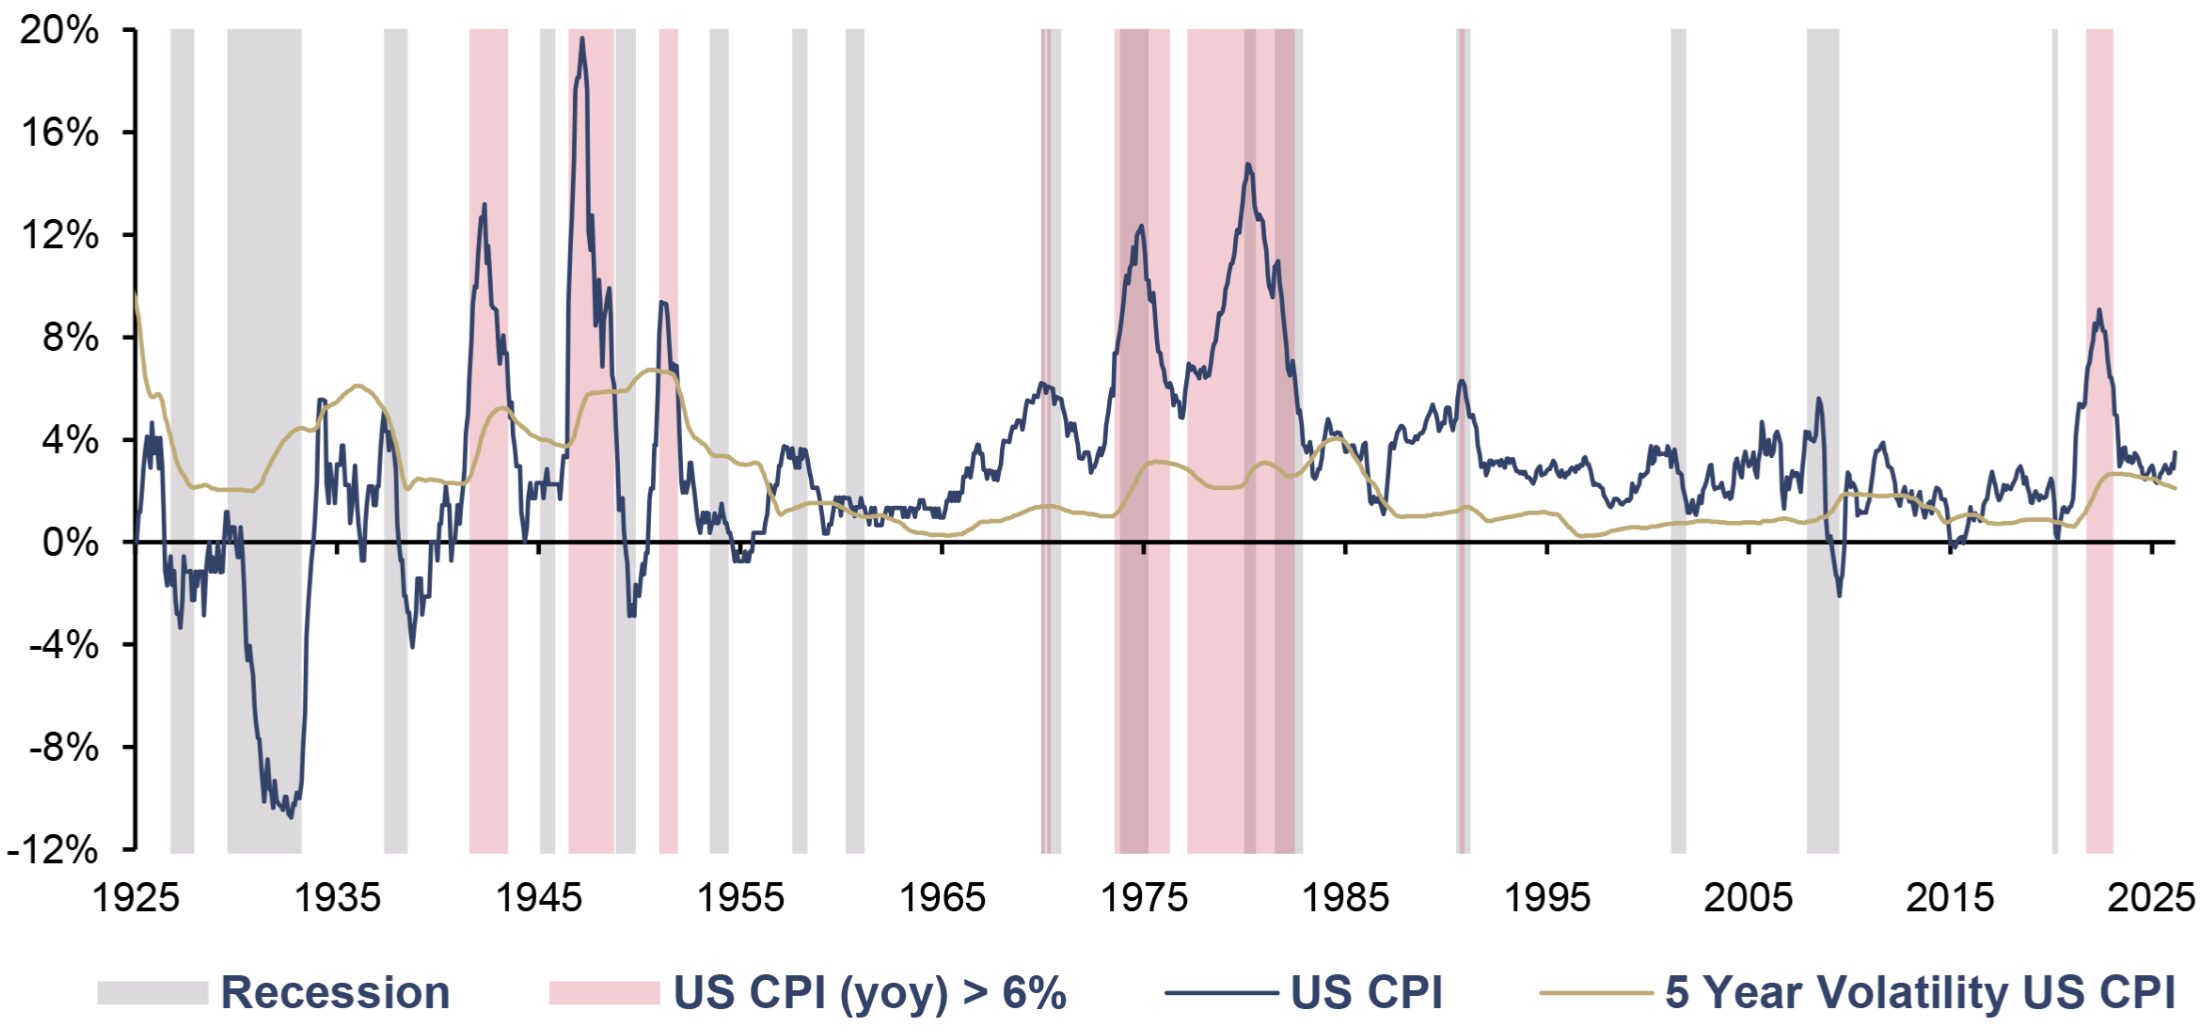
Just how much the bond market still believes in the old 2% world is evident from the breakeven spreads: As of April 2026, they stand at 2.58% for 5 years, 2.38% for 10 years, and just 2.24% for 30 years. The inverted shape of the breakeven-curve is telling: the longer the horizon, the lower the expected inflation – as if the structural drivers of recent years were to vanish overnight. Investors are calibrating their future expectations against a past that structurally ended in 2022, ignoring the fact that the 20th century saw three massive waves of inflation in the US alone: 1940–47, 1966–70, and 1973–82. It is an intellectual wager with an asymmetric payoff profile – and this is precisely where the strategic opportunity for gold lies.
Five pillars, five breaking points – and all point in the same direction. What is unfolding here is not a cyclical phenomenon but a regime shift: The monetary system of the past decades is losing its anchor points, and gold is returning to where it has stood for millennia – at the center.
This return is no coincidence but the logical consequence of fundamental economic laws that cannot be regulated away. Loyal readers know: We always place the monetary function of gold at the forefront of our analyses. Money is subject to the same fundamental economic principles as all goods: Its value is determined by supply and demand. Confidence in the purchasing power of money thus depends largely on expectations regarding the future money supply. If the money supply grows faster than the supply of goods and services, purchasing power will decline sooner or later. This fundamental economic law explains why gold acts as a natural counterweight to unbacked currencies: Its supply cannot be arbitrarily expanded.
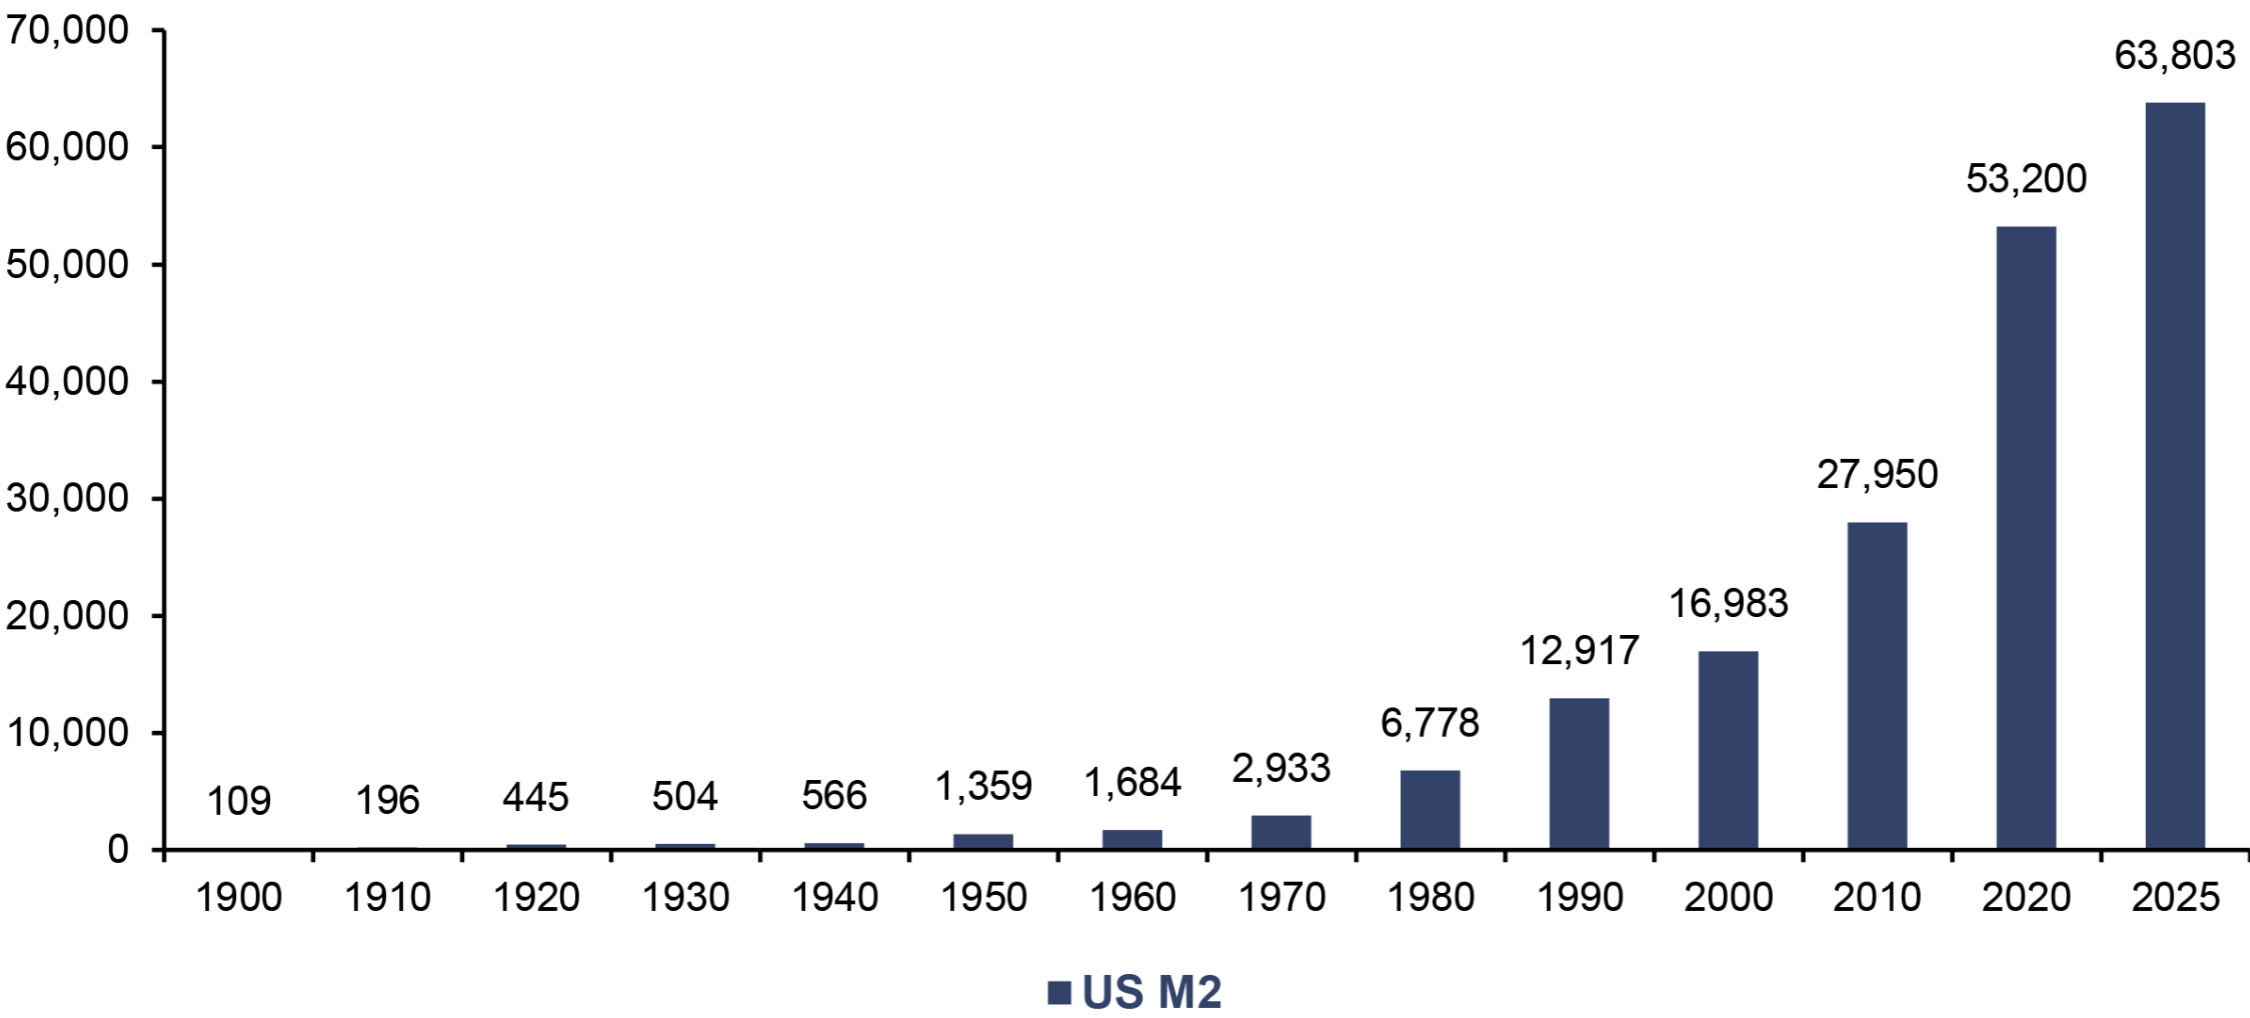
The following chart illustrates this development impressively: While the US population has grown by a factor of 4.5 since 1900, from 76mn to just under 350mn, the M2 money supply exploded from USD 9bn to nearly USD 23trn – a more than 2,500-fold increase. On a per capita basis, this represents an increase of more than 540 times, from USD 109 to over USD 63,000. The money supply has become a shell without substance – growing in nominal terms but devalued in real terms.
US M2 Money Supply per Capita, in USD, 1900–2025
Source: Nick Laird, LSEG, Incrementum AG
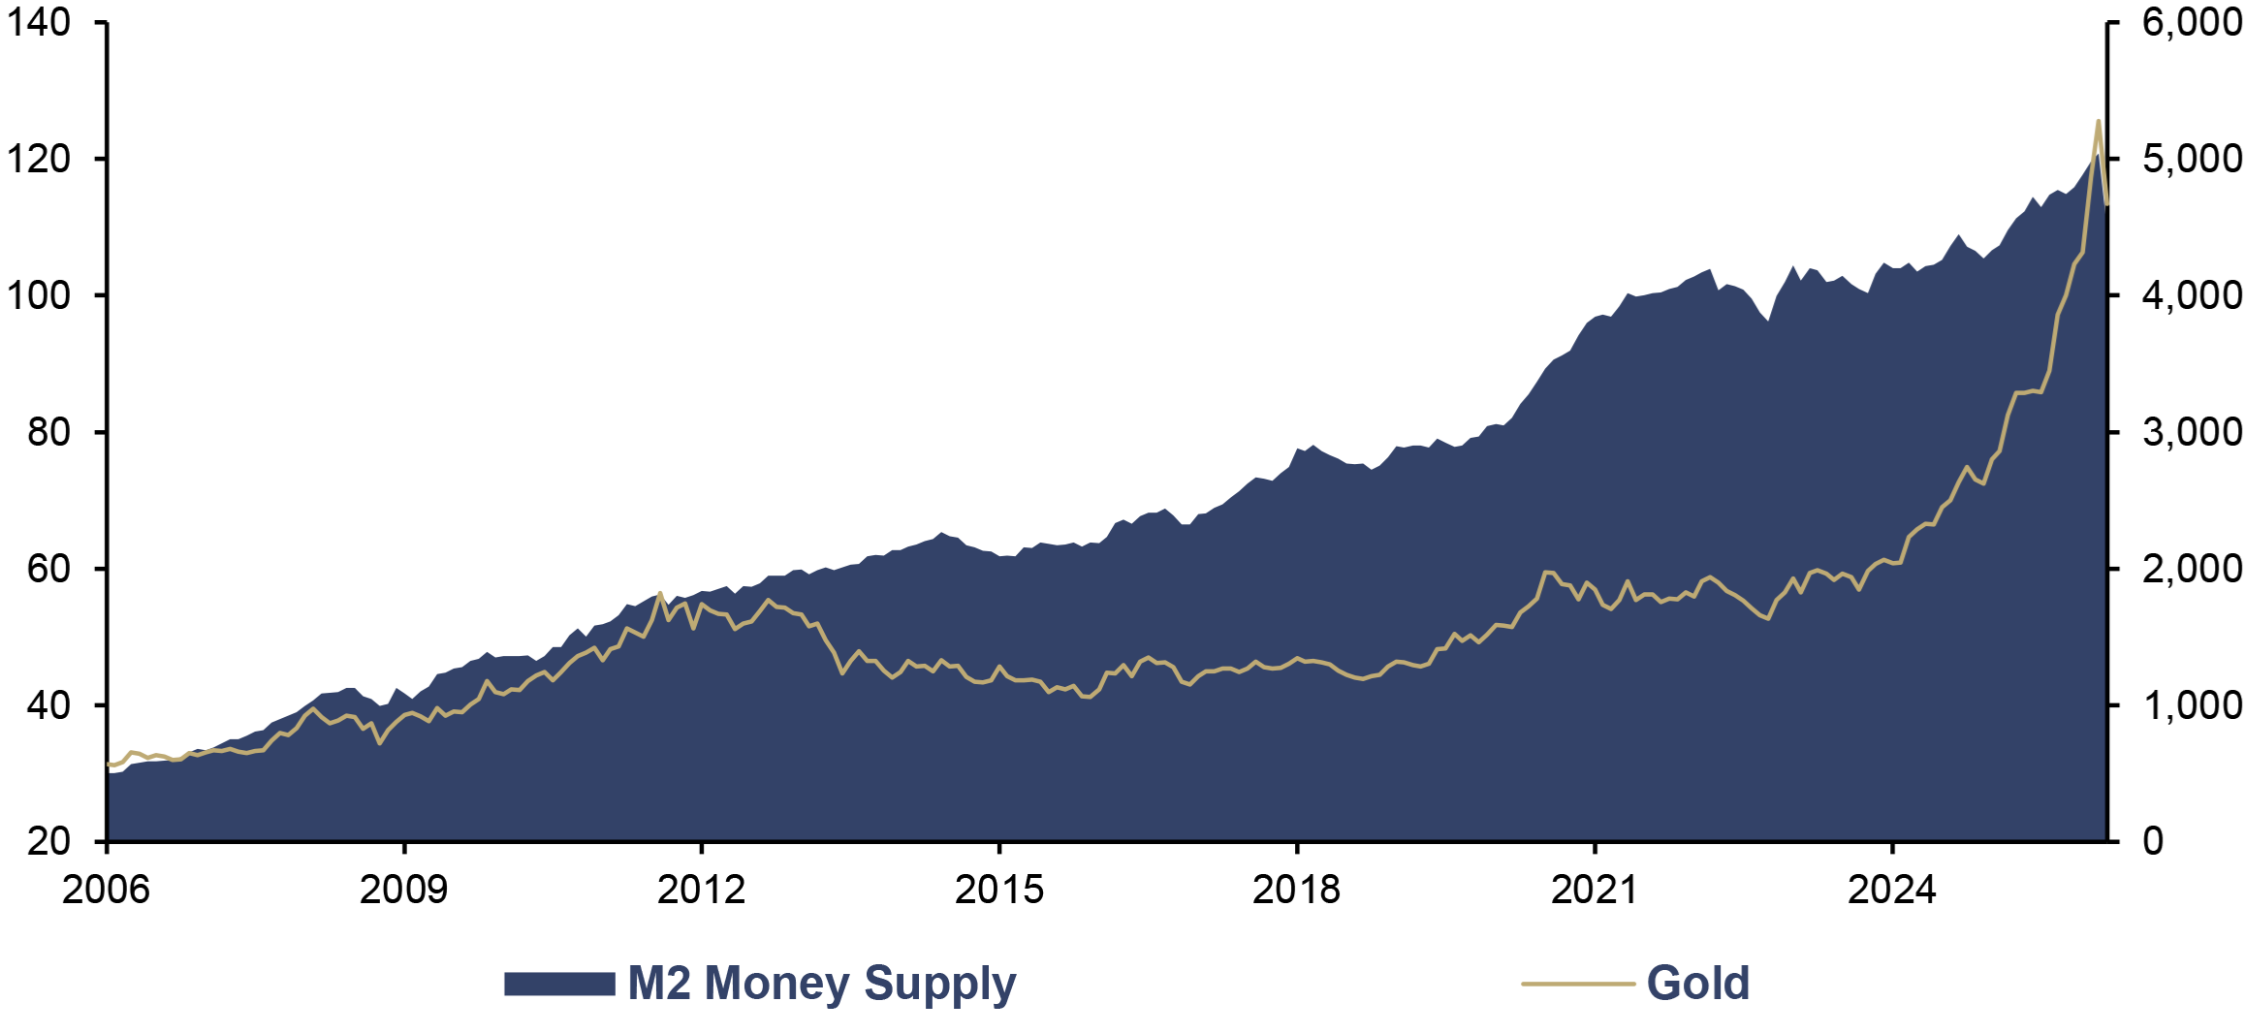
Money supply growth is a key long-term driver of the gold price. After three years of low growth rates, the global money supply is now growing more rapidly again, though it remains at the lower end of the historical range. On a long-term average, M2 has grown by 6.6% per year in the G20 countries. The thesis put forward by our friend Larry Lepard in his highly recommended book The Big Print is that a significant acceleration is on the horizon. If the “Big Print” does indeed materialize, it will act as an additional catalyst for the gold price.
Aggregated M2 Money Supply of the Top 20 Economies (lhs), in USD trn, and Gold (rhs), in USD, 01/2006–03/2026
Source: LSEG, Incrementum AG
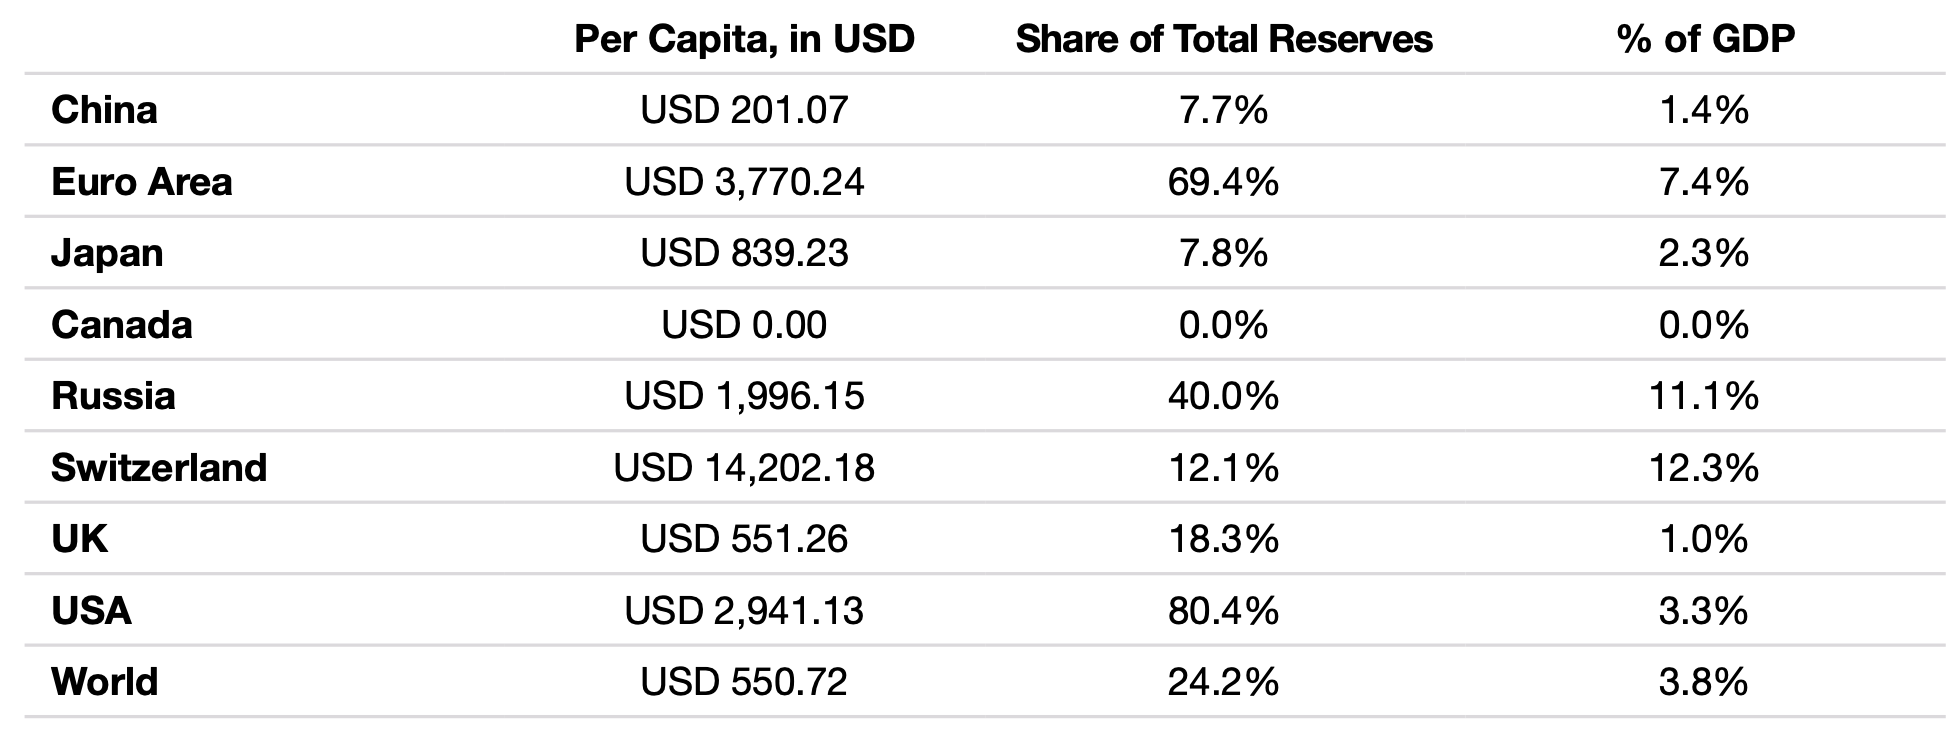
In our interviews and presentations, we always emphasize that gold is not a (substitute) religion, not a jack-of-all-trades, and not a panacea for every portfolio problem. This makes the question of the correct weighting all the more valid. A pragmatic benchmark for private investors is the share of gold in central banks’ currency reserves: Globally, the figure stands at around 24% – but in Western industrialized nations, it is significantly higher still.
Gold Reserves, Q3/2025
Source: IMF, World Bank, World Gold Council, Incrementum AG
Our own quantitative long-term analysis for the period from 1970 to 2024, which we presented in the In Gold We Trust special “The Optimal Gold Allocation,” confirms this finding: Depending on risk aversion, the ideal gold allocation ranges between 14% and 20%.
Belatedly but unmistakably, Western financial investors are now rediscovering gold. This is evident from the sharp rise in ETF demand over the past few months. A key reason for this appears to be latent concerns about inflation and stagflation. As we explained earlier, we expect increased inflation volatility and at least one more wave of inflation in the coming years. Therefore, we assume that the correlation between stocks and government bonds will remain positive, which further strengthens the case for negatively correlated portfolio hedges such as gold.
US CPI, yoy, and 5 Year Volatility US CPI, 01/1925–03/2026
Source: LSEG, Incrementum AG
As predicted in the In Gold We Trust report 2025, “The Big Long,” silver and mining stocks – and ultimately commodities as well – have also awakened from their slumber following gold. Fundamentally, a commodities allocation offers investors three potential advantages:
- long-term positive returns
- low correlation with stocks and bonds
- hedging against inflationary pressure
In his Substack article “Copper: Limits to Growth in the Age of Demand Simultaneity,” commodities analyst and investor Craig Tindale argues that the physical world imposes hard limits on the digital ambitions of the AI era.[1] His thesis: Central banks can print money, but they cannot print the copper, the smelters, or the mines needed to build the infrastructure for an AI boom. The mines are not developed, the smelters are not built, yet the demand is already there.
As shortages intensify, Tindale argues, copper will rise from an industrial raw material to a strategic commodity – with export restrictions, strategic stockpiling, and government allocation to preferred industries. Defense and critical infrastructure will be prioritized, while the private market fights over the scraps. Tindale’s conclusion is blunt: The AI data centers currently under construction could be the last wave to be completed before the bottleneck hits. The digital world is a tenant of the physical world – and the rent is due.
A glance at the relative valuation of commodities compared to the stock market shows that capital markets have barely priced in these physical realities. The following chart has been a companion to loyal readers for years. It shows that commodities remain historically extremely cheap relative to stocks. The GSCI Commodity Index (TR) has barely recovered from its historic low in April 2020 relative to the S&P 500. The ratio currently stands at 0.81. It is thus miles away from its all-time highs and remains well below the long-term median of 3.87.
S&P GSCI Total Return Index/S&P 500 Ratio, 01/1970–04/2026
Source: LSEG, Incrementum AG
On the Valuation of the Gold Price: Already Too Expensive or Still Cheap?
In the wake of the sharp rise in the price of gold in recent months, the question now arises: Is gold already too expensive?
As we have argued for years, value is subjective. Objective factors such as production costs play only a minor role in valuation. Thus, the market value of a Vincent van Gogh masterpiece far exceeds its production costs; a glass of water in the middle of the desert is valued differently than on the shores of the Wolfgangsee in Austria; and the first beer after a long hike has a higher marginal utility than the fifth.
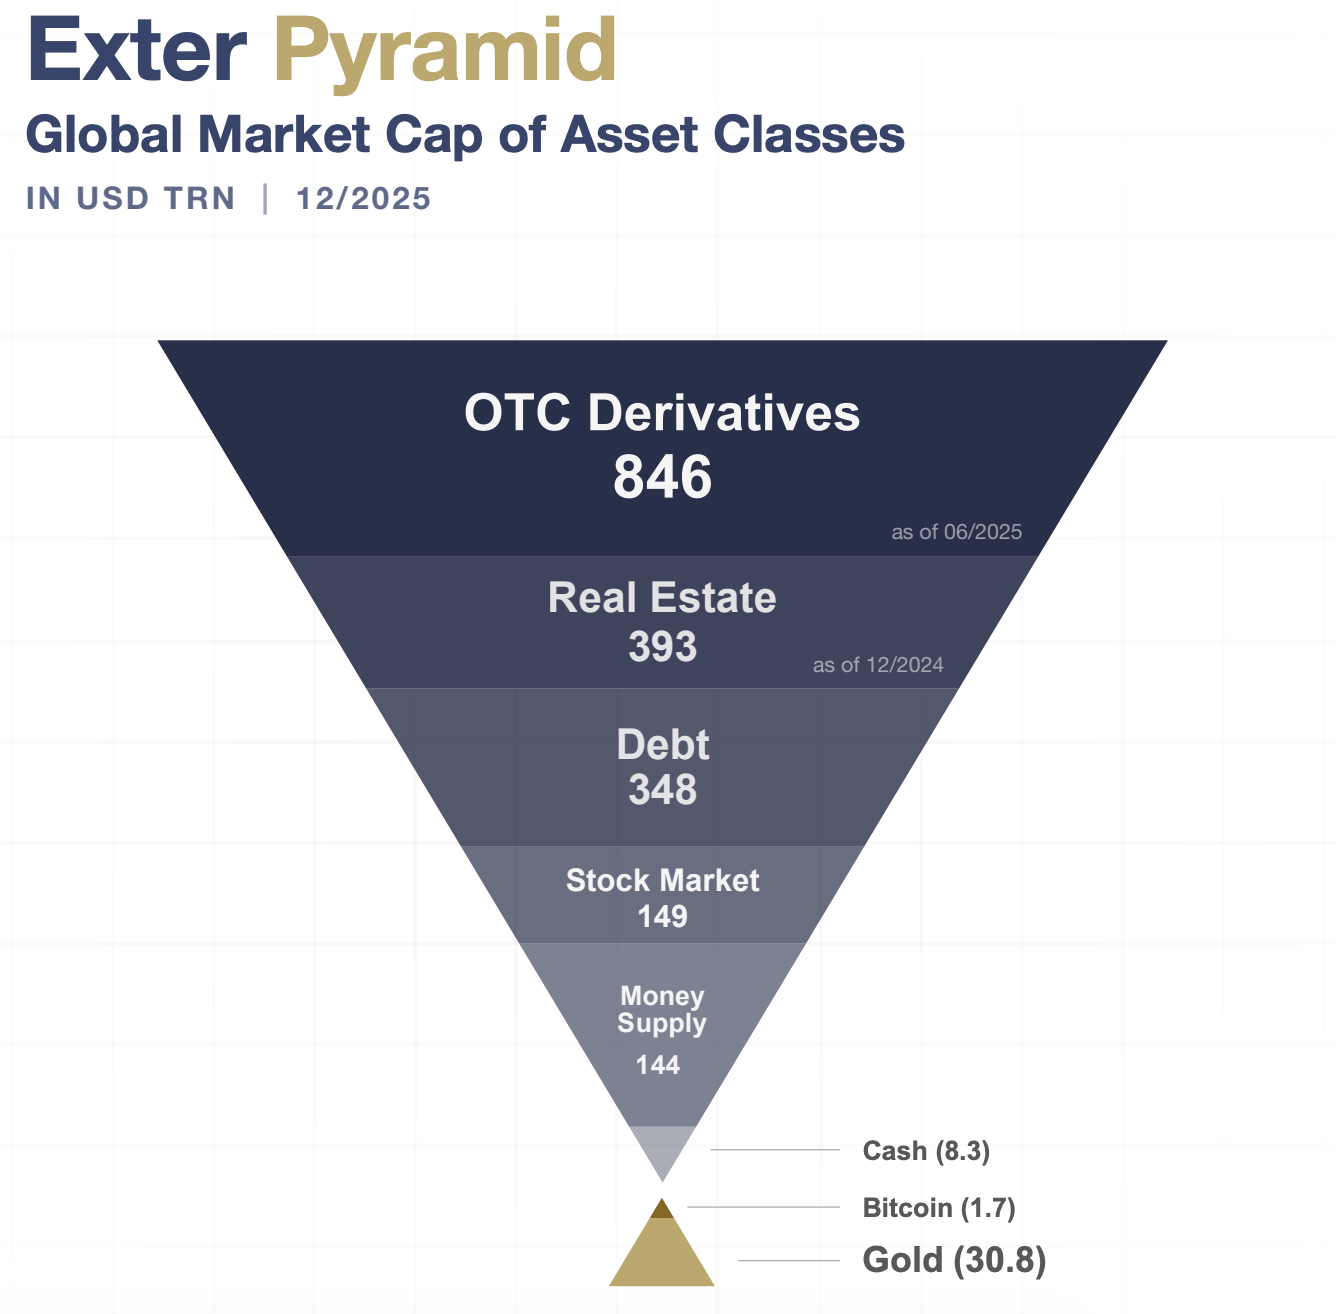
In the In Gold We Trust report 2019, “Gold in the Age of Eroding Trust,” we examined John Exter’s theories in detail in the chapter “The Enduring Relevance of Exter’s Pyramid”. He views gold as the apex of an inverted debt pyramid, though in reality it is not part of this pyramid at all: While all elements of the pyramid are debt – even cash represents an obligation of the central bank – gold is not a liability and is thus the only true alternative to fiat money.
Until now, crises tended to trigger a flight to US Treasuries rather than to gold, which kept the debt pyramid stable. This has changed fundamentally in the wake of the market turbulence following Liberation Day and the outbreak of the Iran War. Despite sharp losses on the stock markets in the meantime, US Treasuries were sold off at the same time. Whether this development signifies a lasting change in the reaction function is not yet foreseeable. But once confidence in US Treasuries wanes, the pyramid will collapse, and gold will rise to become the last refuge.
Source: BIS, Econovis, IIF, IMF, Savills Research, TradingView, World Gold Council, MiningVisuals, Incrementum AG
Exter’s central warning applies today more than ever: What happens when financial assets, whose liquidity was taken for granted, suddenly find themselves without demand? Then the house of cards collapses – and gold stands ready to assume the role of the final anchor of liquidity.
Conclusion
The system isn’t collapsing – it’s melting. What we’re witnessing isn’t a dramatic collapse but a creeping decay of the denominator. The unit of account itself – the fiat money in which we quantify value – is losing substance. We call this process denominator decay: an erosion that does not play out in headlines but in a quiet, persistent destruction of purchasing power.
The consequences are anything but quiet. In an unstable world, people seek anchors – assets whose value does not depend on the credibility of an issuer. When investors who have believed in DCF models and the efficient market hypothesis their entire lives suddenly buy gold, it is more than a tactical portfolio decision; it is the psychology of touch – the need for an asset one can touch, weigh, and hold in one’s hand.
Gold is not a panic trade. It is a preparedness trade – the Switzerland of the monetary world: not cheap, but reliable, neutral, and trustworthy.
In Gold We Trust Special: Incrementum Gold/ Oktoberfest Beer Ratio[2]
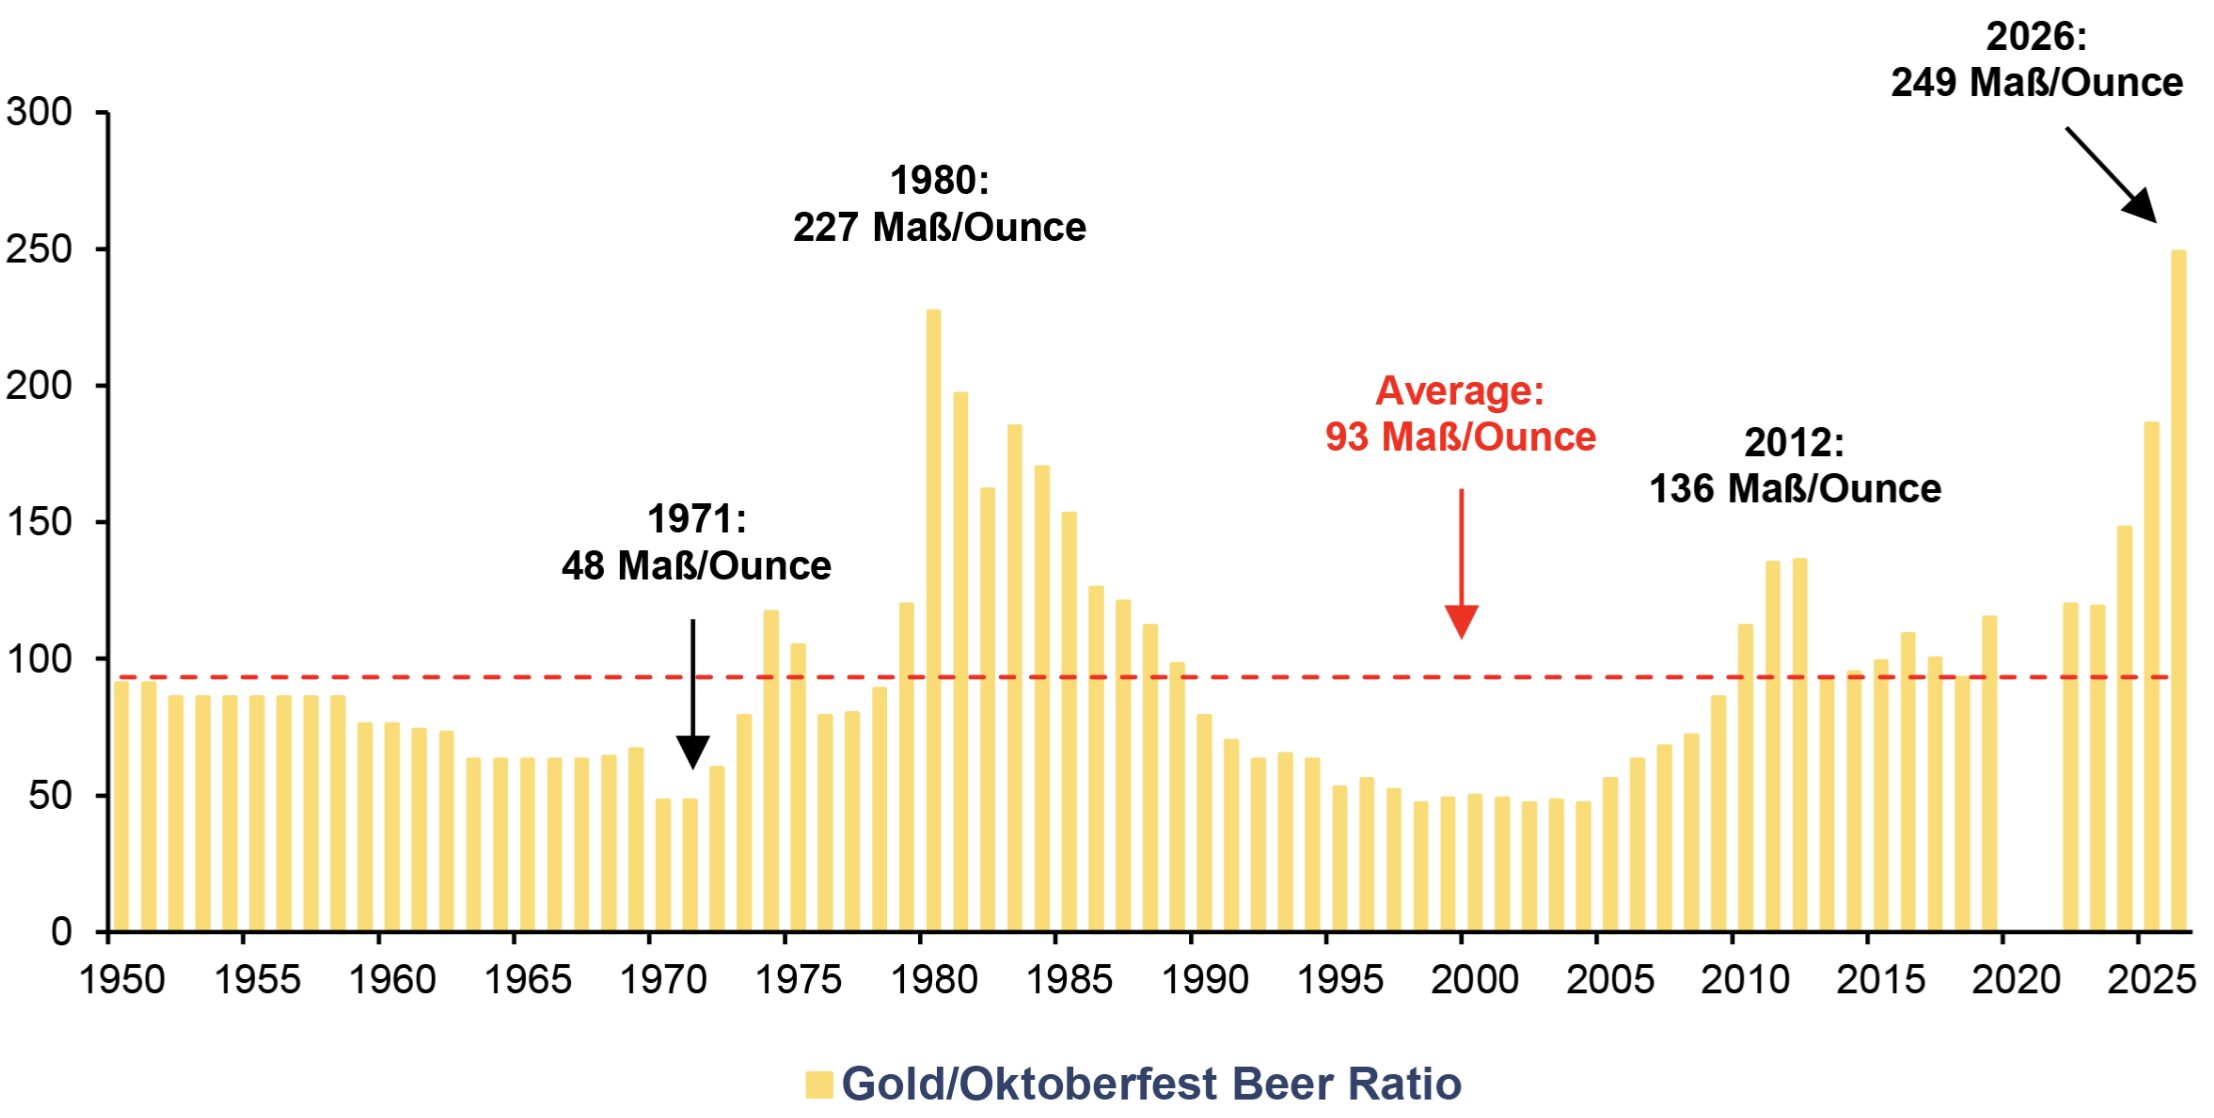
On September 19, the cry of “O’zapft is!” will ring out once again at Munich’s Theresienwiese. The price of beer for Oktoberfest 2026 has not yet been set – but one thing is already certain: Gold’s purchasing power for beer will once again be significantly higher. At the end of August 2025, gold was trading at EUR 2,950; by mid-April 2026 it had already reached just under EUR 4,100 – an increase of more than a third in six months.
Had the Oktoberfest opened its gates in mid-April, the gold-to-Oktoberfest beer ratio would have stood at 249 Maß, up from 186 Maß at the 2025 Oktoberfest. That is a onethird increase, even if we assume a further rise in the euro price per liter to the extent of the most recent price hike, up to EUR 16.30. In 2024, one ounce of gold bought 148 Maß; in 2023, it was only 119 – less than half the current amount.
Gold/Oktoberfest Beer Ratio, 1950–2026
Source: LSEG, Statista, Incrementum AG
Because the price of a Maß of Oktoberfest beer has risen so sharply in recent years – with prices up by more than a third since 2019 – ideas that were previously unthinkable are now being openly discussed. The president of the Bavarian Brewers’ Association has proposed charging an admission fee to enter the festival grounds at Theresienwiese. This additional source of revenue is intended to give vendors the opportunity to curb the rise in beer prices.
Is beer at the Wiesn already exorbitantly overpriced? The old record high of 227 Maß from 1980 has since been significantly surpassed, not to mention the 77-year average of 93 Maß. In that regard, it’s time to be a little careful – at least with your own liver.
In Gold We Trust Special: Incrementum iPhone/Gold Ratio[3]
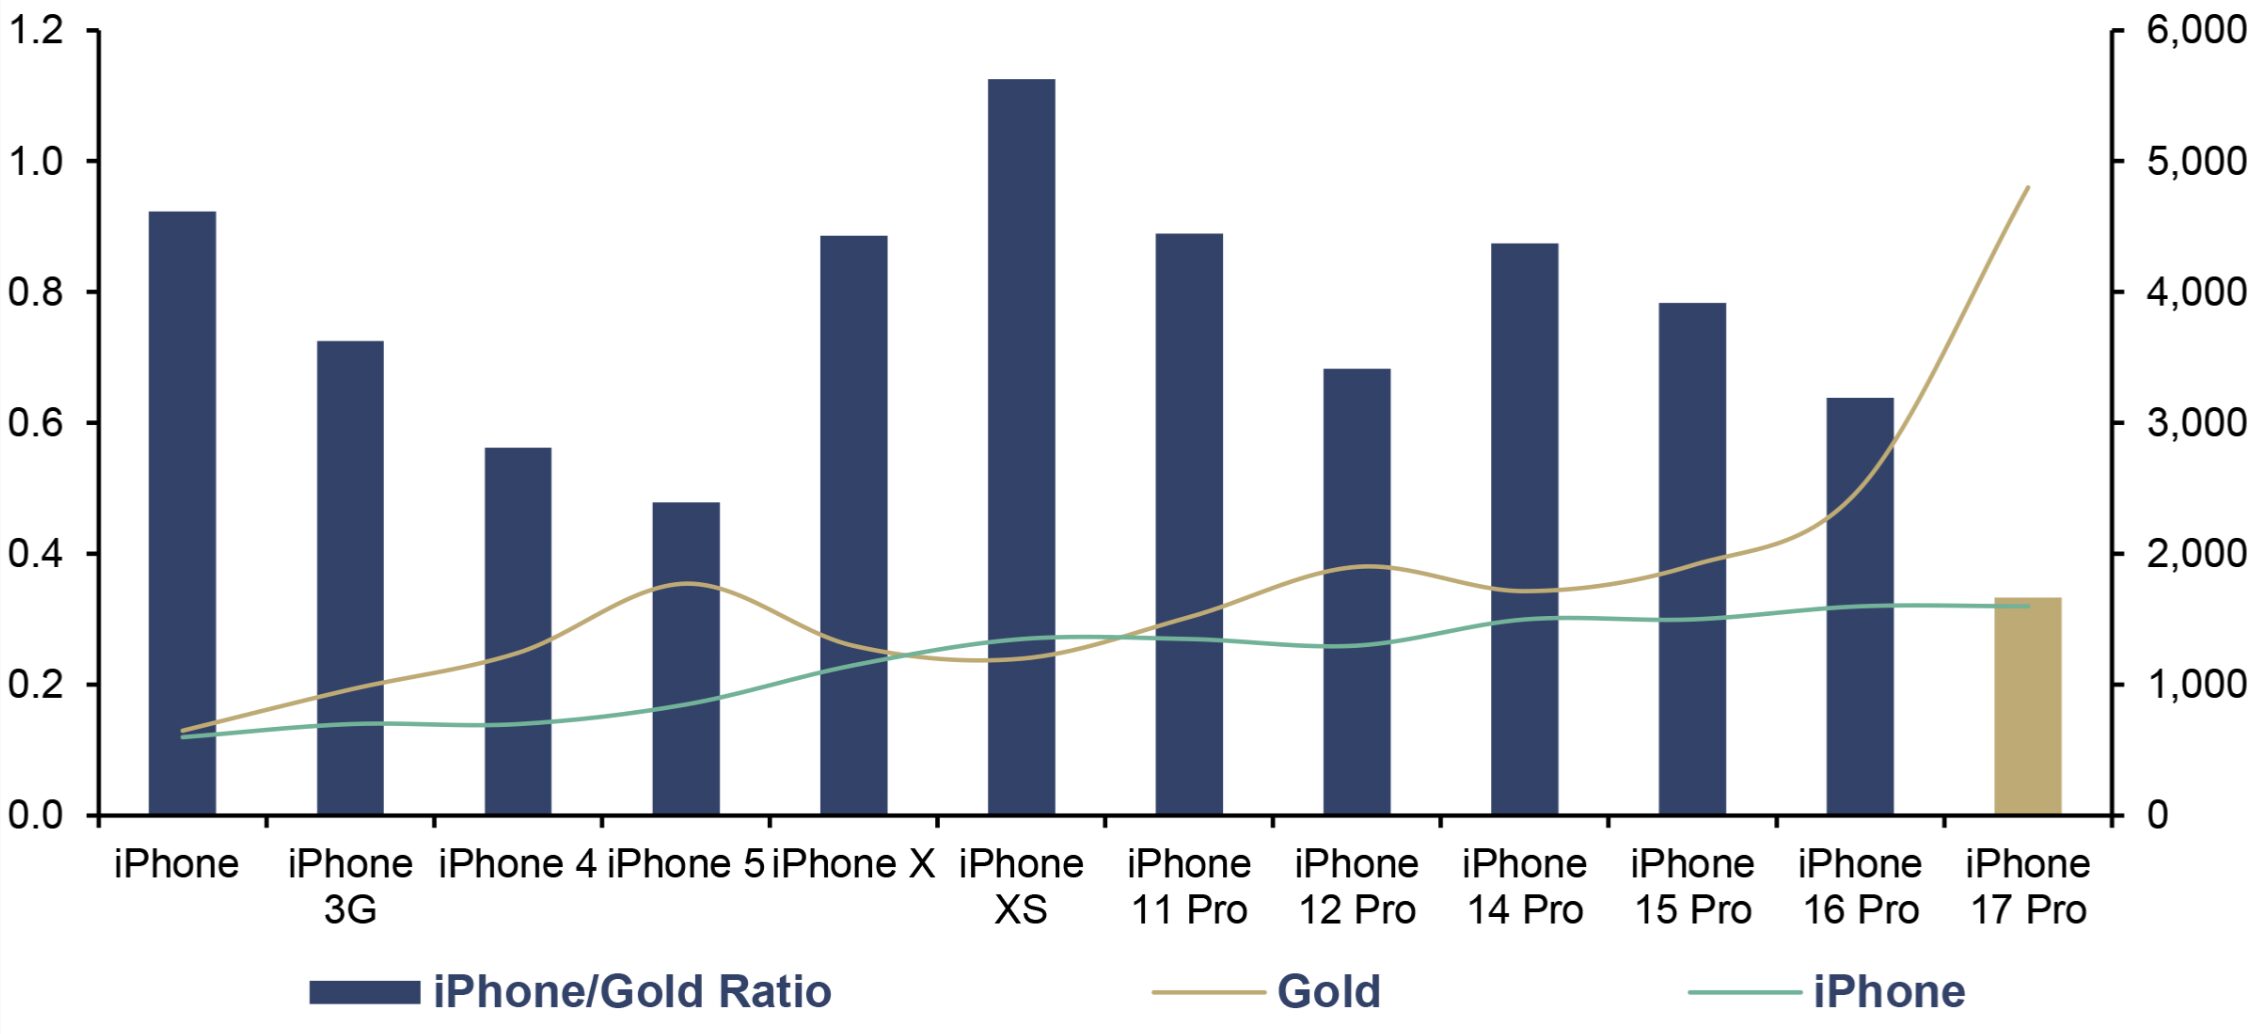
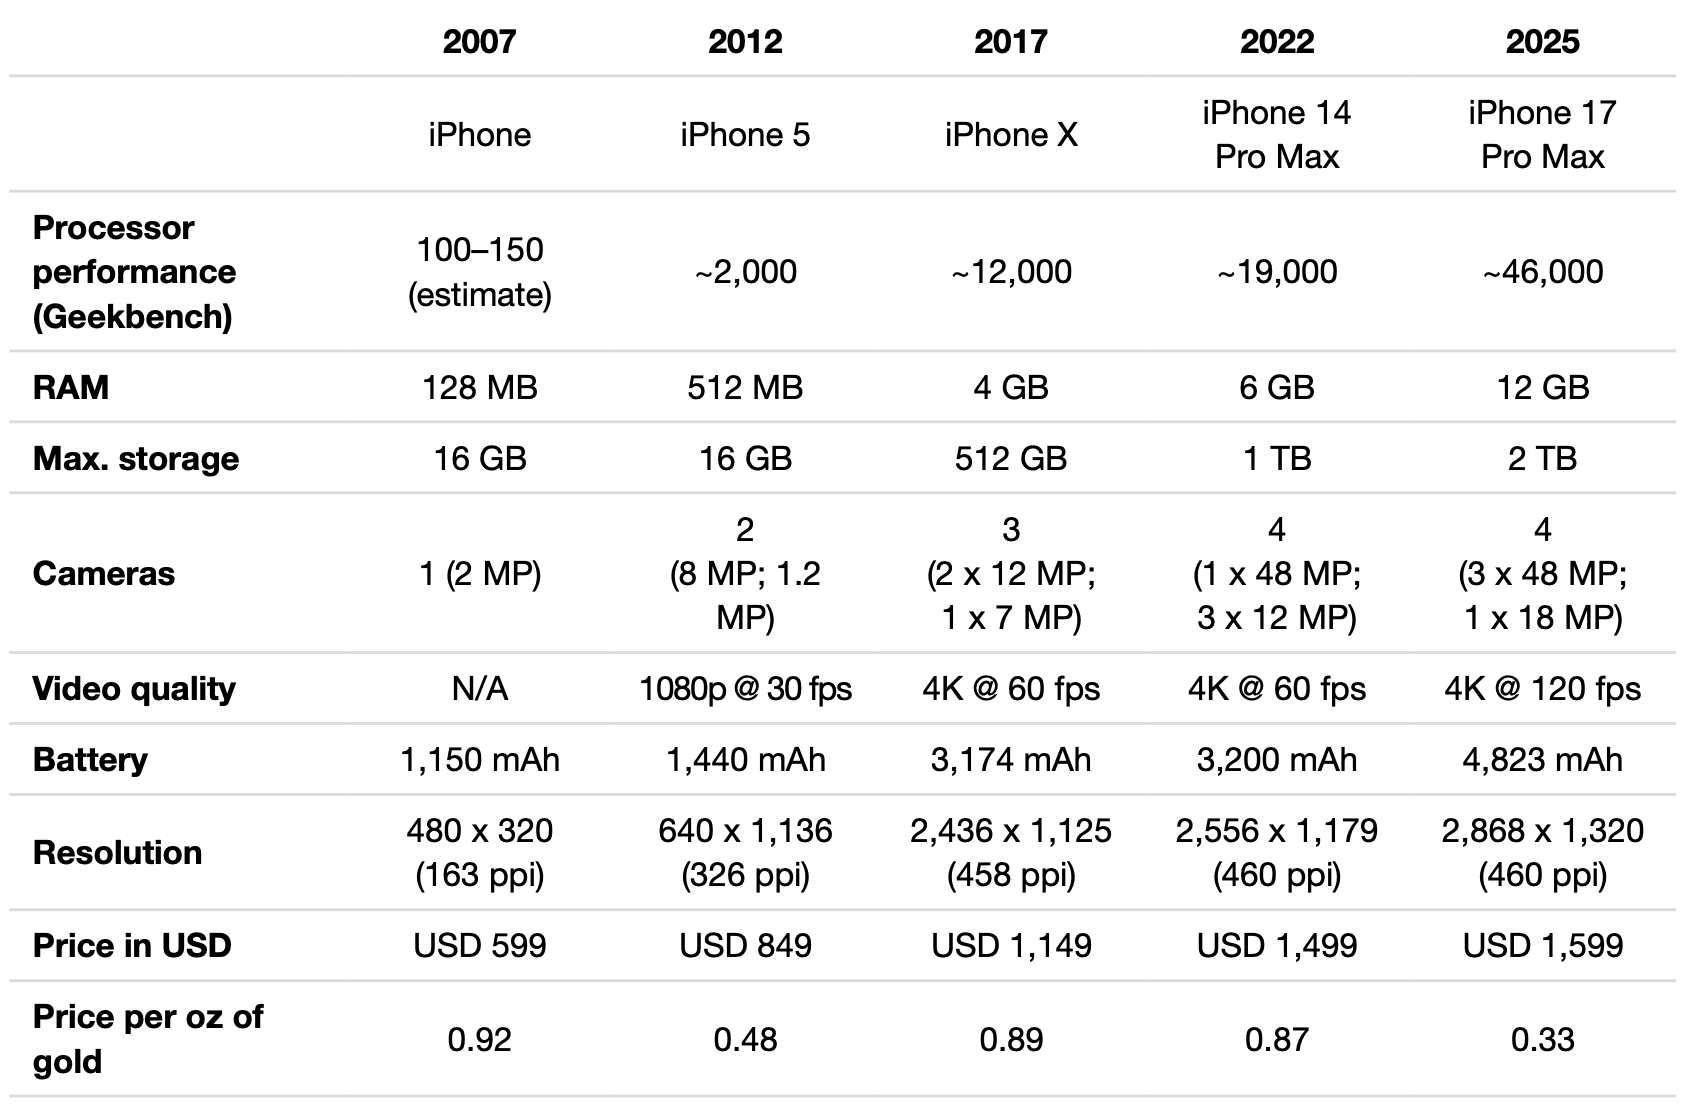
“iPhone at a Bargain Price” – that’s what the headline should read. In mid-April, the iPhone 17 Pro Max with 1 TB of storage cost just 0.33 ounces of gold – the lowest price in the entire history of the iPhone. The very first iPhone cost 0.92 ounces, nearly three times as much as today. In US dollars, however, the list price remained unchanged at USD 1,599 – a small consolation for those iPhone lovers who hadn’t invested in gold.
iPhone/Gold Ratio (lhs), and Gold and iPhone (rhs), in USD, 2007–2025
Source: venturebeat.com, LSEG, Incrementum AG
On a US dollar basis, the price increase from USD 599 for the first iPhone amounts to 167% over the entire iPhone era – an average of 5.3% per year. For gold investors, the picture looks much brighter: Over the same period, the price of gold rose by an average of 11.4% per year. Calculated in gold, the iPhone has thus become 5.5% cheaper annually – a total of nearly two-thirds. For this smaller amount of gold, however, the buyer has received more iPhone year after year. The performance improvements are indeed enormous: Processor power alone has increased more than three hundredfold compared to the original iPhone.
In Gold We Trust Special: Incrementum Gold/ Ski Pass Ratio[4]
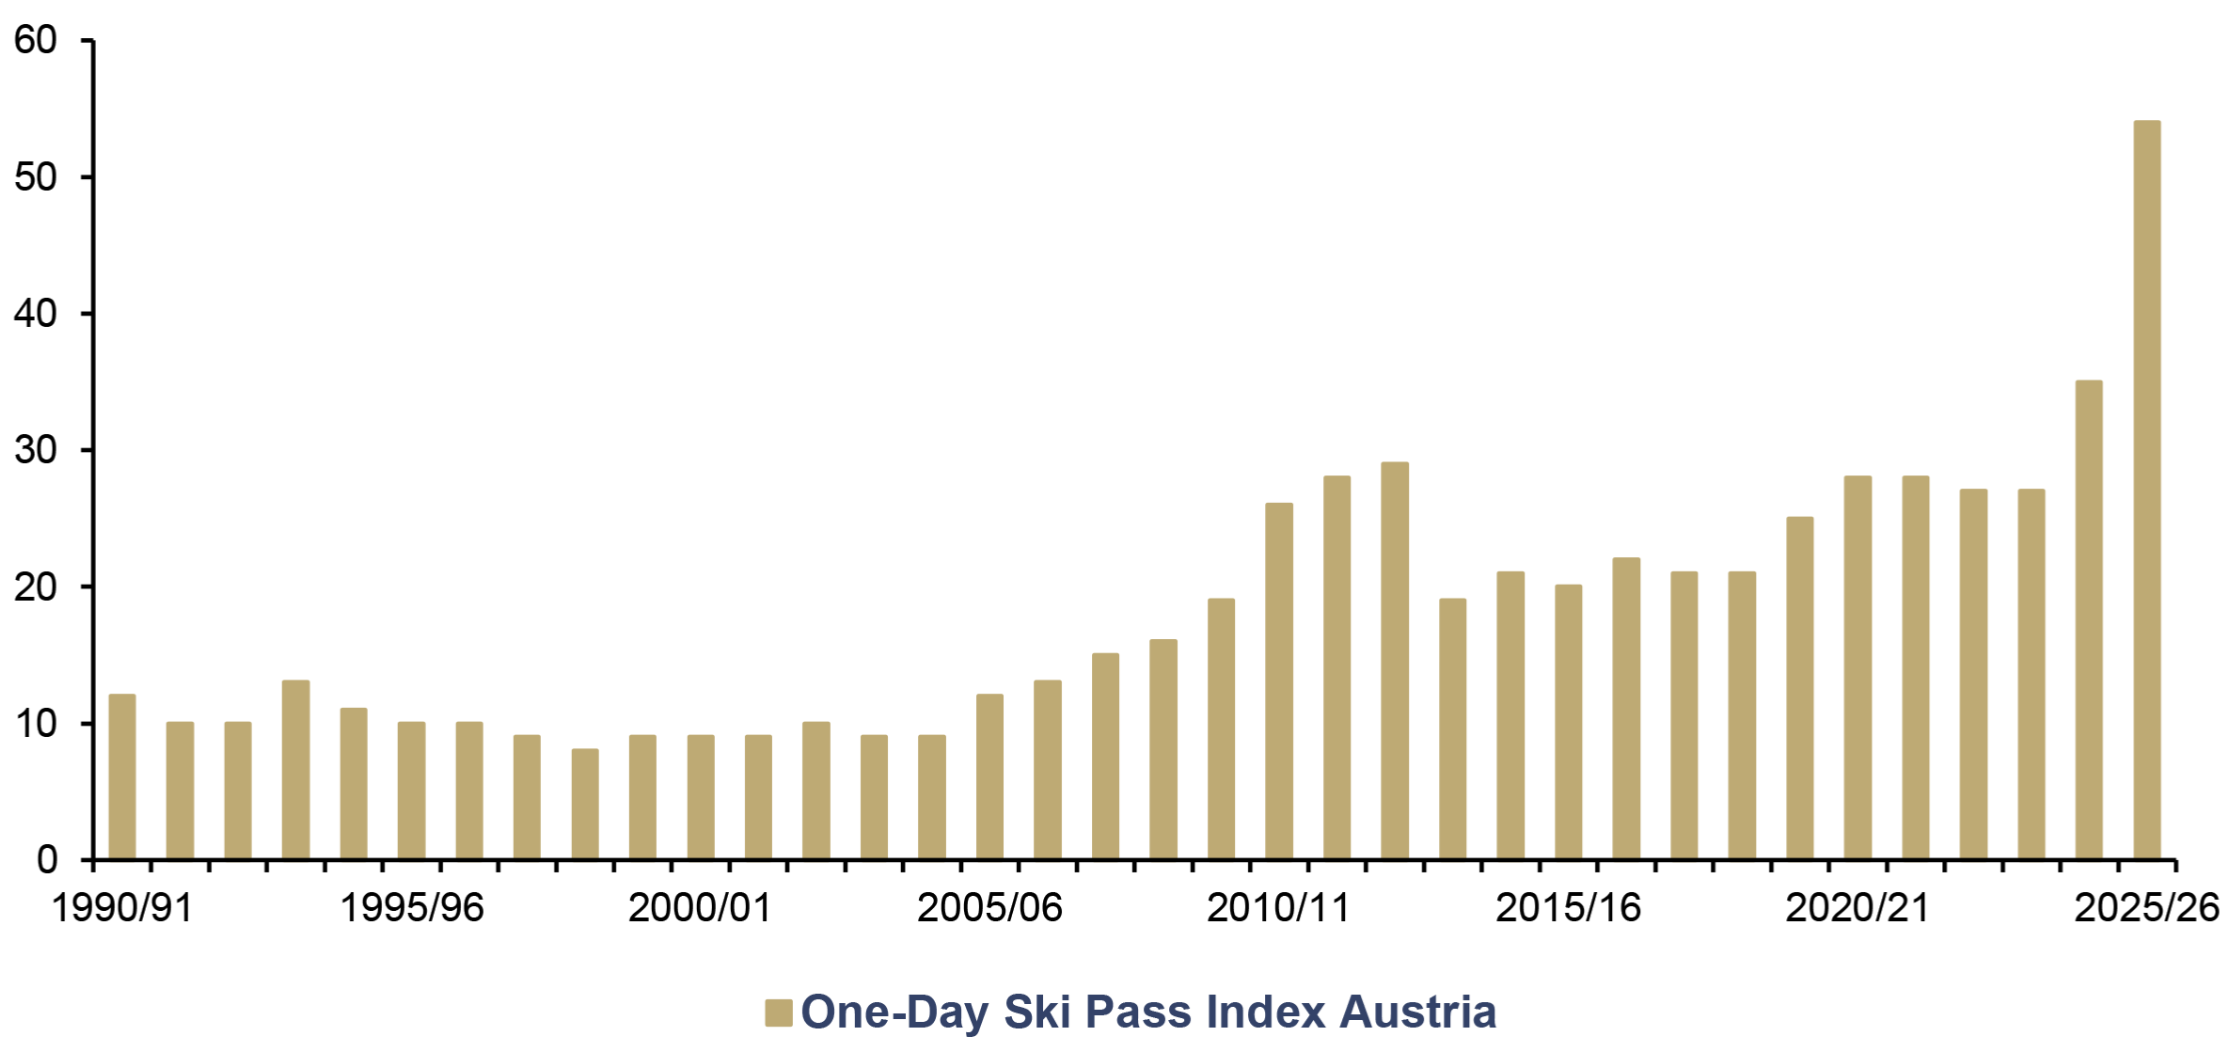
“Ski pass prices in free fall.” Never before in the past 35 years has one ounce of gold been able to buy anywhere near as many one-day ski passes as this year – namely, 48. Last winter season, it was only 35 one-day passes, based on an equally weighted index of 11 ski resorts[5] – 13 fewer. And yet, the gold-to-ski-pass ratio had already risen by 29.6% the year before.
Spring skiing became even more affordable. Compared to a ski vacation in January, not only were the temperatures more pleasant, but also the sun illuminated the mountain peaks for significantly longer periods of daylight. The continued rally in the price of gold meant that, by mid-April, gold investors received 54 day passes for one ounce – 6 more day passes than before. In other words, while a day pass cost 0.021 ounces in January, by mid-April it cost only 0.019 ounces.
Gold/Ski Pass Ratio, WS1990/91–WS2025/26
Source: ZUKUNFT SKISPORT, LSEG, Incrementum AG
A comparison with the much more expensive ski resorts in North America is also telling. For one ounce of gold, you could have hit the slopes in Vail for just 14 days in mid-April, and in Whistler for 20 days. In comparison, Austria’s top ski resorts prove to be a bargain.
This also applies to those skiers in Austria who didn’t bet on gold. The trend of rising prices continued compared to the previous year, averaging 4.8%. Compared to the 2019/20 winter season, day passes have become a remarkable 41.8% more expensive overall. However, with daily prices under EUR 80, a day of skiing in the Austrian Alps costs significantly less than in the mountains of North America.
[1] See also the debate “Shovels, Not Spreadsheets – Luke Gromen Debates Craig Tindale” in this In Gold We Trust report
[2] We take a closer look at the gold-to-Oktoberfest beer ratio every fall in an In Gold We Trust special. For last year’s In Gold We Trust special, see “The Gold/Oktoberfest Beer Ratio 2025,” September 2025.
[3] We will again take a closer look at the iPhone/gold ratio this fall in an In Gold We Trust special when the new iPhone is unveiled. For last year’s In Gold We Trust special, see “The iPhone/Gold Ratio 2025,” September 2025
[4] For this winter’s In Gold We Trust Special, see “Schifoan – The Gold/Ski Pass Ratio 2026,” January 2026. We will publish an update on the Hahnenkamm Races in Kitzbühel at the end of January 2027.
[5] These are the Stubaier Glacier, Kitzbühel, Obertauern, Kleinwalsertal, Arlberg, Wilder Kaiser, Sölden, Wagrain/Snow Space, Fiss, Steinplatte, and Schmittenhöhe ski resorts. We would like to thank Günther Aigner of ZUKUNFT SKISPORT, one of the most renowned experts and a top speaker on the topic of winter sports, for providing the data.