


The Collapse of Commodity Beta
“We’ve under-invested in productive capacity… and we can’t arrest that decline in five years.”
Rick Rule
- Commodity beta (the broad basket) has become a weaker scarcity proxy. Since 2020, benchmark-relative gains have concentrated in fewer commodities, so broad indices capture a smaller share of the outperformance when leadership narrows.
- The post-2020 regime splits commodities by supply response. In bottleneck markets (where supply can’t scale in time), outperformance can persist; in throughput markets (where supply can respond), performance remains more cyclical and meanreverting.
- Gold sits outside the cross-commodity “winner” race as an anchor. It functions as a monetary reference asset – supporting confidence and official-sector balance-sheet demand – even as return leadership rotates elsewhere in the complex.
- The biggest moves occur when accelerants collide with hard constraints. Light ownership, benchmark underweights, and episodic demand impulses (often selective rather than broad-based) can turn small shocks into nonlinear repricing when liquidity is thin and supply is slow to adjust.
Introduction
Across successive editions, the In Gold We Trust report has traced a clear macro arc: Monetary credibility is under strain, policy is operating within tighter constraints, and the global system is becoming more fragmented across fiscal, geopolitical, and supply-chain lines. Within that arc, commodities have returned to the spotlight through a specific mechanism: Demand shocks now hit a system with thinner buffers, longer lead times, and more gated supply. As a result, price pressure increasingly concentrates in specific bottlenecks rather than across the commodity complex.
That shift changes what “commodity exposure” actually gives investors. The commodity complex no longer behaves like a single macro basket, as many narratives still assume. Relative to a broad benchmark such as the Bloomberg Commodity Index (BCOM), participation has narrowed and leadership has compressed: A smaller group of markets now accounts for a larger share of benchmark-relative gains. The problem is not that scarcity has disappeared, but that it has become harder to capture through index-level exposure because the binding constraints now sit in specific nodes such as access, processing, infrastructure, inventory, or weather-sensitive production cycles rather than being spread evenly across the complex.
We formalize this gap as the collapse of commodity beta[1]: Broad-basket exposure has become a weaker proxy for scarcity in a regime where constraint premia are localized. We test this claim through a benchmark-relative lens, treating the complex as a cross-section against BCOM. We interpret the resulting compression in leadership through two supply modes: throughput systems, in which deliverable supply can expand within the pricing horizon (= elastic supply system), and bottleneck systems, in which the marginal unit remains constrained (= inelastic supply system). To make these patterns visible, we use three screens: a BCOM-relative performance panel across major commodities, a regime heatmap that tracks relative returns across different macro backdrops, and a leadership and concentration lens that shows how narrow or broad participation has become. We then apply a practical “node test” checklist to distinguish tradable tightness from scarcity that is more likely to persist.
Viewed through this lens, the current commodity landscape looks like a map of binding nodes. Pressure builds at discrete points across metals, energy systems, and agriculture, and leadership follows both the location and the duration of the constraint. The implication is asymmetry. Where supply can respond, as in throughput systems, tightness tends to clear, and leadership rotates. Where the marginal unit remains constrained, as in bottleneck systems, scarcity premia persist long enough for benchmark-relative outperformance to concentrate. Broad baskets still offer diversification value, but they increasingly dilute exposure to the markets where scarcity cannot be arbitraged away. That helps explain why the post-2020 regime has appeared as dispersion and concentration, rather than broad and uniform participation.
Why Commodities Are Back in the Frame
Commodities tend to move back into the macro spotlight when demand accelerates and runs into low inventories, long lead times, and capacity bottlenecks that slow the return to balance. The 2010s were defined by disinflationary slack and a rapid marginal supply response. The post-2010s backdrop is different. Policy constraints, security premia, slower project cycles, and weather volatility now shape the specific channels through which markets clear: permitting, financing, shipping routes, processing capacity, and inventory rebuilding. As those constraints tighten, price pressure concentrates at chokepoints. Leadership, therefore, depends more on where the binding constraint sits and how quickly the system can rebuild buffers.
The regime: Demand impulses arrive into less slack
The policy mix is now more sensitive to constraints. Persistent inflation, larger fiscal footprints, reindustrialization efforts, and rising energy-transition capital expenditure all increase the frequency with which demand impulses hit capacity, while supply expansion arrives with longer delays. Under these conditions, commodity pricing depends more on how fast supply can respond and how deep the buffers are. During shocks, inventories and spare capacity become the main near-term clearing mechanism.
At the same time, the regime’s arithmetic is reshaping portfolio construction. Compressed real yields and persistent inflation raise the carrying cost of cash and long-duration assets, pushing marginal demand toward liquid stores of value. In parallel, inflation volatility and debt constraints make duration less reliable as a defensive asset, increasing the relevance of exposures linked to physical constraints and security premia.
The signal: Gold reprices the opportunity cost of trust
When credibility and duration risk are being re-evaluated, the first signs usually appear in the asset most directly exposed to that shift: gold. Gold provides the clearest signal because its performance relative to equities and long-term bonds reflects the opportunity cost of trust in duration-based financial claims.
In the In Gold We Trust report 2025 “The Big Long”, the chapter “Status Quo of Gold relative to Stocks, Bonds, and Commodities” compares gold’s performance with key assets that were at the core of the previous regime’s default portfolio, especially equities and long-term bonds. It highlights gold’s strength not only against duration-based financial claims but also during periods when it outperforms broad commodity benchmarks. That pattern reflects the character of the regime: Higher inflation volatility raises rate uncertainty, debt constraints narrow policy leeway, and the safe-haven role of duration weakens. Consequently, demand shifts toward a balance-sheet-legible reserve asset: gold.
The constraint channels: control cycle, supply inertia, weather stress
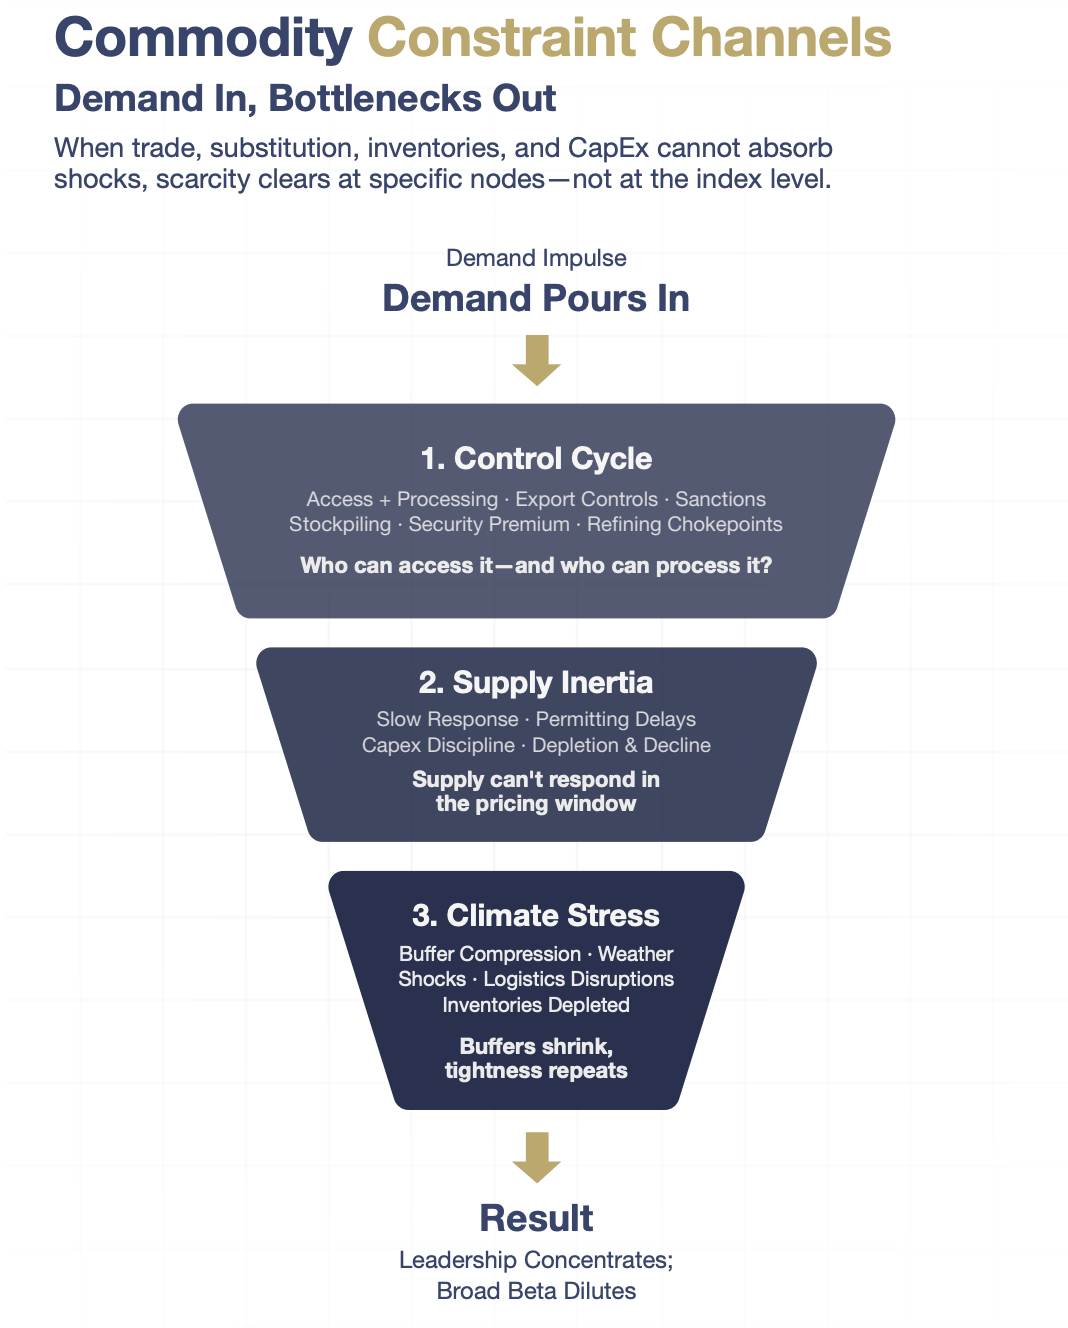
Scarcity is transmitted unevenly when the usual adjustment mechanisms, such as trade, substitution, inventories, and capital investment, fail to absorb shocks. When that happens, imbalances are no longer arbitraged smoothly across regions or through time. Instead, they clear at specific chokepoints. As clearing becomes more localized, the commodity market increasingly stops behaving like a unified macro basket.
Control cycle: Scarcity localizes through access and processing
Geopolitics localizes scarcity by shaping who can access supply and who can convert it into usable form. Alignment, trade policy, and strategic priorities now play a growing role in determining resource availability, routing, and refining pathways. Export controls, sanctions risk, friend-shoring, and strategic stockpiling add a security premium that shifts clearing away from the idea of “global supply” and toward controlled nodes in the value chain.
Policymakers are already behaving as if commodity beta is dead. Commodities are no longer being treated as one interchangeable bucket. Instead, policy is increasingly built around specific materials and specific chokepoints. In the United States, the Defense Logistics Agency’s Strategic Materials program operationalizes stockpiling through an Annual Materials Plan that specifies, by material, what the national stockpile can acquire or dispose of. At the same time, the Department of Energy publishes a Critical Materials List and a supporting methodology to prioritize energy-critical inputs. The message is consistent: Security-of-supply planning is now material-by-material rather than “own the complex.”
Europe is following the same legislative path. The EU’s Critical Raw Materials Act (CRMA) sets explicit 2030 benchmarks across the chain – targets for domestic extraction, processing, and recycling – alongside a diversification cap designed to limit dependence on any single non-EU supplier.
In essence, provenance, routing, and processing eligibility now matter as much as headline supply. Governments are underwriting bottlenecks, not the basket. That confirms the broader point: Scarcity now clears at nodes, rather than at the index.
Supply inertia: slow projects, thin swing capacity, persistent premia
Supply inertia reinforces localized scarcity because supply response has slowed. In the chapter “Capex Comeback: A Raging Bull Market for Commodities Beckons” of the In Gold We Trust report 2023 “Showdown”, we argued that capital was beginning to rotate back into commodities but was running into non-market frictions after a long investment drought, with ESG constraints and geopolitics among the key obstacles. That earlier underinvestment now faces even higher hurdles: permitting delays, social-license constraints, capital discipline, and – in parts of the mining complex – declining ore quality.
This makes the tightness structural rather than temporary. Within the relevant pricing horizon, supply often cannot respond quickly enough, so inventories absorb most of the shock. With fewer scaled producers, thinner swing capacity, and longer timelines from discovery to first production, the system stays tight once buffers begin to shrink. Scarcity premia can therefore persist across multiple quarters because inventories can adjust quickly but capacity usually cannot.
Weather stress: repeated buffer compression in biologically constrained systems
Weather volatility localizes scarcity by repeatedly compressing the inventories that normally smooth supply. This is most visible in biologically constrained systems with limited short-run flexibility. Weather shocks, shipping disruptions, and regional logistics problems can quickly deplete buffer stocks; and repeated shocks can prevent inventories from rebuilding between seasons.
When that pattern persists, what would normally look like episodic bottlenecks begins to look structural – not because the commodity is globally scarce but because buffers fail to rebuild on schedule.
Source: MiningVisuals, Incrementum AG
Broad exposure dilutes; bottlenecks compound
Collectively, these constraint channels point to a simple conclusion: In the post-2020 regime, benchmark-relative outperformance builds at the node level, not across the commodity sector as a whole. It is like troubleshooting a network: When a single overloaded router is causing the slowdown, upgrading the entire office Wi-Fi plan will not solve the problem – you have to fix the specific choke point. As the usual cross-commodity equalizers (substitution, inventories, and marginal supply response) stop doing their normal job, relative compounding no longer aggregates at the index level. Instead, it concentrates in the few commodities where the binding bottleneck actually sits.
The amplifiers: flows, underweighting, and China’s selective impulse
When a bottlenecked market with limited ownership receives a new demand impulse, price moves can become convex, with small increases in demand producing disproportionately large gains. The mechanism is straightforward. Deliverable supply is limited, liquidity is thin, and producers cannot respond quickly enough within the price-setting window. Three forces amplify that convexity: light ownership, delayed reallocation, and a selective China impulse.
Commodity exposure remains constrained by index structure, mandate rules, and risk limits across banks and asset managers. In our view, the implication is not simply “more upside because it is underowned”, but a delayed, then abrupt, allocation response. When a sector is only a small part of the benchmark, improving fundamentals rarely trigger immediate buying. Participation usually comes only after outperformance is already visible and the constraint is clearly binding. Call it the Manchester United effect: The comeback is only believed once it is already on the scoreboard. By then, flows become less sensitive to price because the focus shifts from “is it cheap?” to “we need exposure”. Once the goal is simply to secure exposure, timing matters less than execution.
That delayed reallocation is amplified by benchmark design. Public equity benchmarks often mask how underowned a sector really is. When a sector’s weight sits in the low single digits, it can rerate meaningfully before passive flows begin to matter. In markets with limited supply growth, that makes underownership an amplifier: The marginal buyer can push prices much higher, especially when free float is limited and liquidity is thin.
China’s liquidity impulse can add a further layer of convexity, but it is usually selective. That selectivity matters because it typically enters a system already operating near capacity at specific nodes. As Craig Tindale has noted, liquidity can accelerate demand, but it cannot instantly expand throughput. In practice, easing first shows up as incremental demand through restocking, imports, higher run rates, and project pipelines. The resulting demand pressure often appears first in spreads, basis, and processing margins before it is fully visible in headline prices. From there, it concentrates where buffers are thinnest – both in visible inventories and in the less visible inventory still “in the pipe”. The result is cross-commodity dispersion rather than a broad rise across the complex.
Commodity beta is a weak proxy for scarcity
Taken together, these regime shifts, constraint channels, and amplifiers help explain why the post-2020 commodity revival looks less like a broad, basket-wide upcycle and more like a dispersion regime. It is like using the national average temperature to predict whether a single city will face a heatwave: The average may rise, but the real stress can still be concentrated in a few hotspots. In this regime’s price-setting window, demand impulses are hitting a system shaped by control points, including slow supply response, fragile inventory buffers, and weather-driven variability. As a result, the payoff is not distributed evenly across the complex. It concentrates where supply cannot scale in time, which is why broad commodity beta captures less of the scarcity premium.
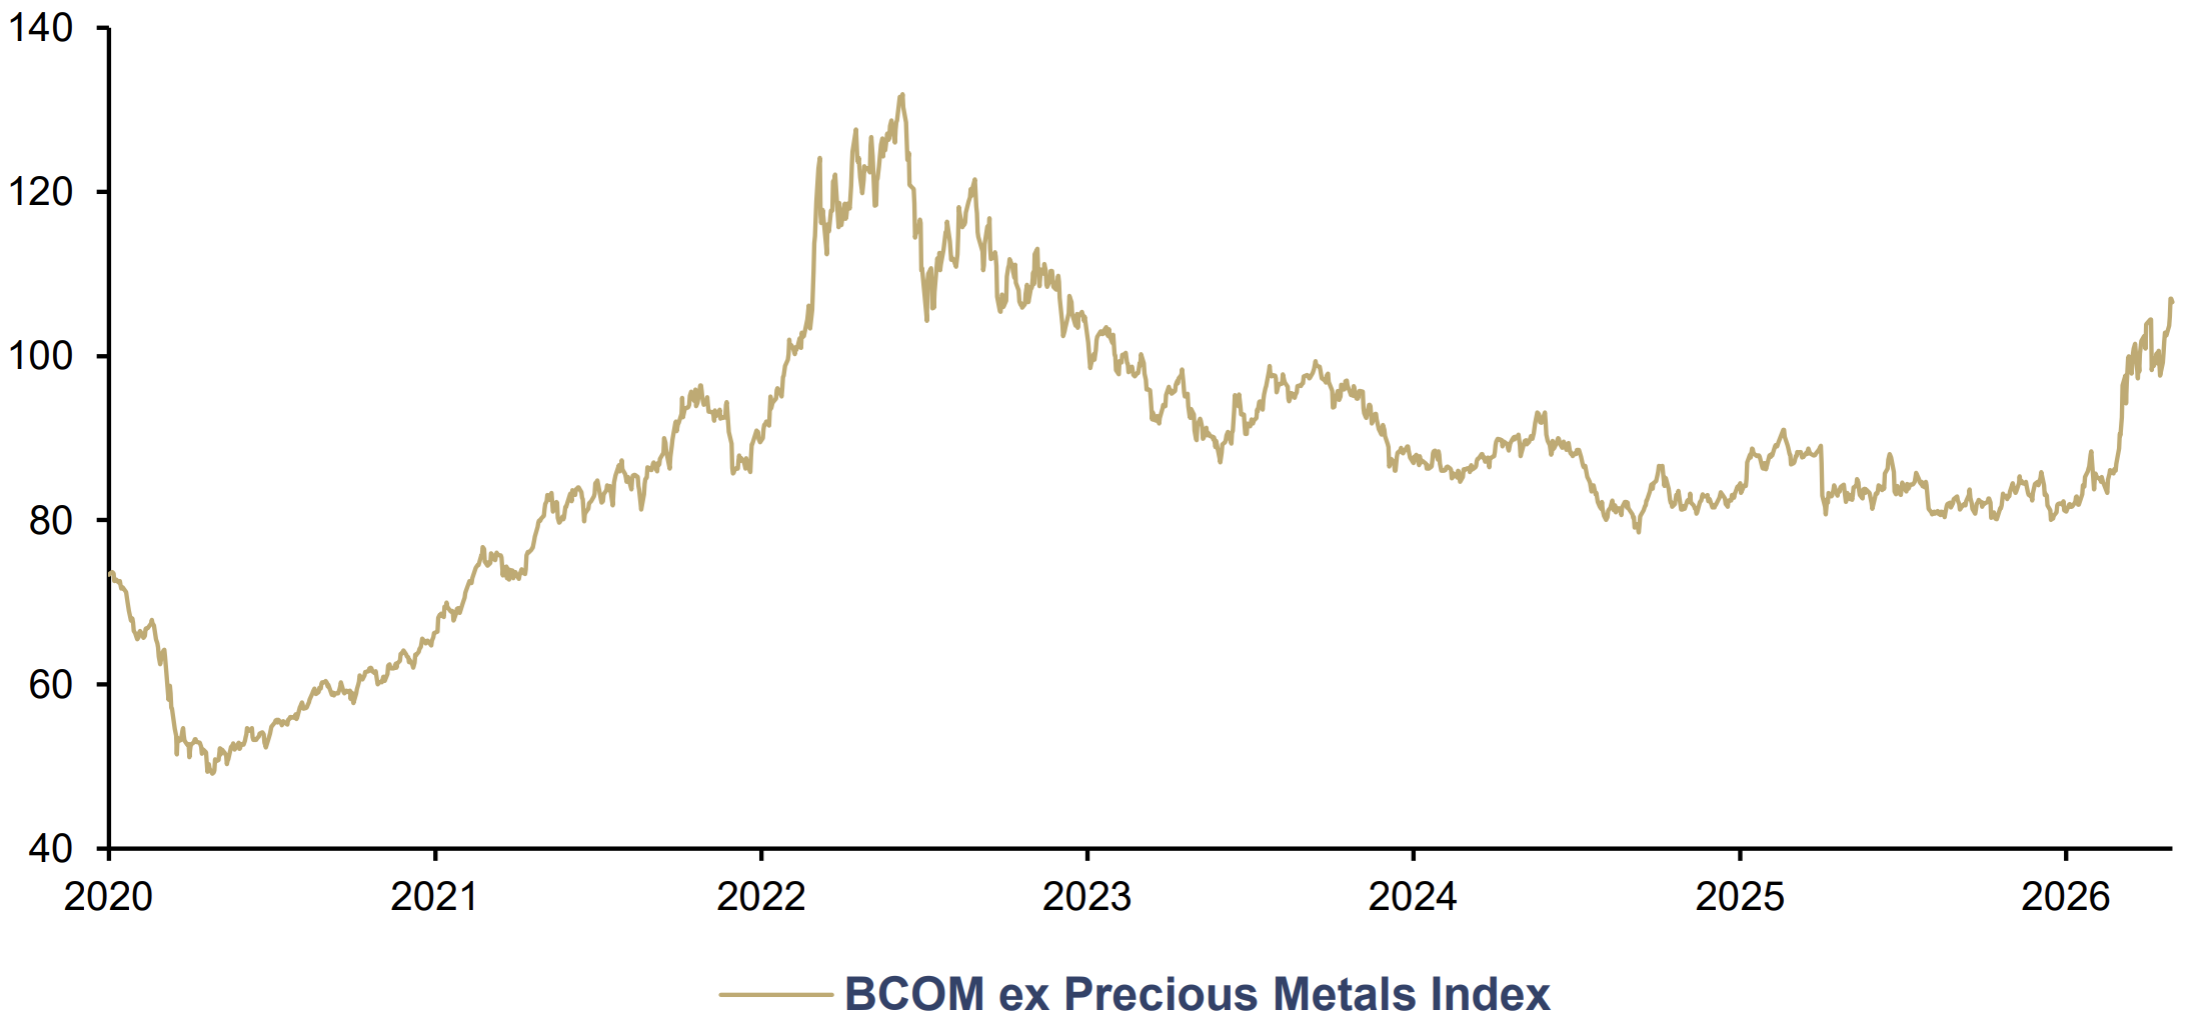
One simple way to see this is to strip precious metals out of the BCOM index. The Bloomberg Commodity ex-Precious Metals Index (BCOMXPM) – which includes energy, agriculture, and industrial metals – has been largely range-bound between mid2023 and the outbreak of the Iran war. This range-bound performance underscores how much of the period’s commodity strength has been concentrated in a narrow set of markets rather than shared across the complex.
BCOM ex Precious Metals Index, 01/2020–04/2026
Source: LSEG, Incrementum AG
Commodity Regimes and the Collapse of Commodity Beta
Commodity beta is ultimately a claim about breadth: that a broad basket can serve as a proxy for scarcity premia because most commodities participate when the regime is supportive. To test that claim, we express each commodity’s performance as a ratio to a broad benchmark such as the BCOM. Because BCOM is rebalanced over time, the key question is not whether any single weight snapshot is “right”, but whether benchmark-relative leadership persists against the index investors actually hold. This ratio lens shifts the focus from prices to shares within the complex – that is, from absolute returns to benchmark-relative leadership. We define leadership strictly as positive relative performance versus BCOM within each regime.
That benchmark-relative distribution of compounding answers three direct questions:
- Which commodities are outperforming the benchmark?
- How broad is the set of winners?
- How concentrated is total outperformance among the top performers?
Absolute returns often blur these distinctions because common price movements and commodity-specific leadership sit inside the same series and can look similar in headline terms. The ratio lens separates them. Each commodity either gains or loses share of the complex over time. That makes the failure mode of commodity beta easier to see: Breadth narrows, relative compounding concentrates in a small subset of markets, and index exposure increasingly dilutes the winners with laggards.
Two supply modes: throughput vs. bottleneck
Broad participation depends on supply elasticity – how quickly and reliably a market can add marginal supply when prices rise over the horizon that sets prices. Across commodities, two modes dominate. Throughput systems relieve pressure by running the system harder: higher utilization, incremental capacity, and operational fixes across logistics and processing. Bottleneck systems relieve pressure more slowly because the constraint sits in places that do not scale on demand: permits, long-cycle capex, depletion, jurisdictional concentration, or hard midstream chokepoints.
A useful way to picture the difference is to compare a highway with a bridge or tunnel. In a throughput market, the highway can add lanes – or at least keep traffic moving by improving flow. When demand rises, higher prices pull forward a familiar response: more shifts, better utilization, incremental capacity, and rerouted logistics. Congestion still happens, but it is usually manageable within the relevant timeframe, so imbalances tend to clear through higher throughput rather than sustained relative price appreciation.
Bottleneck markets behave more like a city where everyone must cross the same bridge or tunnel. When traffic surges, you cannot add lanes quickly, and you cannot bypass the choke point without a lengthy build-out. The constraint is structural – geology, long development timelines, processing limits, infrastructure fragility, or policy-controlled access – so the system stays near the margin for longer. In practice, the queue clears by raising the toll: Price rations demand and rewards whoever controls the bottleneck. That is why benchmark-relative outperformance can persist and concentrate even after the initial macro impulse is broadly shared.
Importantly, most commodities are not permanently fixed in one category. Many move along the spectrum as the binding node shifts. A market that normally behaves like a highway can start acting like a bridge if the constraint becomes a specific port, a single refinery process, tight inventories, regional infrastructure, or weather-linked fragility. Scarcity then localizes where the node cannot scale, and leadership concentrates there as well.
Regimes 1 and 2: broad participation
When supply can scale quickly, leadership tends to rotate and breadth remains wide; when it cannot, leadership persists and breadth narrows. Earlier regimes were marked by diffuse leadership because the usual equalization mechanisms – trade, substitution, inventories, and faster marginal supply response – helped spread shocks across the commodity complex. During long periods of globalization and in the post-crisis environment, gains were therefore shared across many commodities even when sector-specific drivers differed. Inventories and marginal supply usually rebuilt before bottlenecks could compound, allowing markets to move from tightness back toward balance without a narrow group of commodities dominating for long. Relative winners still emerged, but leadership rotated rather than remaining concentrated.
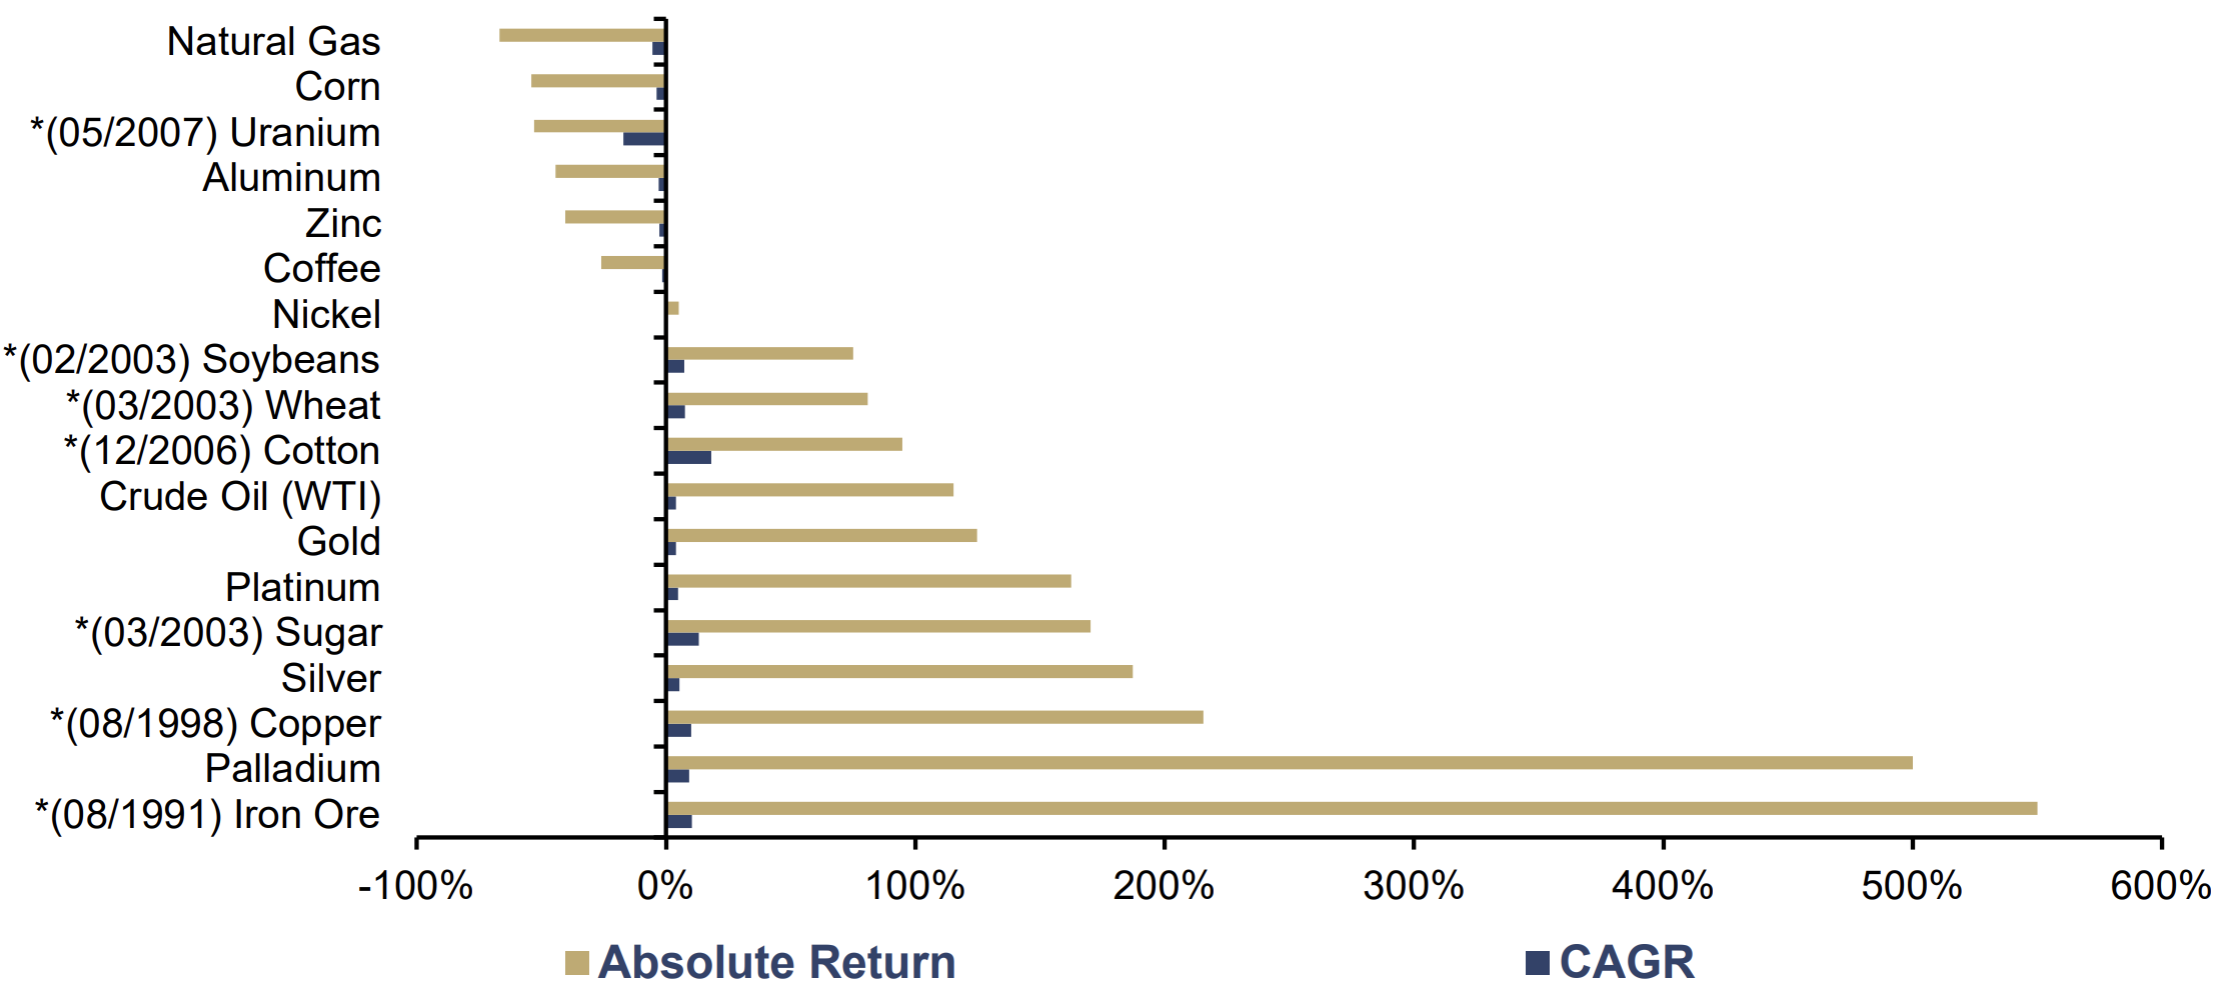
This structure is evident in benchmark-relative performance from 1990 to 2010, as the next chart shows. Positive relative returns and growth rates were distributed across a broad range of commodities, with no narrow group consistently dominating the complex. In other words, leadership was present, but it remained broad rather than compressed.
Commodity Return Relative to BCOM, Absolute and CAGR, 01/1991*–12/2010
Source: TradingView, Incrementum AG
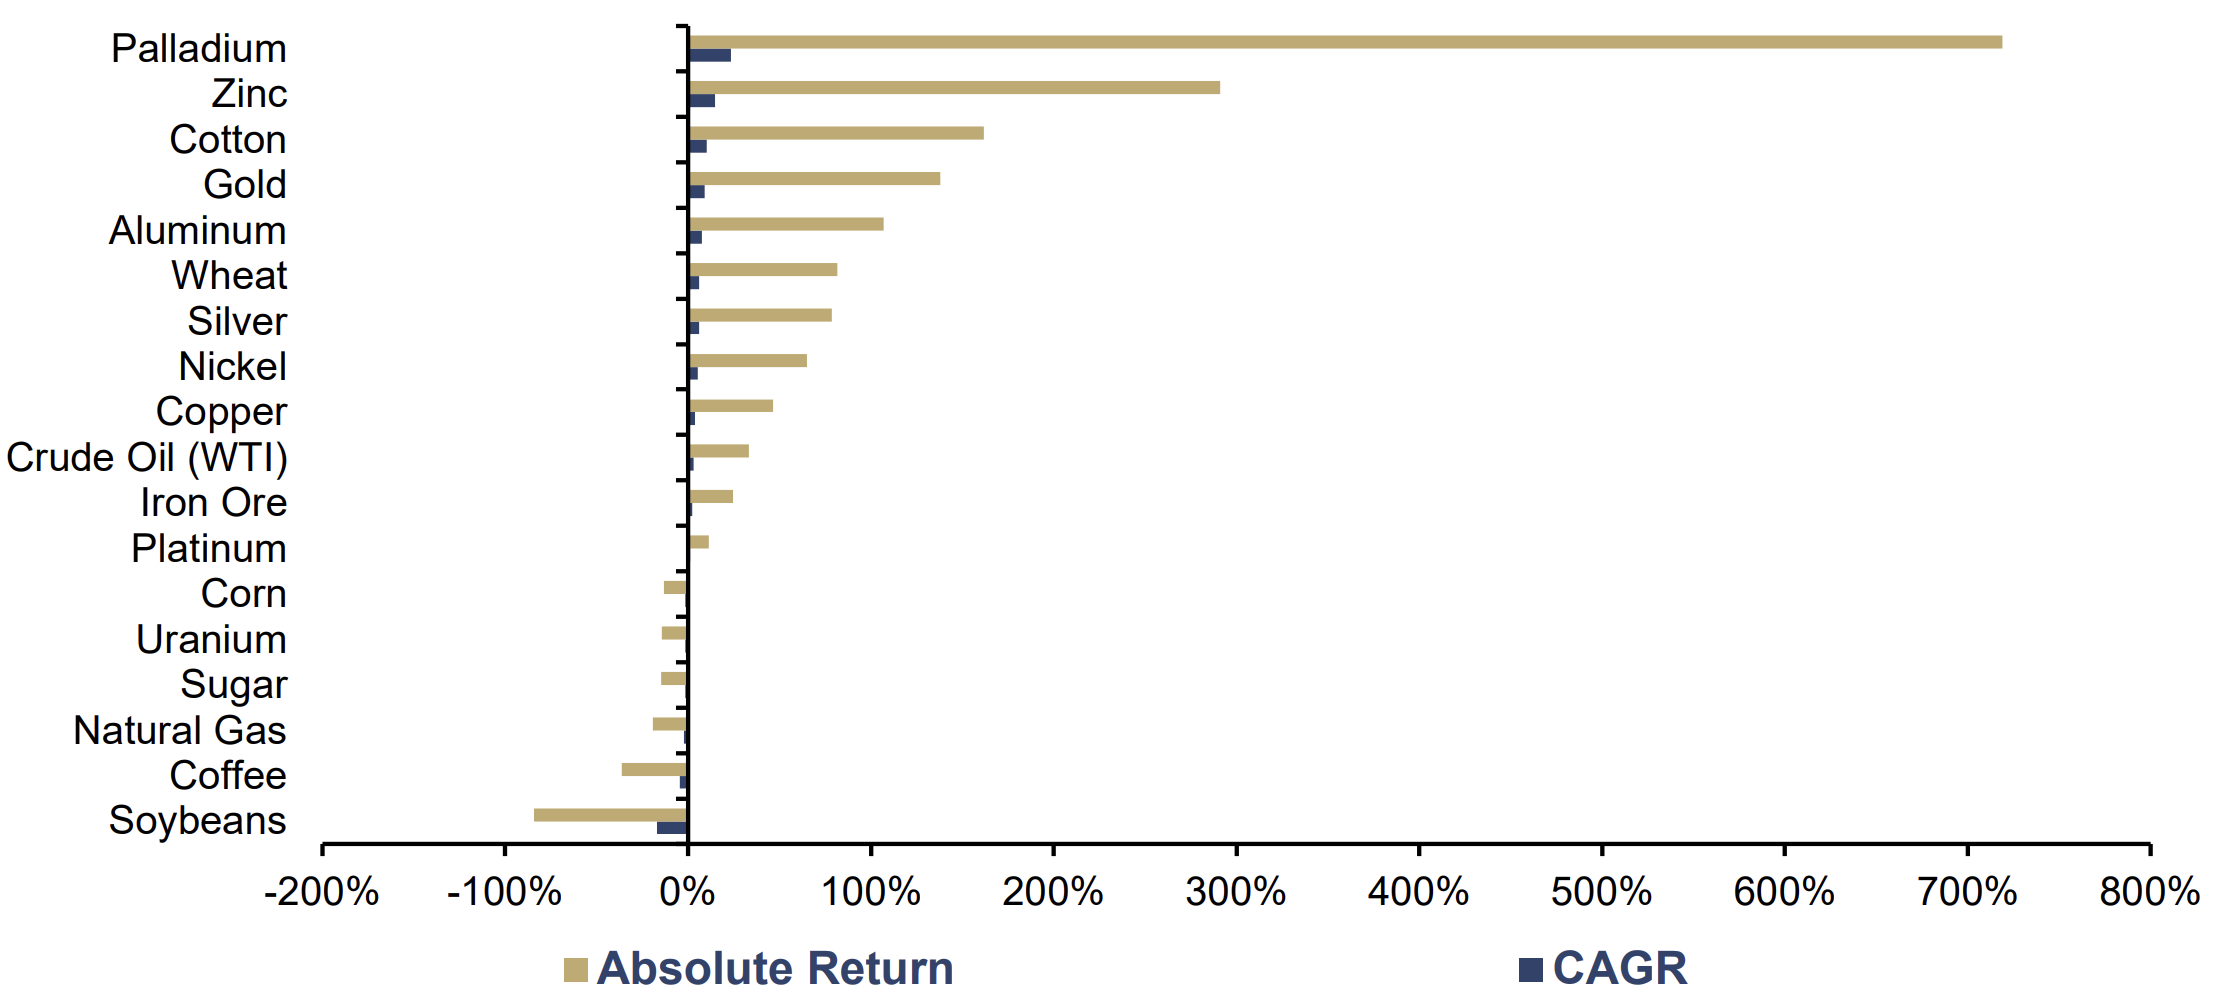
This trend largely continued in the years following the global financial crisis of 2007/08 and leading up to the Covid-19 pandemic. The macro backdrop changed, but relative performance remained broadly distributed. Dispersion stayed contained; leadership continued to rotate; and balances cleared through capacity adjustments, substitution, and weaker demand rather than through persistent chokepoints. Broad exposure, therefore, remained a reasonable proxy for how scarcity and growth impulses moved through commodity markets. And where constraints did emerge, they rarely lasted long enough to dominate the return structure.
Commodity Return Relative to BCOM, Absolute and CAGR, 01/2010–12/2019
Source: TradingView, Incrementum AG
Regime 3: breadth collapse and leadership compression
The post-2020 period has provided the clearest stress test for breadth. Rather than a single macro impulse lifting the commodity complex together, constraints began to bind selectively at specific supply-chain nodes and processing steps. As supply elasticities diverged across commodities, co-movement weakened, dispersion increased, and leadership narrowed into a smaller set of markets. In benchmark-relative terms, the outcome is clear: A shrinking group of commodities generated most of the gains, while much of the complex lagged despite sharing the same macro backdrop. The next chart shows this post-2020 shift in distribution.
Commodity Return Relative to BCOM, Absolute and CAGR, 01/2020– 12/2025

Source: TradingView, Incrementum AG
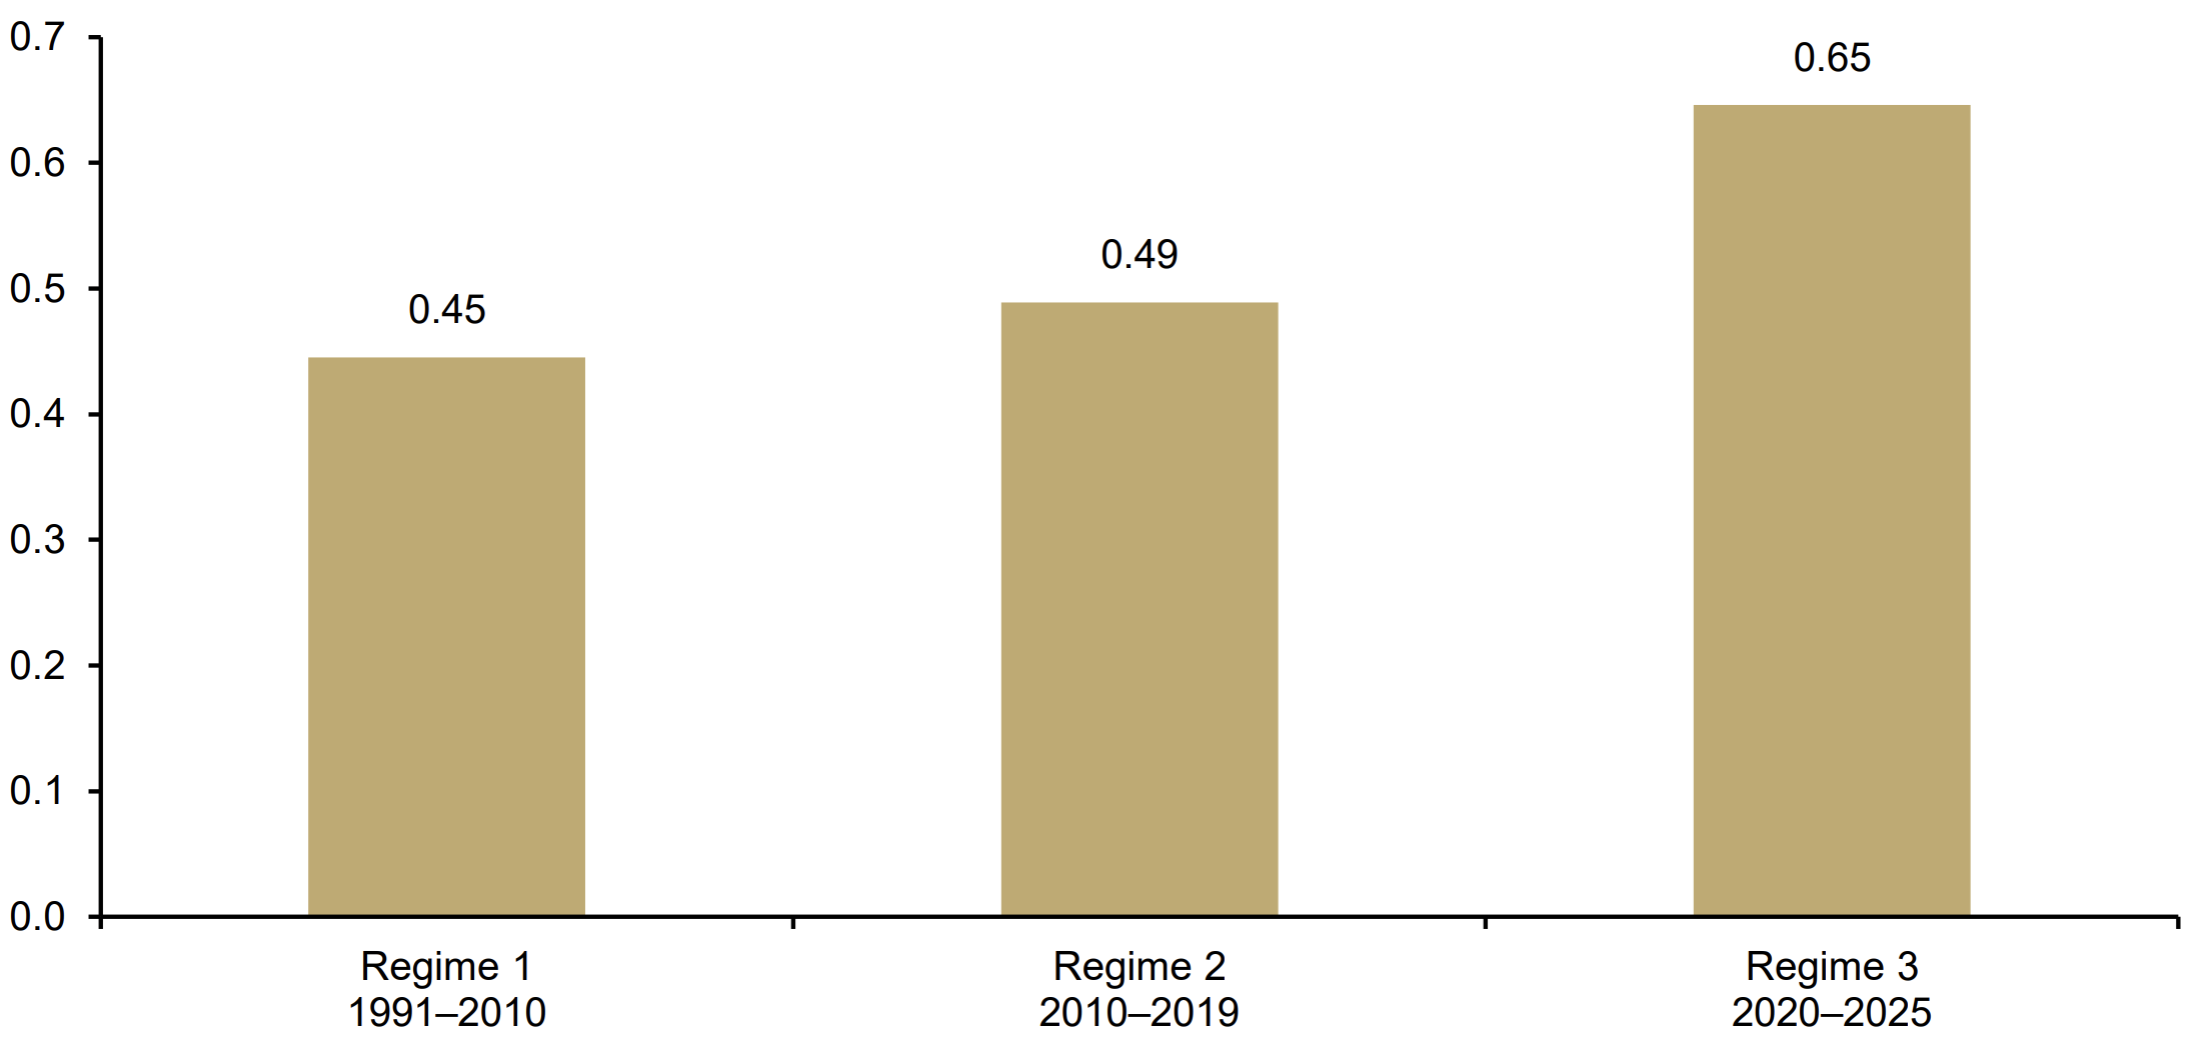
To compare this leadership pattern across regimes, we summarize the distribution of BCOM-relative winners in a single measure: the Commodity Leadership Concentration Index (CLCI). The CLCI answers a simple question: Did outperformance come from many markets or from only a few? After 2020, concentration rose sharply. A higher CLCI means fewer winners, with those winners accounting for a larger share of benchmark-relative gains.
A useful way to think about it is to treat each regime as a season and each commodity as a player. The CLCI shows whether the team’s goals were spread across the squad or driven mainly by two or three star forwards. Post-2020 looks much more like the latter: The scoreline is being driven by a small number of decisive contributors.
Under the hood, the CLCI begins by converting performance into leadership shares. Within each regime, we take only commodities with positive BCOM-relative returns and express each winner’s contribution as its share of the regime’s total positive BCOM-relative return. We then measure concentration through three complementary lenses:
- HHI captures how concentrated leadership is among the top winners – think of it as star dependency.
- Shannon entropy (H) captures how evenly leadership is distributed across winners – think of it as the spread of scoring.
- Effective number of leaders converts that distribution into an intuitive headcount: the number of equally sized contributors that would produce the same degree of dispersion, where Neff = exp (H).
In essence, the CLCI is an equal-weighted composite of these three measures, scaled so that higher values always indicate greater concentration.
Commodity Leadership Concentration Index (CLCI) Across Regimes, 01/1991–12/2025
Source: TradingView, Incrementum AG
Gold’s role: anchor, not alpha
In this environment, gold functions less as a cross-sectional “winner” and more as a reference asset transmitted through the monetary channel. Its liquidity, neutrality, and balance-sheet acceptability make it the anchor when regime stress forces a repricing across financial claims and real assets. In other words, gold operates at the system level rather than within the leadership contest that determines which commodities compound faster than the benchmark. It sets the monetary backdrop against which scarcity premia are priced, even as benchmark-relative leadership concentrates elsewhere in the commodity complex.
In the In Gold We Trust report 2025, “The Big Long”, we described this as a sequencing pattern: Gold often moves first, followed by silver and miners, while broader commodity participation tends to arrive only when the impulse reaches inventories, capex, and physical tightness. In cycling terms, safe-haven gold is the domestique, doing the hard work through shocks until the “Hautacam moment,” when performance gold (silver and the miners) launches the decisive move.
Viewed through the throughput–bottleneck lens, the pattern becomes clearer. Regimes 1 and 2 produced rotating, broad-based leadership, which made commodity beta a reasonable proxy. Regime 3, by contrast, saw breadth collapse and leadership compress into a small set of structurally constrained nodes. Across all three regimes, gold moved primarily through the monetary channel and acted as an anchor rather than a leader in the benchmark-relative contest.
The post-2020 regime, therefore, separates anchor from leadership. Gold can reprice first as the monetary reference asset, while benchmark-relative outperformance later concentrates in the constrained nodes where supply cannot scale in time. The task, then, is not to choose between gold and commodities, but to distinguish the anchor from the bottlenecks – and to identify where scarcity is being priced as a durable constraint rather than as something episodic and cyclical.
Where Scarcity Is Expressed in the Current Regime
Scarcity becomes visible when a supply system cannot relieve pressure within the time horizon that sets prices, even after capital has been deployed and efforts have been made to expand deliverable supply through coordination and substitution. In the post2020 regime, that failure tends to concentrate at the clearing node within each system: resource access, infrastructure, processing stages, inventory buffers, and weather-dependent production cycles. Price pressure converges at those nodes because they determine the marginal unit that clears the market. Other parts of the commodity complex, by contrast, still behave like scalable supply systems that can absorb shocks over time.
Systems shaped by geology, geographic concentration, processing capacity, infrastructure rigidity, regulatory friction, or biological timelines follow a different pattern. Deliverable supply expands slowly, inventories carry most of the adjustment burden, and scarcity premia persist because the marginal unit remains constrained for multiple quarters. A third group of markets sits between these poles, with outcomes shaped by inventories, logistics, and regional exposure, all of which can shift the binding constraint over time.
The classification below is therefore not a fixed taxonomy, nor does it suggest that commodities cannot move across categories. It is better understood as a set of transmission descriptors for current conditions. Migration occurs when the binding constraint shifts from scalable capacity to a gated node, or the other way around.
Precious metals
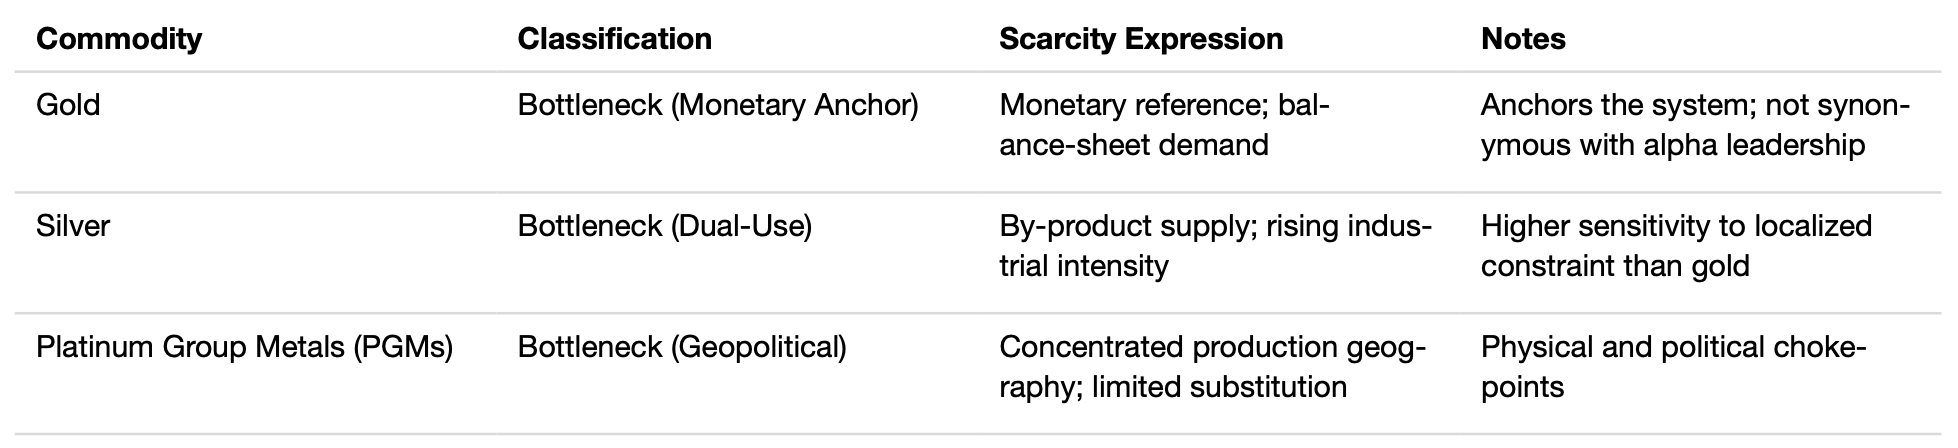
Gold, silver, and platinum-group metals (PGMs) express scarcity through different channels. In this regime, the key question is not whether “precious metals” move together, but where the binding constraint sits: monetary balance sheets, by-product supply chains, or concentrated production geography.
- Gold: Gold’s scarcity channel is governed by monetary demand, liquidity, neutrality, and balance-sheet acceptability. It anchors valuation and confidence as a reserve asset rather than expressing scarcity through industrial throughput. A key differentiator, discussed repeatedly in earlier In Gold We Trust reports, is stock-toflow: The above-ground stock of gold is enormous relative to annual mine supply, so marginal supply gains or temporary disruptions are often negligible compared with the existing stock.[2] That matters because gold is mostly held and reheld rather than consumed like most commodities. Its price is therefore driven less by supply tightness than by the opportunity cost of trust.
- Silver: Silver partly shares gold’s monetary characteristics, but its scarcity channel is more exposed to by-product supply dynamics and rising industrial intensity. As demand accelerates, tightness therefore tends to localize in specific nodes.
- PGMs: Concentrated production and limited substitution keep the supply system narrow, allowing constraints to persist when disruptions occur.
Precious Metals in Relation to Scarcity under the Current Regime
Source: In Gold We Trust report
Energy
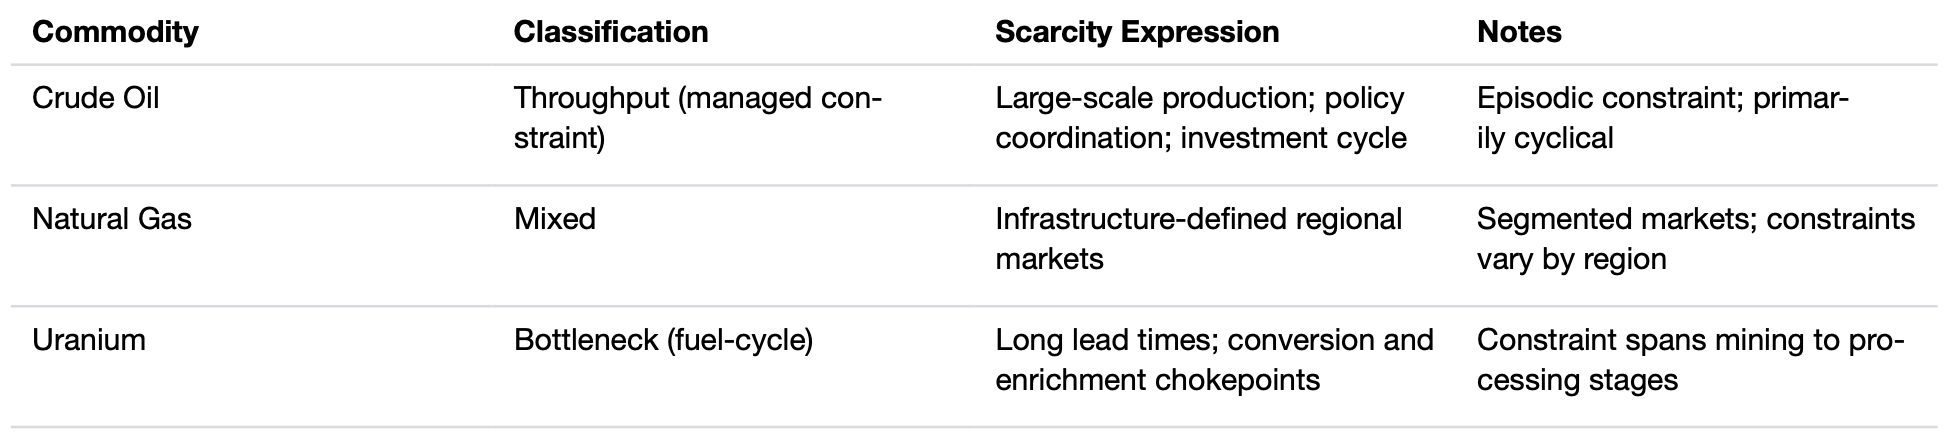
Energy markets sit closer to the throughput end of the spectrum – until infrastructure, policy, or fuel-cycle chokepoints force clearing to occur at specific nodes. Under current conditions, the constraint channel appears less as a uniform form of “energy scarcity” and more as a set of differentiated pathways of tightness.
- Oil: Large-scale production capacity exists, and effective supply often clears through investment discipline, geopolitics, and policy coordination. Tightness, therefore, tends to arrive in waves as the capex cycle and policy constraints interact with demand.
- Natural gas: Regional infrastructure governs deliverable supply through liquefaction capacity, pipelines, storage, and grid realities, segmenting price formation despite large aggregate resources.
- Uranium: The constraint runs across the fuel cycle – mining, conversion, enrichment, and fabrication – so pressure can persist when any node tightens, even if another node improves.
Energy in Relation to Scarcity under the Current Regime
Source: In Gold We Trust report
Base and industrial metals
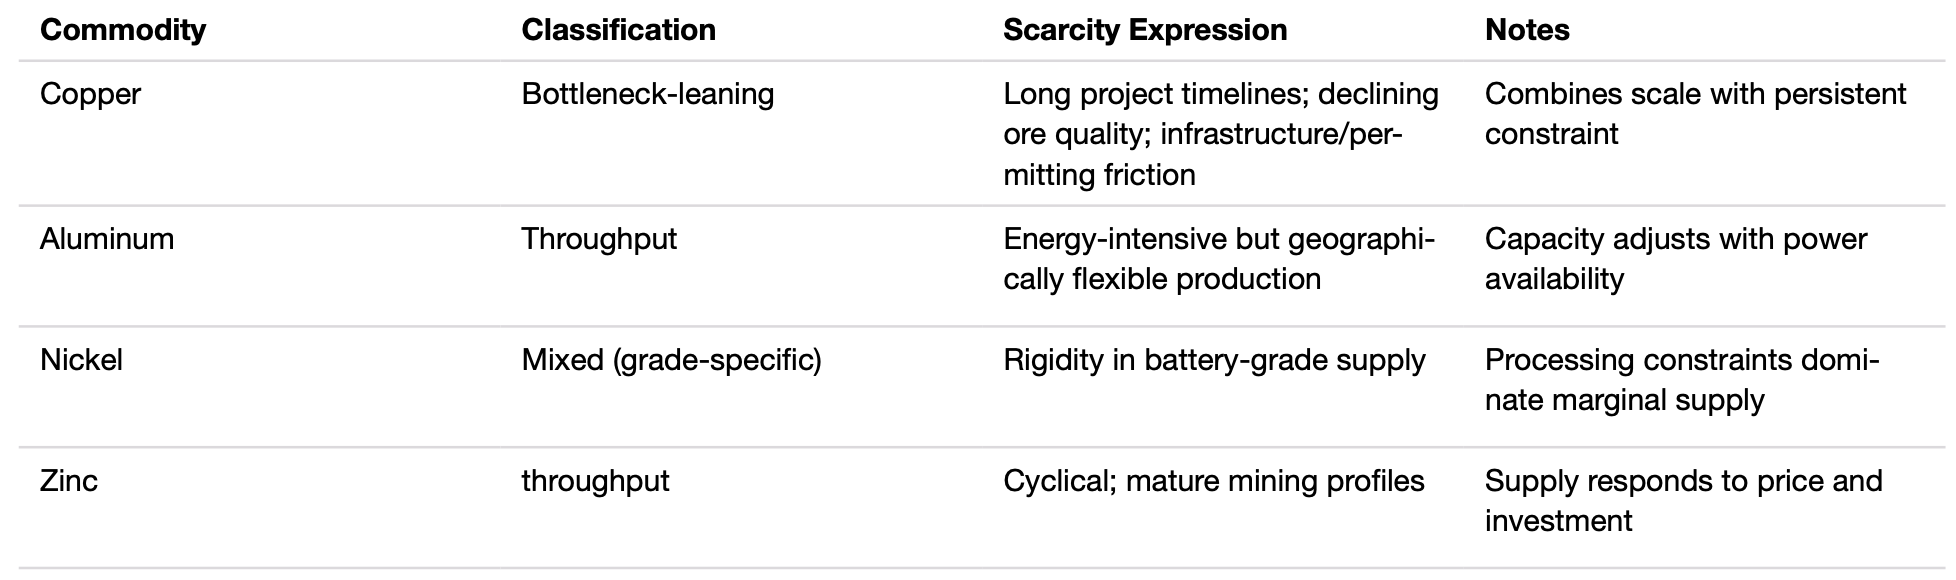
Industrial metals sit on a spectrum. Some systems can scale with capital and energy; others remain constrained by timelines, ore quality, and processing limits that keep the marginal unit scarce within the pricing window. The distinctions below clarify where scarcity is most likely to persist and where it is more likely to mean-revert.
- Copper: The system’s responsiveness is limited by long project timelines, declining ore quality, and permitting and infrastructure frictions that delay marginal supply.
- Aluminum: Production is geographically flexible, and reliable low-cost energy sets the binding constraint, shifting scarcity toward power policy and energy availability.
- Nickel: Outcomes depend on processing route and purity. Large-scale supply growth does not necessarily translate into scalable battery-grade output, allowing quality-specific tightness to persist.
- Zinc: A mature mining profile and cyclical investment response shape the supply function, with constraints compounding mainly during disruptions that tighten buffers.
Base and Industrial Metals in Relation to Scarcity under the Current Regime
Source: In Gold We Trust report
Softs
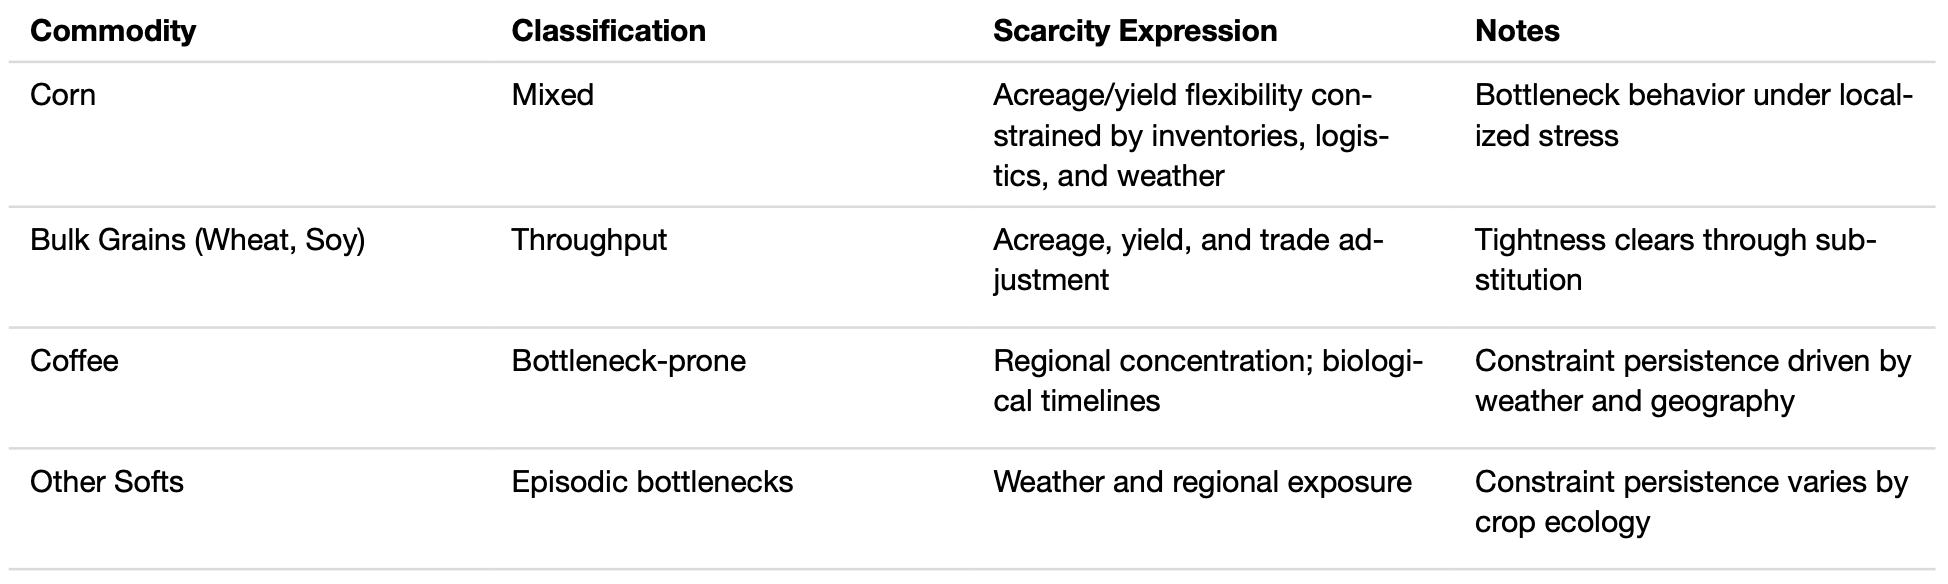
Agricultural systems often clear through acreage, yield, and trade – until weather, inventories, and logistics compress buffers at the same time. When that happens, scarcity becomes less a question of global totals and more a question of timing, regional exposure, and the speed of biological response.
- Corn: Acreage and yield provide the main adjustment channel, with bottleneck behavior emerging when weather stress, inventories, and logistics tighten simultaneously.
- Bulk grains (wheat, soy): Trade, substitution, and acreage decisions usually provide the clearing mechanism, with scarcity episodes intensifying when multiple producing regions come under stress at the same time from geopolitics or weather.
- Coffee: Biological timelines define the response function, while regional concentration and weather volatility can extend tightness through slow replanting cycles.
- Other softs: Scarcity episodes depend on production ecology and regional exposure, with persistence determined by how often the stressor recurs and how long it lasts.
Softs in Relation to Scarcity under the Current Regime
Source: In Gold We Trust report
What the map implies about returns
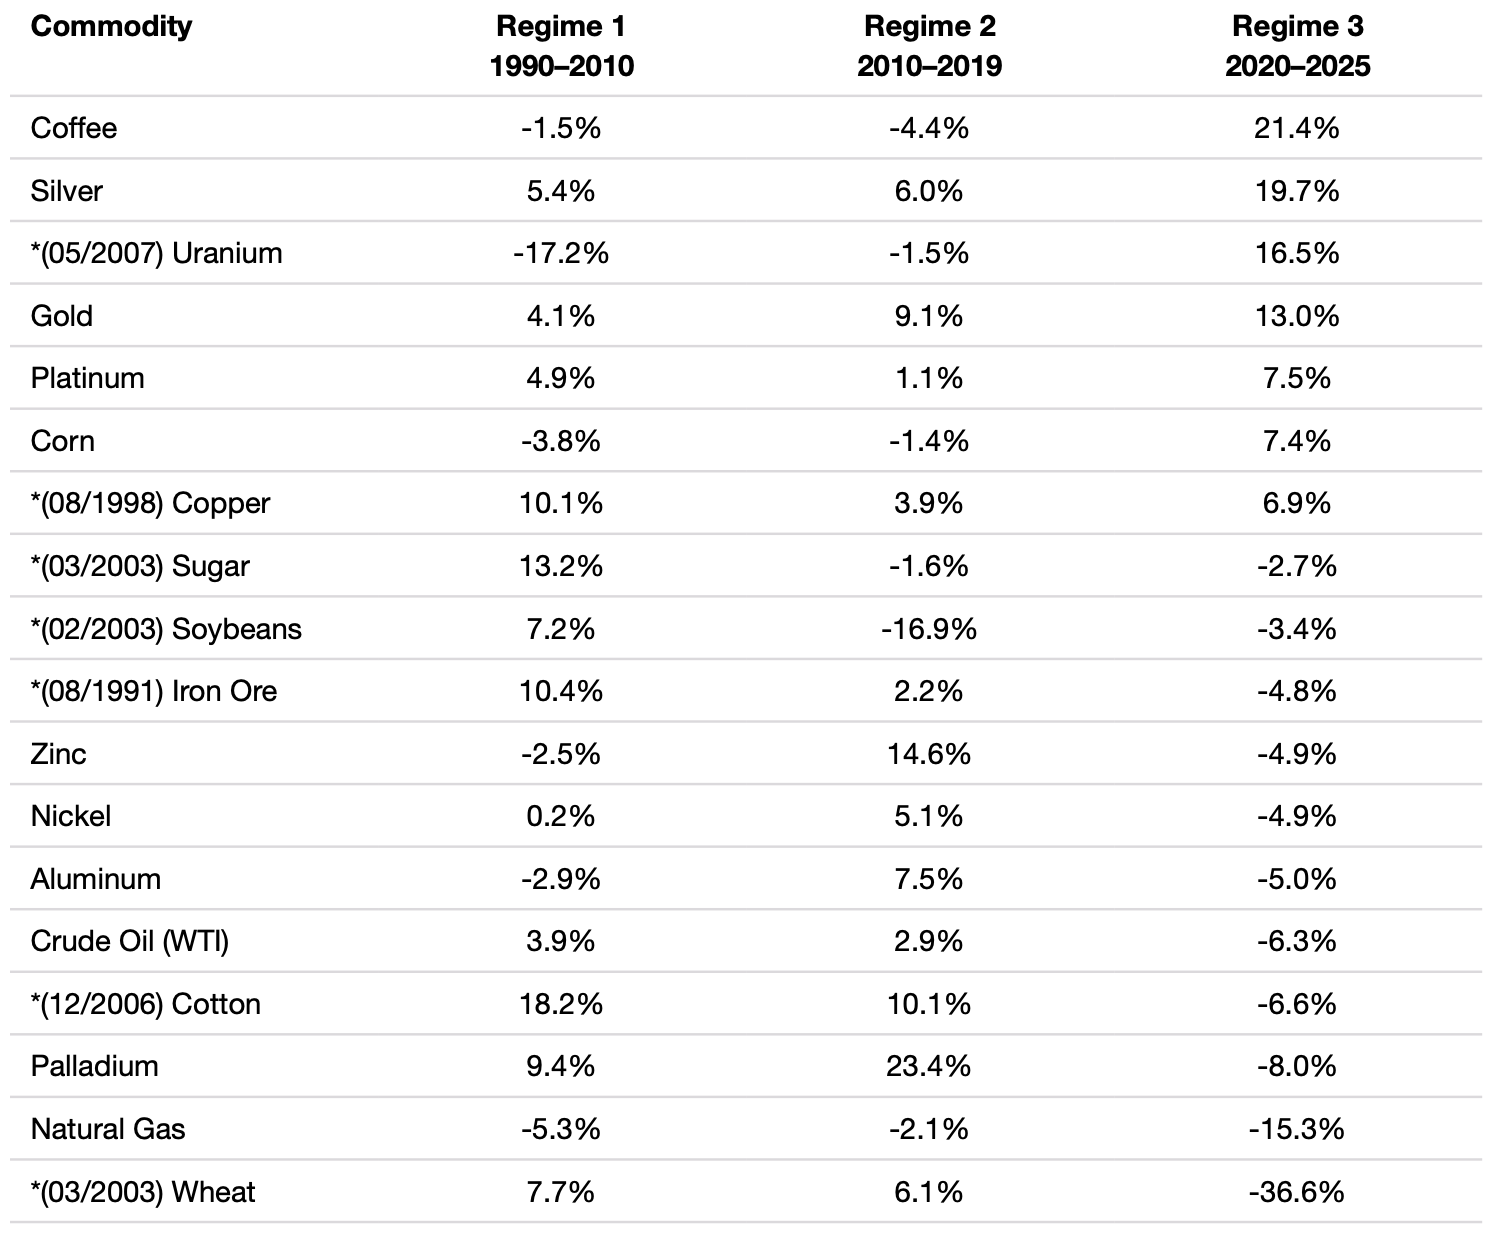
The foregoing classification helps explain why benchmark-relative outperformance has become both narrower and more persistent. Throughput shocks can still produce sharp moves, but those moves are usually followed by a supply response – through capacity additions, substitution, and buffer rebuilds – that limits relative compounding within the pricing window. Bottleneck shocks behave differently. Because relief is delayed at the binding node, tightness persists, allowing benchmark-relative outperformance to compound over longer stretches.
Commodity Return Relative to BCOM, CAGR, 01/1991*–12/2025
Source: TradingView, Incrementum AG
Broad index exposure, by design, dilutes that dynamic. Broad baskets include many scalable markets whose relative gains mean-revert once supply responds, even as a smaller subset continues to compound under durable constraints. It is like buying a fruit salad in search of a vitamin C spike when what you actually needed was the oranges (the bottleneck asset). Instead, you fill up on melon (the throughput asset), which is watery and abundant. The result is that the scarcity premium is muted by everything in the basket that can scale.
The table makes this distribution explicit. It shows BCOM-relative CAGRs by commodity and by regime. Positive values indicate sustained excess compounding relative to the index, while negative values indicate persistent lag. The pattern is clear: A narrow set of markets generates durable benchmark-relative gains, while a broader group remains weak or unstable because its tightness clears through supply response rather than persistent constraint premia.
From Beta to Bottlenecks: The Post-2020 Allocation Playbook
In the post-2020 regime, commodity beta has become a dilution trade. Broad baskets increasingly capture the average performance of scalable supply systems rather than the excess returns generated by the few markets facing binding constraints. Scarcity has not disappeared; it has become localized. Leadership now concentrates where supply cannot scale within the time horizon that sets price – whether the bottleneck lies in permits, processing, infrastructure, jurisdiction, or weather – while throughput markets tend to mean-revert as supply response arrives.
The edge, therefore, has shifted from owning “commodities” in the broad sense to owning the constraint. This is now a dispersion regime: The task is to identify the bottleneck, size the exposure deliberately, and stop expecting the index to capture the regime’s scarcity premium. That is where the barbell strategy comes in.
The barbell: defense, offense, and the overlay
Think of post-2020 commodity allocation as a barbell rather than a single “commodity sleeve”.
Gold = Defense (Goalkeeper)
In this framework, gold is not there to win the match; it is there to keep you from losing it. Think of gold as the goalkeeper in a portfolio built for the post-2020 commodity regime. When the stock-bond hedge becomes state-contingent and policy and inflation volatility rise, you need one position whose job is to stabilize the scoreline. That is gold’s role. It anchors the portfolio’s valuation frame and absorbs demand for balance-sheet trust without depending on industrial throughput. That matters, because the rest of the commodity complex is fragmenting into localized, node-specific constraint regimes.
Operational role:
- Gold anchors the portfolio’s valuation frame by providing a stable monetary reference asset when trust in financial claims is being repriced.
- It absorbs macro stress by helping stabilize the portfolio when stock-bond correlations become unreliable and policy or inflation volatility rises.
- It underwrites risk-taking elsewhere by creating the defensive base that allows more aggressive exposure to bottleneck assets without making the overall structure fragile.
In short, gold keeps you in the game so that your bottleneck “strikers” can take risks where they are actually rewarded.
Bottleneck Sleeve = Offense (Strikers)
If gold is the goalkeeper, the bottleneck sleeve is the front line: the strikers you rely on to put points on the board. This is where benchmark-relative compounding increasingly lives. The opportunity sits in idiosyncratic bottlenecks that remain binding even after the market does the normal things it is supposed to do: Prices rise, capital appears, substitution is proposed, and investment announcements hit the tape. In a throughput market, that sequence usually relieves pressure. In a bottleneck market it often does not, because the constraint sits at a node that cannot scale fast enough. That is when returns become convex: Small changes in demand or ownership can produce outsized moves.
Operational role:
- The bottleneck sleeve targets the binding node by focusing exposure where supply cannot scale fast enough within the pricing window.
- It captures scarcity convexity by owning the markets where tightness is most likely to persist and price must do the clearing.
- It front-runs slow reallocation by positioning before broad capital rotates in and benchmark-relative gains become obvious.
In a nutshell, the bottleneck sleeve is where you try to win. But it only works if the goalkeeper is already in place, because strikers are of limited use if you concede every time the macro regime shifts.
Broad Commodity Baskets = Substitutes (Tactical Minutes, Not Your Starters)
If gold is the goalkeeper and the bottleneck sleeve is the front line, then broad commodity baskets are the substitutes: useful, and sometimes game-changing in the right moment, but not the players you build the season around. They can still play an important role when the macro script is clear; for example, during reflation, broad risk-on phases, inventory squeezes that lift the whole complex, or inflation impulses that pull most commodities higher together. In those moments, broad baskets give you general exposure to the pace and direction of the match.
But as a structural scarcity allocation, they are becoming less reliable. By construction, the index carries too much of what can still scale. It tends to overweight markets where supply curves can steepen, substitution remains available, and buffers can be rebuilt. In other words, broad baskets are filled with throughput systems that dilute the very constraint premium you are trying to own.
Operational role:
- Broad commodity baskets express the broad macro impulse by providing general exposure when reflation, risk-on, or inventory tightening lifts much of the complex together.
- They add tactical commodity beta by giving shorter-horizon participation in broad commodity moves when precision matters less than overall exposure.
- They complement, rather than replace, bottleneck exposure by serving as a supporting allocation rather than the core vehicle for capturing concentrated scarcity premia.
In short, broad commodity baskets still have tactical value, but in this regime they are supporting players, not the core expression of scarcity.
The “melon list”: what to avoid
If your goal is to own the regime’s scarcity premium, you need to stop treating commodities as a single bowl and start separating the assets that concentrate constraint from those that dilute it. In this regime, one of the biggest unforced errors is paying for the whole fruit salad when what you really wanted was one specific ingredient – only to discover the bowl is mostly melon: watery, bulky, and irrelevant to your actual objective. In commodity terms, “melon” means throughput exposure.
Avoid – or at least demote to tactical use – exposures dominated by the following:
- Broad commodity indices as a strategic holding
- Short-cycle supply-response markets
- Thick buffers and rebuildable inventories
- High substitutability at the margin
- “Reflation baskets” presented as “scarcity baskets”
The last point still needs some explanation: Many exposures perform well during the initial impulse, then give back relative gains as supply response clears the market. That is not necessarily a bad trade, but it is a different trade. The mistake is calling it scarcity when it is really macro beta in a fruit-salad wrapper.
A useful rule of thumb is this: If a market repeatedly clears tightness through response, it is not a structural bottleneck; it is a cyclical story wearing a scarcity costume. And if you are trying to own scarcity alpha, you do not want the bowl dominated by melon.
Bottleneck screen: what to hunt for
You are not trying to forecast a supercycle. You are screening for markets where constraints remain binding even after the usual adjustment mechanisms have tried – and failed – to clear them. As a rule, when bank strategists begin marketing a “supercycle”, it is usually a signal to become more selective, not broader, and to tighten risk. Focus on bottlenecks that show at least three of the following characteristics – the more, the better:
A) Time Moats
- Permitting moats and long lead times, including multi-year approvals and slow build cycles
- Long development timelines from exploration to feasibility, financing, construction, and commissioning
B) Chokepoints in the Value Chain
- Processing or refining concentration, such as midstream monopoly or oligopoly structures or single-country dominance
- Conversion capacity limits, where raw material exists but usable forms remains bottlenecked
C) Control and Jurisdiction
- Jurisdictional concentration, with supply concentrated in a small number of producers or regions
- Export controls or resource nationalism risk, where policy can constrain supply faster than capex can expand it
- Strategic stockpiling that removes float when pressure rises
D) Geological Reality
- Declining ore grades or depletion effects
- Complex metallurgy that prevents a rapid expansion of “easy supply”
- Co-product dependence, where the price of that commodity itself does not primarily drive supply
E) Buffer Fragility
- Thin inventories or low buffer capacity
- Low spare capacity and limited swing supply
F) Substitution Limits
- Low substitutability at the margin because of technical constraints, qualification cycles, or safety and regulatory limits
- Demand rigidity in key end uses, where replacement is slow rather than immediate
G) Infrastructure Dependence
- Single points of failure in ports, rail, power, or water
- Logistics fragility that turns “available supply” into “undeliverable supply”
H) Capital Friction
- Mandate friction or political constraints that delay capital formation
- Underownership combined with slow reallocation
The quick screen question is this: Where is the market’s clearing node? If it sits in a hard bottleneck (think: permits, processing, infrastructure, control, or weather) rather than in a scalable supply response, you are closer to the regime’s structural winners.
The node test: 7 questions to separate bottlenecks from throughput
- As a service to our readers, we distill the throughput–bottleneck framework into seven practical questions you can apply to any commodity theme. The objective is simple: Separate cyclical reflation beta from genuine scarcity exposure before you commit capital.
- What am I actually trying to own: reflation beta or scarcity alpha?
- Is this market a throughput system or a binding-node system?
- Where is the constraint: resource access, permits, processing, infrastructure, jurisdiction, or weather?
- Can supply respond within the time horizon that sets price? If yes, treat it as cyclical rather than structural.
- Are inventories and spare capacity deep enough to absorb shocks and rebuild? If yes, scarcity premia are more likely to fade.
- Is substitution real at the margin or just a slide-deck promise? How long would it take to qualify alternatives?
- What would have to change for this market to stop being a bottleneck: new processing capacity, a policy reversal, infrastructure expansion, technological substitution, or permitting reform?
If you cannot answer these questions clearly, treat the trade for what it is: narrative beta, not scarcity exposure. In this regime, the index is the glossy brochure, while the constraint premium is earned at the bottleneck itself – where throughput fails and the marginal unit cannot arrive in time. Own the bottleneck, or accept that the basket will dilute the very move you are trying to capture.
[1] See “The Valuation and Beta of the Gold Mining Industry,” In Gold We Trust report 2024
[2] See “The Stock-to-Flow Ratio as the Most Significant Reason for Gold’s Monetary Importance,” In Gold We Trust report 2014