

Silver After the Surge: Stairway to Heaven or Highway to Hell?
“How everything still turns to gold And if you listen very hard The tune will come to you at last When all are one, and one is all, yeah To be a rock and not to roll.”
Stairway to Heaven, Led Zeppelin
- While industrial demand laid the foundations for silver’s rise to a record high of USD 121, the rise culminated in speculative frenzy, as net ETP investment skyrocketed 312% yoy in 2025.
- The silver market balance (including ETPs) widened to a record deficit of -318.4 Moz in 2025, marking the seventh successive negative year and amounting to 1.3 Boz cumulatively.
- In 2026, this negative market balance is set to persist at -76.3 Moz, as a forecasted 0.3% fall in mine output offers no rebuttal to the theory that “peak silver” was reached in 2015.
- An expected -19% in solar offtake will throw a spanner in the works of silver’s industrial engine in 2026, although green shoots are emerging in the form of EVs and data centers.
- Above all, the extent to which an investment demand renaissance continues will determine silver’s fate in 2026, with Western investors yet to follow India into the burgeoning silver bull.
- Even in a world where silver trades sideways amid inflation, investors seeking high beta would do well to consider silver miners, which generate 80% profit margins at USD 80 silver.
When we published the first edition of the In Gold We Trust report in May 2007, the silver price was hovering around USD 13. Almost two decades later, our In Gold We Trust report 2025 ““The Big Long”, was launched against a backdrop of USD 32 silver. In the interim, we maintained our conviction that the white metal was historically undervalued. In doing so, we remained resolute in the face of the naysayers who labelled our contrarian play a “worthless pet rock”.
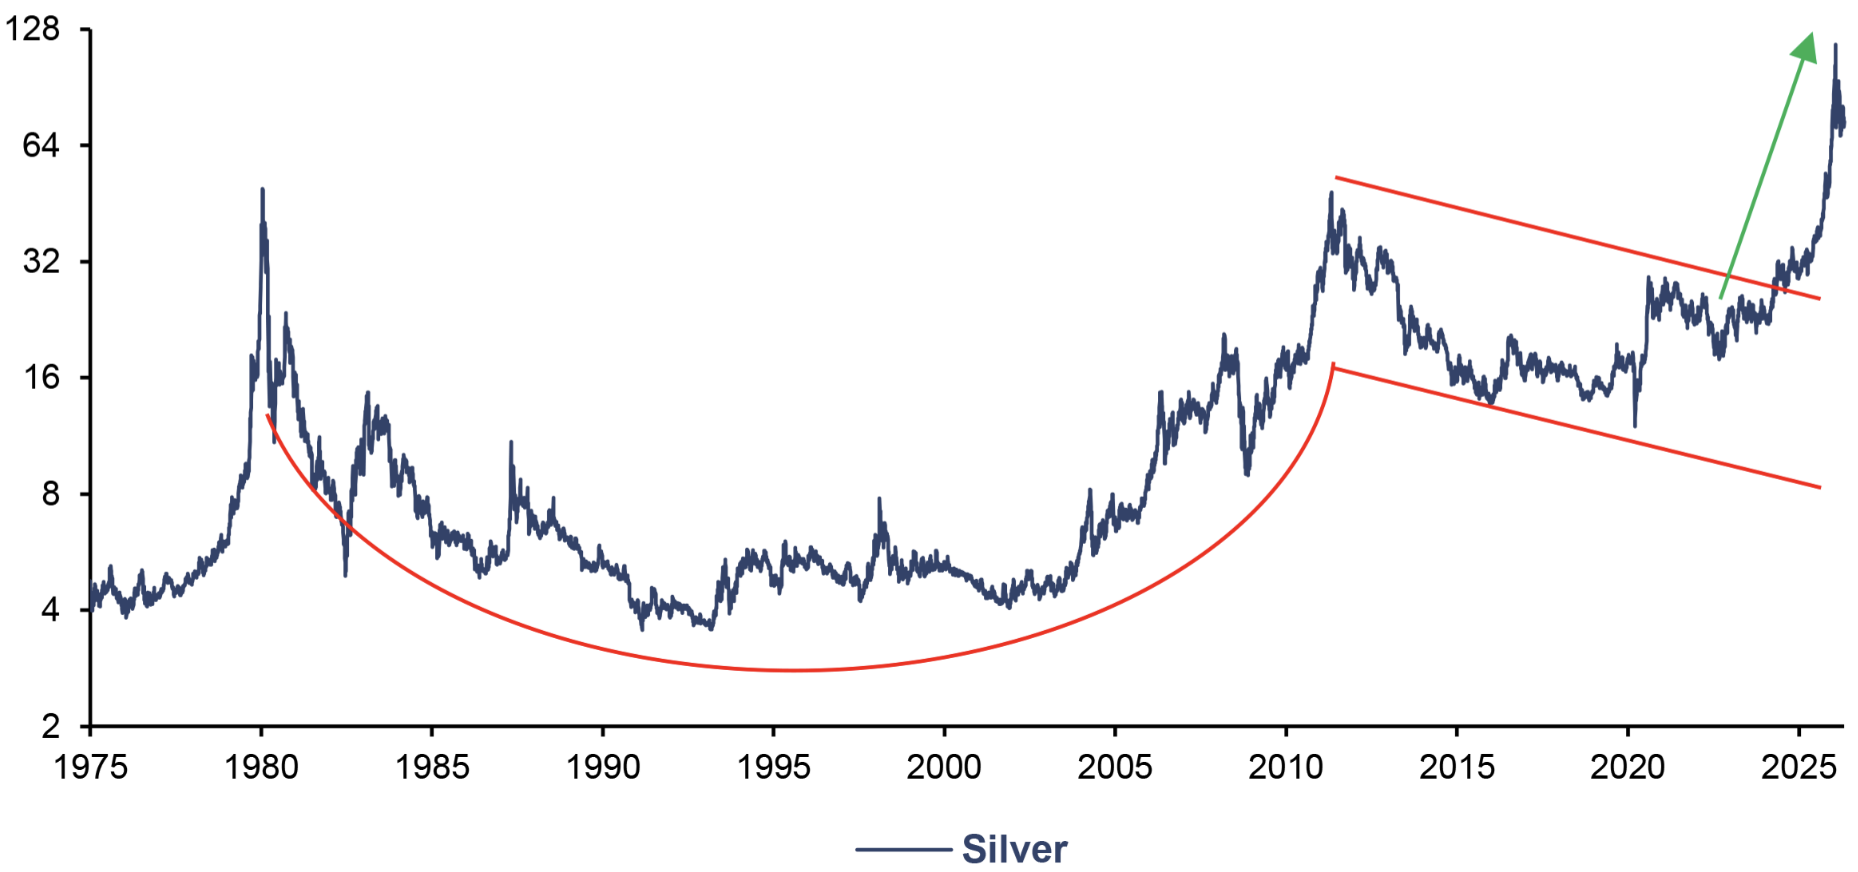
Specifically, we wrote in the In Gold We Trust report 2016, amid a USD 15 near-bottom, that “the price of silver is definitely at a historically extremely low level”. More recently, we reiterated in the In Gold We Trust report 2024, “The New Gold Playbook”, that at a USD 25 silver price: “we are bullish on silver and silver miners for 2024 and beyond, both as a uranium-esque supply-deficit play and as a high-beta play on gold”. Naturally, after years of positing that the silver bull would break free from its technical shackles, the metal’s surge to record highs above USD 121 was vindicating to say the least.
Silver (log), in USD, 01/1975–04/2026
Source: FactSet, LSEG, Incrementum AG
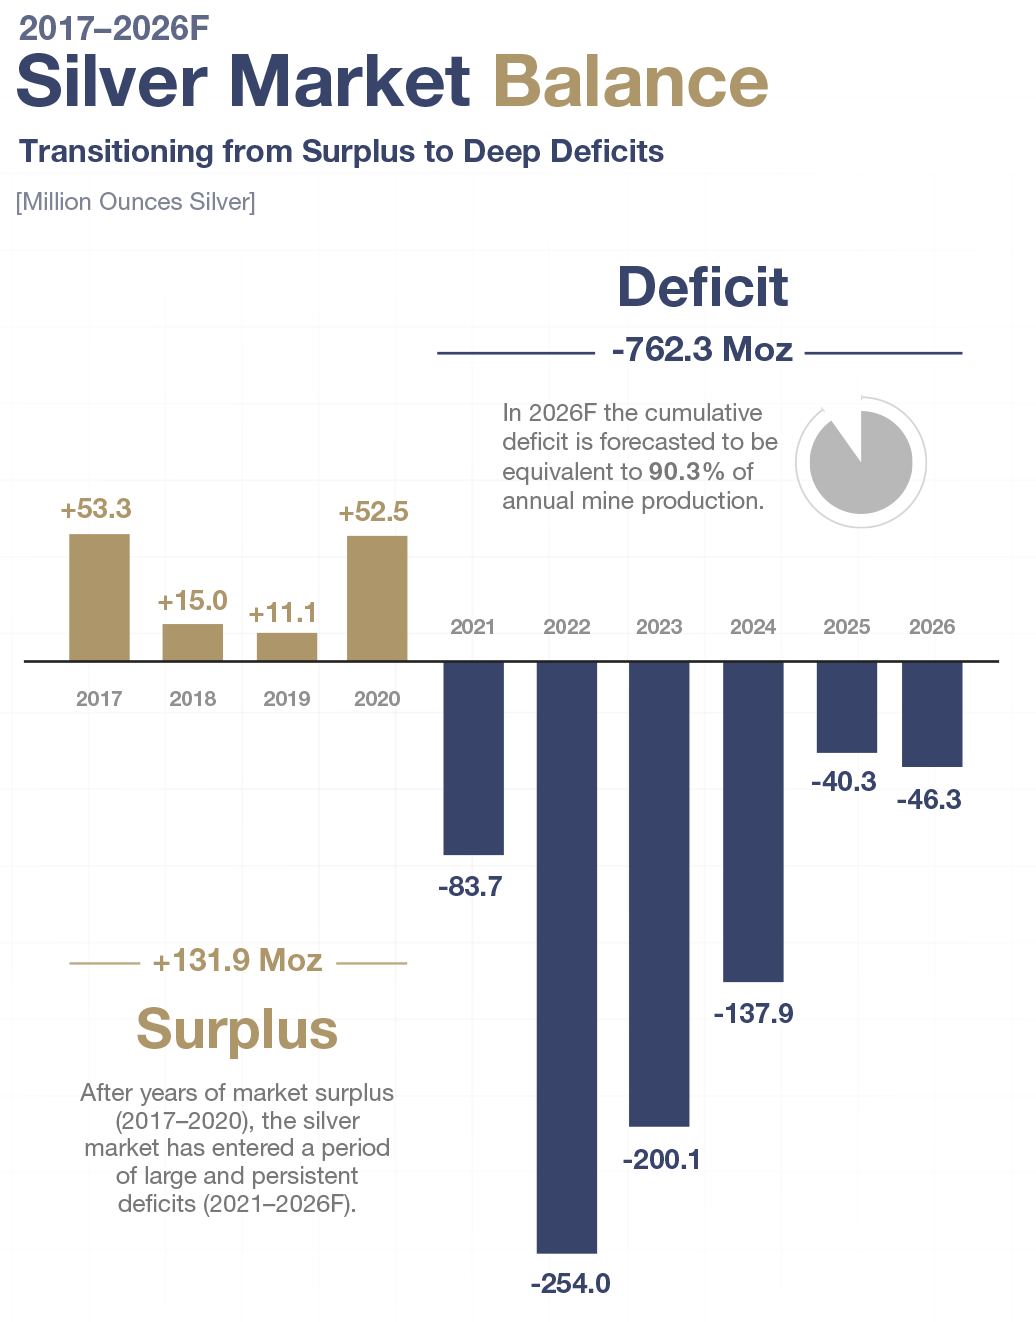
Beyond that, silver’s meteoric rise reaffirmed the enduring relevance of fundamental investing principles in an age of AI and algorithmic trading. That is, silver’s ~570% increase from its 2022 lows to its peak on January 29, 2026 was grounded in five consecutive years of structural supply deficits. From 2021 to 2025, this ~800 Moz cumulative shortfall was almost equivalent to one entire year of silver mine production.
Source: The Silver Institute, MiningVisuals, Incrementum AG
Of course, silver’s historic move was amplified by additional factors. First and foremost, episodic declines in speculative positioning triggered bouts of short covering that acted as an accelerant to the rally. For instance, managed money short exposure on the COMEX fell sharply from 15,433 to 11,648 contracts between late May and early June 2025. A similar dynamic was observed between mid-August and early September 2025, when shorts declined from 16,574 to 12,523 contracts alongside a move in silver from USD 37 to USD 40. Ultimately, these positioning dynamics helped silver cruise past 13year highs.
And yet, silver was not driven by short covering alone. Instead, rising l ong exposure and, at times, expanding open interest indicated that fresh capital was entering the market. That was until October 7, 2025, when managed money longs, having consolidated around 50,000 for six weeks, declined sharply to 43,186. This preceded a sustained downtrend, which reached approximately 29,100 by December 30, 2025, and later 19,423 by January 26 – four days before the largest daily decline in silver’s history of 34%.
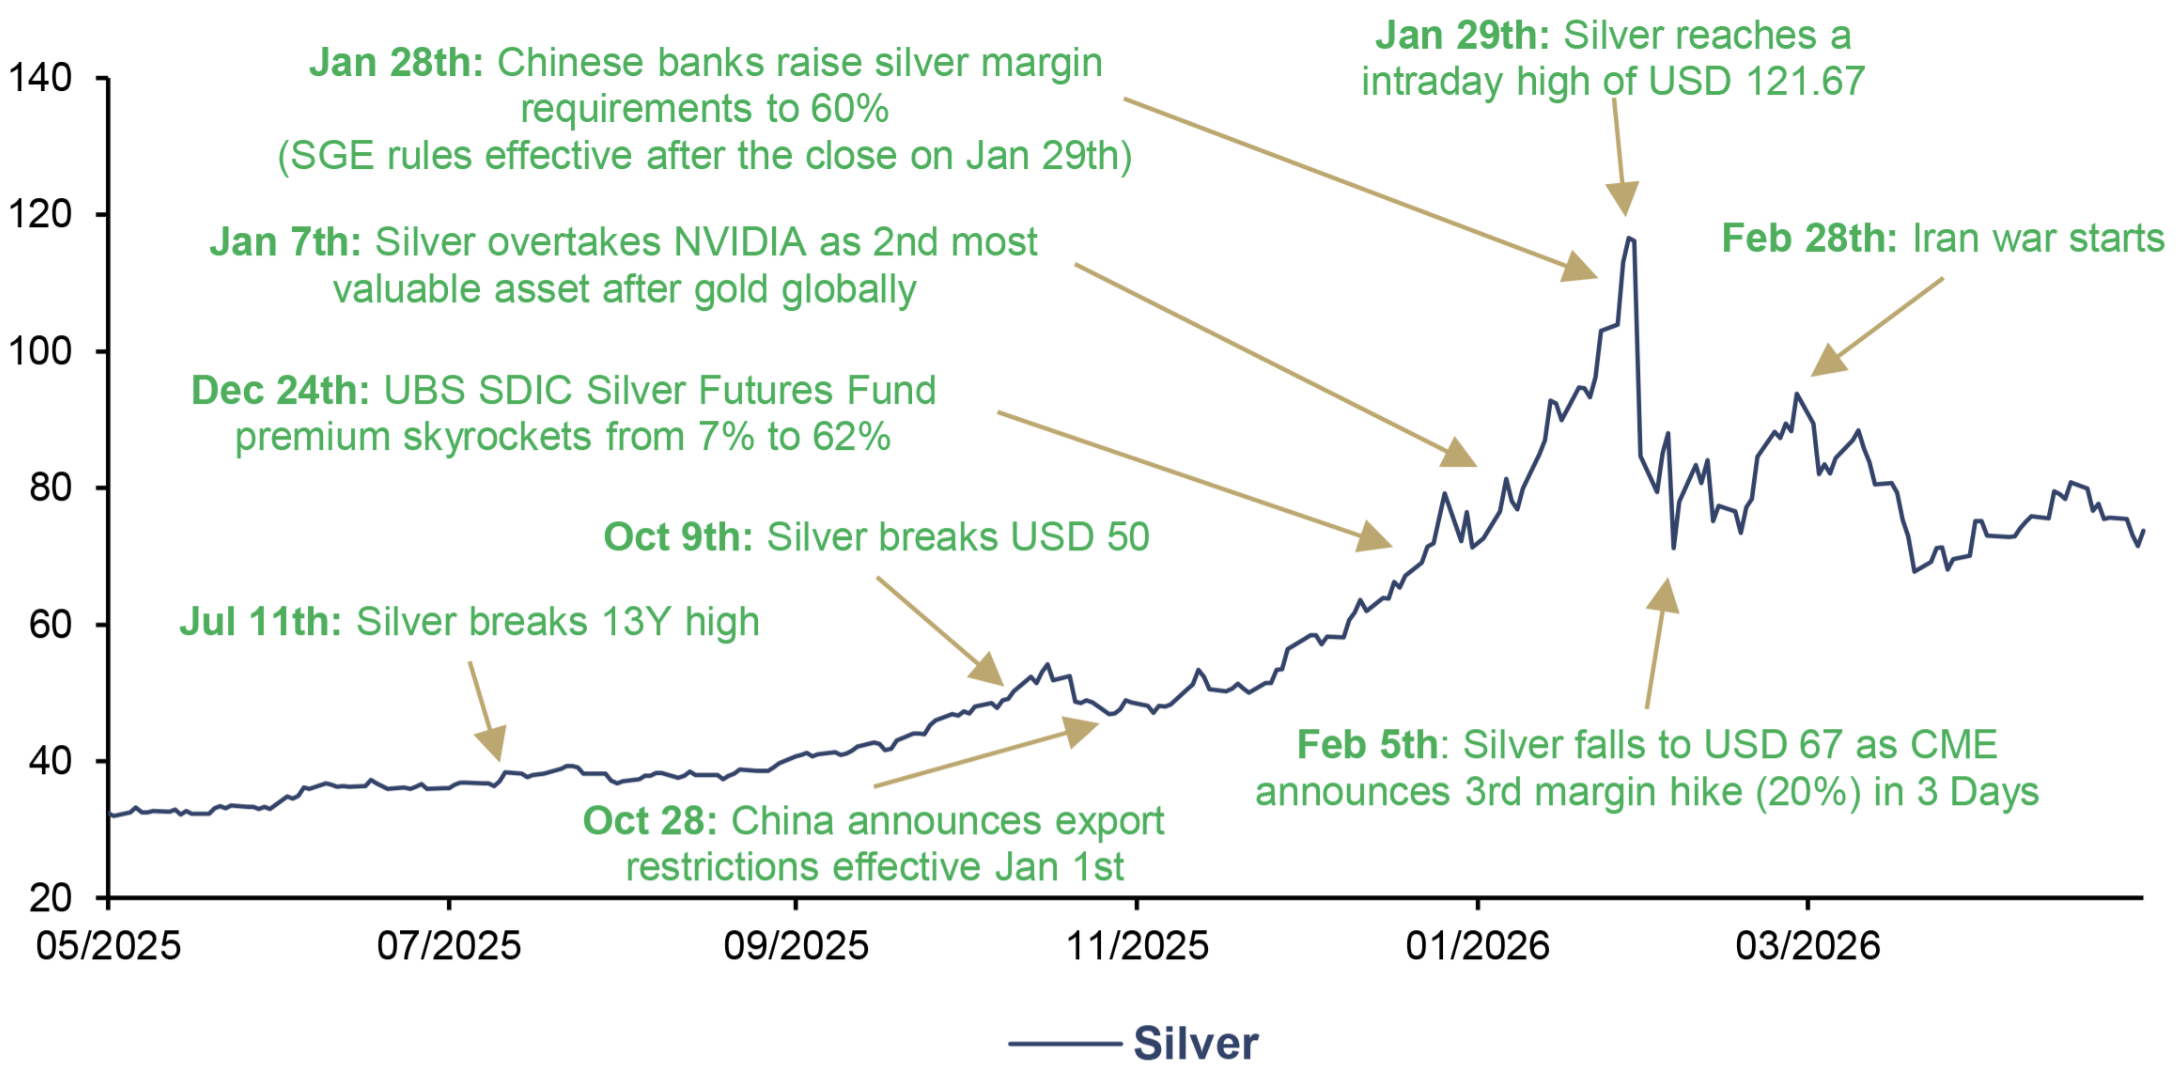
Silver, in USD, 05/2025–04/2026
Source: LSEG, Incrementum AG
In this sense, long accumulation helped carry silver to around USD 48 by early October 2025. Thereafter, however, managed money positioning began to unwind, and the drivers of silver’s advance became increasingly speculative. Perhaps most notably, China’s Ministry of Commerce confirmed on October 26, 2025 that new export licensing rules would take effect on January 1, limiting eligibility to state-approved firms producing at least 80 t annually. By late December 2025, premiums had skyrocketed to 62%, from 7%, on China’s UBS SDIC Silver Futures Fund, prompting a wave of subscription restrictions.
Between this, London tightness, US dollar weakness, and Federal Reserve rate cuts, silver leapfrogged Nvidia to become the world’s second most valuable asset in January, second only to gold. Inevitably, the speculative bubble burst after Trump’s nomination of perceived “hawk” Kevin Warsh as chair of the Federal Reserve. Overwhelmingly, though, it was the successive margin hikes by exchanges that curbed the frenzied speculation driving silver’s volatile ascent. Since then, the devil’s metal has done its utmost to stabilize above USD 70.
From Historic Undervaluation Toward Fair Value?
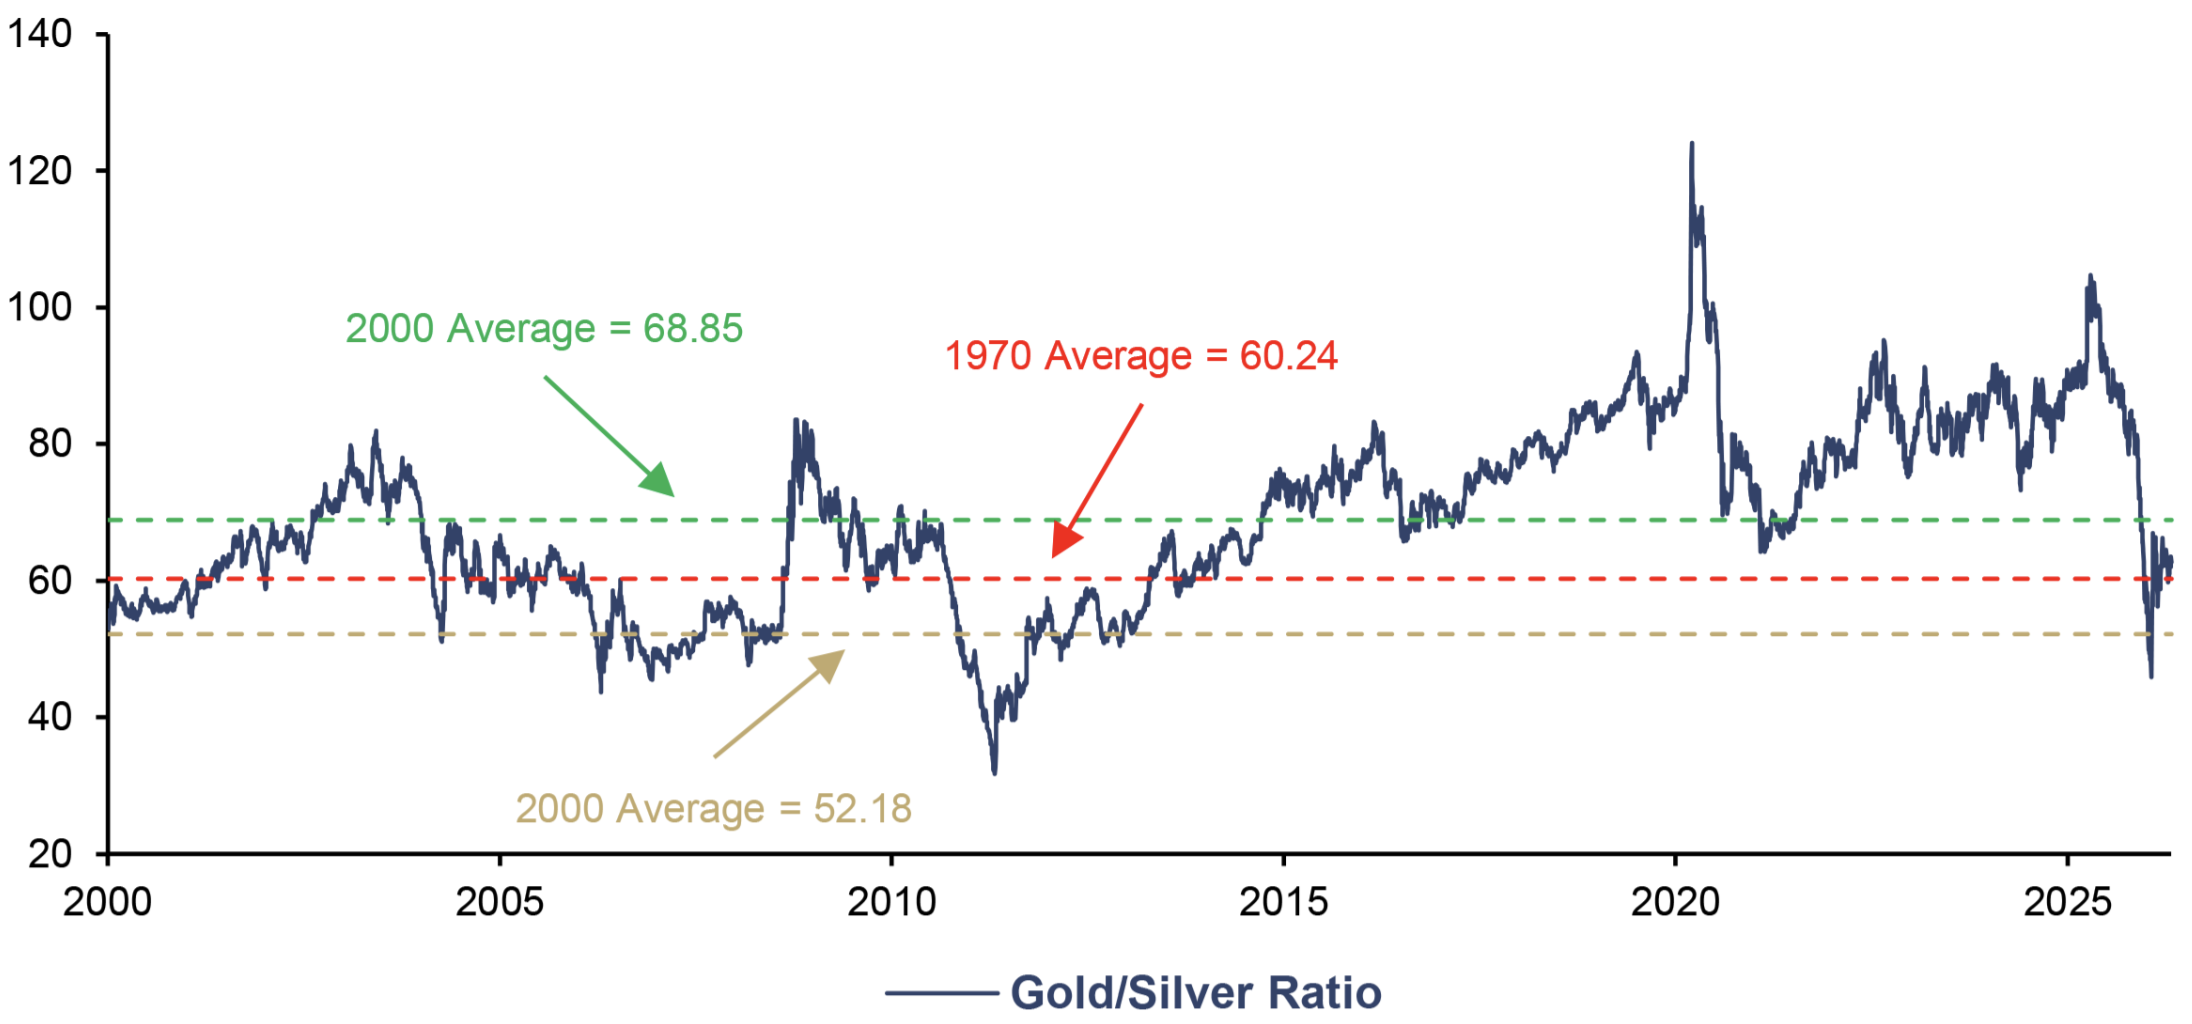
Undeniably, the historic undervaluation that defined silver as a contrarian investment has become noticeably less pronounced over the last 12 months. This is exemplified by the gold-silver ratio (GSR) reaching highs of 107:1 in April 2025, before compressing to 60:1 by December 2025, and ultimately plunging to lows of 45:1 by late January. Since then, the ratio has rebounded to around 60:1. Broadly in line with its historical average since 1970, this places silver closer to “fair value” than at any point since early 2014.
Gold/Silver Ratio, 01/2000–04/2026
Source: FactSet, LSEG, Incrementum AG
At first glance, this does not bode well for silver bulls. The last time the GSR declined to this extent was in March 2020, when it practically halved from 124 to 64 by February 2021. Prior to that, an even larger contraction occurred between November 2008 and April 2011, as the GSR descended from 83 to 32. In both cases, silver’s subsequent performance was broadly sideways to weaker. As such, one may view silver today as Oasis in 2009: fresh off a memorable run but seemingly headed for a prolonged hiatus.
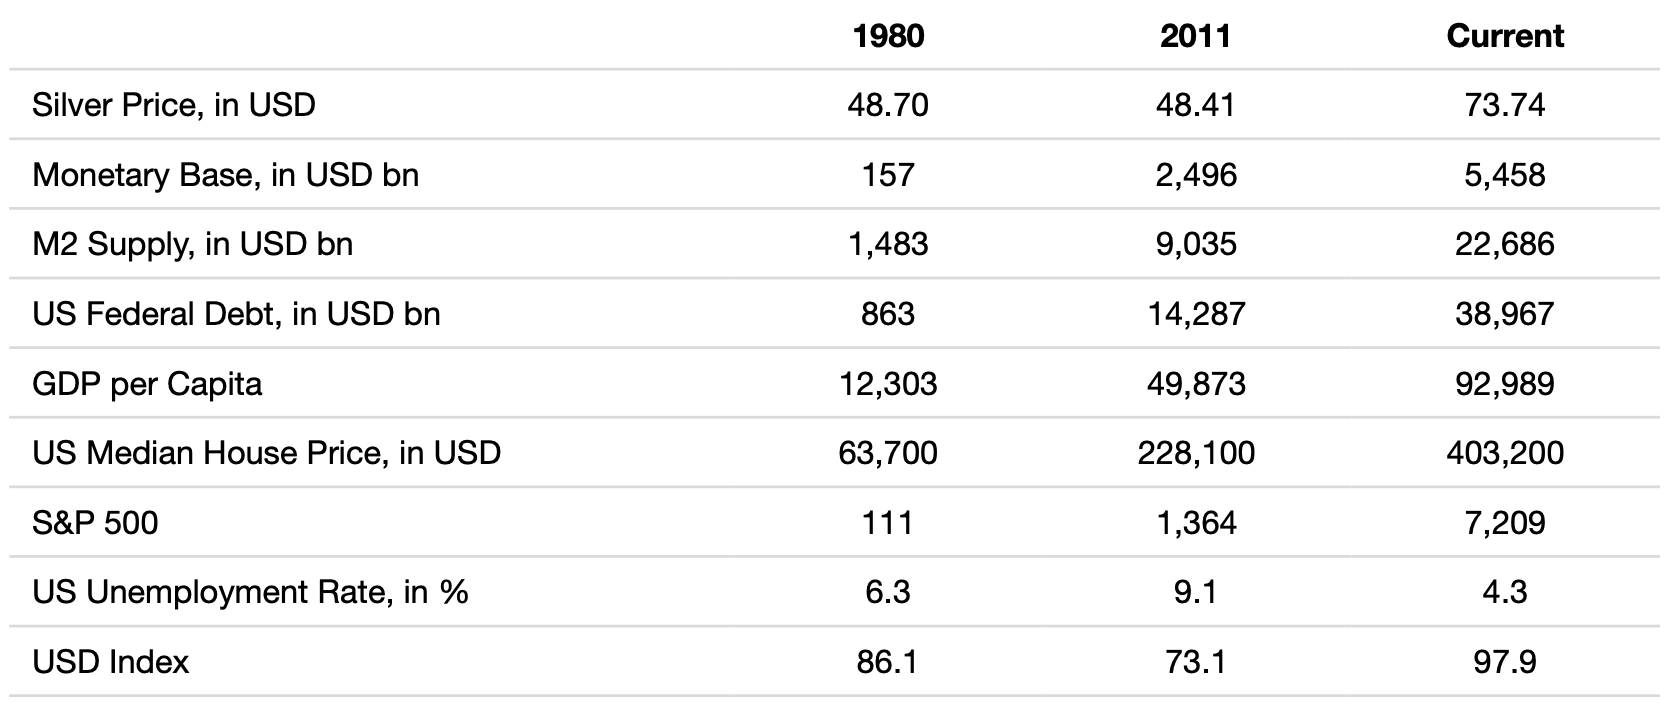
Meanwhile, Bank of America sees silver reaching USD 135–309 this year, premised on the GSR falling to 2011 lows of 32 and, in a more bullish scenario, to 1980 lows of 14. In parallel, the Reserve Bank of India’s new lending directives, effective April 1, allow silver to serve as collateral for bank and non-bank loans at a weight ratio of 10kg silver to 1kg gold. Lower than the ~15:1 GSR from the bimetallic standard, this remonetization implies gold is not alone in leading the charge “Back to the Monetary Future”. More importantly, it helps redefine silver as undervalued, even after it broke the notorious USD 50 ceiling.
Comparison of Various Macro- and Market Key Figures at Silver ATH in 1980, 2011 and Current
Source: treasury.gov, Federal Reserve St. Louis, LSEG (as of 04/30/2026), Incrementum AG
In light of this, the key question now becomes: Are silver’s fundamentals still conducive to an upward revaluation or do the mining stocks offer the highest-beta exposure to any next leg up? Secondly, will the investment demand renaissance be fleeting or will it be durable enough to offset expected weakness in jewelry and silverware? And thirdly, is a higher price sowing the seeds of industrial demand destruction or does silver’s elevation to critical mineral status in the US, as of November 2025, help render its moat impenetrable across solar, EVs, and data centers?
Silver’s Industrial Engine: Losing Steam or Firing on All Cylinders?
The persistence of a structural supply deficit is the first, and arguably most consequential, variable for the silver price in 2026 and beyond. Encouragingly, the Silver Institute forecasts a 46.3 Moz structural deficit this year, bringing the revised cumulative shortfall to 762.3 Moz over six consecutive years. This indicates that silver’s robust fundamentals will remain intact for at least one more year. That said, structural supply deficits have been gradually narrowing since the 254 Moz peak in 2022.
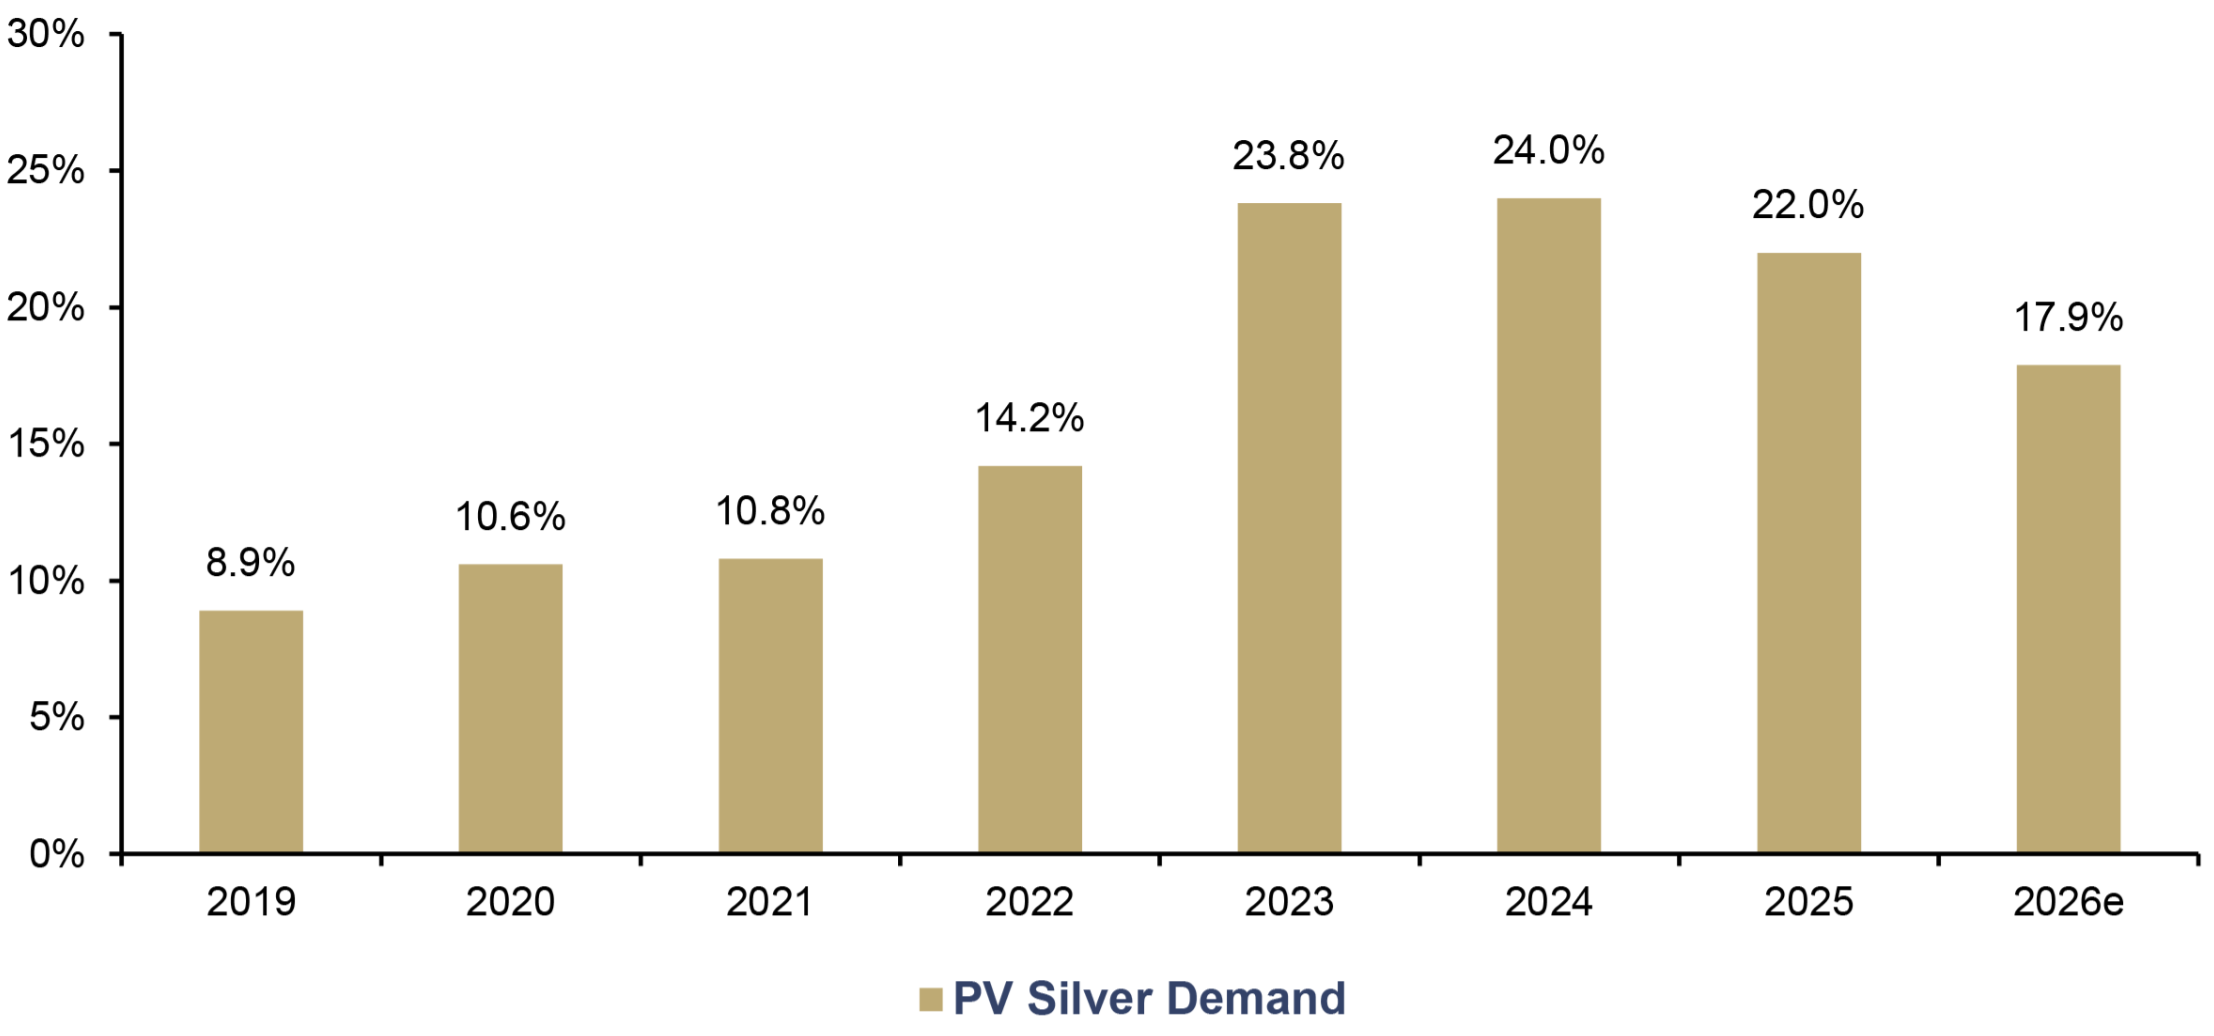
In 2026, this moderation is partly attributable to industrial demand, which is forecast to decline by 3% for a second consecutive year to 639.6 Moz. Still, representing 58% of the 1,130.6 Moz that comprised total silver demand in 2025, industrial demand remains as relevant and all-encompassing as the Beatles in the 1960s. Having grown from 74.9 Moz in 2019 to 186.6 Moz in 2025, solar PV offtake is naturally the George Harrison of silver industrial demand. Initially an understated contributor, Harrison developed each year, ultimately penning one of the band’s greatest hits in 1969: the solar-powered classic “Here Comes the Sun”.
PV Silver Demand, as a % of Mine Production, 2019–2026e
Source: Silver Institute, Metals Focus, Incrementum AG
To recap, it took solar a mere two years to go from consuming one in every ten ounces of silver produced annually to nearly one in four. However, in an environment characterized by higher silver prices, this seemingly relentless growth faces its greatest challenge yet. Chiefly, silver reached an estimated 30% of solar cell costs in early March at a USD 90 price, according to RBC Capital Markets. As per Bloomberg NEF, that’s up from a 5% share in 2023, and 14% in September 2025, when prices were USD 42–46. In 2026, this dynamic is feeding into an expected 19% decline in solar offtake, with the Silver Institute forecasting 151 Moz of demand amid “ongoing thrifting and outright substitution away from silver.”
At 500 gigawatts of annual solar production, this move away from silver and towards copper is estimated to result in USD 15bn per year in savings for the sector globally. Consequently, the world’s three largest solar panel manufacturers – LONGi, JinkoSolar, and Trina Solar – are spearheading a purported “copper shift”. LONGi announced it wo uld begin substituting base metals for silver in its solar cells in Q2/2026. JinkoSolar has reportedly used silver-coated copper pastes for rear-side contacts already and is actively testing front-side applications. Meanwhile, Trina Solar is developing a new copper-contact solar cell designed to reduce reliance on silver, according to the Financial Times.
Naturally, one may fear that elevated silver prices are driving silver’s solar-powered rise toward an early sunset. In reality, though, the sun should continue to shine over silver’s solar offtake in the near term, as global demand for cheap and quickly deployable energy lands before manufacturers can make the capex-intensive and time-consuming switch from silver to copper.
Average US Power Plant Development, in Years

Source: SEIA, Incrementum AG
It is estimated that even with unlimited funds, converting 50% of the ~300 global solar panel factories from silver to copper would take approximately four years – too long for a world now racing for domestic energy security. At the same time, Octopus Energy has seen a 50% rise in solar panel sales since the Iran war began, as buyers reacted to Hormuz-driven USD 100+ oil prices. More importantly, China’s solar panel exports soared to a record high in March, rising 125% month on month and 67% year on year in value terms to USD 3.61bn. In tandem, March was also the month in which Chinese silver imports surged to record highs above 800 t. No prizes for guessing where some of that metal ended up.
In due course, we expect innovatory efforts to produce a serious copper-silver hybrid. For the time being, though, silver’s solar moat is partly shielded by an immediate and urgent global energy demand. Our conviction is also grounded in silver’s superior conductivity, longevity, and corrosion resistance versus copper-based panels, which currently fall short of silver’s typical 25-year lifespan. This sentiment is echoed by Jean-Nicolas Jaubert, solar industry expert and Director of China Operations at Kiwa PVEL:
Both our own experience and the industry knowledge of copper paste is extremely limited. In short, we should brace for new failures as people start trying these solutions commercially, as it may be challenging to deploy quickly in a realistic way. Copper could diffuse into the cell and create new defects, or possibly interact with other BOM components, such as encapsulant additives.
In Search of Solar’s Successor
If solar demand was akin to the Beatles’ hit, “Here Comes The Sun”, then automotive demand must be “Drive My Car” — not the headline act, but a respectable contribution, nonetheless. In 2025, global EV sales grew 20% yoy to 20.7mn units, anchored by a 17% rise in Chinese sales to 12.9mn units and a 33% increase in Europe to 4.3mn units. Even as North American sales declined 4% to 1.8mn units in 2025, global EV sales have averaged above a 40% CAGR since 2017. As part of that, the additional EVs sold globally between 2023 and 2024 exceeded the total sales from 2020.
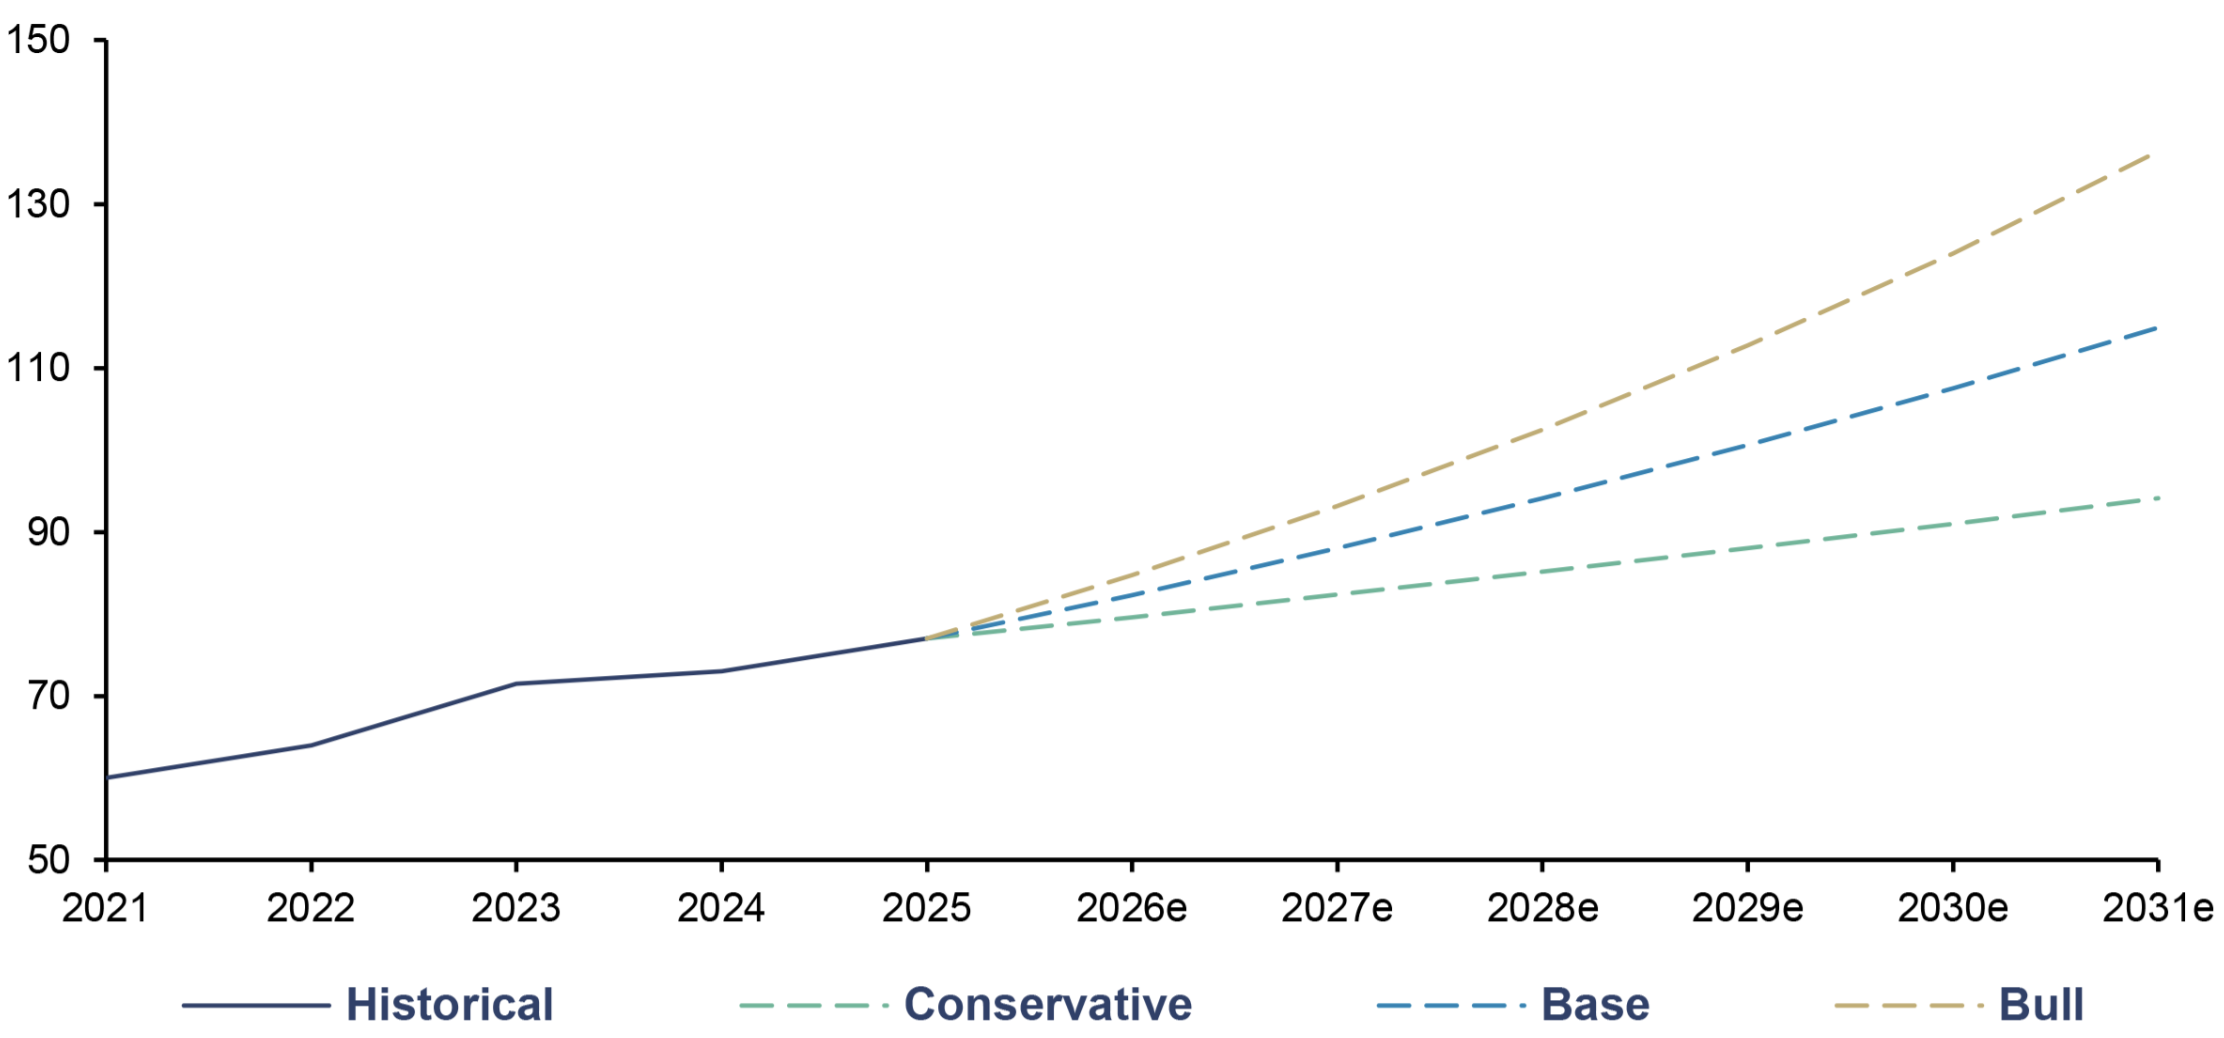
With 25–50 grams of silver used on average in an EV – some 67–79% more than in ICE vehicles – silver is a direct beneficiary of this accelerated growth. In 2024, ICE vehicles comprised 55% of automotive silver demand, while EVs trailed behind in second place at 30%. By 2027, the same study by Oxford Economics forecasts EVs will overtake ICE vehicles, before ultimately consuming 59% of the industry’s silver by 2031. At that point, annual automotive silver demand is estimated at 94 Moz. While conservative, this scenario could materialize after China – the nation behind roughly 3 out of every 5 EV sales globally globally – ended its decade-long full purchase tax exemption on EVs at the close of 2025, replacing it with a 5% levy from 2026.
Beneath the bonnet, however, lies a compelling case for upside surprise. Chief among these is China, where two thirds of EVs, without subsidies, were already priced below their ICE equivalents in 2024. This dynamic has lent itself to emerging markets such as Thailand, where an influx of affordable Chinese imports helped EVs to reach price parity with ICE vehicles in 2024. India, meanwhile, represents the largest untapped EV market on Earth, with EV penetration at just 2% against a 1.45bn population.
Notably, India, China, and Thailand source the majority of their oil from the war-torn Middle East – a concentration risk that was laid bare after oil spiked above USD 100 in March 2026. Against this backdrop, the green transition becomes less of a virtue-signaling exercise and more of a strategic imperative with a legitimate business case. In this accelerated EV adoption scenario, we envisage automotive silver offtake rising toward 110 Moz by 2031; albeit the figure could potentially surpass 130 Moz, when factoring in a higher silver-loading per vehicle.
Automotive Silver Demand, in Moz, 2021–2031e
Source: GlobalData, Oxford Economics, Silver Institute, Incrementum AG
Indeed, any outperformance would derive from the proliferation of electronics-intensive autonomous vehicles – a market growing at a 24% CAGR to reach USD 656bn by 2031. Equally, the marginal adoption of Samsung’s solid-state battery (SSB) could turbocharge silver offtake. Boasting twice the energy density of competing lithium-ion batteries and consuming 10–20 times more silver than average EV batteries[1], the SSB could add up to 20 Moz of silver demand at a mere 3% market share of today’s EV sales.
In aggregate, the automotive industry should add 3–9 Moz of silver demand per year. However, it is not likely to reach the 150+ Moz annual demand levels commanded by solar any time soon. Akin to the US, solar remains the de-facto global superpower of silver industrial demand. Impactful, but not dominant, automotive offtake is closer in stature to Canada, joining consumer electronics, power generation, and data centers as one of the many “middle powers” that collectively constitute silver industrial demand.
Data center silver demand may be likened to the potential of China in the 1990s: still a middle power for now, but firmly on track for graduation to superpower status. Data centers consume sizable quantities of silver as an input across connectors, printed circuit boards, semiconductor chip packaging, and thermal interface materials. In fact, silver’s thermal conductivity – the highest of any metal and 9% superior to copper – makes it uniquely suited to managing heat generated by AI chips, which run hotter and denser than any computing hardware that preceded them. This renders silver effectively irreplaceable in the AI server stacks powering today’s digital economy, including those that run large language models such as ChatGPT and Claude.
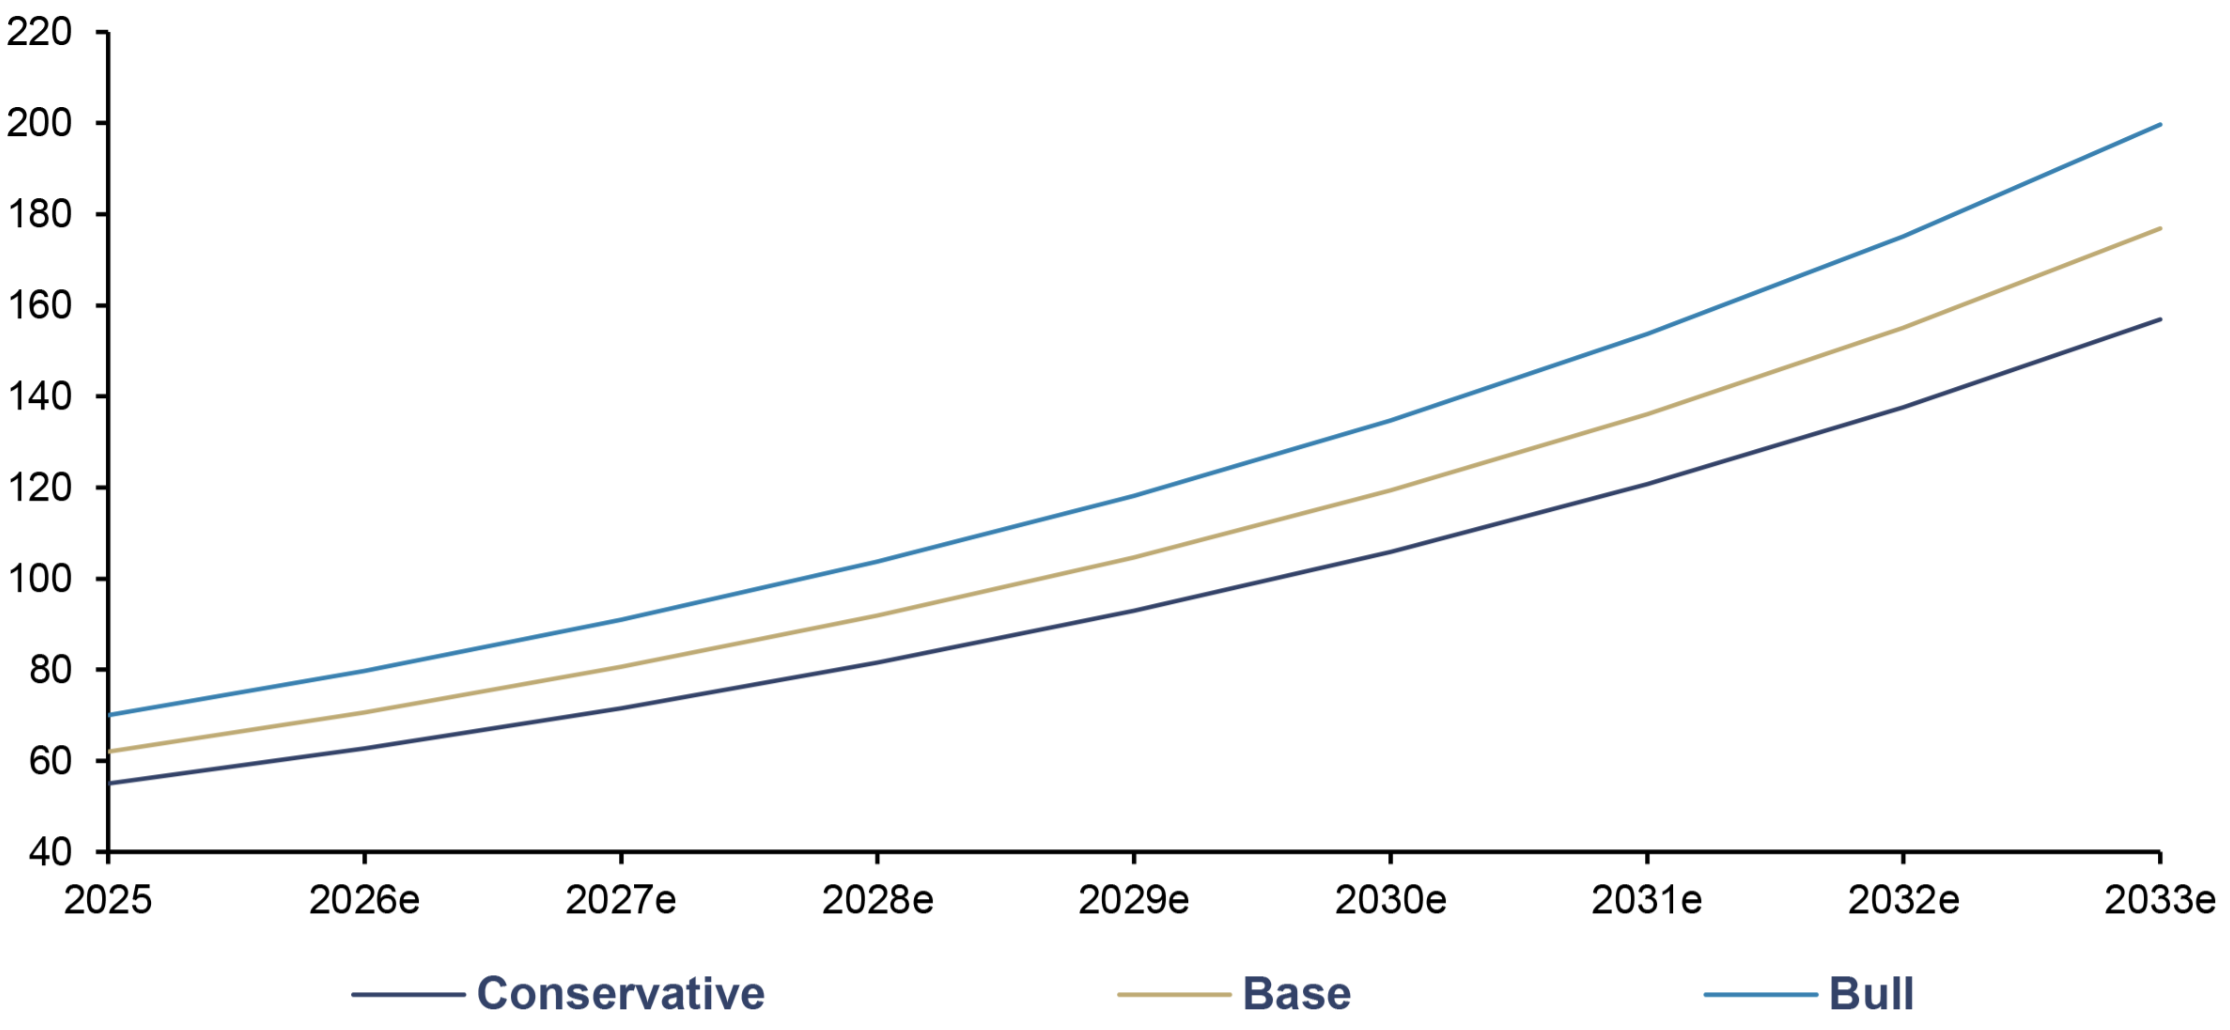
More broadly, global data center capacity has expanded fourfold from 26 GW in 2015 to 103 GW in 2025, with JLL projecting 200 GW by 2030 as a further 97 GW comes online. This growth will be powered by hyperscale projects such as Meta’s Hyperion campus – a 5 GW facility in Louisiana nearly the size of Manhattan – as well as OpenAI and Oracle’s USD 500bn Stargate initiative. All in, JLL projects a 14% CAGR for data center capacity through 2030, equivalent to approximately 16 GW added each year. For silver, we estimate this will add approximately 10 Moz to annual demand, as current data center silver consumption of 55–70 Moz grows toward 120 Moz by 2030. Thereafter, a continuation of a 14% CAGR could see data centers overtake solar as soon as 2031, before consuming up to 200 Moz of silver by 2033.
AI Data Center Silver Demand, in Moz, 2025–2033e
Source: Silver Institute, JLL, Incrementum AG
The Renaissance of Silver Investment Demand
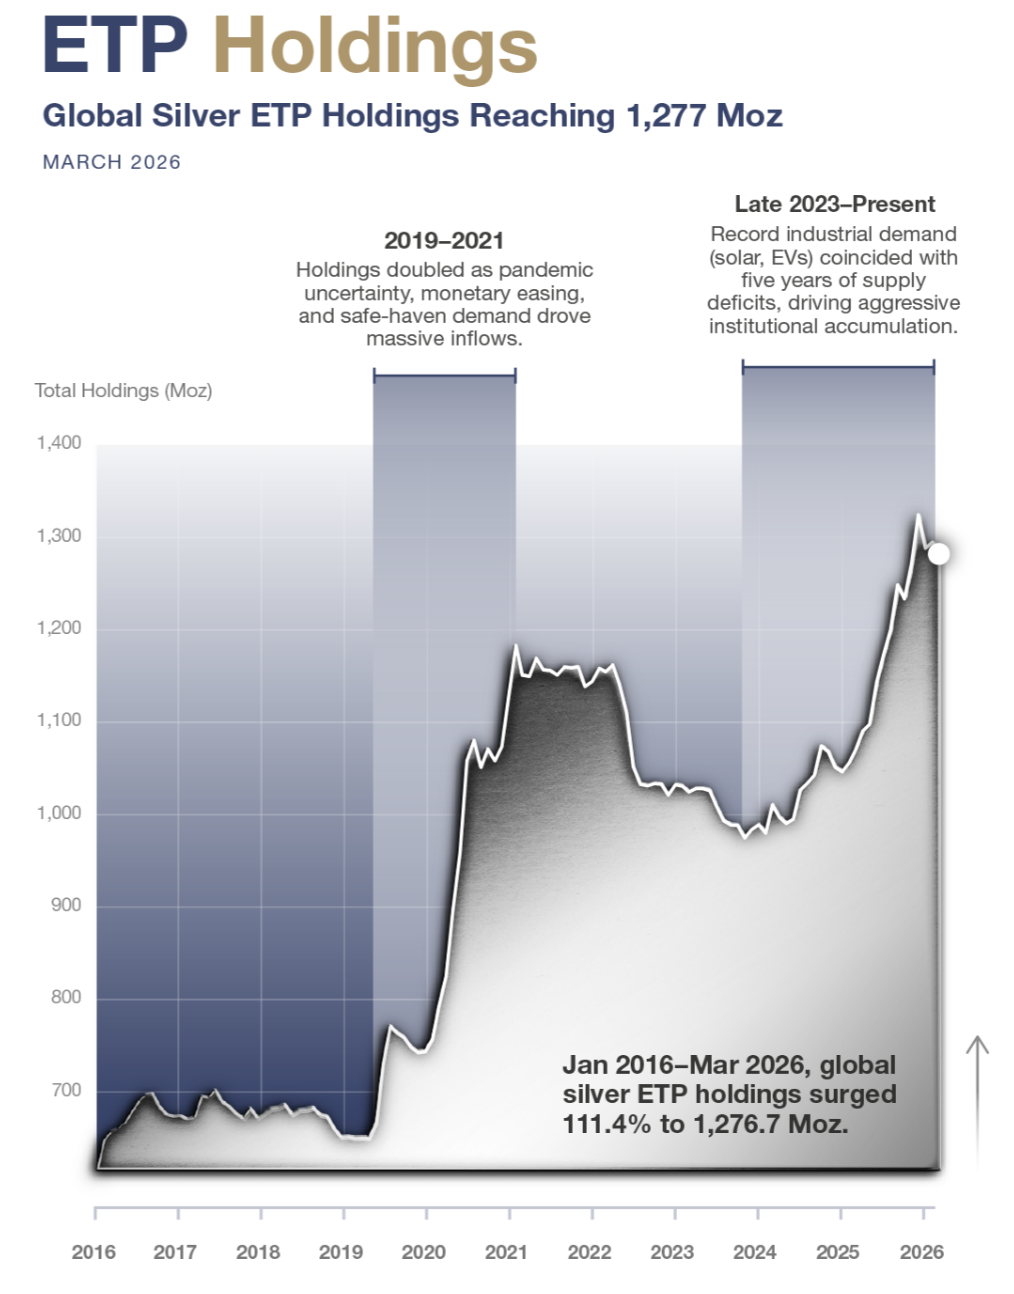
While data centers look set to write tomorrow’s silver demand story, investment demand is already busy writing today’s. That’s because the category experienced a resurgence in 2025, beginning with a 14% increase in net coin and bar demand to 217.7 Moz. To a large extent, this growth was fueled by a 33% yoy increase in physical investment in India, where silver ETP holdings tripled from 41.7 Moz to approximately 120 Moz in the twelve months to January 2026. In line with our forecasts from last year’s In Gold We Trust report “The Big Long,” holdings have fallen to 110 Moz as of March 2026. Still, India’s appetite for silver ETPs – which comprised 40% of the nation’s total retail investment in 2024 – helped drive a staggering 312% yoy surge in global silver ETP net investment to 278.1 Moz in 2025. As a result, global silver ETP holdings have more than doubled over the past decade, standing at 1.277 Boz as of March 2026.
Source: The Silver Institute, Metals Focus, MiningVisuals, Incrementum AG
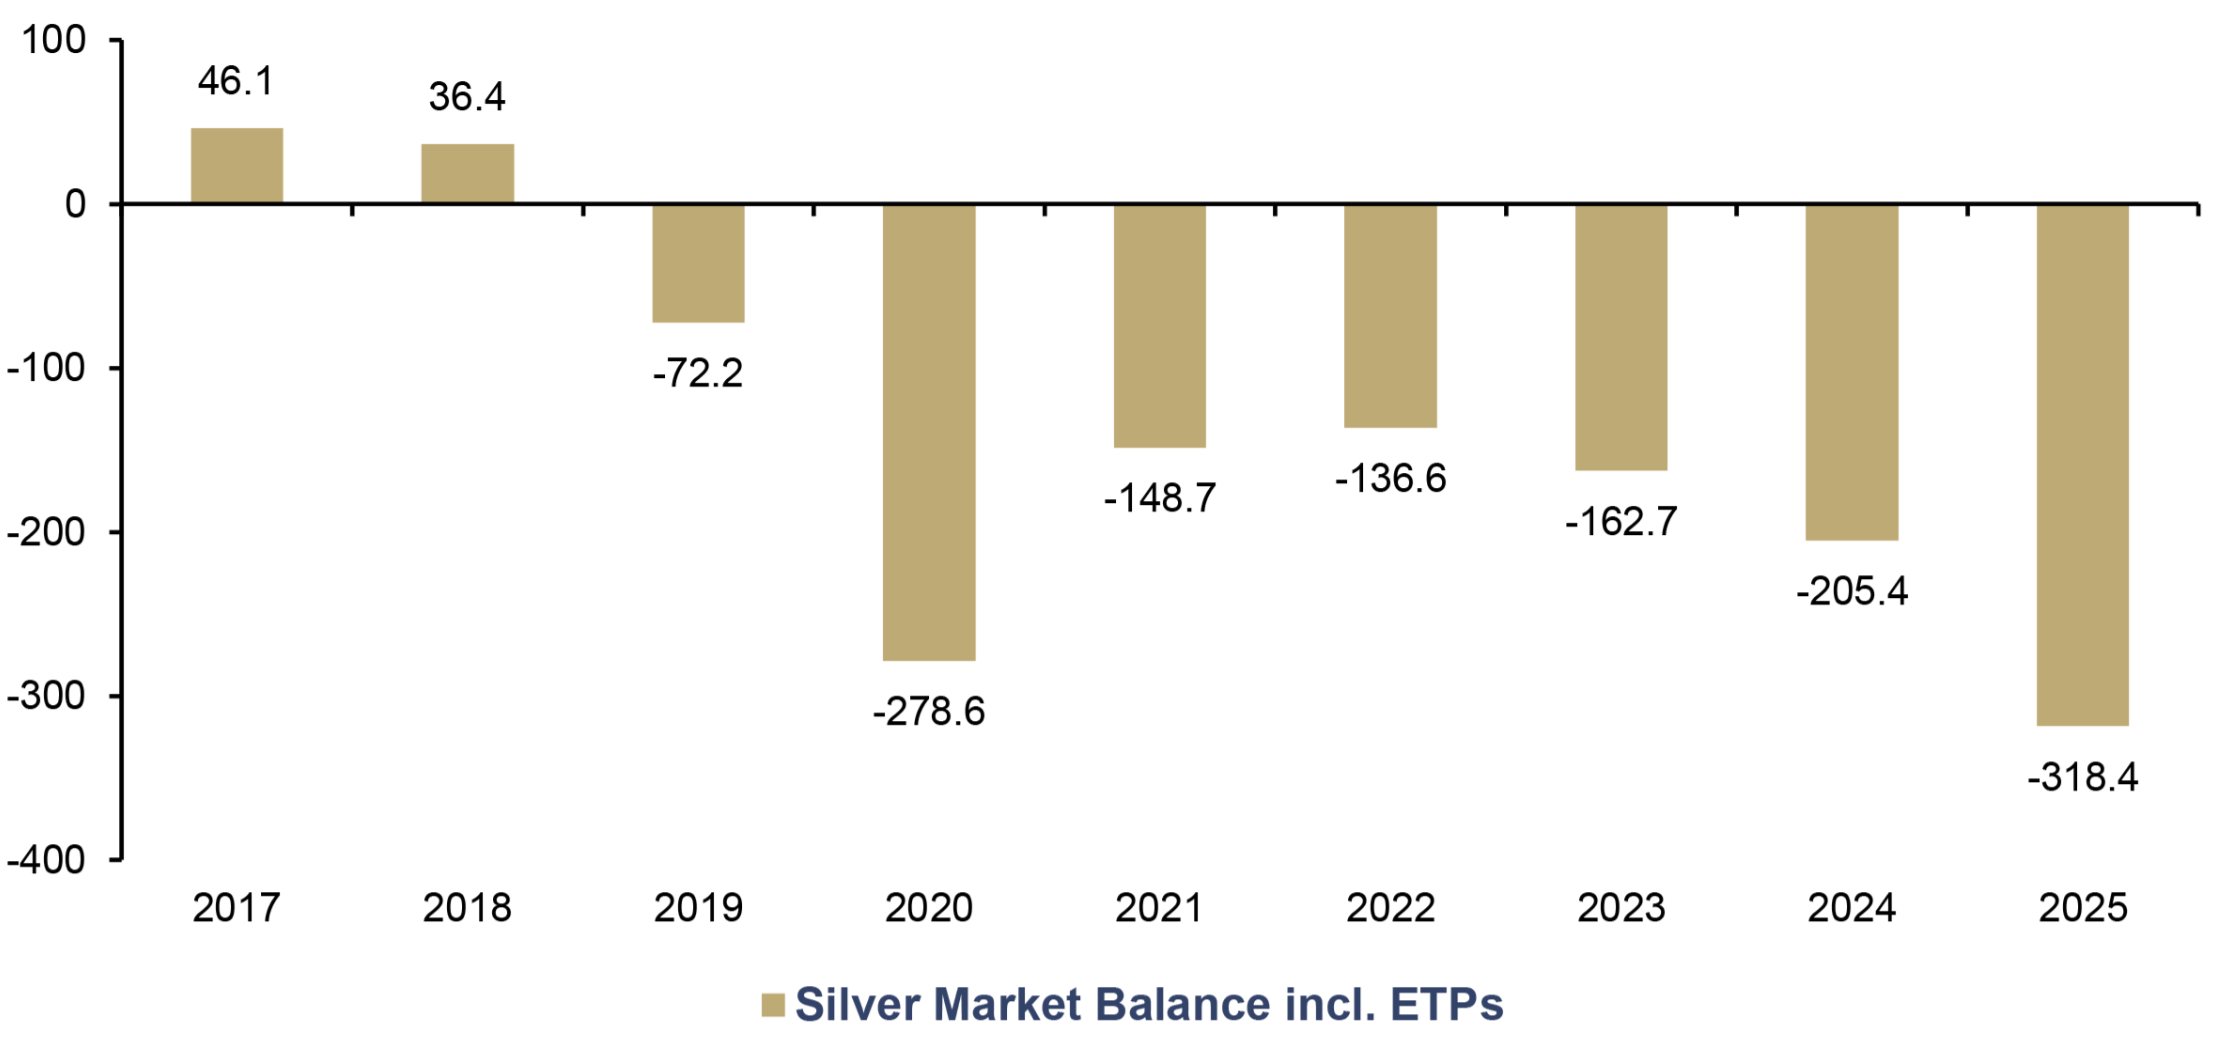
Curiously, once ETP investment is included, the silver market balance widens to a record -318.4 Moz in 2025 – the largest non-structural deficit in history. The market balance is set to normalize to -76.3 Moz in 2026, as ETP net inflows are expected to moderate to 30 Moz, yet the broader picture remains striking: the structural supply deficit has run from 2021–2025 to the tune of ~800 Moz. However, the market balance inclusive of ETP investment has been negative for seven successive years since 2019, amounting to over 1.3Boz cumulatively.
Silver Market Balance incl. ETPs, in Moz, 2017–2025
Source: Silver Institute, Incrementum AG
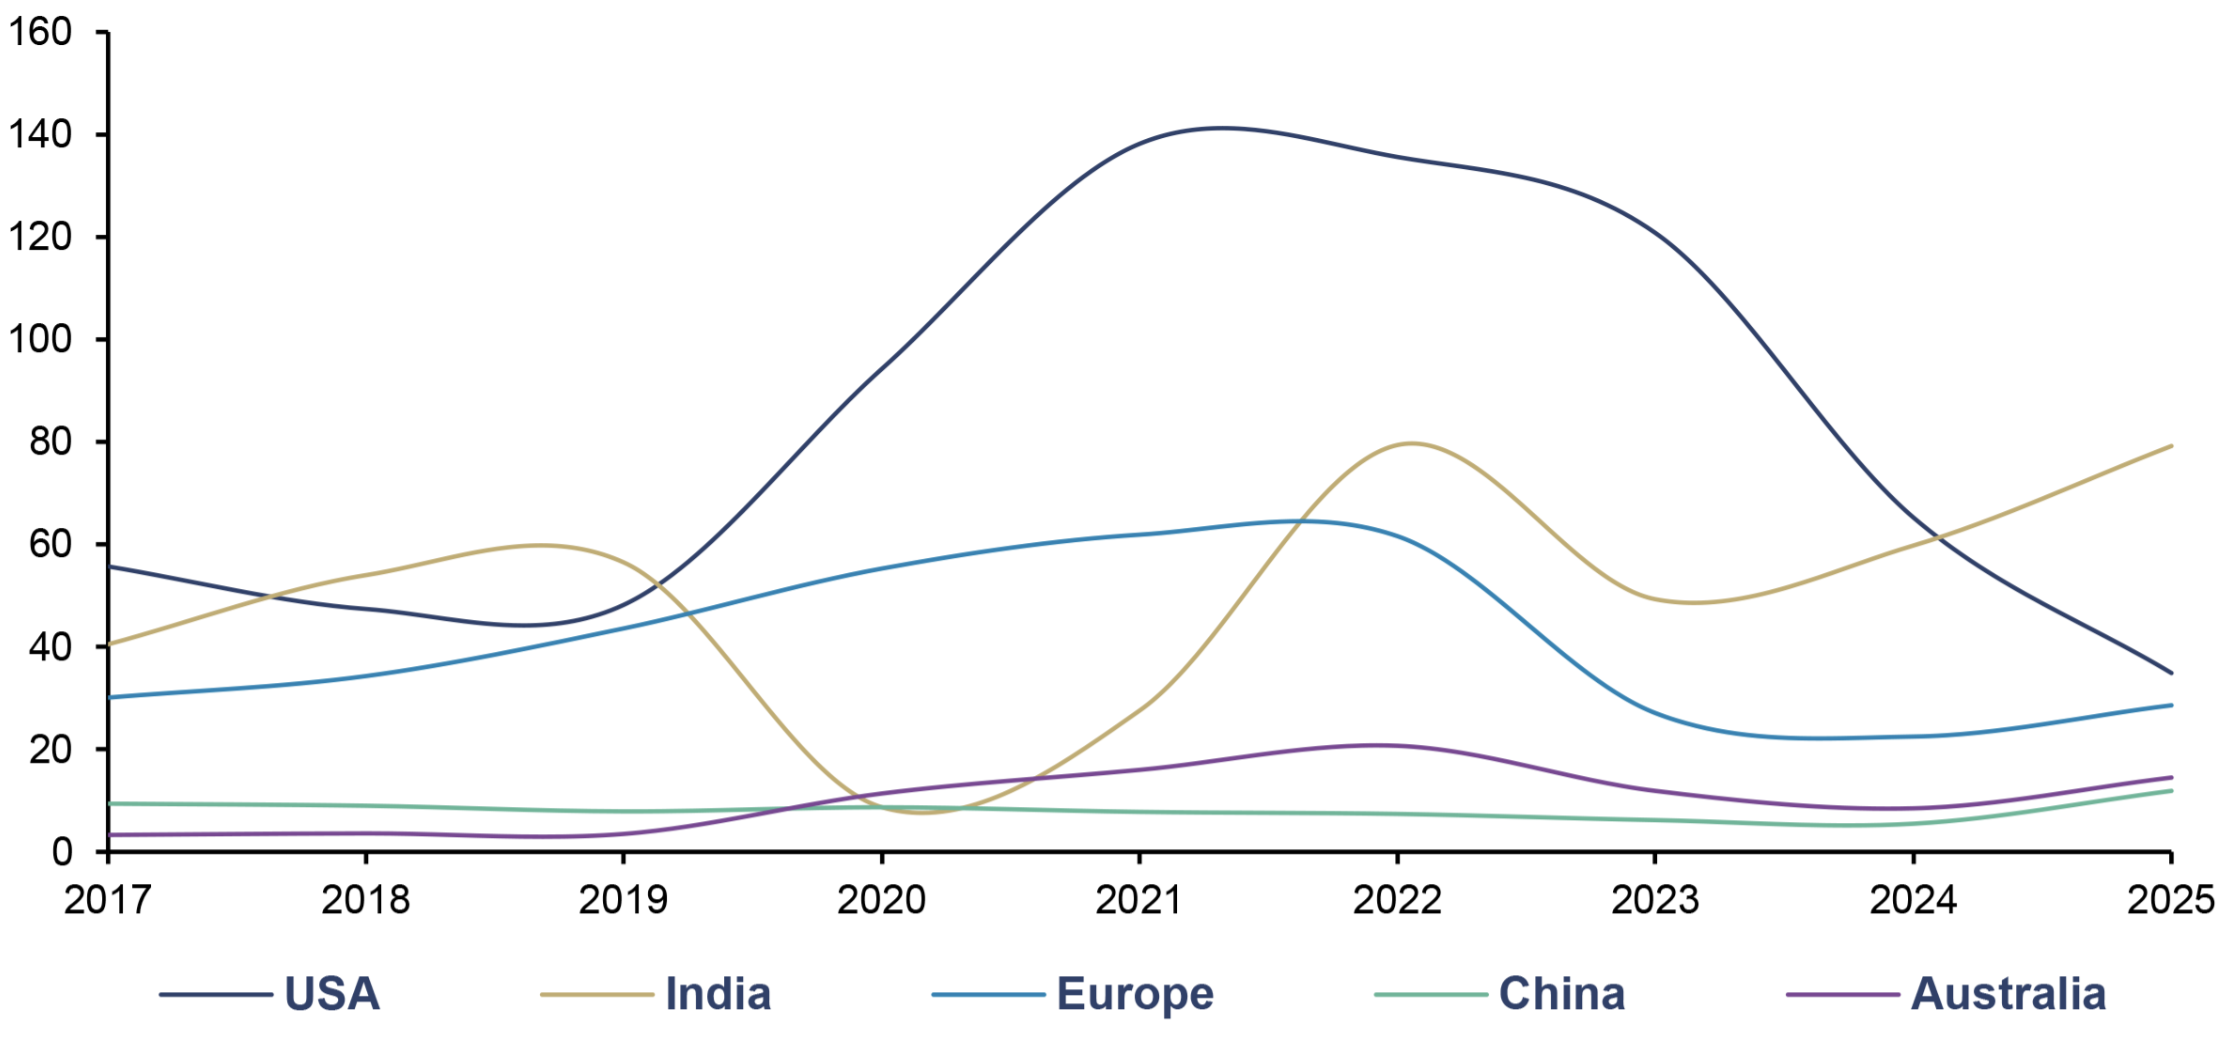
In short, this reveals ETP investment as a silent, and nascently explosive, driver of silver’s ascent. Though, even after this ETP boom, physical investment demand remains largely subdued with significant room to grow. For one, European physical silver investment sits at less than half of its 2022 peak in 2025, despite a sizable 27% rise to 28.5 Moz. Meanwhile, US demand saw a third year of uninterrupted losses in 2025, with volumes almost halving to 34.9 Moz – the lowest level since at least 2010. Evidently then, most US investors were stuck in their MAG 7 bubbles, as India profited handsomely from a burgeoning silver bull.
Physical Silver Investments by Region, in Moz, 2017–2025
Source: Silver Institute, Incrementum AG
In 2026, this dynamic is approaching an inflection point. That is, after three successive years of decline, Western physical investment is set to extend silver’s broader investment renaissance in 2026, as “ongoing macroeconomic uncertainty rekindles investor interest,” according to the Silver Institute. As part of this, US coin and bar demand is expected to increase 57% yoy in 2026, after four years of losses saw demand collapse by 69% from its 2021 peak. More broadly, the global category is forecast to increase 18% to 257.6 Moz in 2026, and has considerable upside to move into to reach the 2022 peak of 339.5 Moz.
Compounding this, European silver investment is anticipated to recover in 2026. Historically marginalized by VAT, silver’s share of retail turnover in Germany defied the odds, rising to as much as 30–50% by late January 2026, according to the Silver Institute. However, Germany has made investing in silver significantly less attractive overnight. On April 9, the Federal Ministry of Finance announced new rules and ended the VAT exemption for precious metals stored in German duty-free warehouses. Against this backdrop of regional recovery, global physical investment stands at 205.7 Moz in 2025, almost 130 Moz below its 2022 peak of 333.9 Moz. In theory, that much investment demand, or more, could flock to silver under the right macroeconomic conditions.
Our Silver Base Case: Consolidation Before Inflation-Induced Acceleration
Formerly serving as legal tender across civilizations, but today a metal whose price is 58% informed by industrial demand, silver’s ambiguous dual-nature complicates any straightforward assessment of optimal economic conditions. On the one hand, its expanding industrial identity renders the historic monetary metal status increasingly dormant, while opening the door to weakness during recession, as we outlined in the In Gold We Trust report 2023, “Showdown”, where we presented our IGWT Recession Phase Model. On the other hand, the metal’s 0.8 correlation with gold as of late intertwines it with conventional macro factors such as real rates, keeping its monetary soul alive.[2]
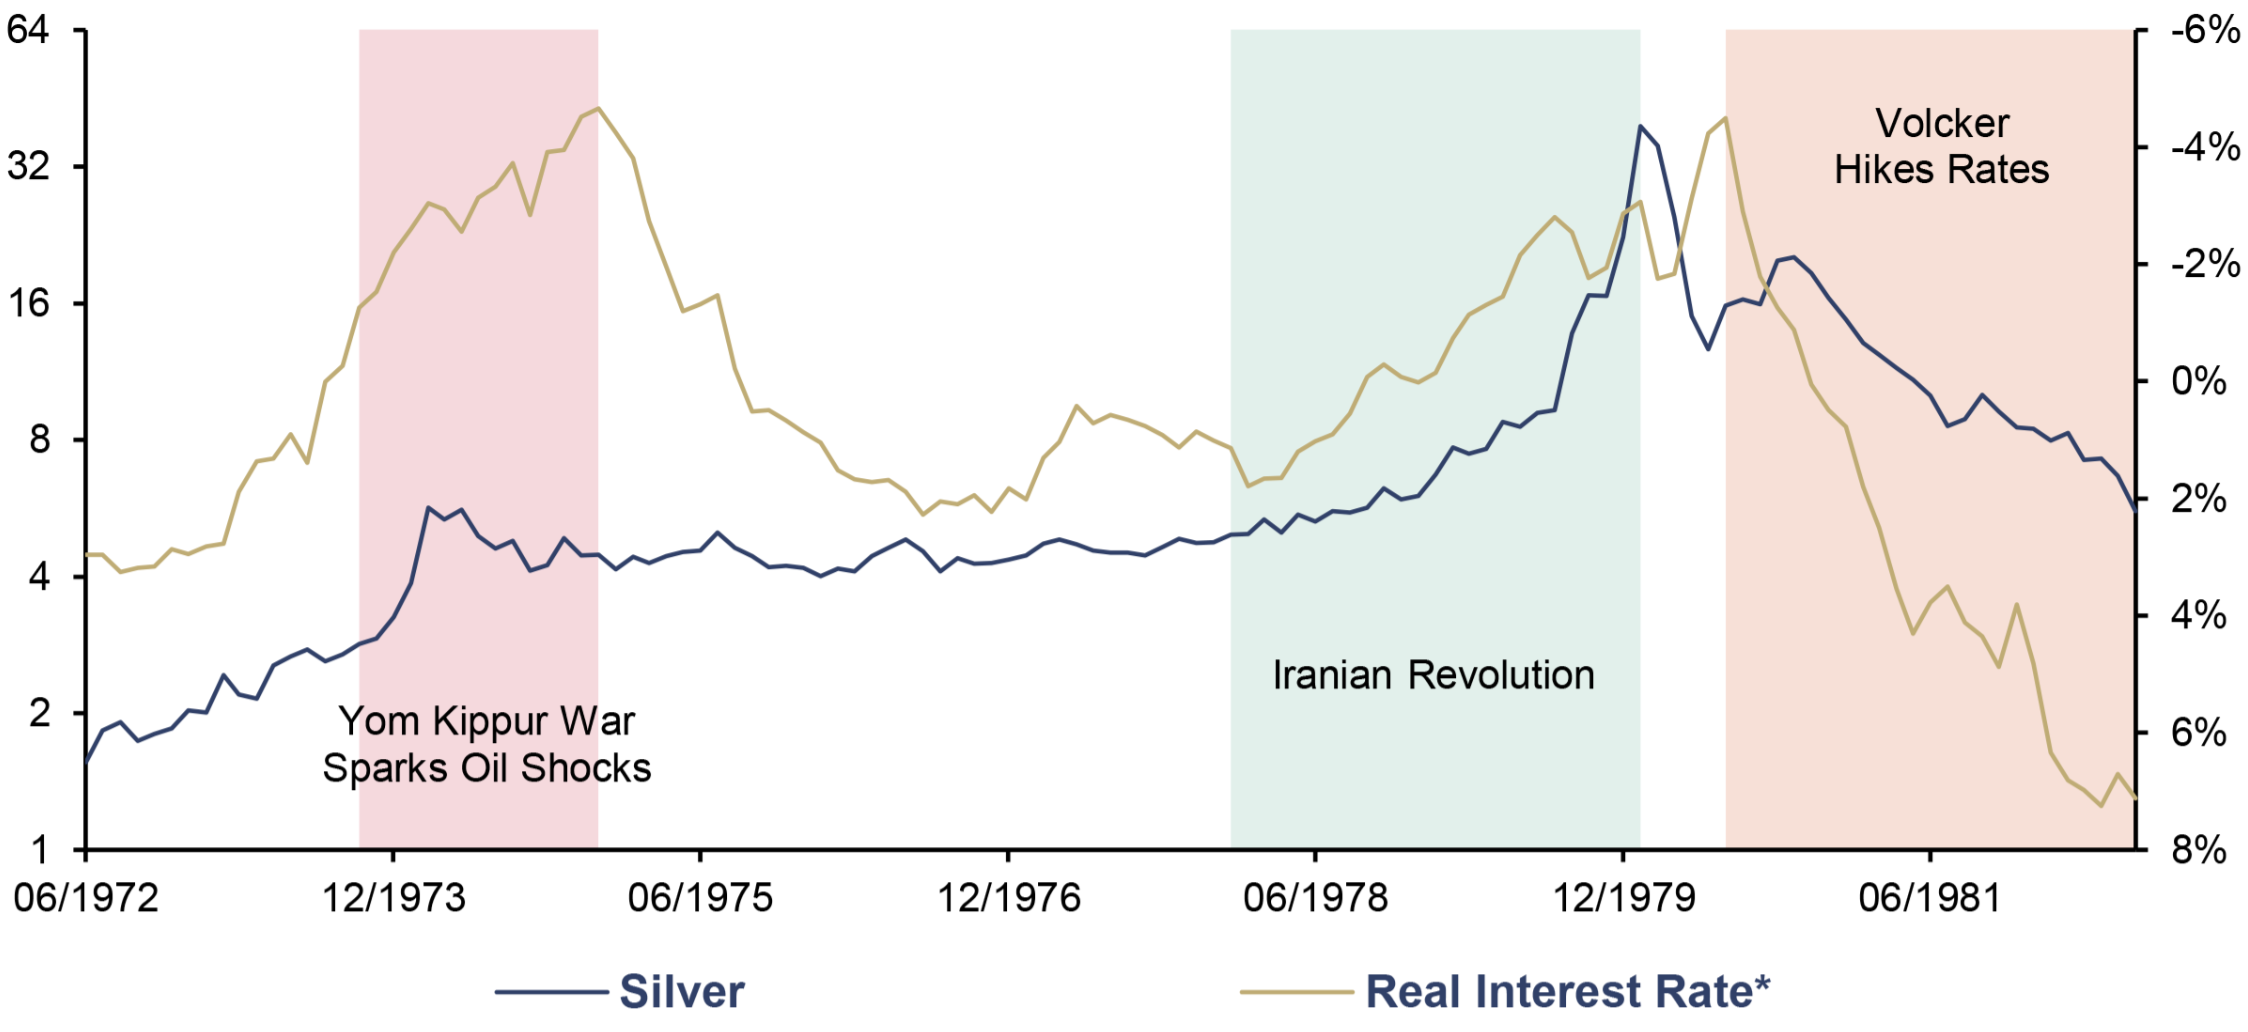
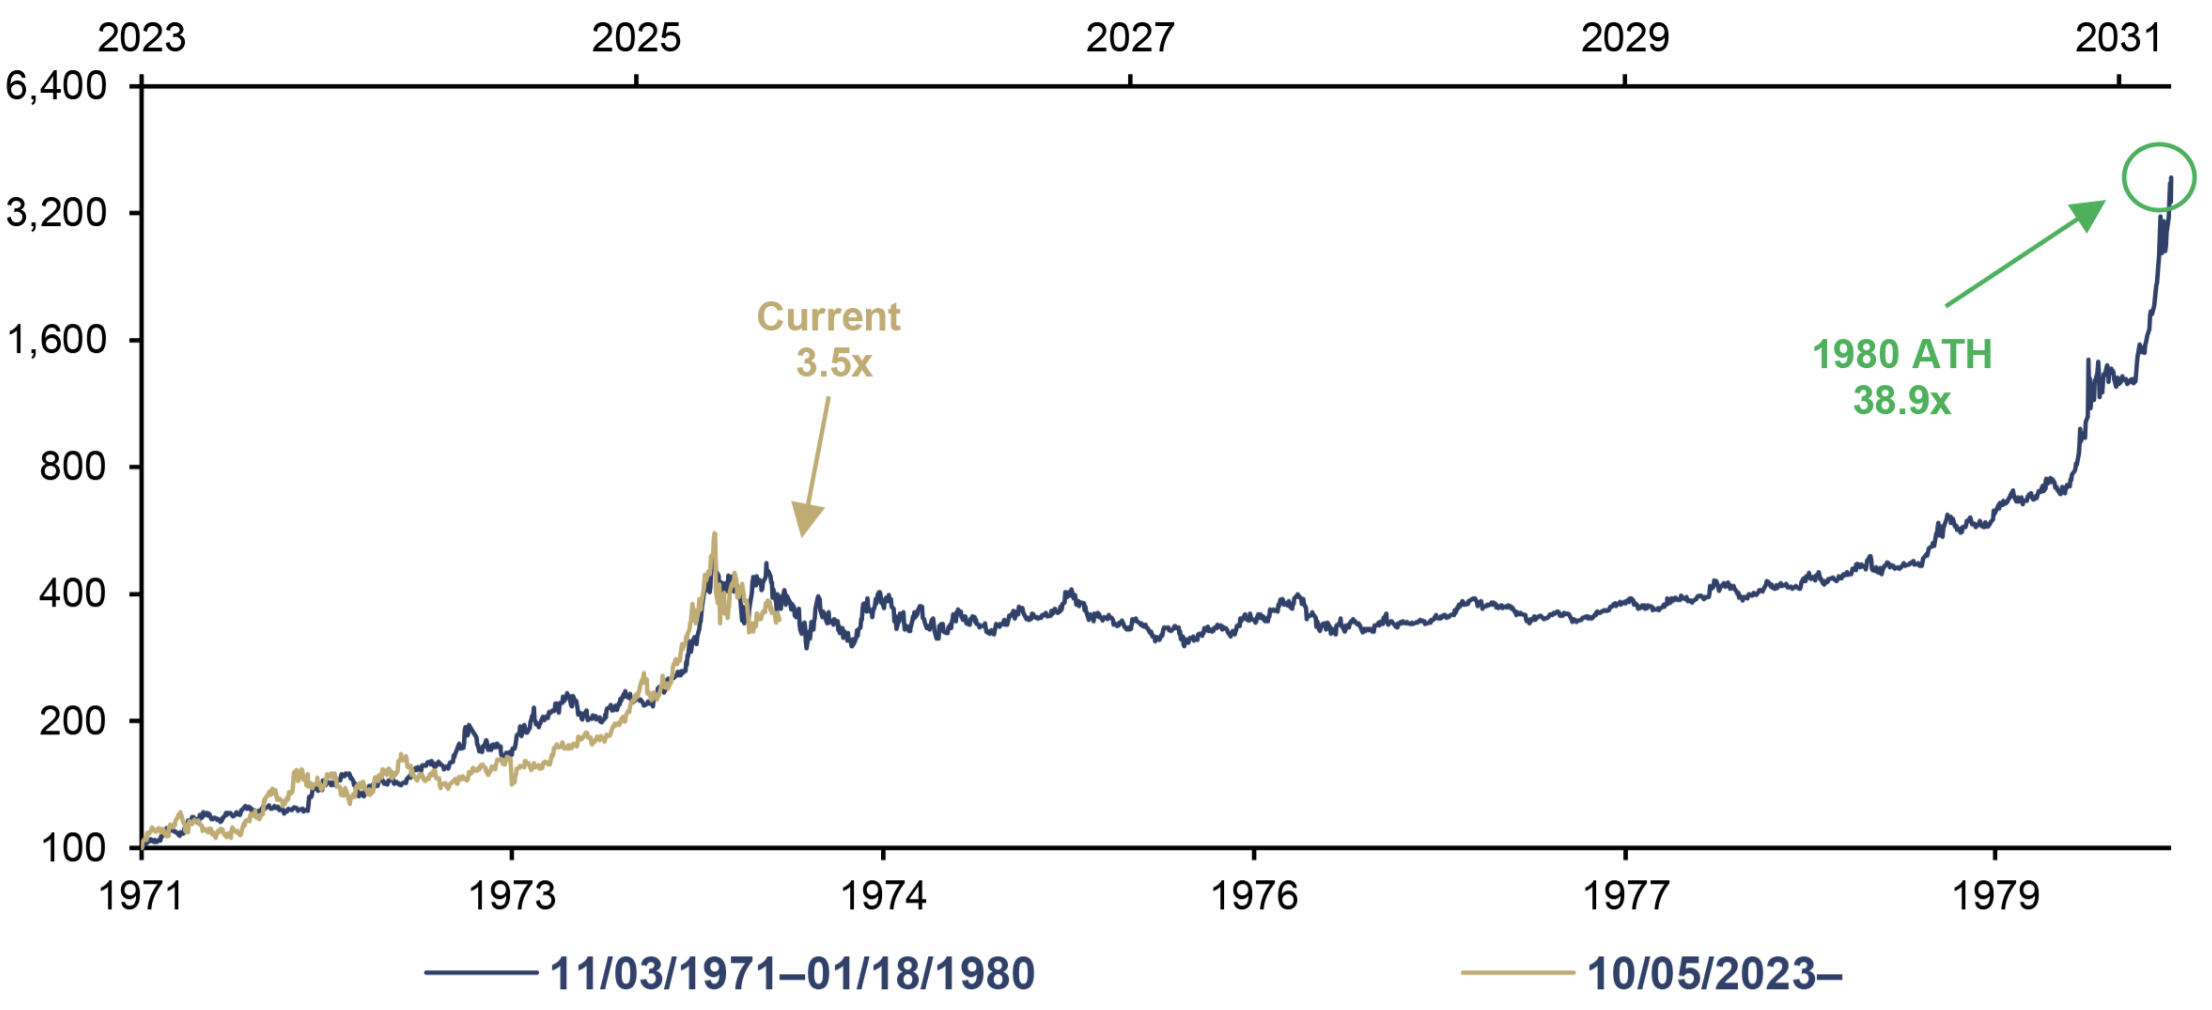
To that point, perhaps the best macro bellwether for silver’s outperformance was declining real rates amid the stagflation-ridden 1970s. During this period from 1971 to 1980, silver produced more than a thirtyfold return as oil shocks and elevated geopolitical risk joined negative real rates to punctuate a multi-year consolidation phase. Between August 1973 and November 1974, in the wake of the Yom Kippur War, this saw real rates plunge by 9 percentage points from +4.45% to -4.52%, while silver surged from USD 1.96 to an annual peak of USD 6.76. Then again, from February 1978 to June 1980 amid the Iranian Revolution, real rates plummeted by over 6 percentage points from +1.79% to -4.49%, as silver soared tenfold, aided by the Hunt Brothers.
Silver (lhs, log), in USD, and Real Interest Rate* (rhs, inverted), 06/1972–06/1982
Source: LSEG, Incrementum AG
*US 10Y US CPI adjusted
In the same breath, the Federal Reserve can also blow bearish headwinds toward silver. Most notably, Paul Volcker puffed on his cigar in 1980, hiked rates to 20%, and nonchalantly helped extinguish silver’s flame. At a 32% debt-to-GDP ratio, the US government had the capacity to absorb the burden of higher rates back then. Today, the ratio stands much taller at 125%, with annual interest payments exceeding USD 1trn – the federal government’s largest single expenditure, surpassing even defense spending.
Frankly, if Paul Volcker held a bazooka in 1980, the new Federal Reserve Chair, Kevin Warsh, may as well be clutching a water pistol. In other words, material rate hikes are off the table due to the compounding debt servicing cost. Instead, our base case sees the Federal Reserve opting for the lesser of two evils: letting inflation run untamed in order to preserve the system’s “stability”. Beyond 2026, this dynamic should drag real rates into negative territory, enticing bond investors, and the USD 7.64trn sitting in money markets, to flock to silver as a high-beta play on gold.
On balance, we believe the resulting investment demand from this phenomenon will sufficiently offset the expected weakness in the jewelry and silverware categories. For context, silver jewelry fabrication declined by 8% in 2025 to 189.3 Moz – the lowest level since 2021 – as record prices eroded affordability and curtailed rural Indian demand. The segment is forecast to decline a further 16% to 159.4 Moz in 2026, ahead of Pandora’s planned switch to platinum-plated alloys in 2027. Silverware is also expected to fall 21% in 2026 to 33.5 Moz, as elevated prices push Indian manufacturers towards lighter products.
Collectively, the year-over-year loss from jewelry and silverware is expected to amount to 38.5 Moz in 2026. That said, physical investment’s reacquaintance with 2022 highs from 2025 levels would greatly offset this with up to 128.2 Moz of additional demand. Moreover, the increasing acceptance of gold-plated silver jewelry, particularly in South Asia, is reportedly helping to soften the extent of the segment’s contraction, as per the Silver Institute. Taking this alongside industrial demand’s broader growth potential, we posit that any consolidation phase will conclude earlier than the 1970s, with accelerating inflation as the prerequisite for silver’s next leg-up.
Silver (log), in USD, 100 = 11/03/1971, and 100 = 10/05/2023, 11/1971–05/2026
Source: FactSet, LSEG, Incrementum AG
Shifting to Supply: Is it Time to Favour Stocks Over the Rock?
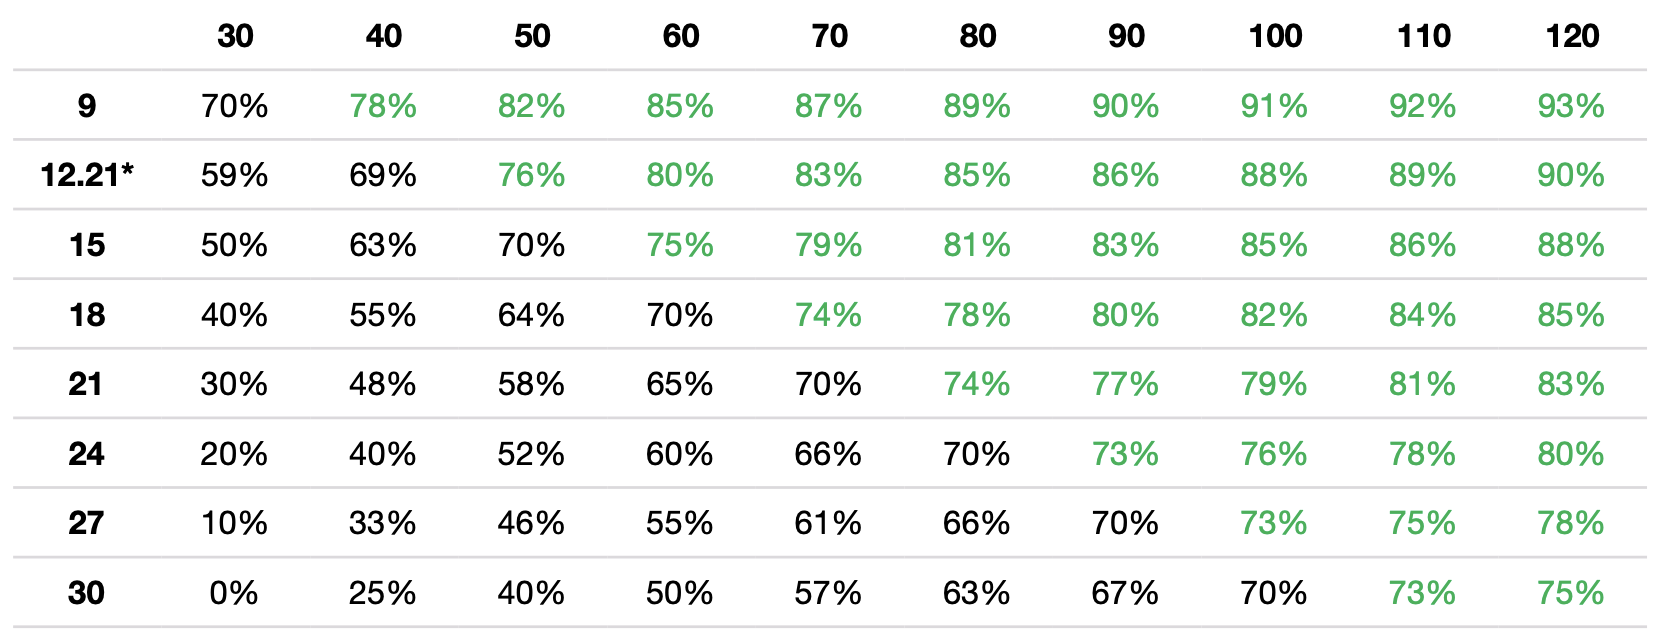
On the supply side, our bullish conviction for silver miners, let alone silver, is grounded in the relationship, or lack thereof, between price and mine production. Case in point, the silver price averaged USD 40.03 in 2025 – up 42% from the 2024 average of USD 28.27 and 71% from the 2023 average of USD 23.39. Despite this, primary silver supply declined for the third consecutive year in 2025 by 1% yoy, bringing the percent of global supply from primary silver mines to a new low of 26%. From this, it’s clear that higher silver prices do not directly correlate to higher primary silver supply. Incidentally, this will please primary silver mining companies, whose profit margins sit above 80% at an 80 USD silver price, after their average all-in sustaining costs (AISC) fell for the second consecutive year to USD 12.21 in 2025.
Profit Margin Matrix for Silver Mining Companies: Silver (x-axis), in USD, and AISC (y-axis), in USD
Source: Incrementum AG
*2025 Average
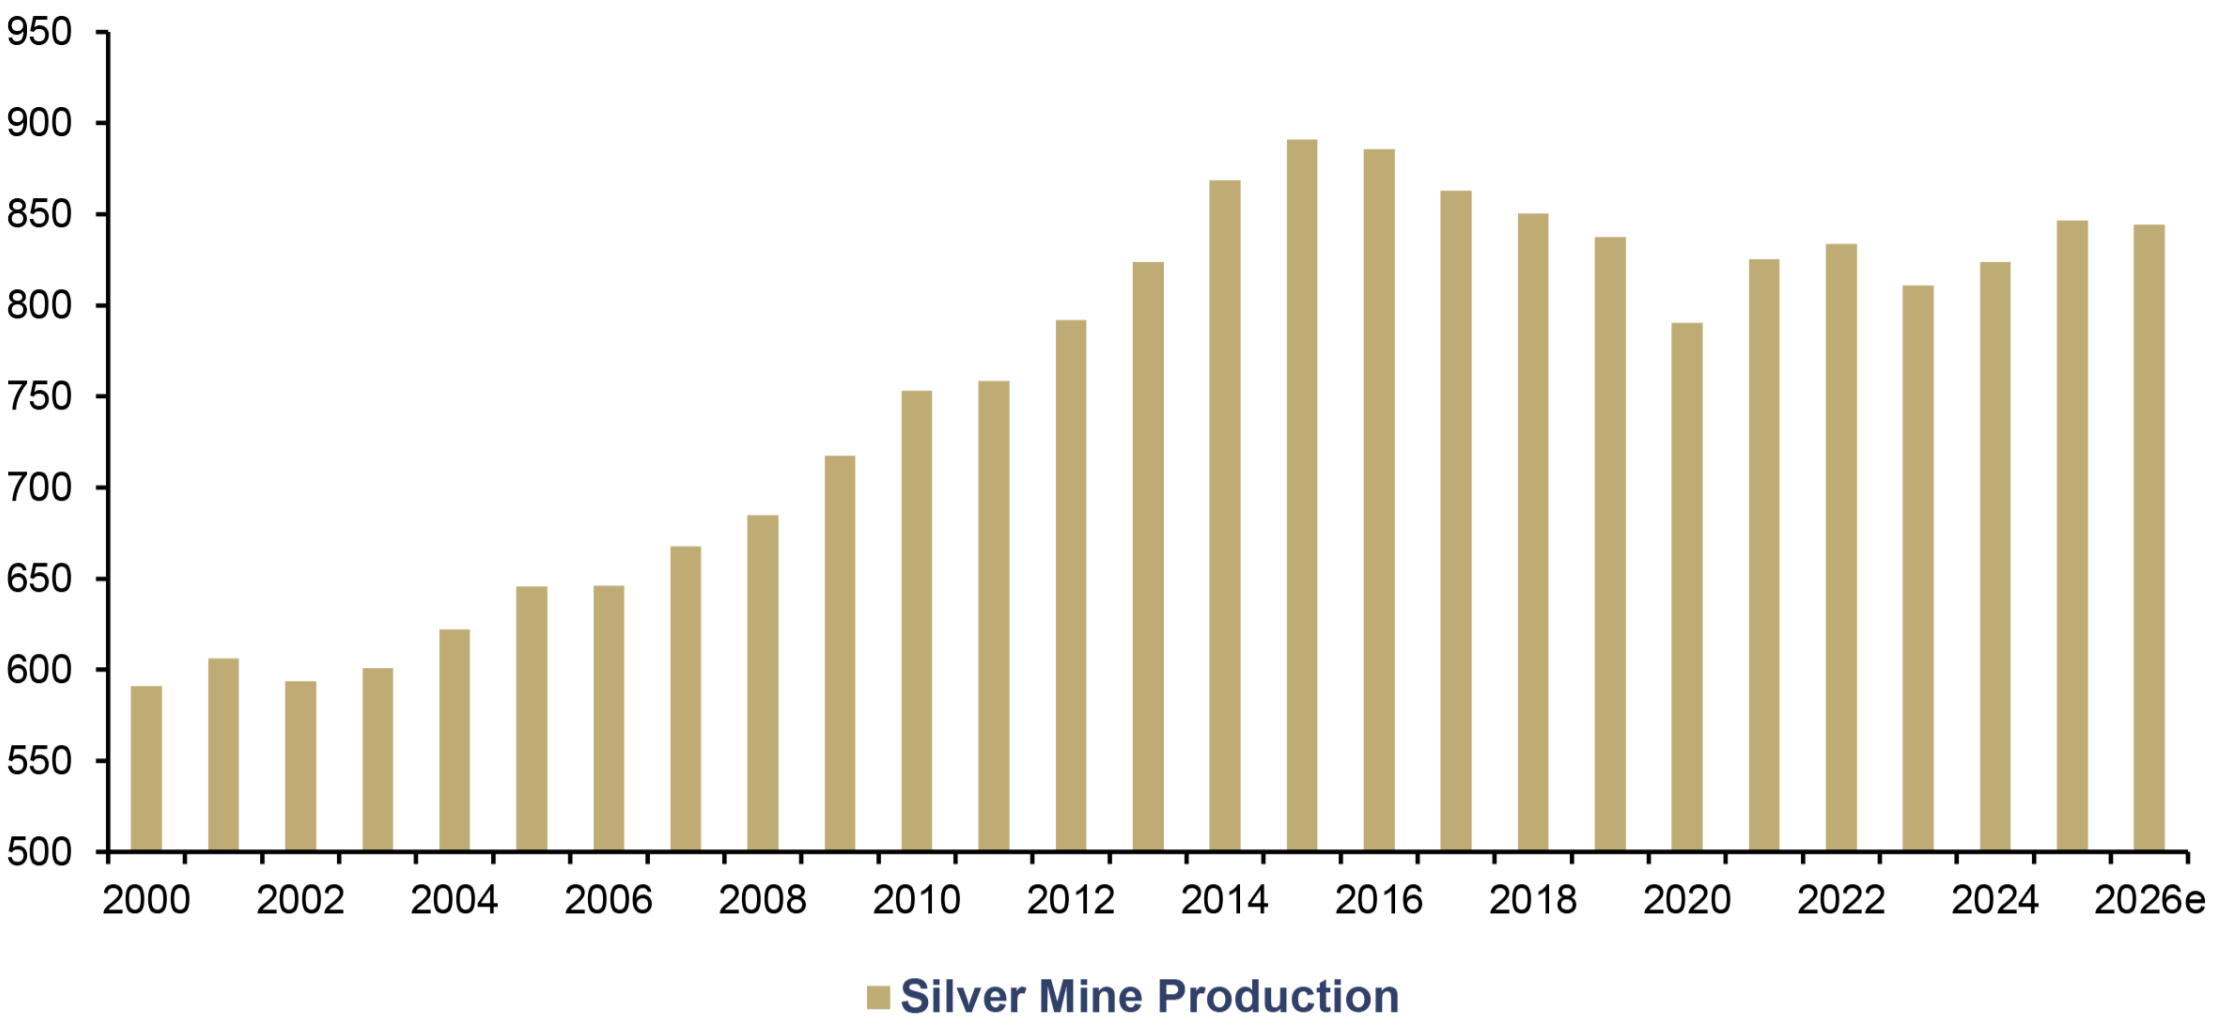
Notwithstanding these stellar margins, the 74% of silver supply produced as a byproduct warrants equal attention. To that end, non-primary silver mine production rose 4% yoy to 625.5 Moz in 2025, led by a 6% increase in by-product silver from copper operations, which reached 237.3 Moz. More broadly, global silver mine supply grew by 3% yoy to 846.6 Moz in 2025. This saw gains in Peru (+9 Moz) and Russia (+10.5 Moz) compensate for a 5% decline (-8.2 Moz) in Mexico, where a mine cessation at Fresnillo’s San Julián and grade declines at Peñasquito helped North American silver output to decade lows.
Elsewhere, recycling rose 2% to 197.6 Moz in 2025, adding a modest 3.1 Moz to supply. In 2026, a more meaningful contribution of 13.7 Moz is forecasted, as a 7% rise to 211.3 Moz is supported by expected 14-year highs in industrial scrap recycling. An India-led uptick in jewelry and silverware recycling is also set to buoy the segment, as a full year of elevated prices draws sellers, according to the Silver Institute. Still, with mine production projected to decrease 0.3% (-2.5 Moz) in 2026, higher silver prices are evidently not moving the supply needle. Add to that a dearth of new discoveries, declining ore grades, and 10–15 year average lead times to advance a silver mine from inception to production, and it’s likely that peak silver production was reached in 2015.
Global Silver Mine Production, in Moz, 2000–2026e
Source: Silver Institute, Metals Focus, Incrementum AG
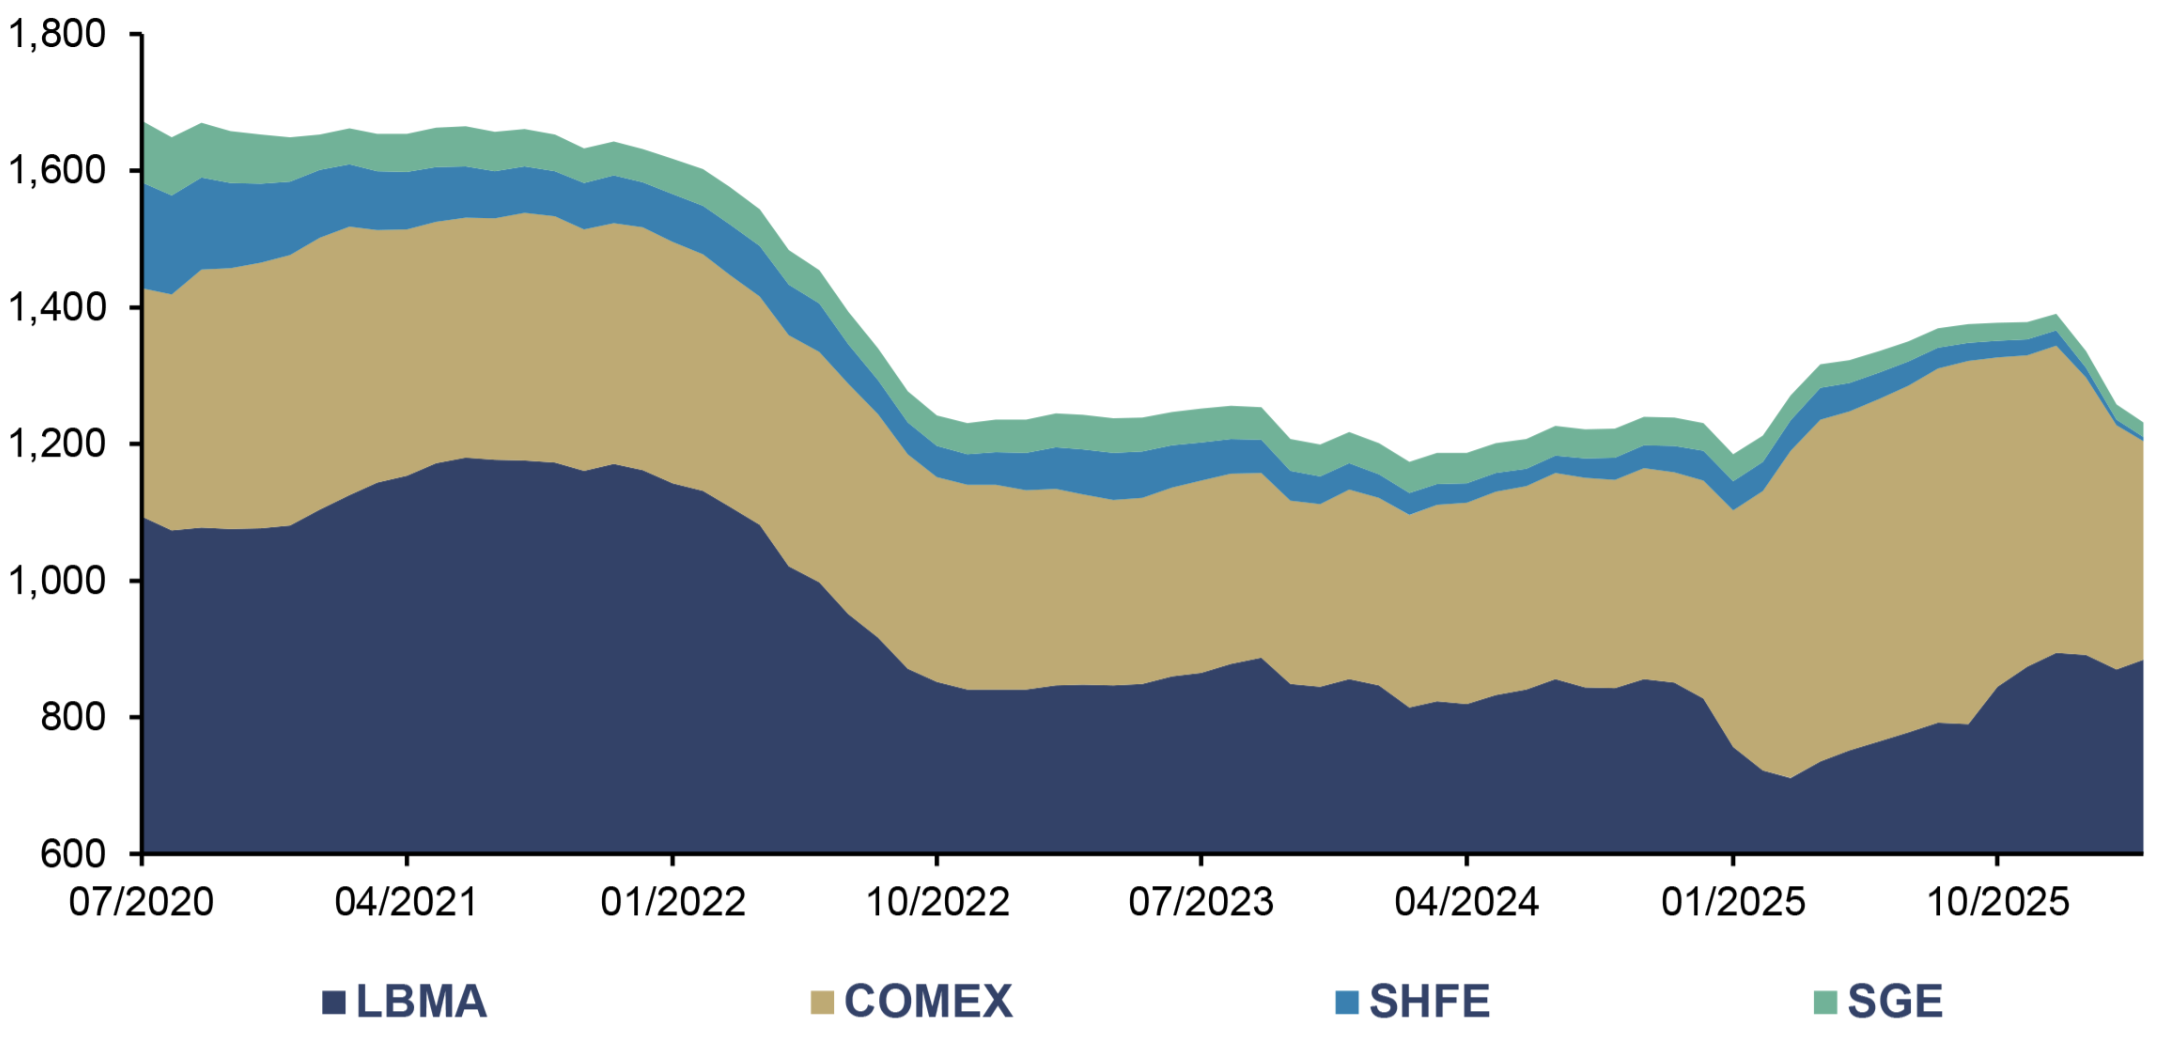
In turn, global silver demand looks set to continue with its unsustainable dependency on above ground stocks. While much of this opaque supply exists in the hands of private investors, the measurable aspect is visible in the silver inventories held on major exchanges, such as the SHFE and SGE in Shanghai, the LBMA in London, and the COMEX in New York. As a side note, the recently introduced SILVER Act (H.R. 8007) seeks to geographically diversify US precious metals depositories away from their concentration in the Greater New York area. More importantly, the collective depletion across exchanges from their 2020 peak up to March 2026 amounts to ~440 Moz – almost 3x solar’s forecasted silver offtake in 2026.
Silver Inventories Held On Exchanges, in Moz, 07/2020–03/2026
Source: COMEX/CME Group, GoldChartsRUs, LBMA, SHFE, Silver Institute, Incrementum AG
A further testament to the physical market tightness, it is estimated that 83% of London inventories were represented by physically backed products by end-September 2025, leaving a free float of just 136 Moz vulnerable against daily spot trading volumes of ~450 Moz. As for China, we estimate that approximately 200 Moz left both Shanghai exchanges between the mid-2020 highs and December 2025 lows of 47.1 Moz.[3] Producing 112.8 Moz of silver while consuming 282.9 Moz from industrial demand alone in 2025, China’s domestic silver shortage helped erode Shanghai stocks to the lowest levels since 2016 this year. Elsewhere, this scarcity was reflected in a Shanghai spot premium, which reached up to USD 15 above the Western price.
The Bottom Line
To conclude, silver’s long-awaited breach of triple digits was no speculative aberration. Instead, it was the inevitable consequence of consecutive supply deficits meeting investors finally willing to pay attention. In turn, silver emphatically demonstrated just how explosively it can trade when the conditions align. What follows is not the end of the story, but an intermission. In other words, investors need time to digest the historic move, while silver establishes a new floor, likely around USD 60-70. Thereafter, we view this base as the springboard for the next leg-up, amid supply deficits that look set for the foreseeable future.
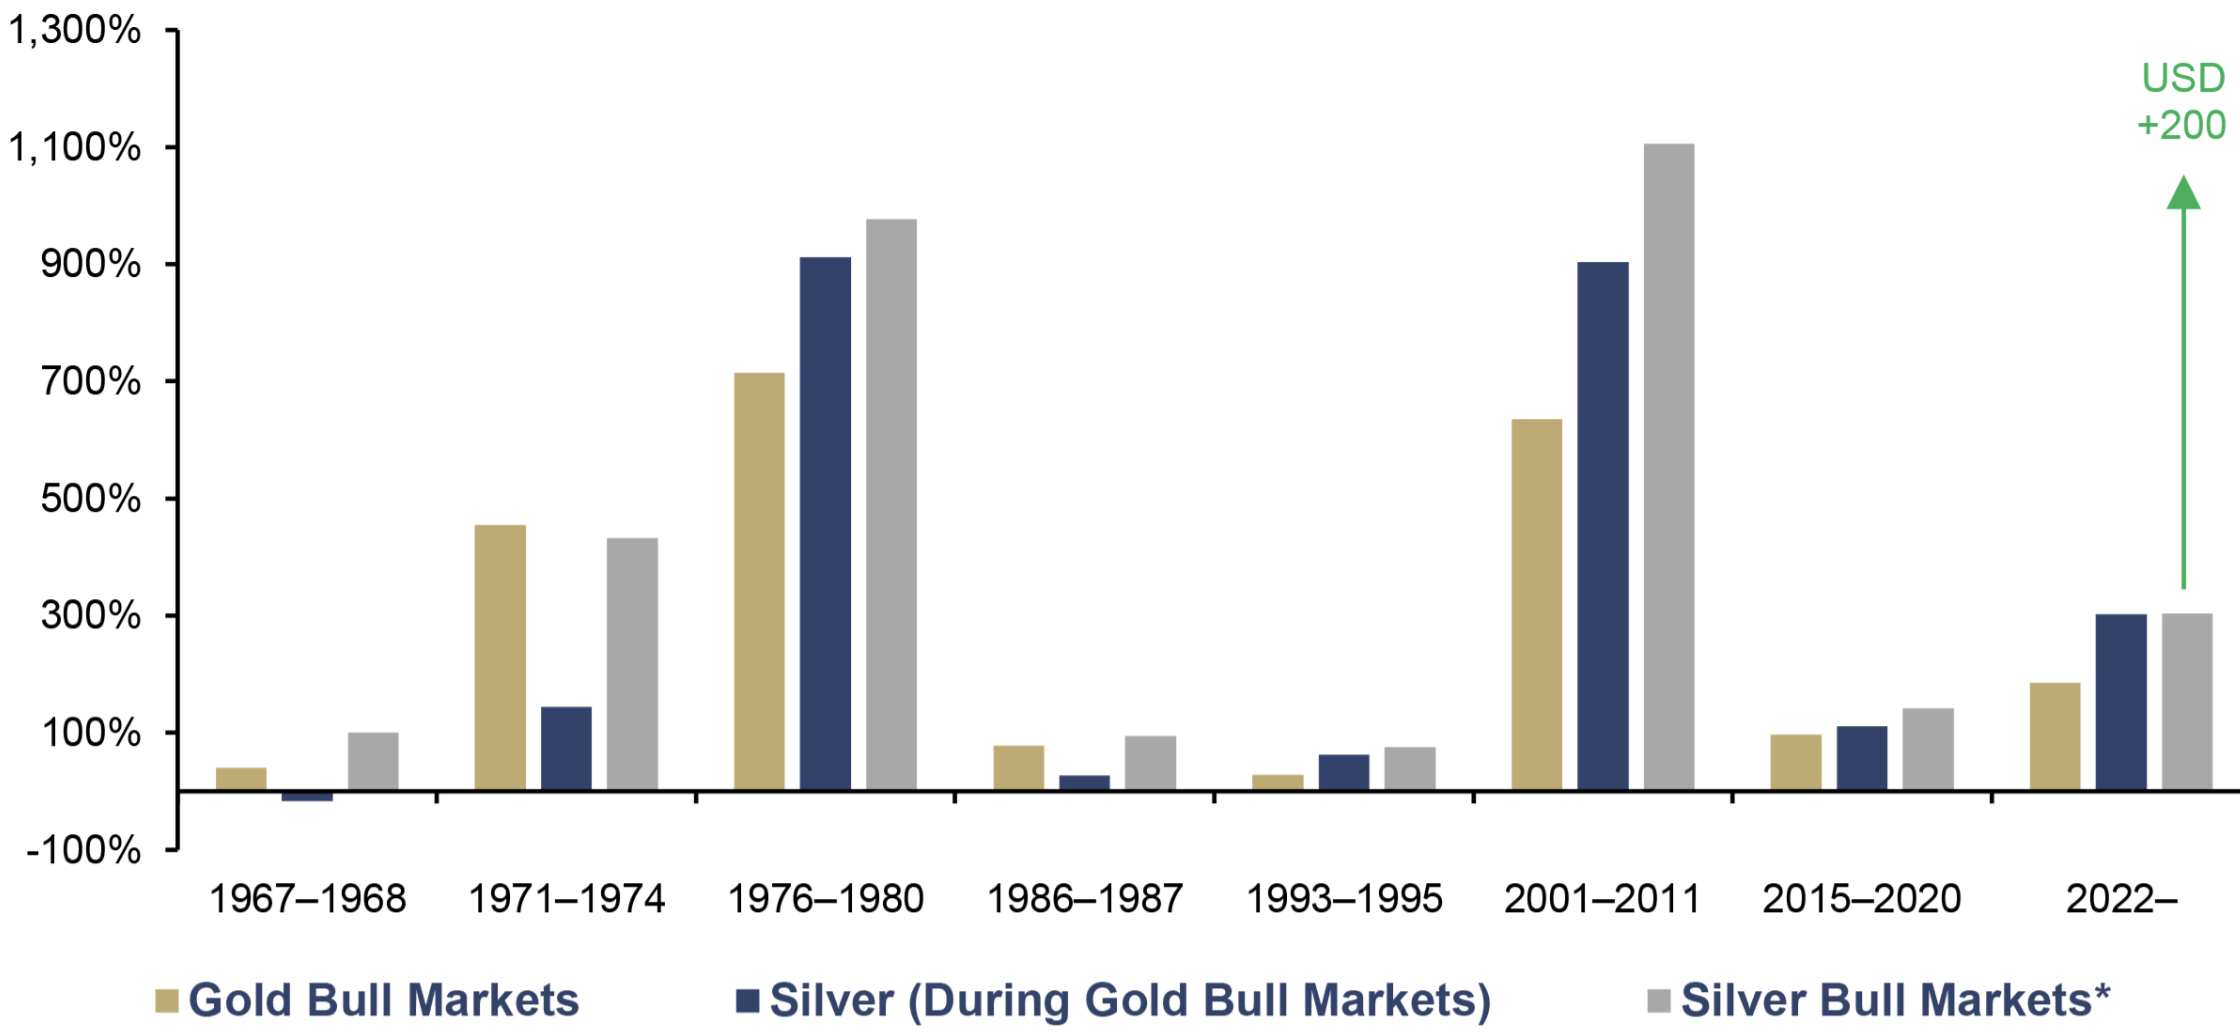
Notably, a return to USD 100 silver in 2026 is not out of the question either, especially if the tempestuous winds of inflation imminently ripple across the economy. Our view is congruent with that of the LBMA’s analyst survey in which 17 of the 26 forecasters expect the white metal to reach the USD 100 milestone in 2026. Within that, 3 see it exceeding USD 160, and 2 see USD 200 breached. While they may prove to be optimistic for 2026, we rate these latter forecasts as realistic over a longer horizon: from the 2022 low of USD 17.83, matching the ~1,100% trough-to-peak return of the 2001– 2011 cycle would put silver comfortably above USD 200.
Performance of Gold and Silver during Bull Markets, in USD, 1967–04/2026
Source: CPM Group, LSEG, Incrementum AG
*Lows to Highs during Gold Bull Markets
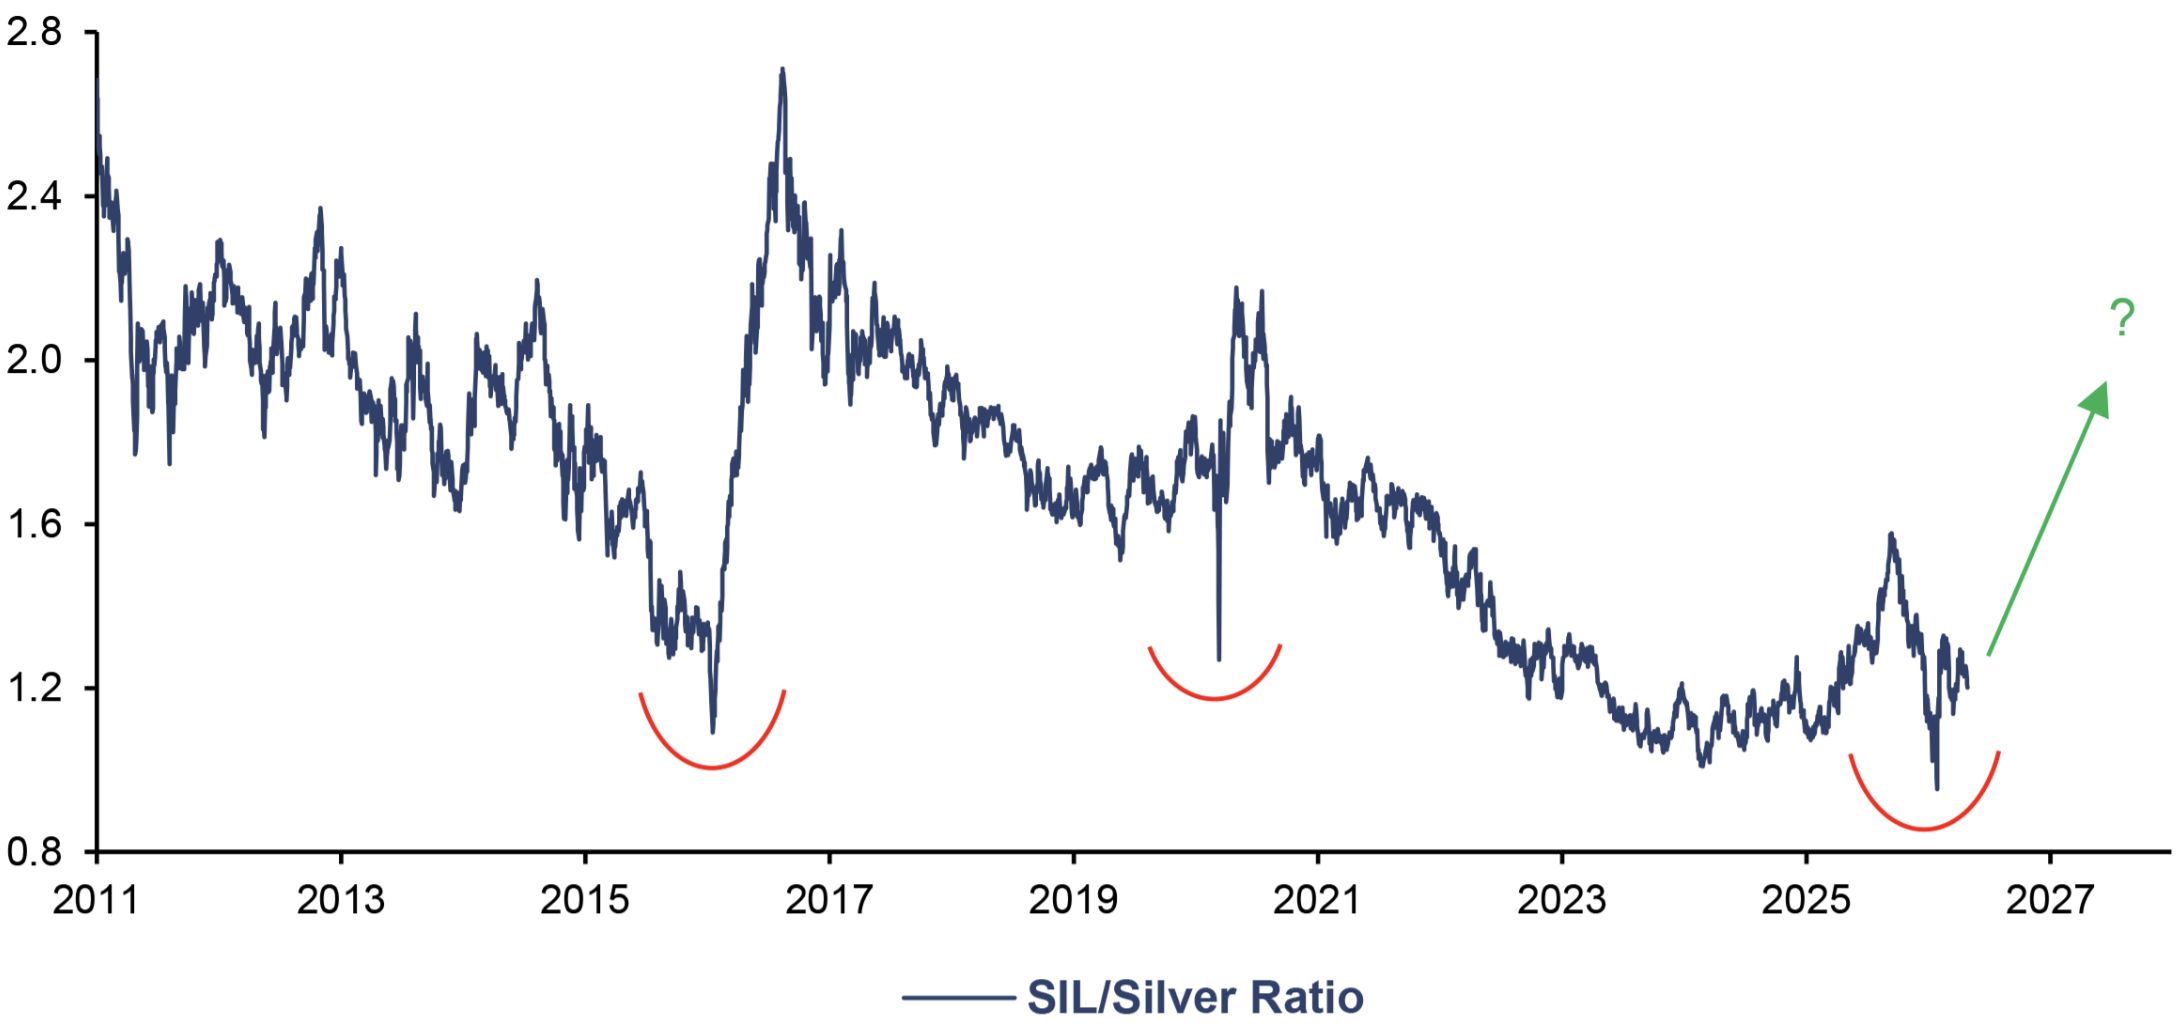
To answer our own rhetorical question then, silver is strongly favored to climb a “stairway to heaven” in 2026 rather than be driven down a “highway to hell”. And yet, even if the metal stays rangebound at the 2026 forecast of USD 79.57, the 98% increase upon the 2025 average renders silver miners the decidedly high-beta play from here on in. As measured by the SIL ETF, silver miners continue to trade at depressed levels relative to an elevated silver price, spelling opportunity for the category we call performance gold.
SIL/Silver Ratio, 01/2011–04/2026
Source: LSEG, Incrementum AG
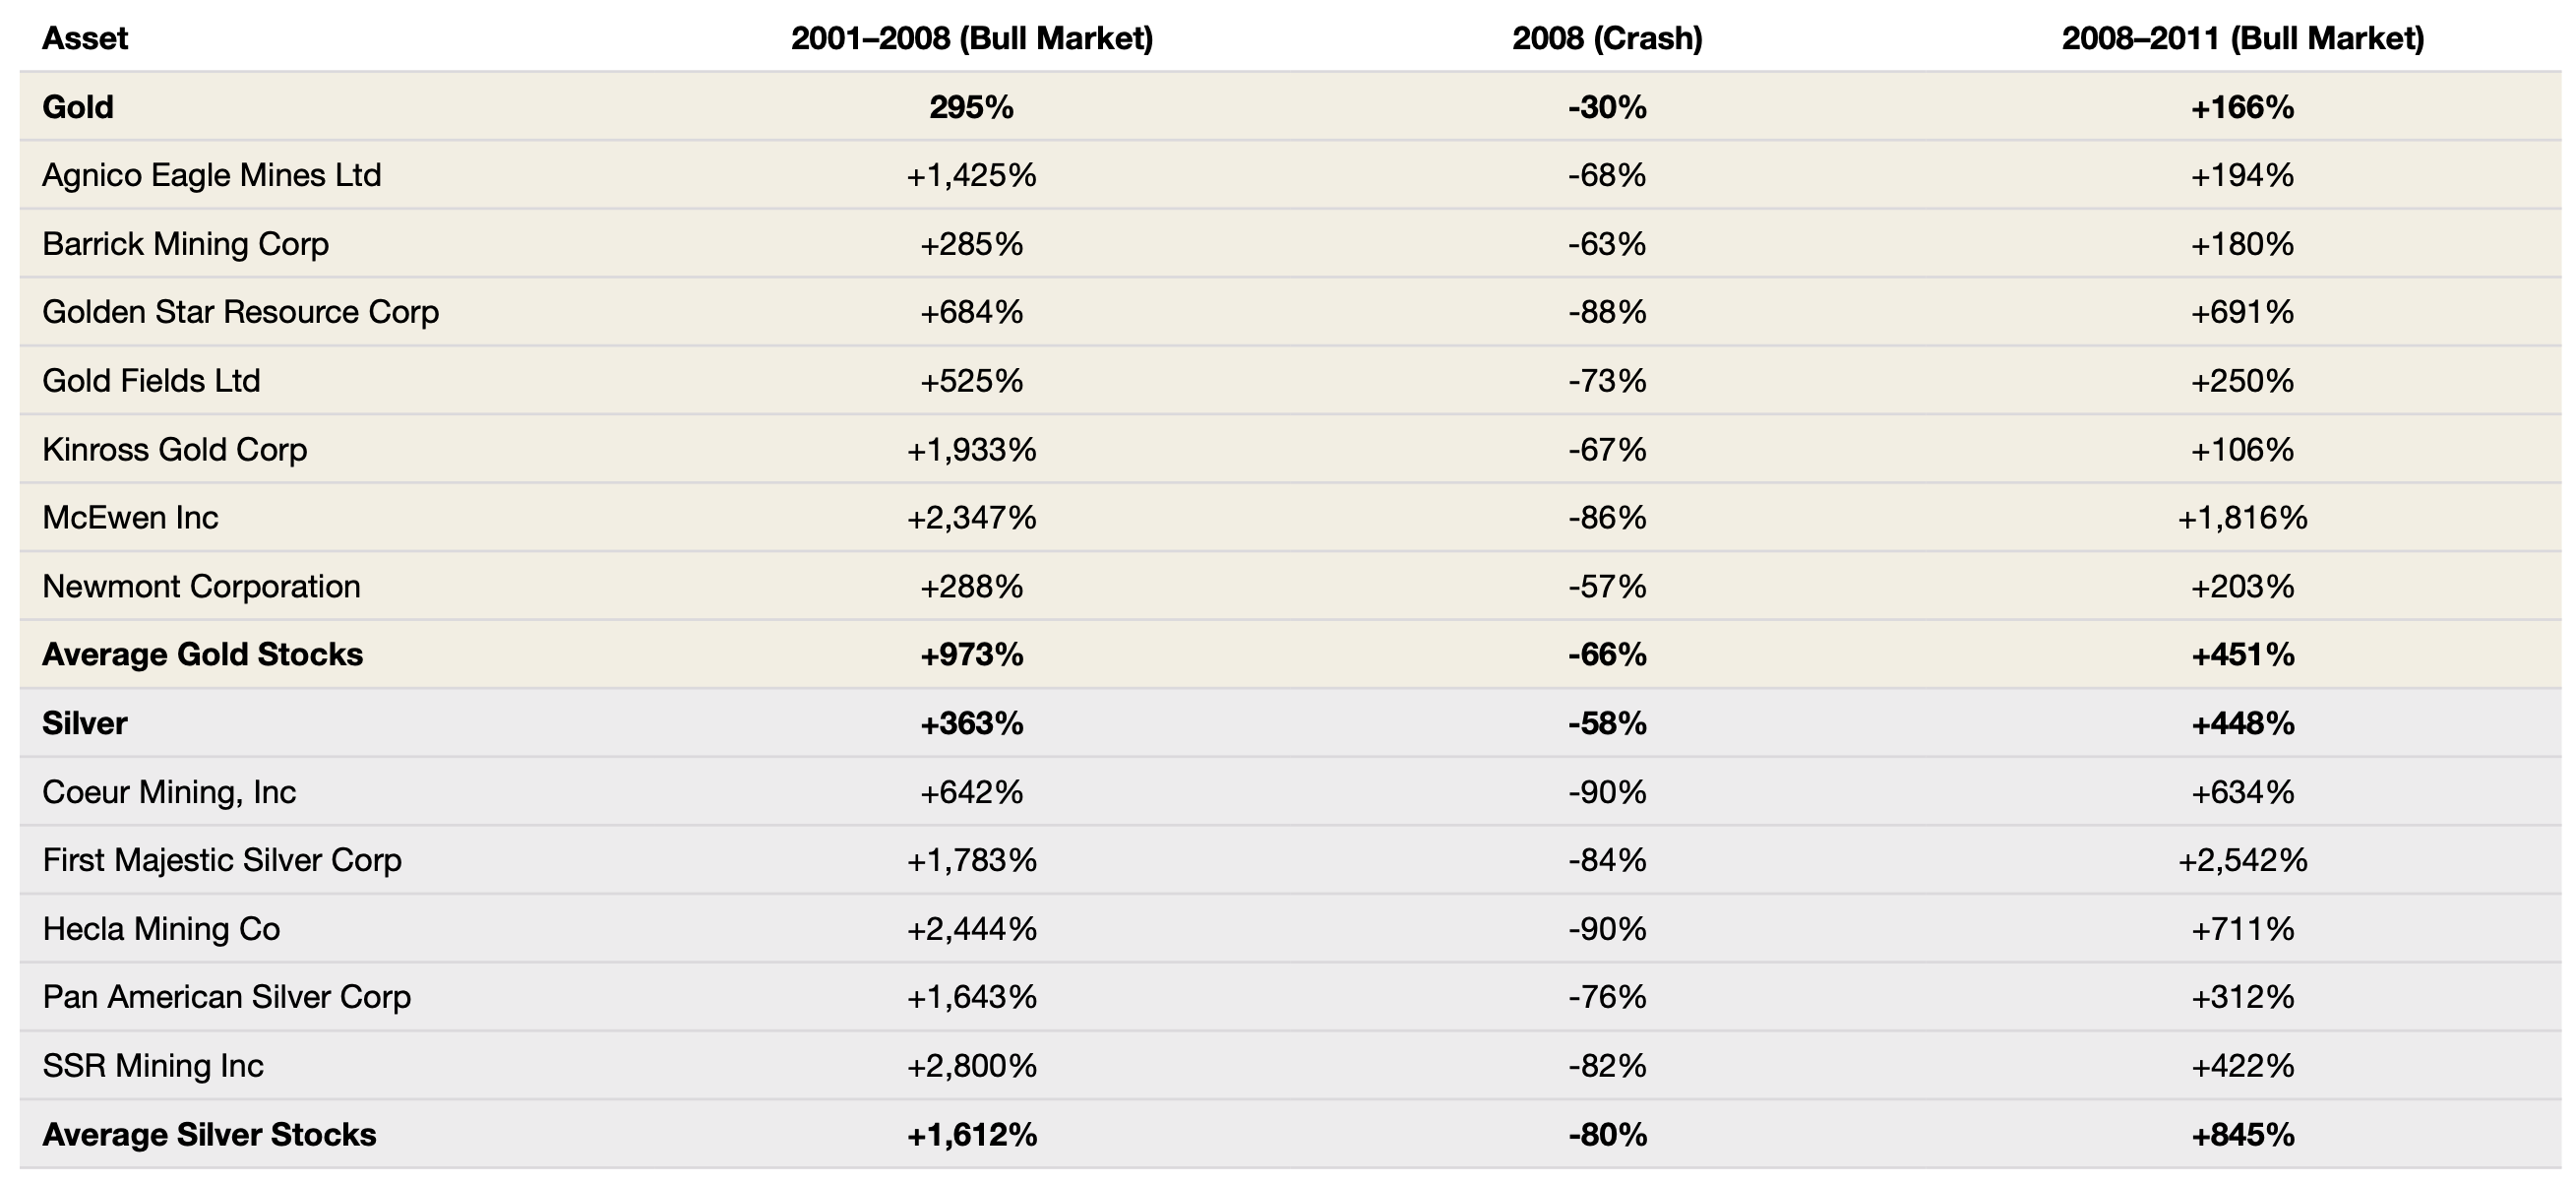
On this basis, it would seem that investors are refraining from buying silver miners until confirmation is received that the silver price will remain elevated or go higher. Already generating record free cash flows at an 80 USD silver price, the irony is that silver miners do not require higher prices. This disconnect provides investors with a window to obtain 3–5x leverage on the silver price at a steep discount. As Jeff Clark demonstrates in PAYDIRT, this 3–5x leverage rule has held remarkably consistent across cycles.
Performance of Various Assets, 2001–2011
Source: LSEG, Incrementum AG
In summary, the wise adage “If you don’t hold it, you don’t own it” should serve silver investors and their portfolios well beyond 2026. However, while the “rock” continues to serve more risk-averse investors as a hard asset safe haven, we believe the moment has finally arrived for silver mining stocks to enjoy their period of relative outperformance, as the silver bull rears up for its most thunderous charge yet.
[1] See “Searching for the Silver Bullet: An Analysis of Silver Price Catalysts”, In Gold We Trust report 2025
[2] “Silver’s Correlation with Gold & LME Index”, World Silver Survey 2026, Silver Institute, p. 17
[3] “Identifiable Silver Bullion Inventories,” World Silver Survey 2026, Silver Institute, p. 26