


Quo vadis, aurum?
“The end of history has itself come to an end, with significant implications for gold and the dollar, which are becoming increasingly apparent.”
Deutsche Bank Research Institute
- The Pax Americana and, with it, the 1971 fiat regime, is showing unmistakable signs of fatigue. Monetary system transitions are the tectonic shifts of history – they rarely unfold smoothly. For investors, three virtues now matter most: orientation, prudence, and diversification.
- Gold is not remonetized by decree, but through function. Six vectors – from reserve policy to accounting to tokenization – are restoring gold to what it has been for millennia: a monetary anchor.
- The next major wave of demand for gold will come from the USD 140trn bond market – the very segment that has long been considered a safe haven. Even marginal shifts from fixed income would overwhelm the financial gold market, which is only USD 15trn in size.
- Performance gold shines: silver, mining, commodities. Silver hit new all-time highs, while the mining sector remains historically marginalized at 1% of global stock market capitalization – the catch-up process has only just begun. The focus is now particularly on commodities.
- Gold and Bitcoin – stability meets convexity. In the age of the debasement trade, noninflatable assets are no longer a niche but a strategic necessity.
- Our decade target of USD 4,800 by 2030, as outlined in our 2020 In Gold We Trust report, has already been a reality in 2026. We are now turning our attention to the inflationary alternative scenario: USD 8,900 by the end of the decade.
As in every issue of the In Gold We Trust report, we want to conclude this issue by looking ahead. In this outlook, we will draw on the most important lessons we have learned from our analysis of the gold market since 2007.
- Gold is not a “pet rock.” When we began writing about gold in 2007, we were met with skepticism from the mainstream. Yet the performance figures speak for themselves: almost +600% in US dollar terms, corresponding to an annualized growth rate of 10.8%. Gold has outperformed virtually every traditional asset class during this period.
- The Austrian School of Economics was right. Credit expansion leads to misallocation, inflation, and crises. The cycle is following the Austrian script with a precision that has surprised even us. Financial repression – the systematic expropriation of savers through negative real interest rates – has become a permanent fixture.
- De-dollarization is no longer a niche topic. In 2007, the US dollar accounted for nearly two-thirds of global currency reserves. Today, that share stands at less than 58%. If gold reserves are included, it is only around 45%.
- Trust is the monetary foundation. The creeping erosion of institutional trust – from central banks to political institutions, the media, and the fiat money system itself – is the hidden driving force behind many developments.
- The cycles follow a pattern. The collapse of Bretton Woods in 1971–73, the Asian financial crisis of 1997, the global financial crisis of 2007–08, the Covid-19 pandemic of 2020–2022, and the geopolitical turning point of 2022 – each of these crises has confirmed gold as a monetary anchor. Those who know monetary history see patterns where others suspect chaos.
- Central banks have switched sides. After two decades as net sellers, the trend reversed fundamentally starting in 2010. Since then, central banks have cumulatively purchased over 7,000 t of gold on a net basis. The irony is striking: The very institutions that dismissed gold as a barbaric relic for decades are now the most aggressive buyers.
- The East has replaced the West as the center of the gold market. China and India now account for over 50% of physical gold demand. What Frank Holmes called the “love trade” has evolved into a structural anchor of demand. At the same time, Asian stock markets are rapidly gaining importance. Pricing power is shifting eastward – and with it, the rules of the gold market.
- Gold has increased almost sevenfold in value since the first In Gold We Trust report in 2007 – and very few were there to witness it. Despite a CAGR of 9.0% since 1971, gold remains underrepresented in most institutional portfolios. The biggest bull market of a generation took place largely without Western financial investors.
- Basel III has quietly but fundamentally transformed the gold market. The 0% risk weighting for allocated gold and the 85% NSFR for unallocated gold are pushing the market away from synthetic “paper gold” toward physical ownership. At the same time, the revaluation account on the Eurosystem’s balance sheets has grown to EUR 1,274bn and serves as a balance sheet solvency anchor. A creeping remonetization of gold is taking place through regulatory backdoors.
- The gold mining sector: from problem child to model student. The excesses during the 2010–2013 M&A wave were followed by a phase of radical capital discipline – and share price consolidation. Today, record cash flows are being channeled into dividends and share buybacks. AISC margins stand at nearly USD 3,000/ oz, and balance sheets are solid. Nevertheless, the entire sector remains a dwarf: The ten largest gold mining companies have a combined market capitalization of around USD 500bn.
On the Path to the Next Monetary Order
Western industrialized nations have elevated the strategy of perpetual postponement to a fine art. “Kicking the can down the road” – accumulating debt instead of reducing it, postponing structural reforms, declaring monetary policy a panacea. But every path comes to an end, sooner or later. The crucial question is: What awaits us there?
In any case, the monetary coordinate system of the postwar order is facing a recalibration. And in every major monetary upheaval of the past centuries, gold has played a central role. Why should it be any different this time?
We are neither doomsayers nor prophets of the apocalypse – otherwise we would hardly have started families and built businesses. Yet the history of money teaches us one thing: Monetary systems have an expiration date. The classical gold standard lasted a few decades; Bretton Woods, not even three. The fiat regime, born out of necessity in 1971–73, is stumbling toward its sixth decade – and showing the signs of fatigue that sooner or later spell doom for any unbacked monetary system: fiscal hubris, creeping loss of purchasing power, and an erosion of confidence that has now become impossible to overlook, even by the mainstream.
A look at history shows that such currency upheavals rarely occur without disruption. Transitions between monetary systems are not routine technocratic procedures that can be dealt with in the minutes of a central bank meeting, but rather tectonic shifts – accompanied by conflicts of interest, misguided incentives, political friction, and abrupt market reactions. Precisely for this reason, three virtues matter more than ever to investors during such phases: orientation, prudence, and diversification.
For investors, gold can act as a financial time machine: a temporary haven for wealth while the monetary system realigns itself. Those who park their investments in gold are not turning their backs on the future; they are relying on gold as a bridge to the future. Gold is thus not the destination of the journey, but a vehicle for the passage there.
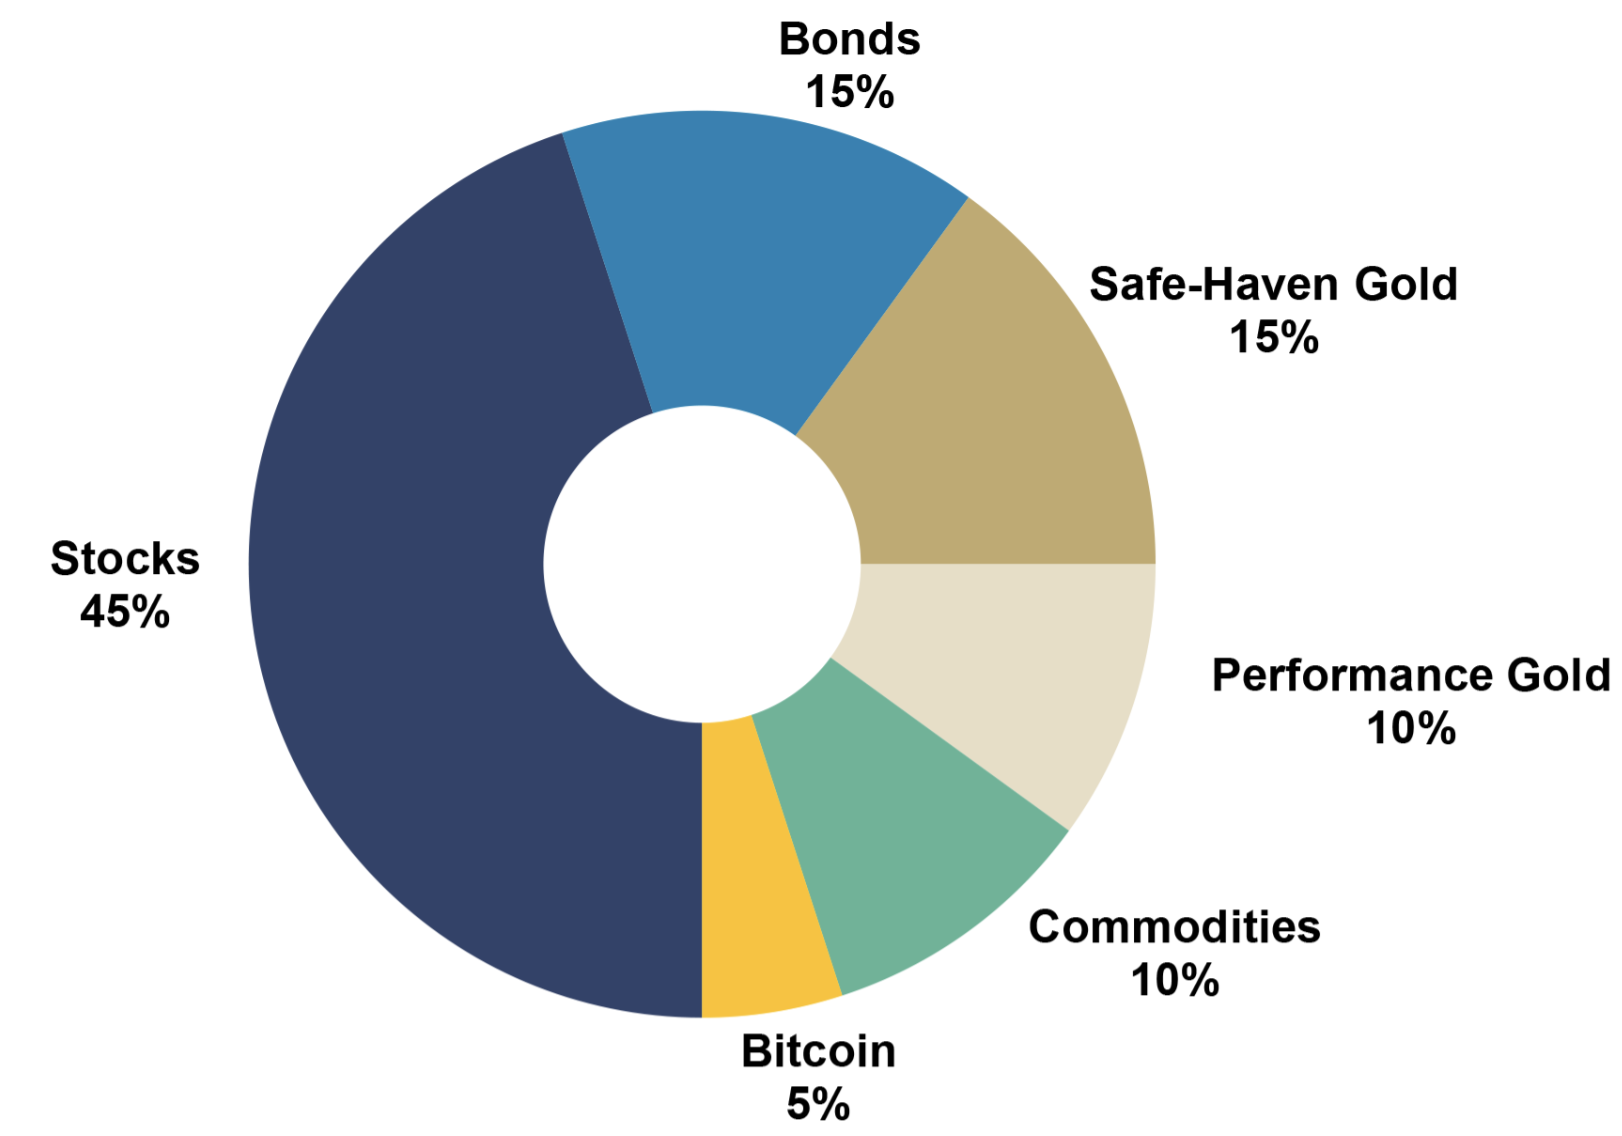
Gold is not a panacea but an anchor. That is why we conceived the “new 60/40 portfolio” in the In Gold We Trust report 2024, “The New Gold Playbook” – moving away from nominal claims toward noninflationary tangible assets. Physical gold forms the strategic core, flanked by actively timed performance gold such as silver and mining stocks, a commodities allocation, and a sensibly sized Bitcoin position. The share of fixed-income securities, on the other hand, is shrinking significantly – and intentionally so. The question of the decade is no longer what bonds yield – but what those yields are worth.
The New 60/40 Portfolio: Subcategories
Source: In Gold We Trust
The recent shift on Wall Street shows that we are no longer alone in this assessment: In September 2025, Mike Wilson, CIO at Morgan Stanley, proposed a 60/20/20 portfolio – 60% stocks, 20% short-term bonds, 20% gold, explicitly describing gold as an “anti-fragile asset.” BlackRock, J.P. Morgan, and Goldman Sachs also now emphasize the structural necessity of gold allocations beyond the traditional 5% mix. When even the biggest names on Wall Street are publicly shelving the time-honored 60/40 portfolio, the shift in thinking has reached the mainstream.
The much-cited negative correlation between stocks and bonds has historically been the exception rather than the rule – for roughly 70% of the past 100 years, the two asset classes moved in tandem. The fact that the 60/40 portfolio still worked is thanks to the Great Moderation, that era of steadily declining inflation rates which came to an abrupt end with the surge in inflation starting in 2021. But what if bonds, the supposed safe haven of the portfolio, are in fact the bubble themselves?
Here comes the decisive turning point: In our view, the next major wave of gold demand is likely to come at the expense of the bond market. The global bond market – government and corporate bonds combined – currently totals around USD 140trn. This contrasts with a gold market of about USD 31trn, of which only around USD 14trn is traded – that is, bullion, coins, ETFs, and institutional and government holdings. The proportions are striking: If just 2% of the global bond volume were reallocated to gold, that would correspond to an inflow of nearly USD 3trn and thus about 20% of the entire investment gold market.
New 60/40 Portfolio*, and Old 60/40 Portfolio**, in USD, 100 = 05/17/2024, 05/2024–05/2026
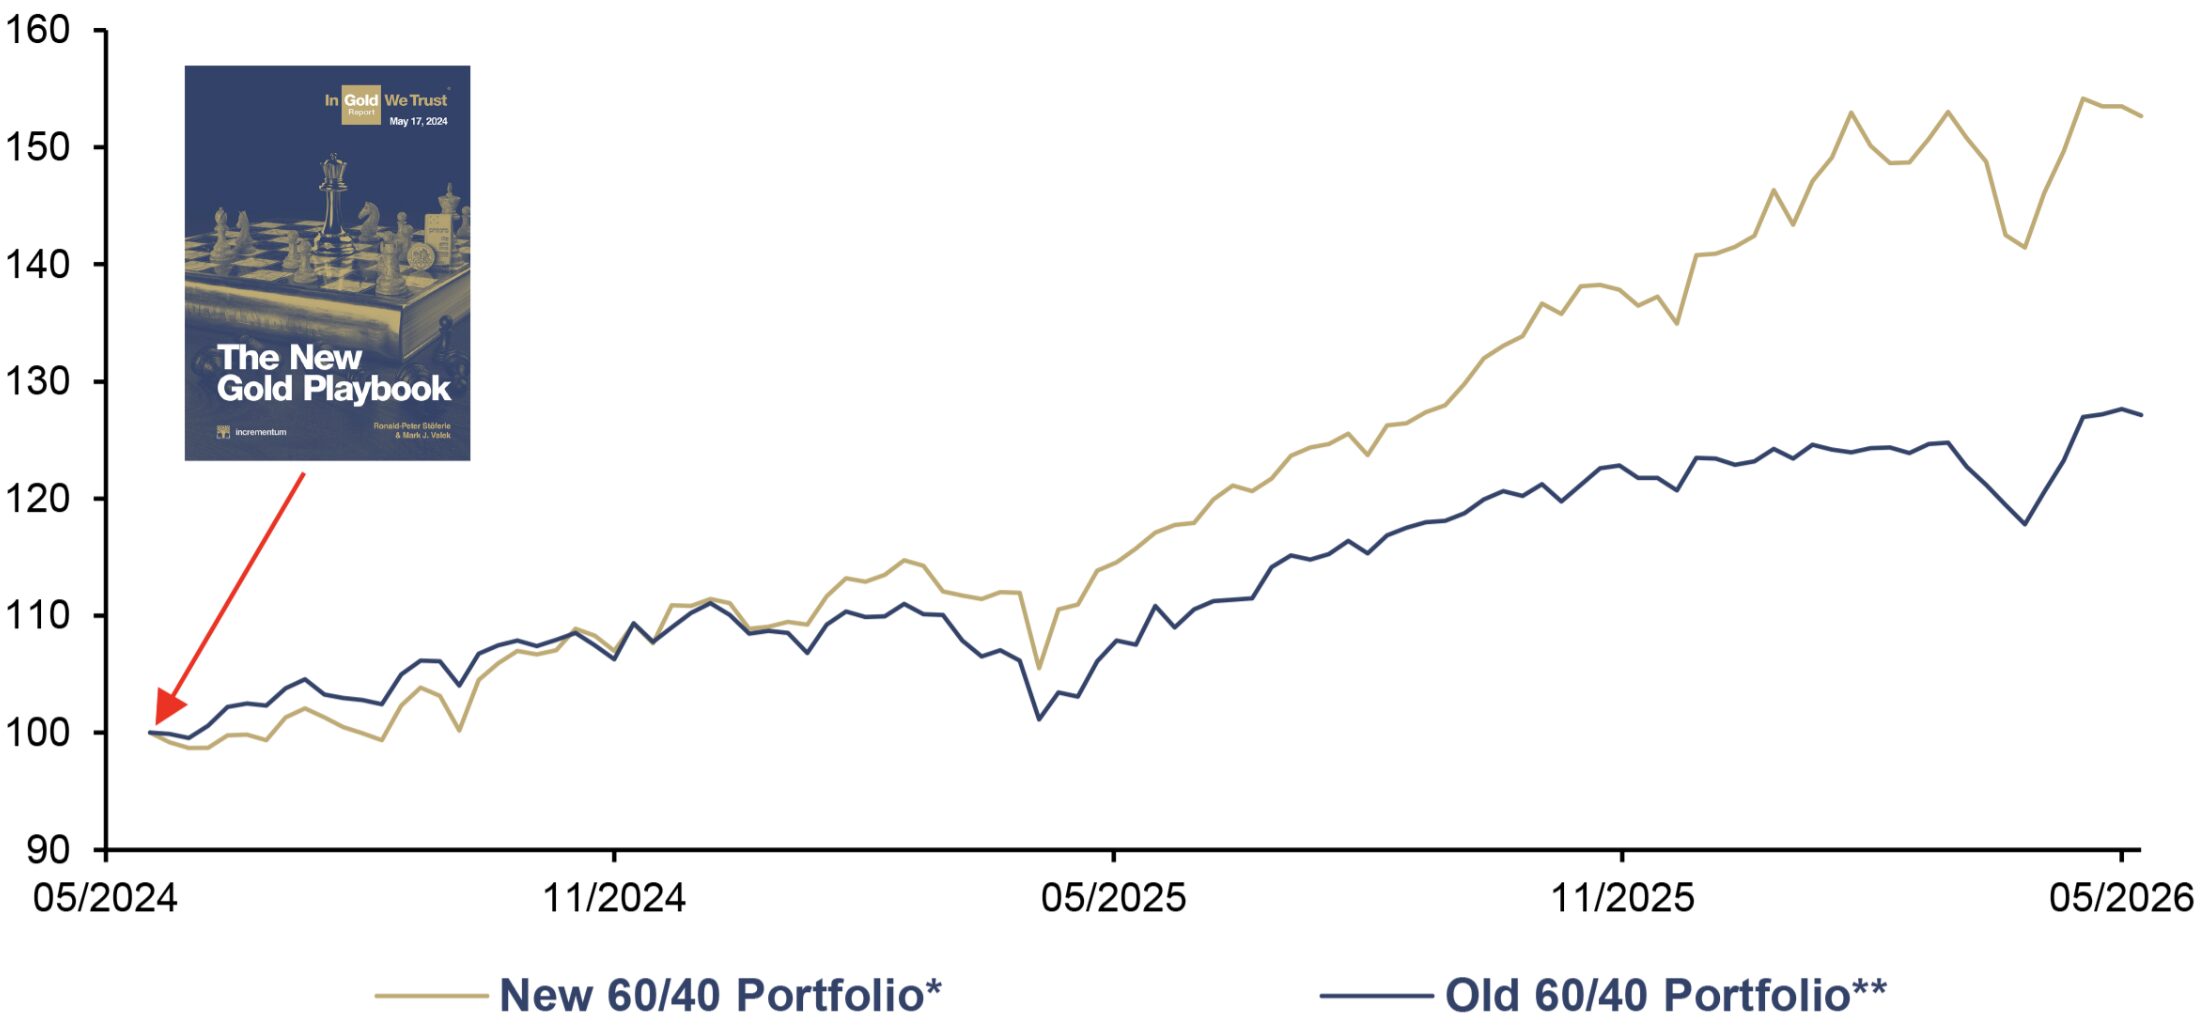
Source: LSEG, Incrementum AG, *45% S&P 500 TR, 15% US 10Y TR, 15% Gold, 5% Silver, 5% HUI Index TR, 10% BCOM TR, 5% Bitcoin, **60% S&P 500 TR, 40% US 10Y TR
The key point remains: A robust portfolio in an increasingly fragile monetary system requires both growth and value preservation components. Don’t put all your eggs in the gold basket – but build a significantly stronger foundation.
The six vectors of gold remonetization
What might the path to a new monetary order look like? Just as the DeLorean in the famous Back to the Future trilogy doesn’t leap blindly into a new era – it requires the precise interplay of energy, timing, and direction – a monetary system doesn’t either. A second Bretton Woods moment is unlikely, given the current geopolitical situation. Far more plausible is a series of functional shifts, such as in the areas of reserve policy, accounting rules, institutional portfolios, and technological innovation. The transformation is taking place less through official decrees and more through changing habits and economic necessities.
This is what connects the following six vectors:[1] Gold regains importance where trust, security, or political neutrality are waning.
- Reserve function & sovereignty: Gold as a sanctions-resistant, state reserve asset and neutral store of value
- Private remonetization: Gold as a strategic allocation for private and institutional investors
- Balancing & recapitalization: Gold as a silent recapitalization option for central banks and governments
- Anchoring in debt and credit markets: Gold-backed bonds as an anchor of credibility for government finances
- Accumulation: Western central banks as the potential next wave of buyers
- Digitalization: Tokenization making gold more mobile and tradable
These factors do not operate in isolation. A rising gold price improves central bank balance sheets, facilitates policy reassessments, enhances the appeal of gold-backed bonds, and increases interest in tokenized forms of gold. It is precisely these feedback loops that make remonetization not a one-off event but a self-reinforcing process.
Remonetization is taking shape
We are by no means the only analysts pointing to the possible evolution of the monetary system. Zoltan Pozsar had already elevated the debate on a new world monetary order to a new level in 2022 with his article “Bretton Woods III,” against the backdrop of sanctions on Russian currency reserves. He concluded his remarks with the following forecast: “From the Bretton Woods era backed by gold bullion, to Bretton Woods II backed by inside money (Treasuries with unhedgeable confiscation risks), to Bretton Woods III backed by outside money (gold bullion and other commodities).”[2]
There is no question in our minds that we are irrevocably on a journey toward a new global (monetary) order. It will require an internationally recognized anchor of confidence. For several reasons, gold appears to be predestined for this role:
- Gold is neutral – it knows neither flag nor ideology and is thus free from geopolitical manipulation.
- Gold has no counterparty risk – unlike any claim or digital account entry, it exists independently, without relying on the promise of a third party.
- Gold is liquid – with a daily trading volume of around USD 330bn, it ranks among the world’s most liquid assets.
- Gold cannot be multiplied at will – gold reserves have been growing steadily by around 1.8% per year for decades. This geologically determined supply discipline is the fundamental difference from any fiat currency.
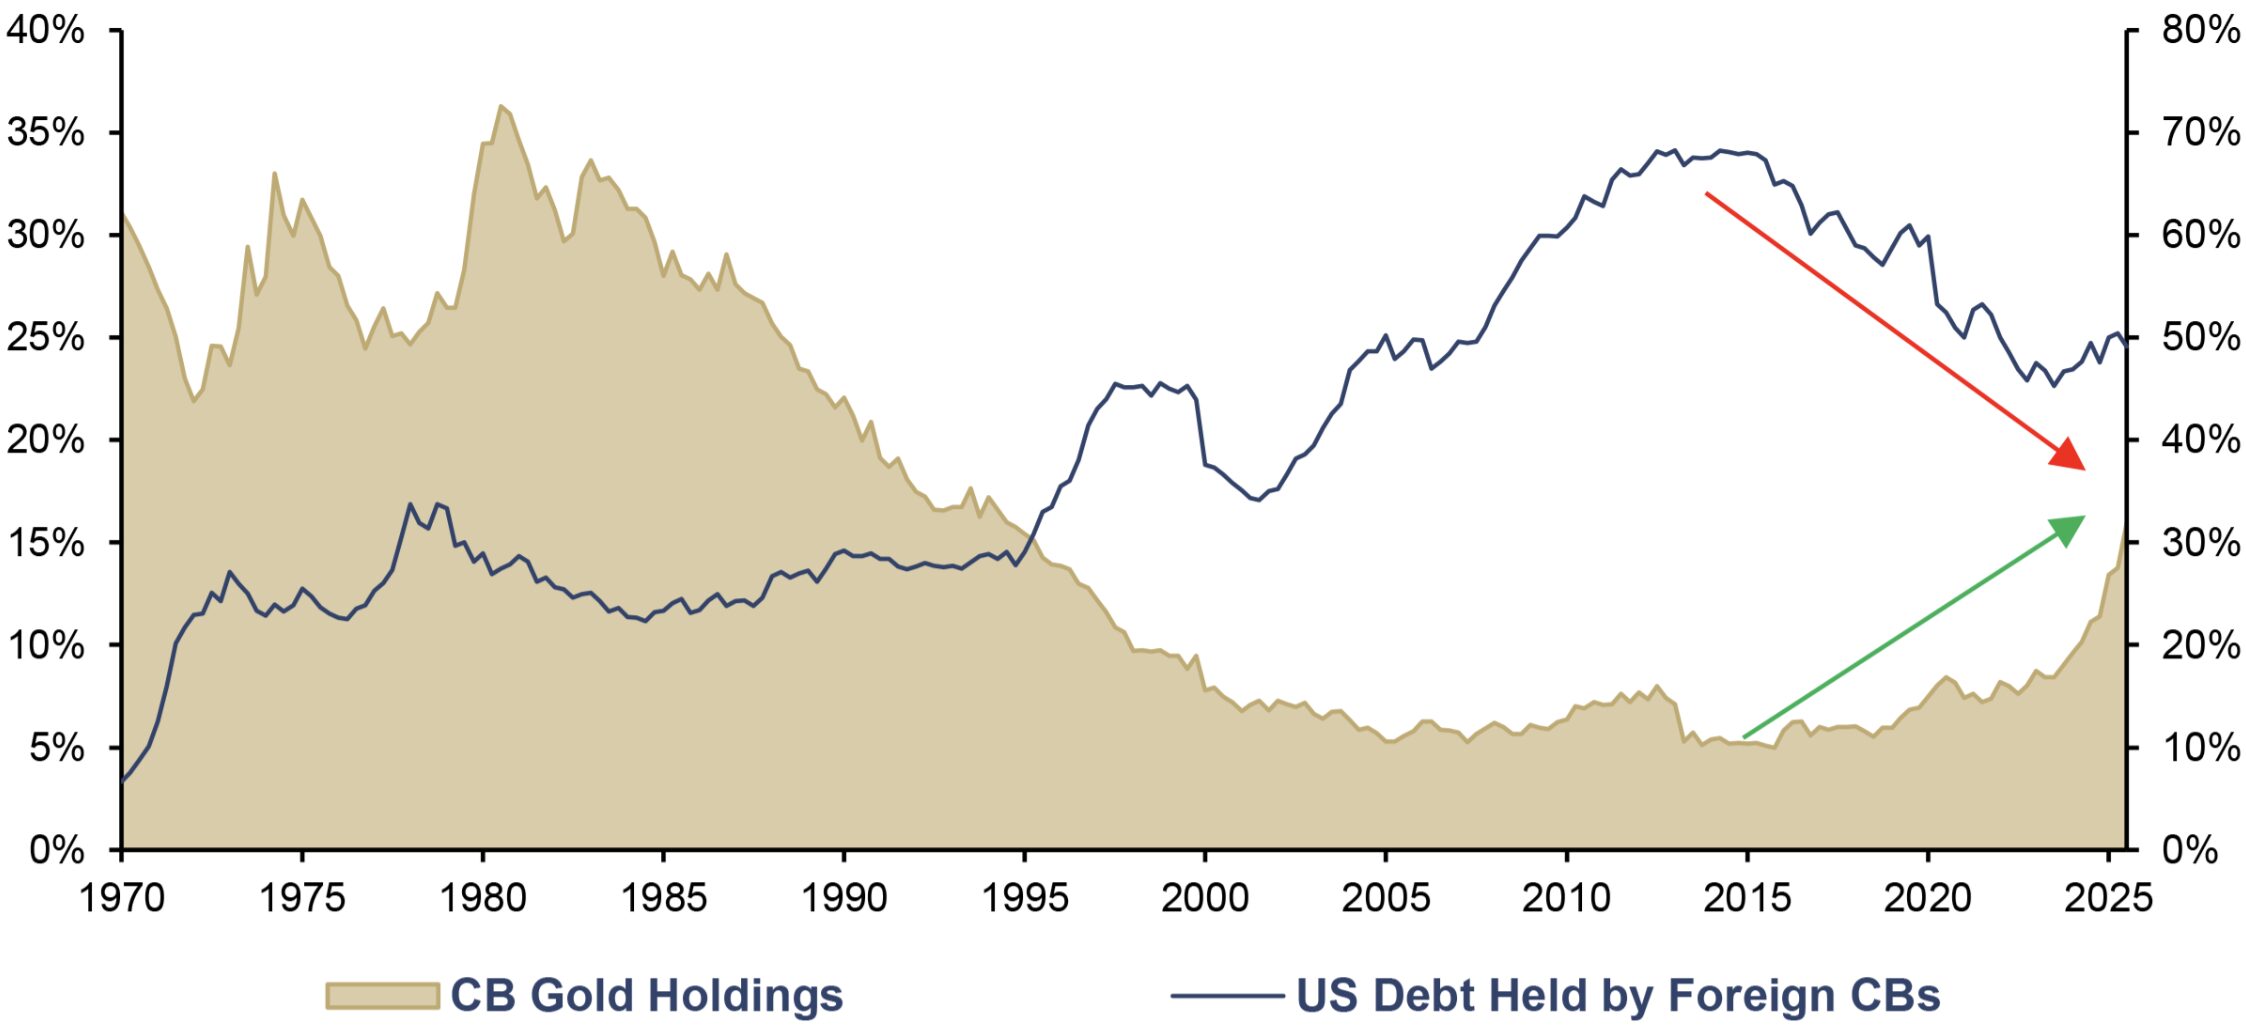
The composition of global currency reserves shows how far remonetization has already progressed. For decades, US Treasury bonds formed the backbone of official portfolios. Since the global financial crisis, the trend has reversed: The share of US bonds held by foreign central banks is declining, while gold is gaining significantly again. Despite significant purchases, emerging markets still hold considerably less gold than Western institutions.
US Debt Held by Foreign CBs (lhs), as a % of Total Debt, and CB Gold Holdings (rhs), as a % of Currency Reserves, Q1/1970–Q3/2025
Source: Crescat Capital, Federal Reserve St. Louis, World Gold Council, Incrementum AG
The shadow gold price
Should gold return to the center of the monetary system, the question of price consequences inevitably arises. An exact valuation is, by nature, impossible, but analytical approximations at least give us an idea of possible orders of magnitude. The best-known concept is the so-called shadow gold price.
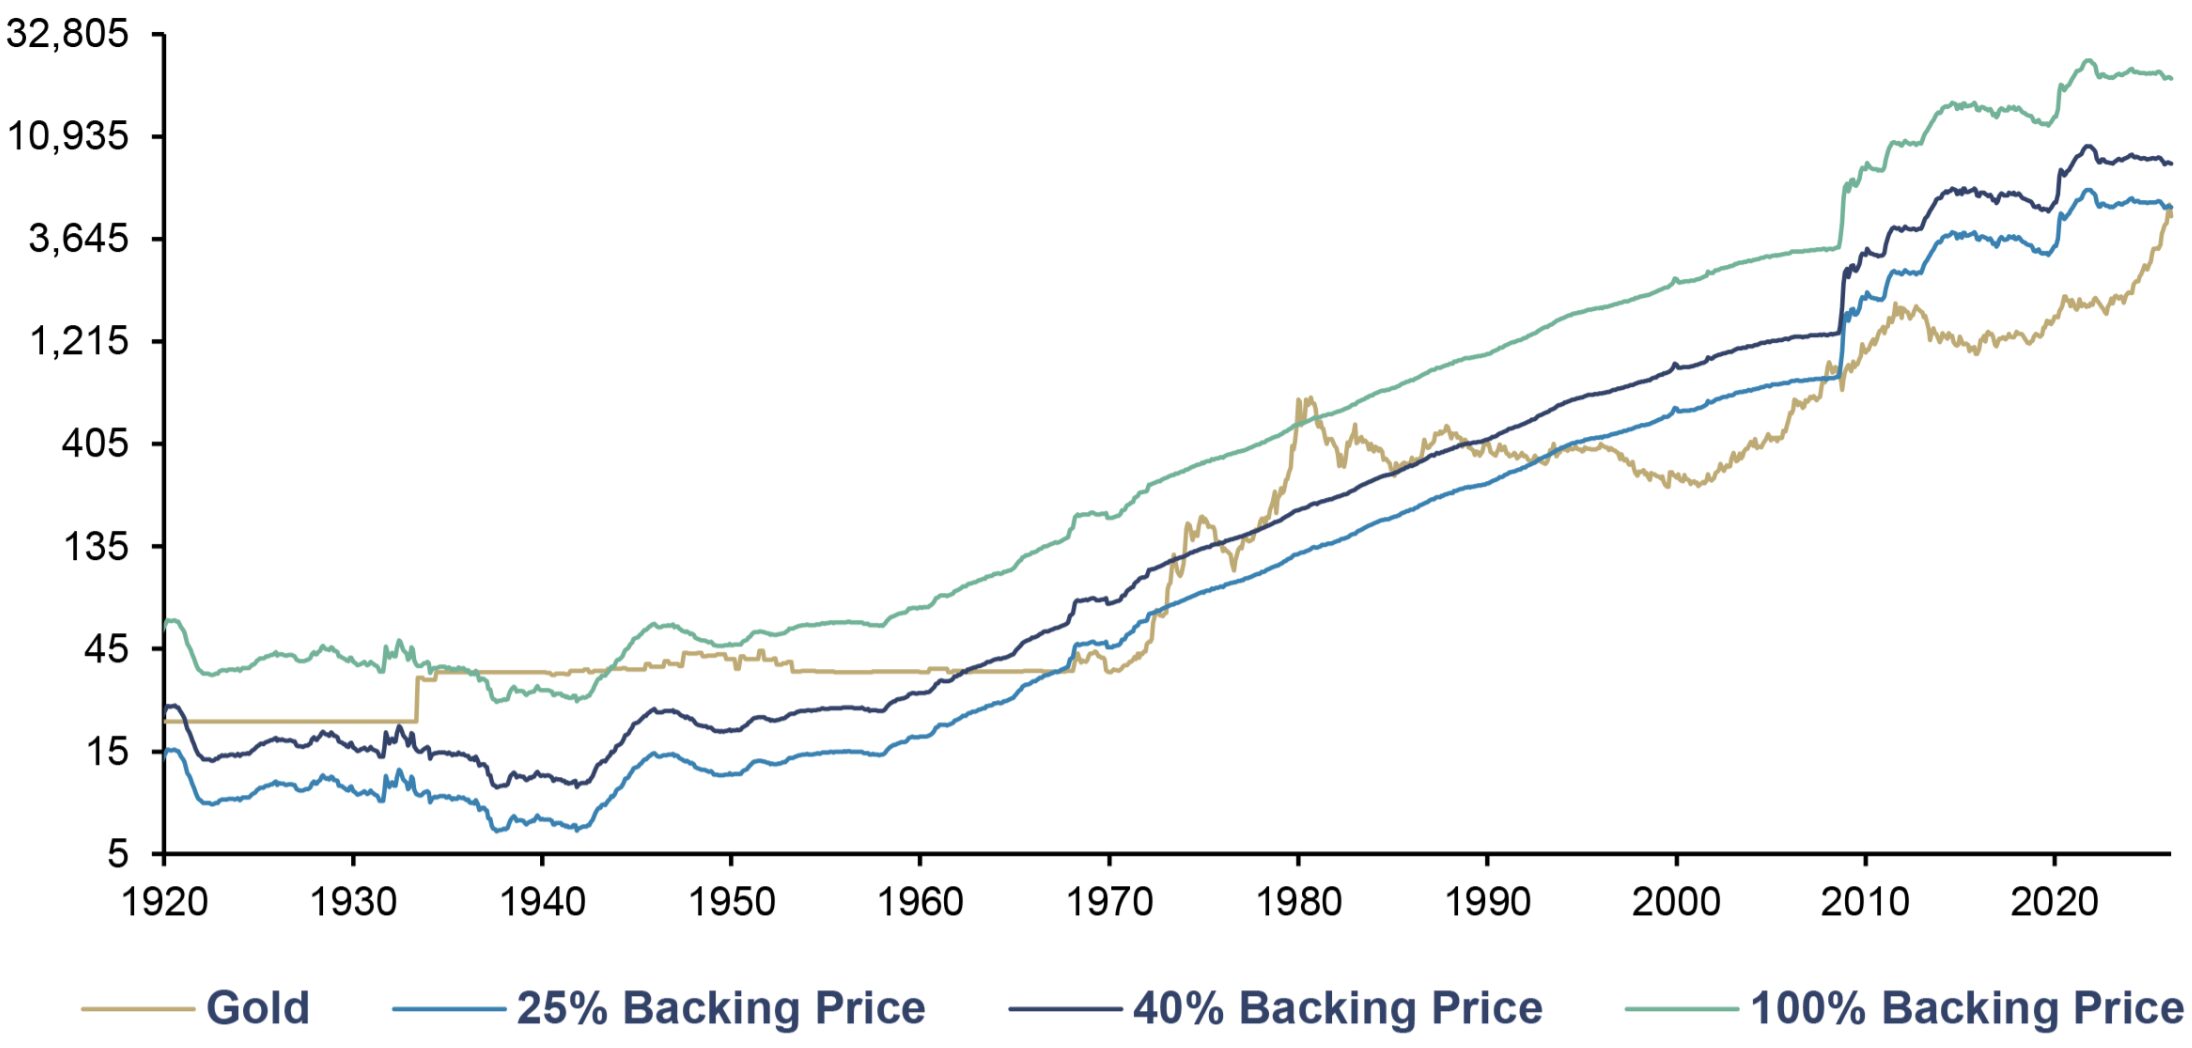
The shadow gold price refers to the theoretical gold price at which the base money supply would be fully backed by gold. In other words: The shadow gold price is the price level at which a return to a fully backed gold currency would be mathematically possible. We do not consider such 100% backing of M0, as is sometimes advocated, to be necessary; it would currently imply a gold price of USD 20,900 per ounce. During the era of the gold standard, the market forced central banks to maintain coverage ratios between one-third and one-half, which corresponds to a current gold price between USD 7,000 and USD 10,400 per ounce.
Historically, various forms of fractional reserve were the norm. For example:
- Federal Reserve Act of 1914: 40% minimum coverage → today USD 8,350/oz
- Bretton Woods era (1945–1971): 25% minimum coverage → today USD 5,200 per ounce – a level that the gold price has already reached at one point in 2026.
Gold Price to Back Monetary Base (log), in USD, 01/1920–03/2026
Source: Nick Laird, Federal Reserve St. Louis, LSEG, Incrementum AG
The shadow gold price reveals two things: first, the enormous expansion of the money supply relative to the available amount of gold, and second, the long-term appreciation potential of gold should it – as described in the vectors outlined above – gradually regain monetary functions. The shadow gold price thus serves as a compass for investors who view gold not as a commodity but as the anchor of a future monetary order.
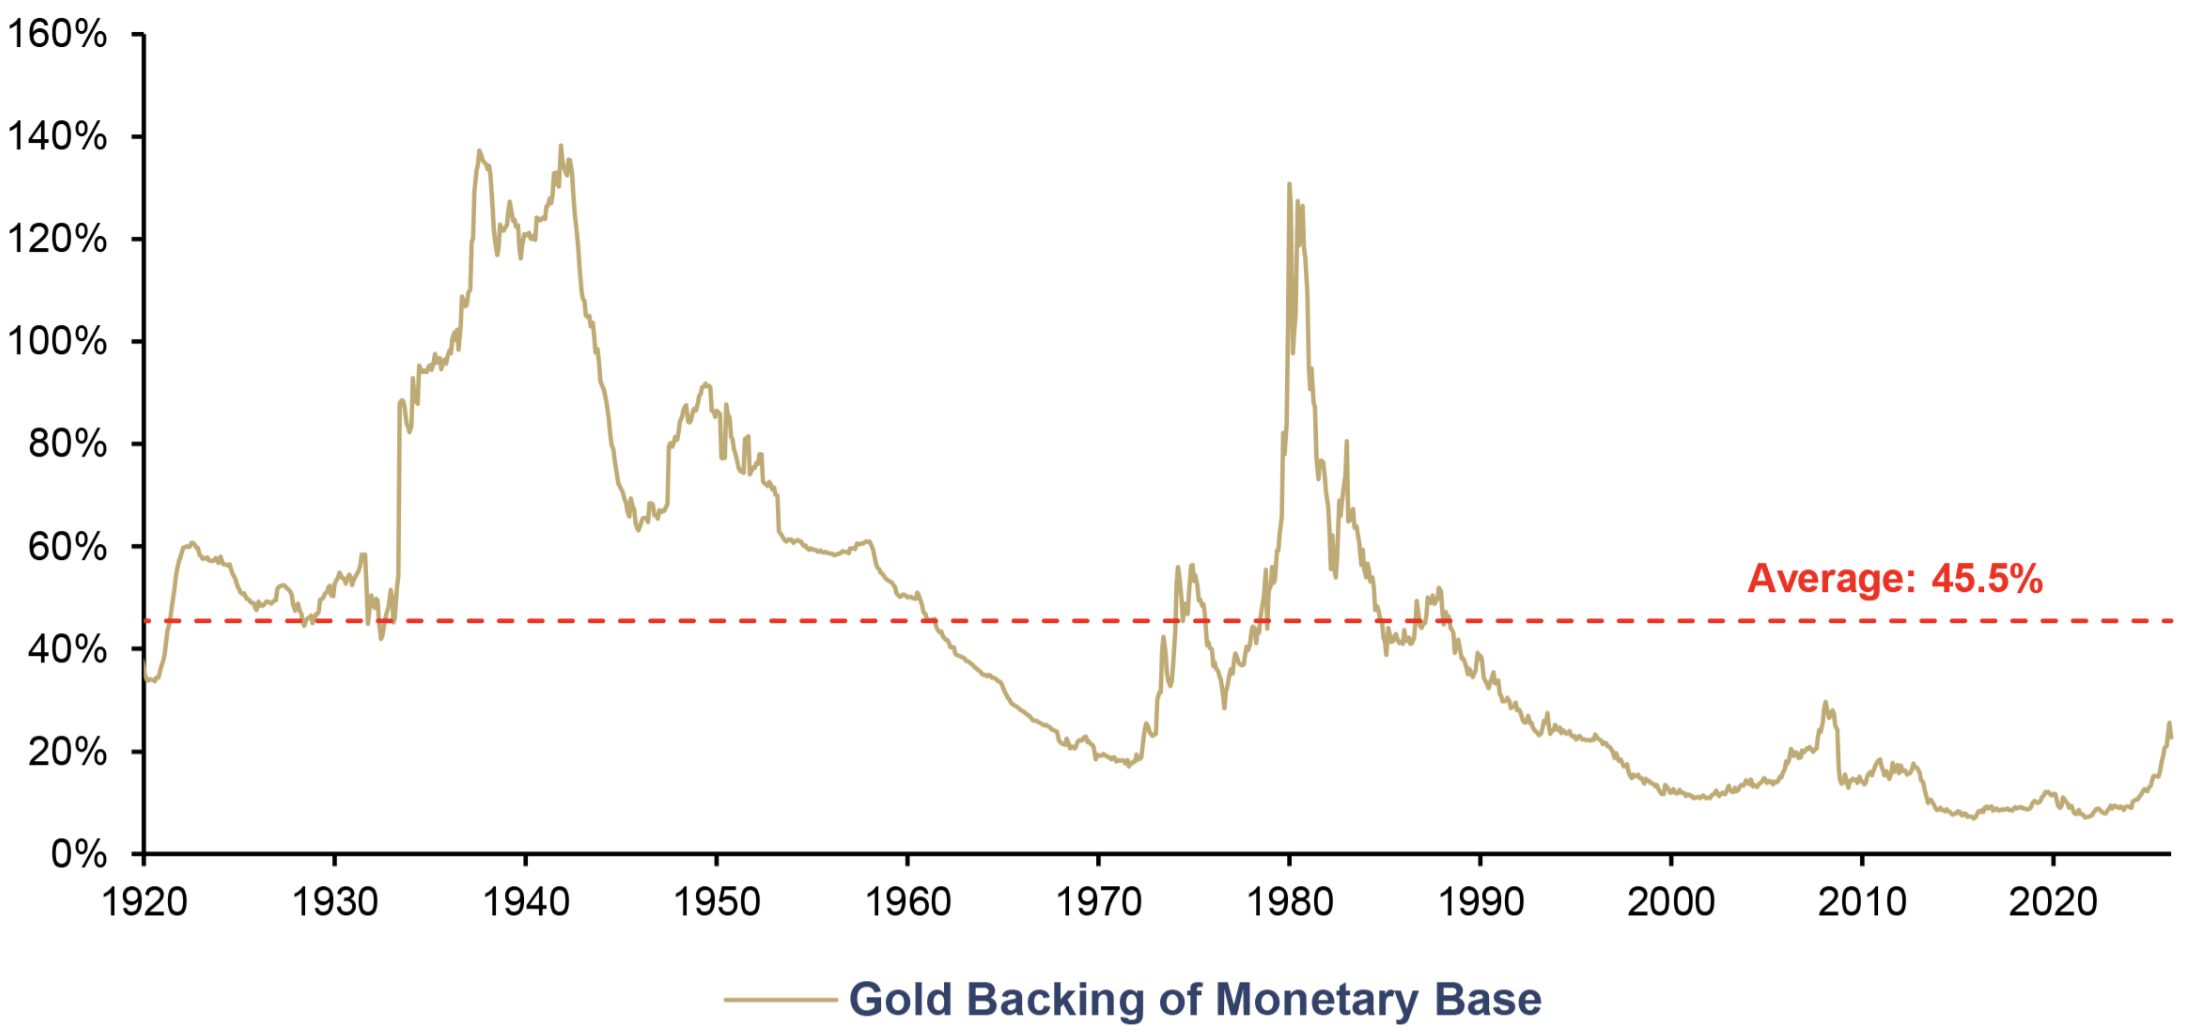
The reciprocal of the shadow gold price, based on current market prices, yields the gold coverage ratio of the monetary base. During the gold bull market of the 2000s, this ratio tripled from 10.8% to 29.7%. In the 1930s and 1940s, as well as in 1980, the gold coverage ratio was even above 100%. The record high of 131% from 1980 would correspond to a gold price of around USD 27,000. Currently, the gold coverage ratio of the US dollar equals just 22.4%. To put it bluntly: Less than a quarter of every US dollar is backed by gold – the remaining three-quarters are worthless.
Gold Backing of Monetary Base, in %, 01/1920–03/2026
Source: Nick Laird, Federal Reserve St. Louis, LSEG, Incrementum AG
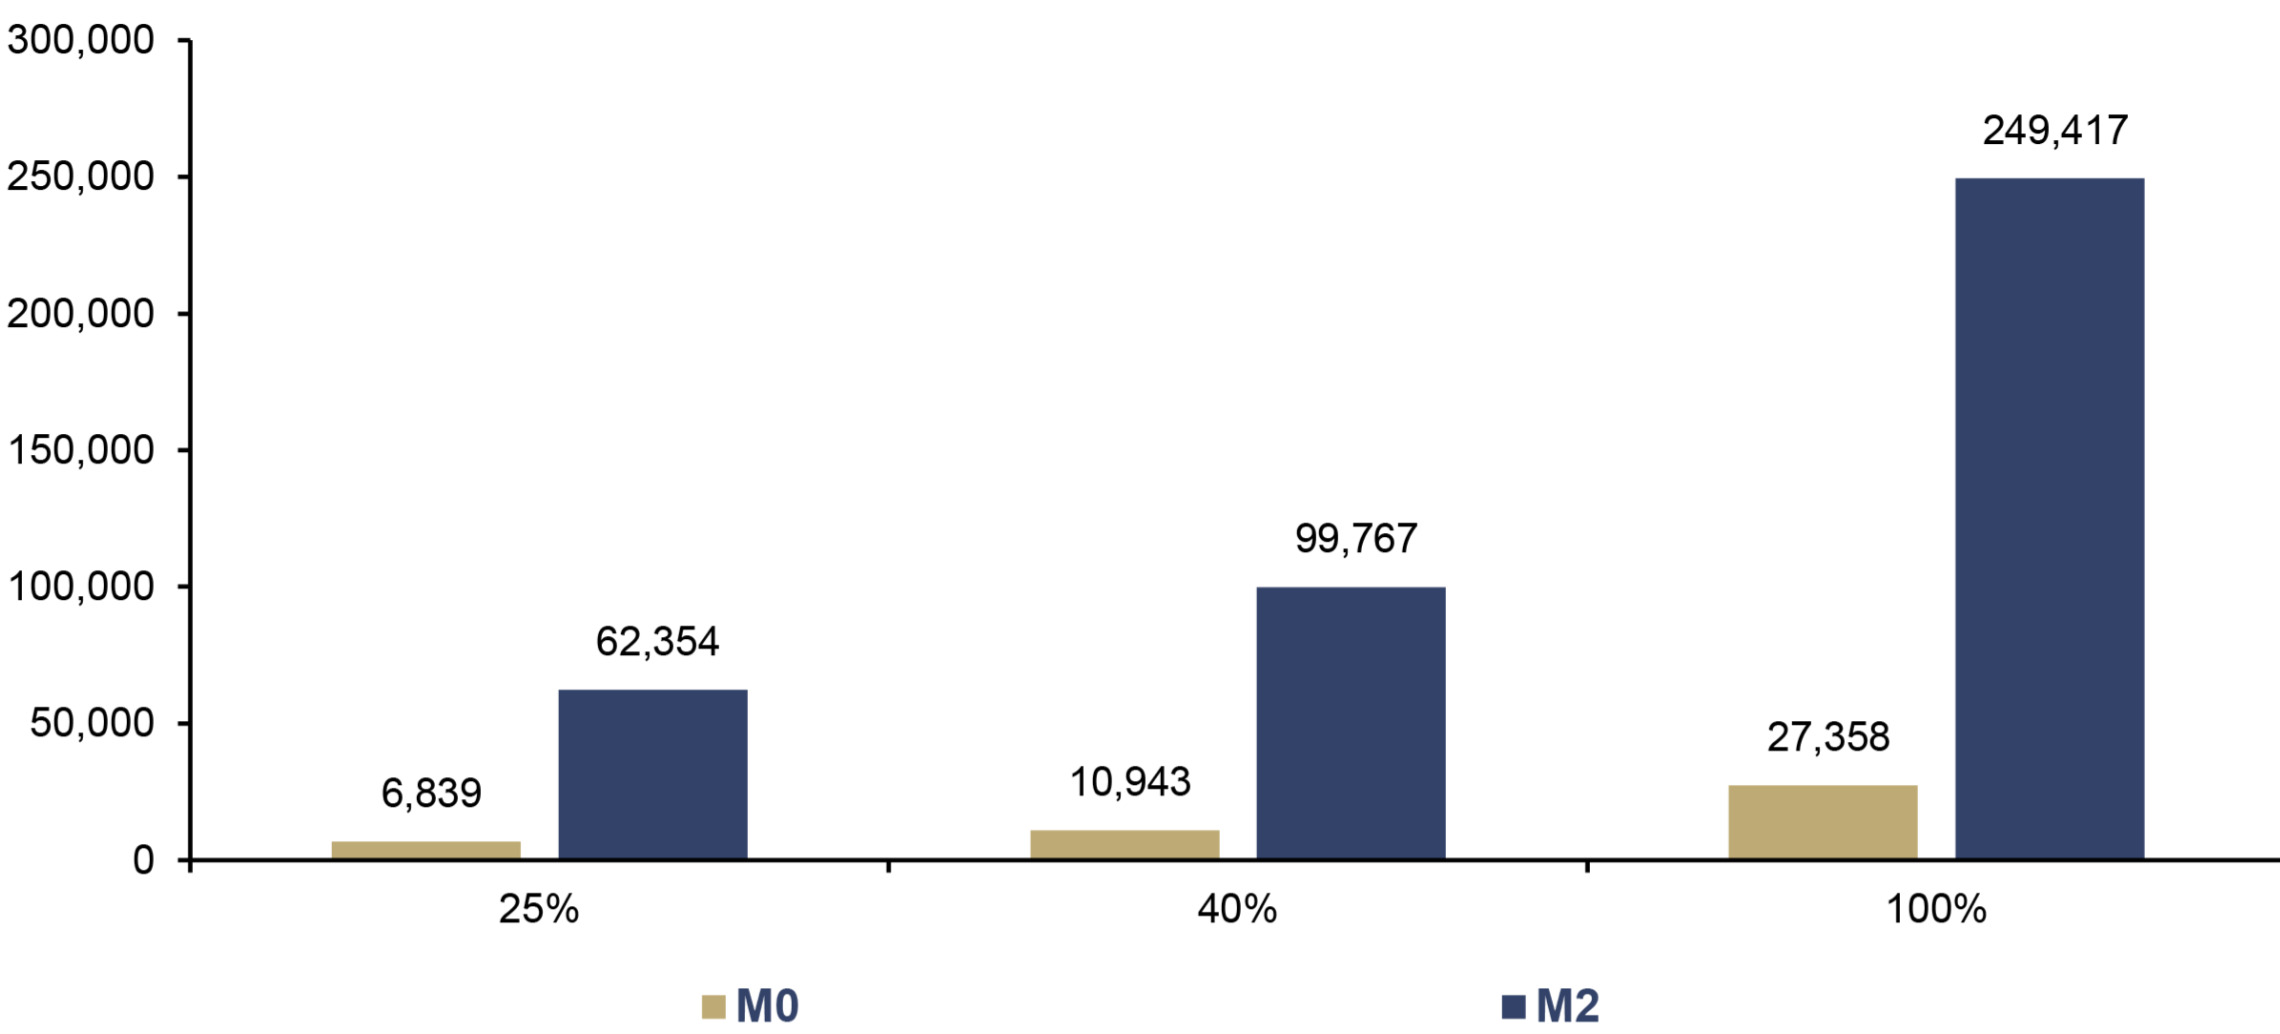
Let’s take it a step further and look at the global level. The international shadow gold price corresponds to the gold price that would result if the central bank gold reserves were to cover the money supplies of the leading currency areas – the US, the euro area, the UK, Switzerland, Japan, and China – weighted by their share of GDP. The result reveals the extent of monetary expansion: With 100% coverage of the broad money supply M2, the gold price would be just under USD 250,000; even at a moderate 25%, it would be over USD 60,000.
International Shadow Gold Price (SGP)* at Different Gold Backing Levels, in USD, 2025
Source: World Gold Council, LSEG, Incrementum AG, *SPG = Monetary Aggregate/Official Gold Reserves (in troy ounces)
The Bear Case for Gold
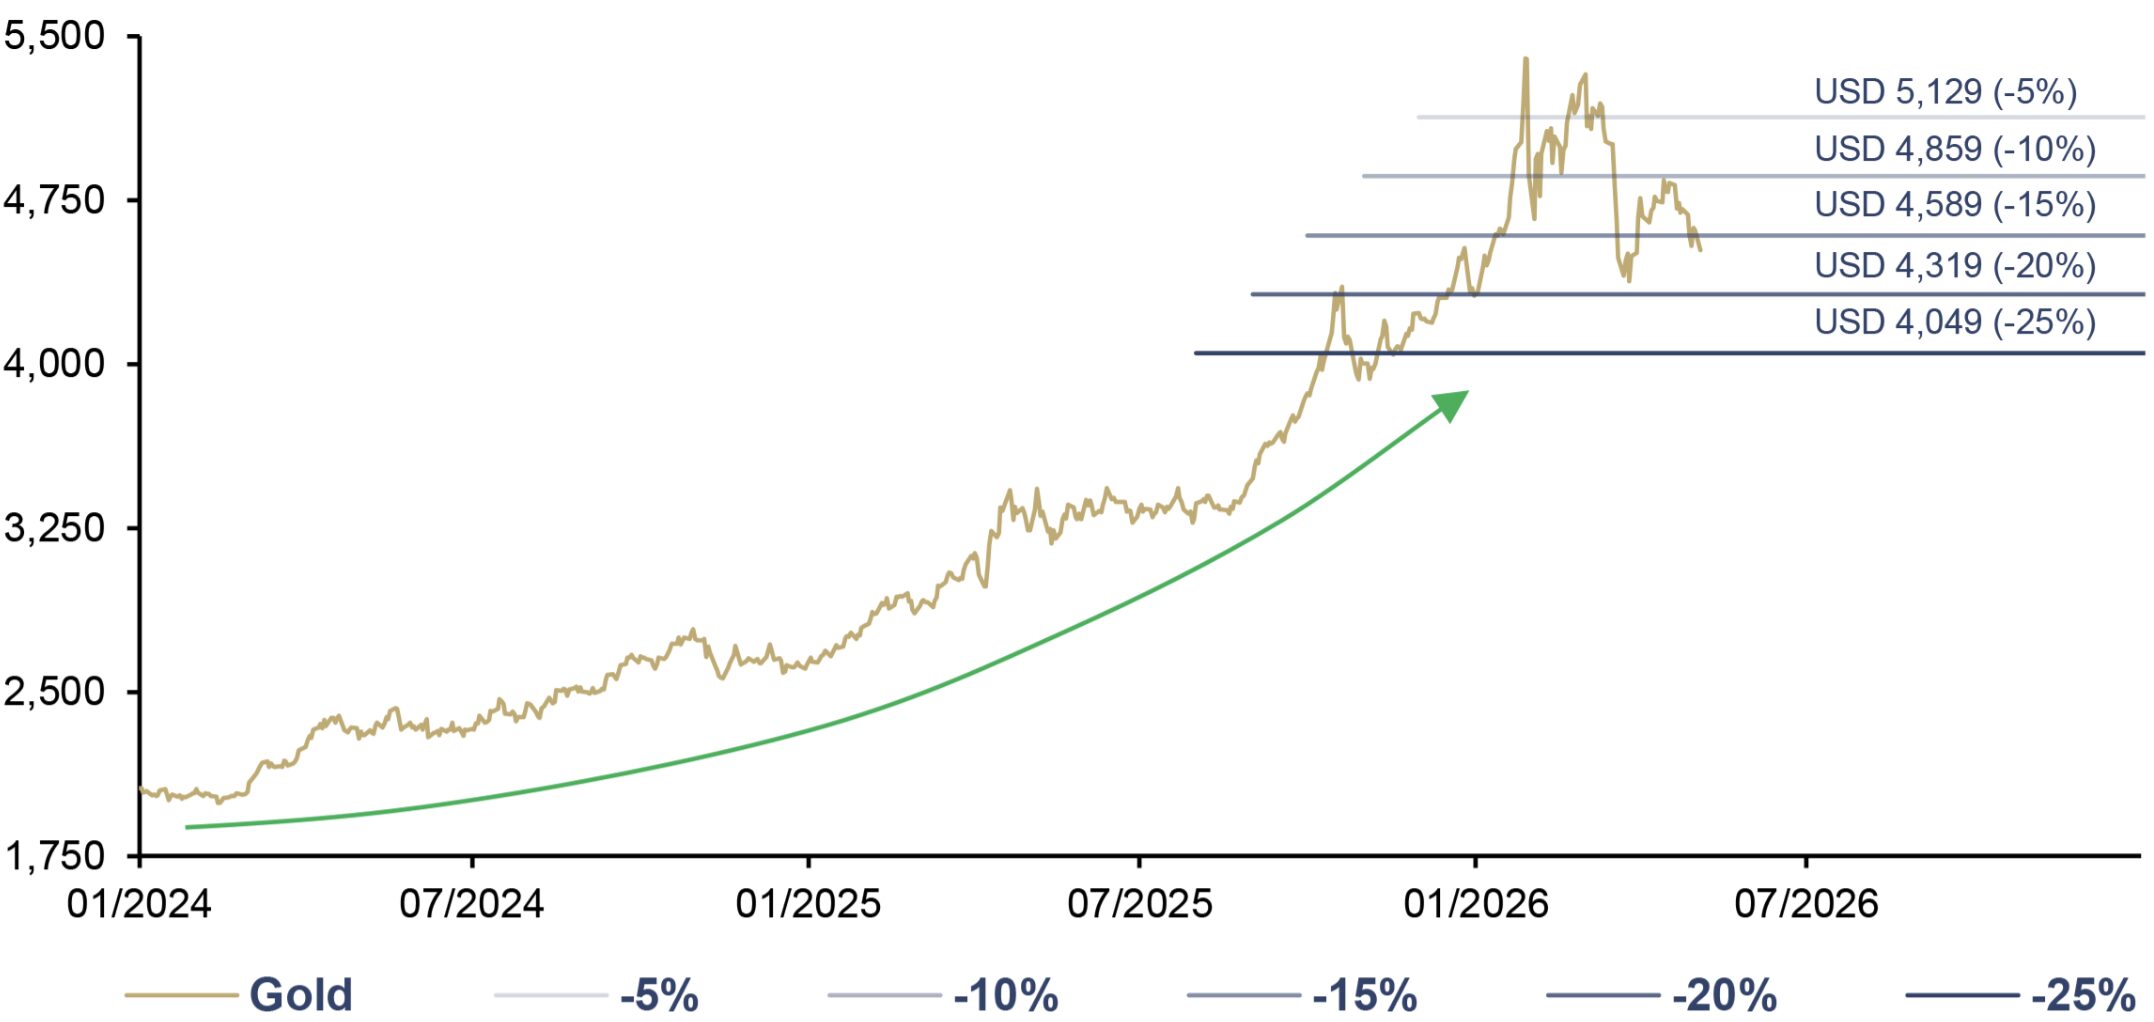
Despite our structurally bullish base scenario, downside risks also exist. Gold is not a one-way street – corrections, consolidations, and even prolonged sideways phases are inherent to every bull market. The key risk factors can be summarized as follows:
- Restoration of monetary policy credibility: Should the politicization of the Federal Reserve fail and Kevin Warsh credibly position himself as an inflation hawk, the US dollar debasement trade would lose momentum.
- Central bank demand: A sustained decline in central bank demand – which has been structurally elevated since the outbreak of the war in Ukraine – would remove a key pillar of demand.
- Geopolitical easing: A ceasefire in Ukraine, stabilization in the Middle East, and de-escalation with China would erode the risk premium.
- Economic outperformance: Robust US expansion driven by an AI-fueled productivity surge could redirect capital back into risk assets.
- Liquidity paradox: In a deleveraging event, gold becomes a source of funding for margin calls – as was briefly observed in the fall of 2008 and in March 2020.
How do we assess these risks? Viewed individually, most are manageable. The decisive factor is whether multiple bearish catalysts trigger simultaneously. Such a scenario, however, requires a degree of political coherence that currently seems rather unlikely, for the structural forces behind de-dollarization and monetary disorder are the product of decades of accumulated imbalances. Neither a personnel decision at the top of the Federal Reserve nor a handshake in Geneva or Islamabad will reverse them. Our base scenario remains constructive, even if setbacks cannot be ruled out. To quote Harry Browne: “Whatever preparation you make, don’t assume you know the future.”
A temporary sideways phase is entirely plausible as part of a price consolidation and would, in fact, be healthy for the bull market. This would in no way jeopardize the medium- to long-term case for gold.
Gold, in USD, 01/2024–05/2026
Source: LSEG, Incrementum AG
Quo Vadis, Aurum?
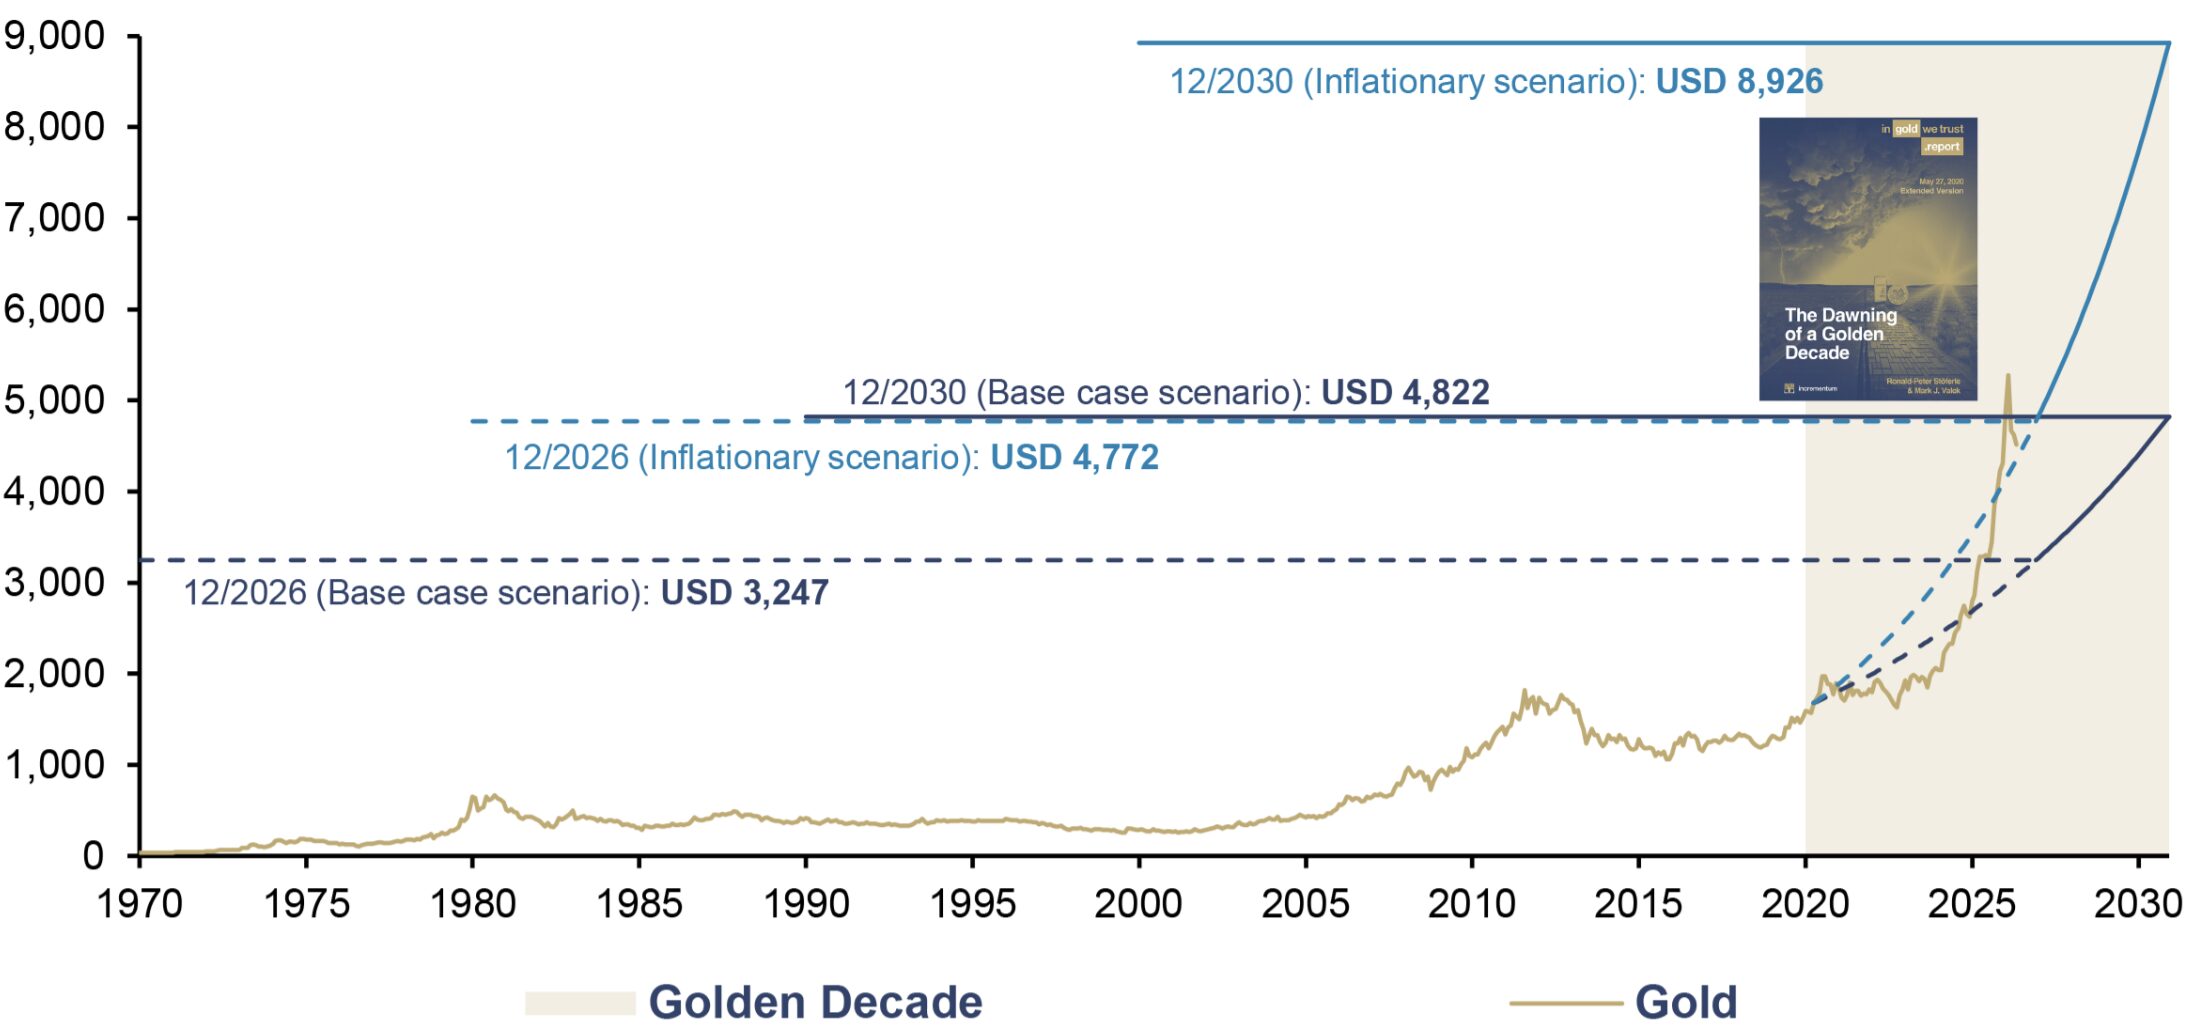
Having considered these points, let us now return to the hard reality of the investment world. In our In Gold We Trust report 2020, “The Dawning of a Golden Decade,” we presented our proprietary Incrementum gold price model. Within this model, we used historical data to model various scenarios regarding money supply growth and the implied gold coverage ratio, weighting them by their probabilities of occurrence.
The base-case target of USD 4,800 for the end of 2030 was reached five years ahead of schedule. Should a second wave of inflation follow in the West, this decade is likely to go down in history as an inflationary decade. Against the backdrop of the tensions described, we consider such a scenario entirely plausible and therefore continue to focus on the inflationary alternative scenario with a decade-end target of USD 8,900.
Intermediate Status of the Gold Price Projection until 2030: Gold, in USD, 01/1970–12/2030
Source: LSEG, Incrementum AG
As of April 30, gold is trading only slightly below the calculated interim target of USD 4,772 for the end of 2026. To achieve the inflationary scenario by 2030, an annualized rate of 14.5% would be necessary – ambitious, but by no means unrealistic. After all, since the start of the “golden decade,” the realized CAGR has been 19.7%, already exceeding the required pace.
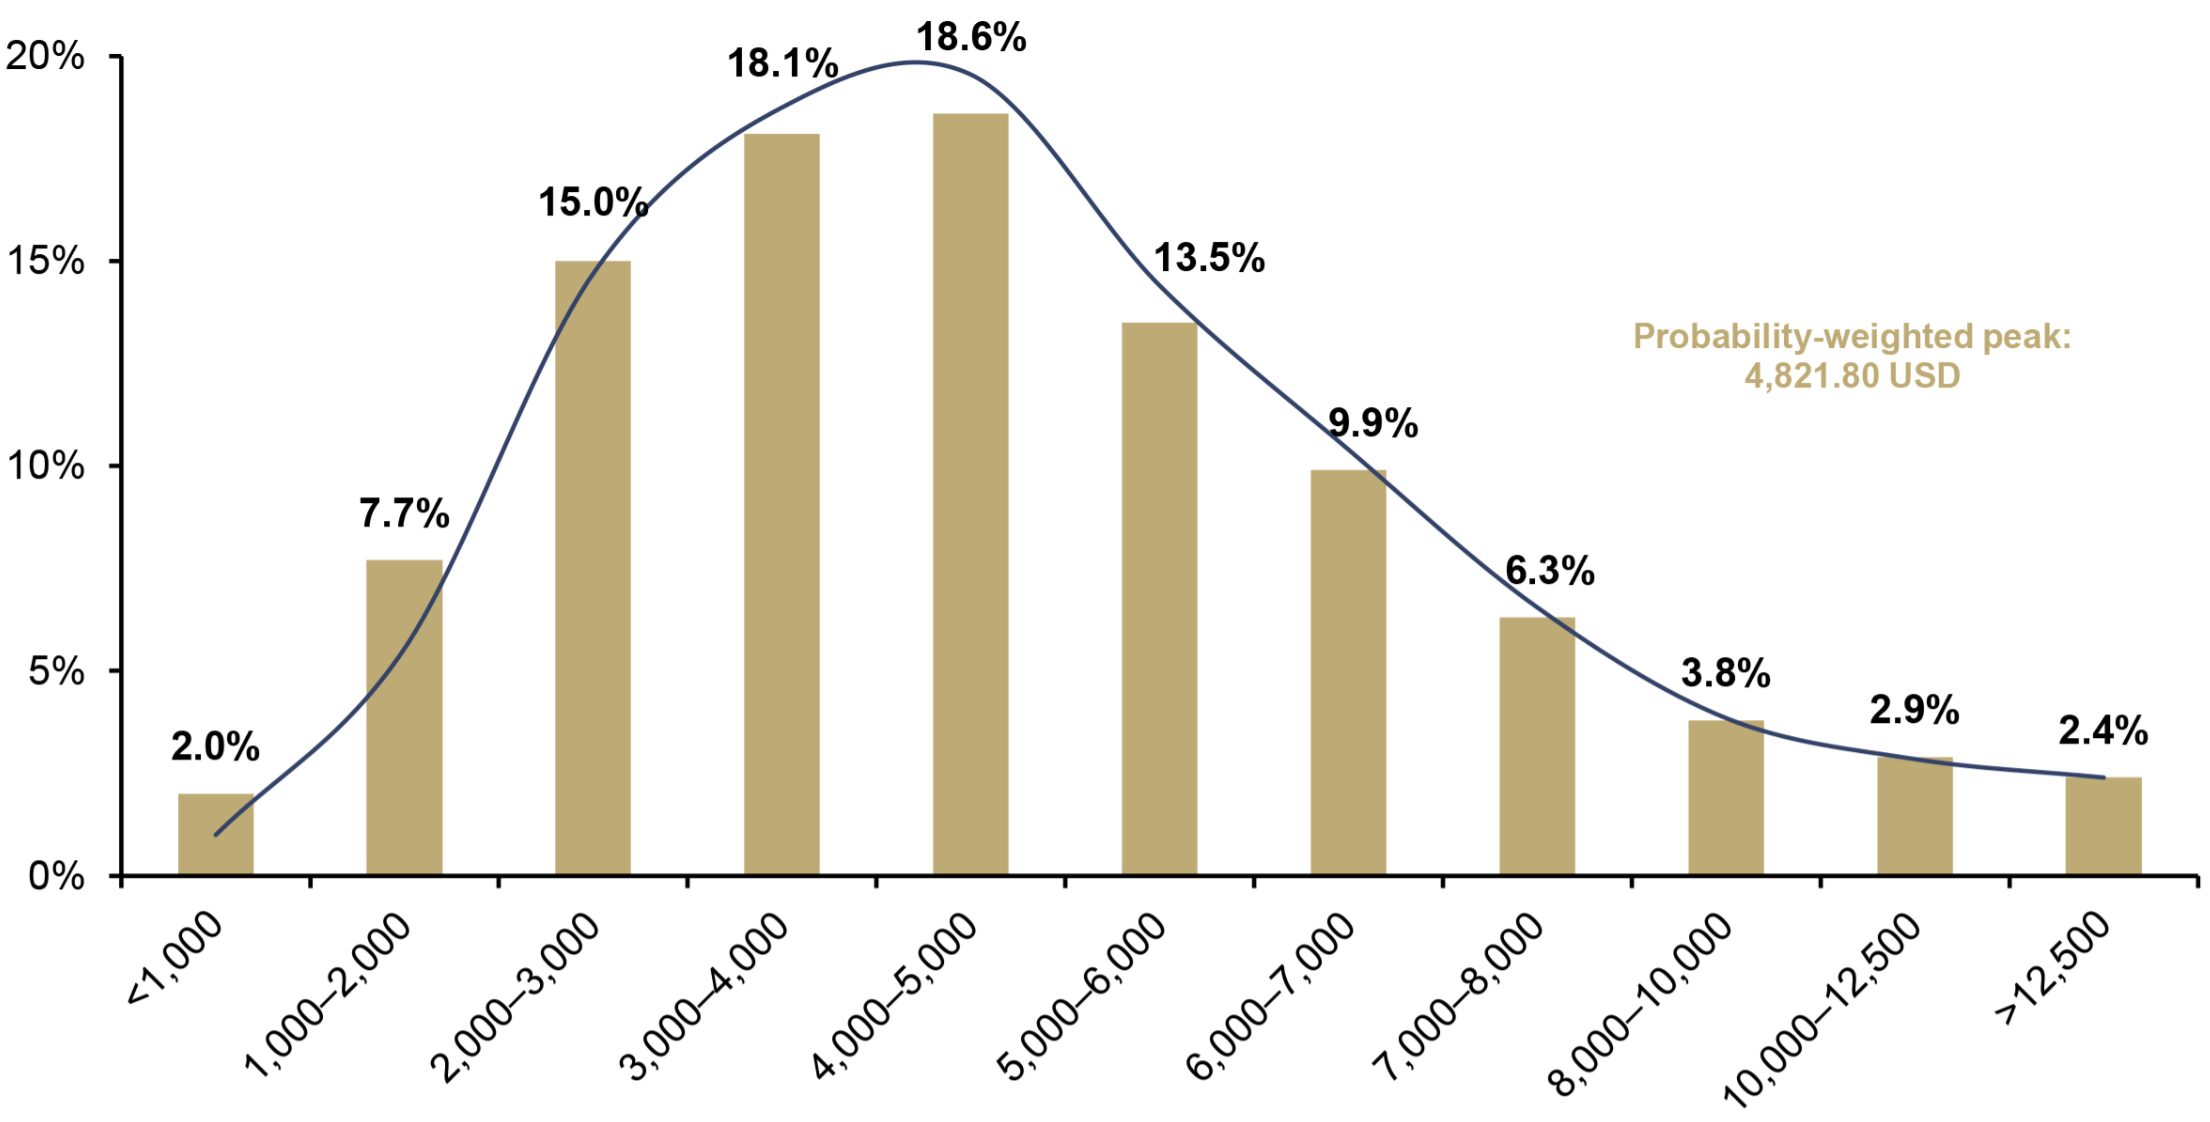
If the previously outlined remonetization of gold does indeed proceed, significantly higher price levels are also conceivable. Our model has always accounted for this possibility – through a deliberately right-skewed probability distribution. While the majority of scenarios fall between USD 3,000 and USD 6,000, the right tail of the distribution extends far: With a cumulative 25.3% probability of price levels above USD 7,000, the upside risk is quantitatively much more significant than the downside risk. The reason is quite simple: A fiat currency can tend toward zero, whereas a tangible asset like gold has no arithmetical upper limit. Extreme upward movements were therefore already an integral part of our model in 2020 – the past decade provides the empirical data to support this.
Approximated Gold Price in 2030, by Probability Distribution, in USD
Source: LSEG, Incrementum AG
The remonetization of gold as a catalyst for Bitcoin?
Having discussed the future of gold at length, the following question arises: What role could Bitcoin play in an emerging new world order? The advantages of a decentralized, state-independent, and cross-border transferable currency are obvious. With the introduction of a strategic Bitcoin reserve, the US has also entered the race for digital gold.
A progressive remonetization of gold could prove to be a catalyst for Bitcoin. For if the price of gold rises significantly in the wake of growing monetary demand, the relative attractiveness of a digitally scarce, easily transferable, and still significantly smaller sister asset also increases. What returns to gold in terms of monetary recognition can thus also boost Bitcoin’s value. Sooner or later, it seems plausible that the first central banks will build up at least small strategic Bitcoin positions alongside gold.
A productive competition could emerge between the two assets: In the event of very sharp price increases in gold, additional inflows might be directed toward Bitcoin because its relative upside potential appears greater. Conversely, during phases of excessive Bitcoin euphoria, some capital is likely to rotate into gold to secure stability and liquidity. Gold and Bitcoin are therefore not only rivals but also mutual reference points within the same monetary asset class.
Market Capitalization of Bitcoin and Gold (lhs), in USD trn, and Bitcoin/Gold Market Cap Ratio (rhs), 01/2013–04/2026

Source: coinmarketcap.com, World Gold Council, LSEG, Incrementum AG
The fact that gold has gained a competitor in the universe of noninflationary assets is not a disadvantage – on the contrary. More and more investors are realizing that a combined investment in both assets is superior, on a risk-adjusted basis, to investing in either asset alone. In September 2025, Cantor Fitzgerald launched the Gold Protected Bitcoin Fund – a vehicle that combines Bitcoin’s upside potential with gold-based downside protection. Since January 2026, 21Shares has listed the BOLD ETF on the London Stock Exchange. It is thus the first regulated product in the UK to combine both assets in a risk-weighted portfolio.
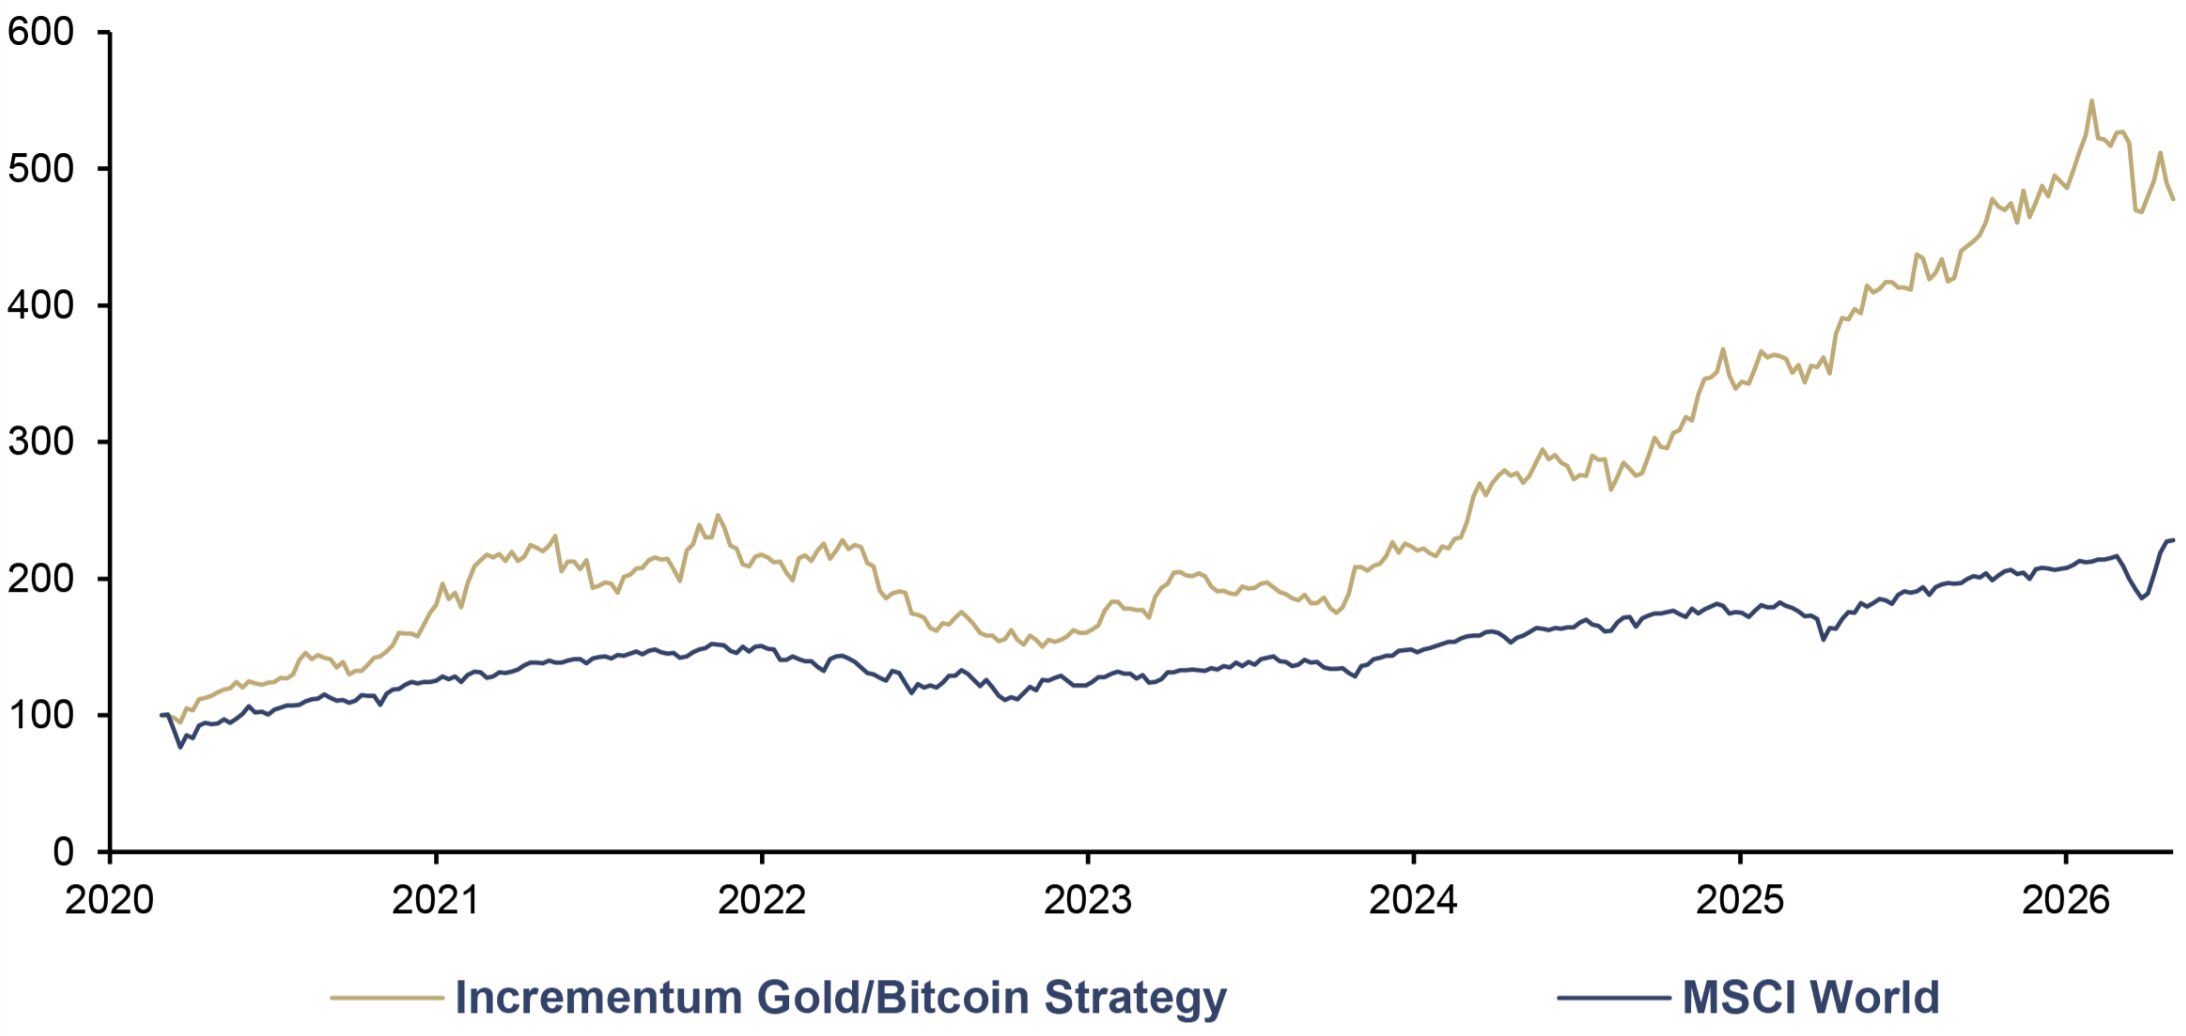
With a touch of pride, we should mention that we were likely among the very first to translate a combined gold-Bitcoin strategy into an investable concept. For more than six years now, we have been managing our portfolio according to the credo “Gold and Bitcoin – stronger together”.[3]
Incrementum Gold/Bitcoin Strategy, and MSCI World, in USD, 100 = 02/2014, 02/2020–05/2026
Source: LSEG, Incrementum AG
How Brightly Will Performance Gold Shine?
Gold paved the way; silver and mining stocks followed. Now the commodity catch-up we predicted in the In Gold We Trust report 2025, “The Big Long” is beginning.
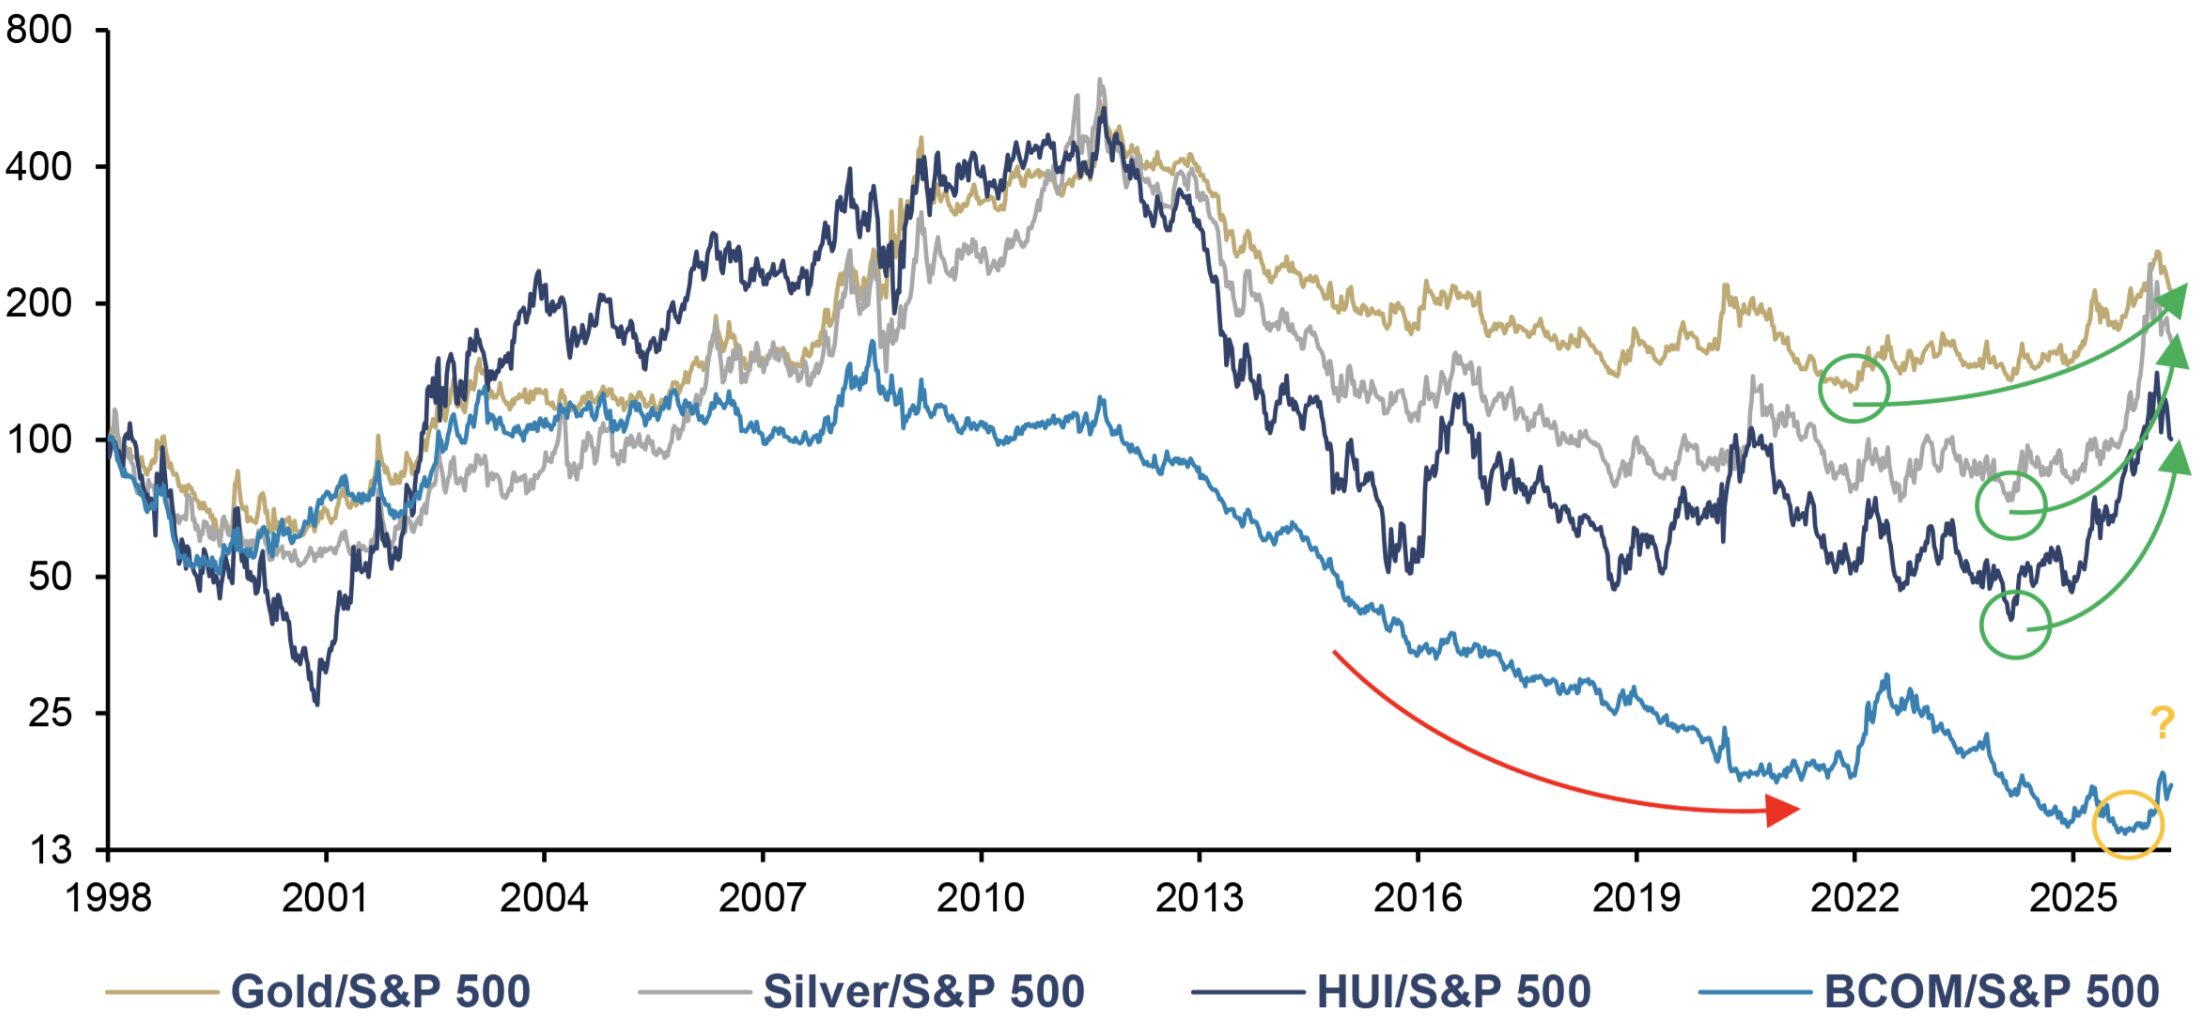
The chart below shows gold, silver, mining stocks (HUI), and the commodity index (BCOM), each relative to the S&P 500. After nearly fifteen years of underperformance – marked by the red downward trend line – all four ratios now signal relative strength. Gold leads the way, with silver and mining stocks following with a lag; and even the BCOM is breaking away from the bottom. A sustained breakout in these ratios would be more than just a technical signal: It would mark a fundamental shift in capital flows, away from US stocks and toward an asset class that has been in the shadows for over a decade.
Gold, Silver, HUI and BCOM vs. S&P 500 (log), 100 = 01/1998, 01/1998–05/2026
Source: LSEG, Incrementum AG
Silver: The little brother grows up
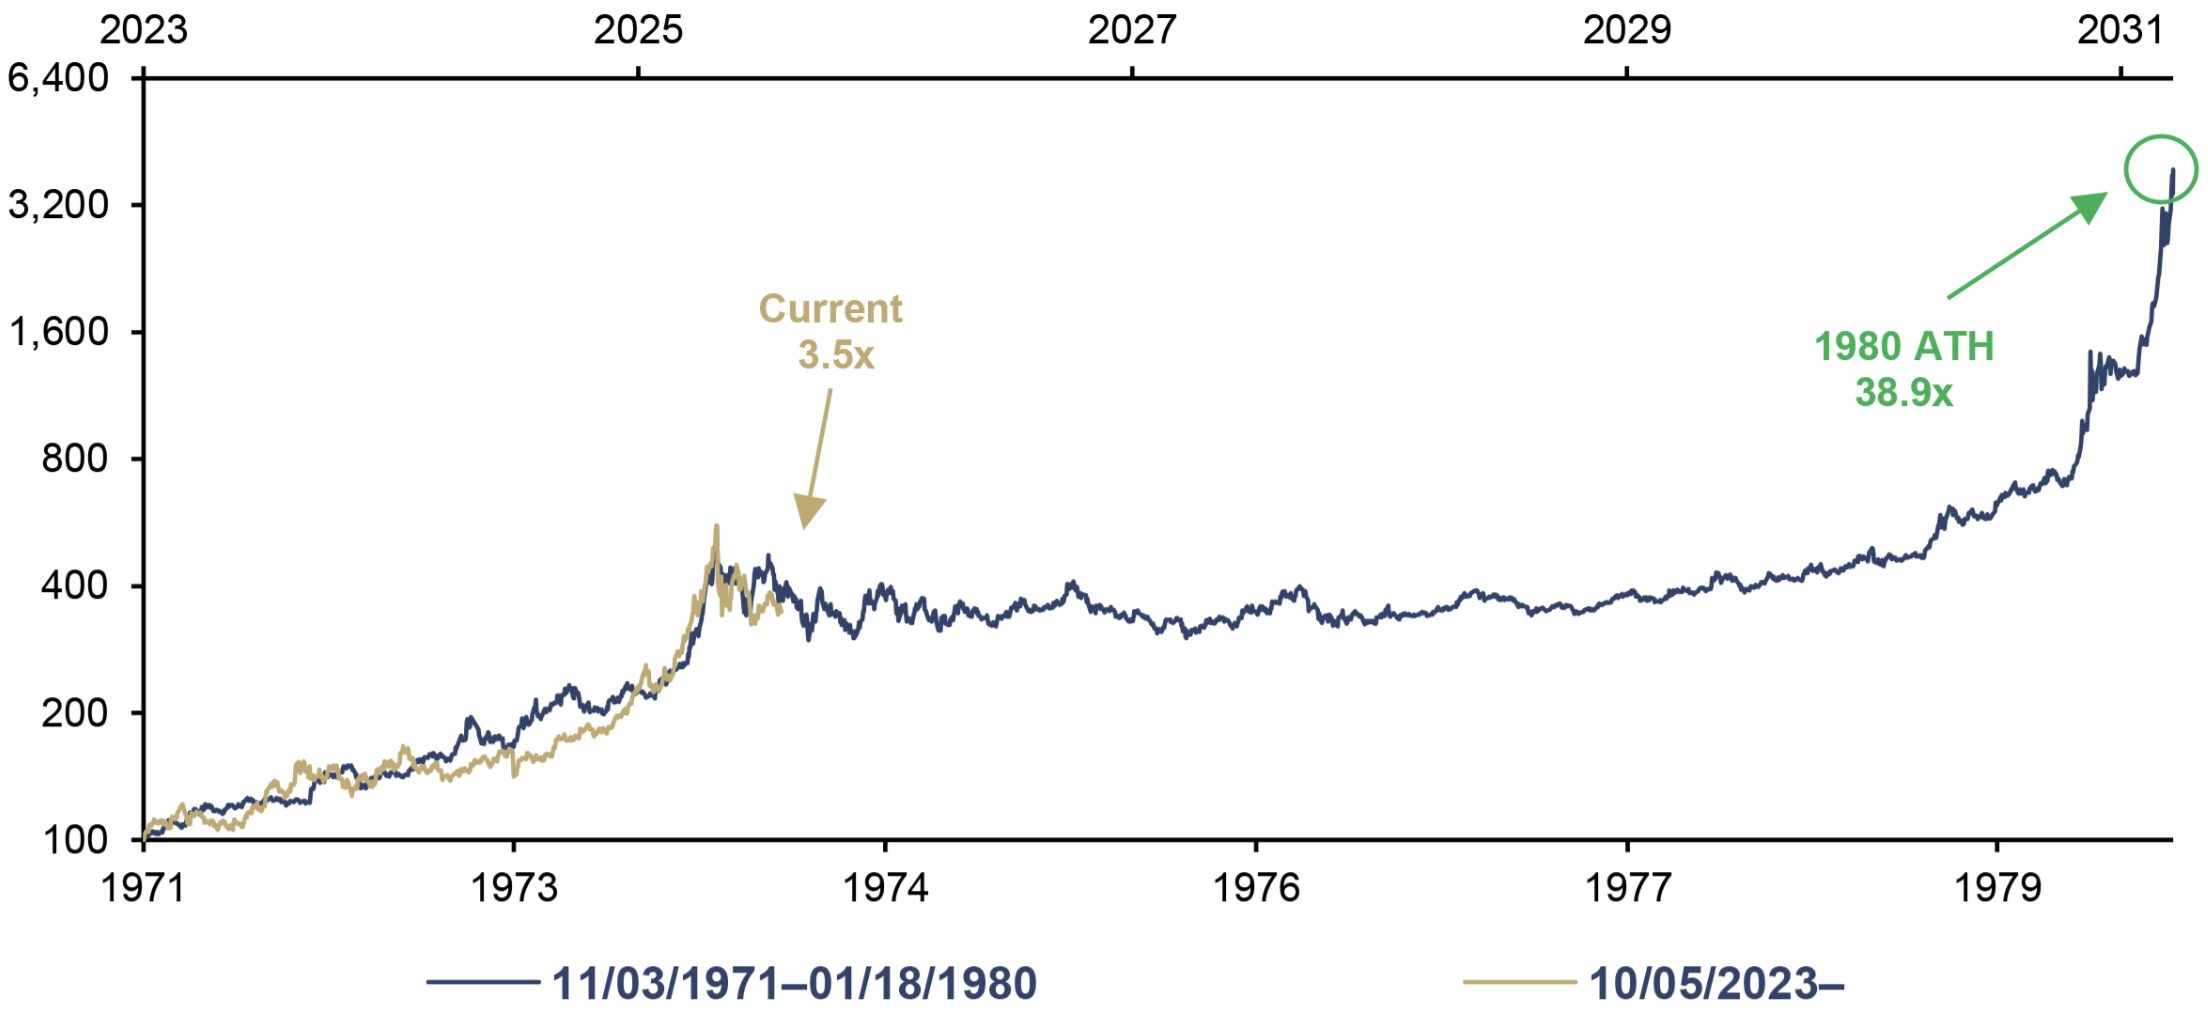
In 2025, silver delivered its strongest annual performance since 1979, with a gain of 146.8%, and broke through the USD 100 mark for the first time in January 2026. The fact that the price corrected to around USD 75 in the wake of the Iran war does nothing to change our fundamentally optimistic outlook. After all, silver has since the start of the year only been down slightly.
Silver (log), in USD, 100 = 11/03/1971, and 100 = 10/05/2023, 11/1971–05/2026
Source: FactSet, LSEG, Incrementum AG
Fundamentally, everything seems to be in place for gold’s little brother. In 2025, the silver market recorded a supply deficit for the fifth consecutive year. For 2026, the Silver Institute forecasts a deficit of 46.3moz, marking the sixth consecutive year of deficit. Cumulatively, this amounts to a deficit of 762moz, which is nearly an entire year’s worth of mine production.
More decisive than the deficit itself is its consequence: Above-ground stocks have left buffer mode. What had been dismissed for years as a theoretical construct suddenly materialized in October 2025: Lease rates exploded from 1% to over 30%, at times reaching 200% overnight. The market provided proof of an old adage: Deficits don’t matter – until they do.
Thhe structural peculiarity of the silver market exacerbates the situation: Since 74% of silver is produced as a byproduct of copper, lead/zinc, and gold mines, even record prices barely trigger any supply response. On the demand side, a structural triad is at play: The green transition, military buildup, and remonetization are all competing for the same scarce supply. Silver has been officially classified as a “critical mineral” in the US; Russia is adding the metal to its state reserve fund; and India has allowed silver to be used as collateral with a 90% loan-to-value ratio since 2025 – thereby effectively monetizing the silver hoarded in Indian households. The creeping remonetization that we have been documenting for years with gold has now taken hold of its little sister metal.
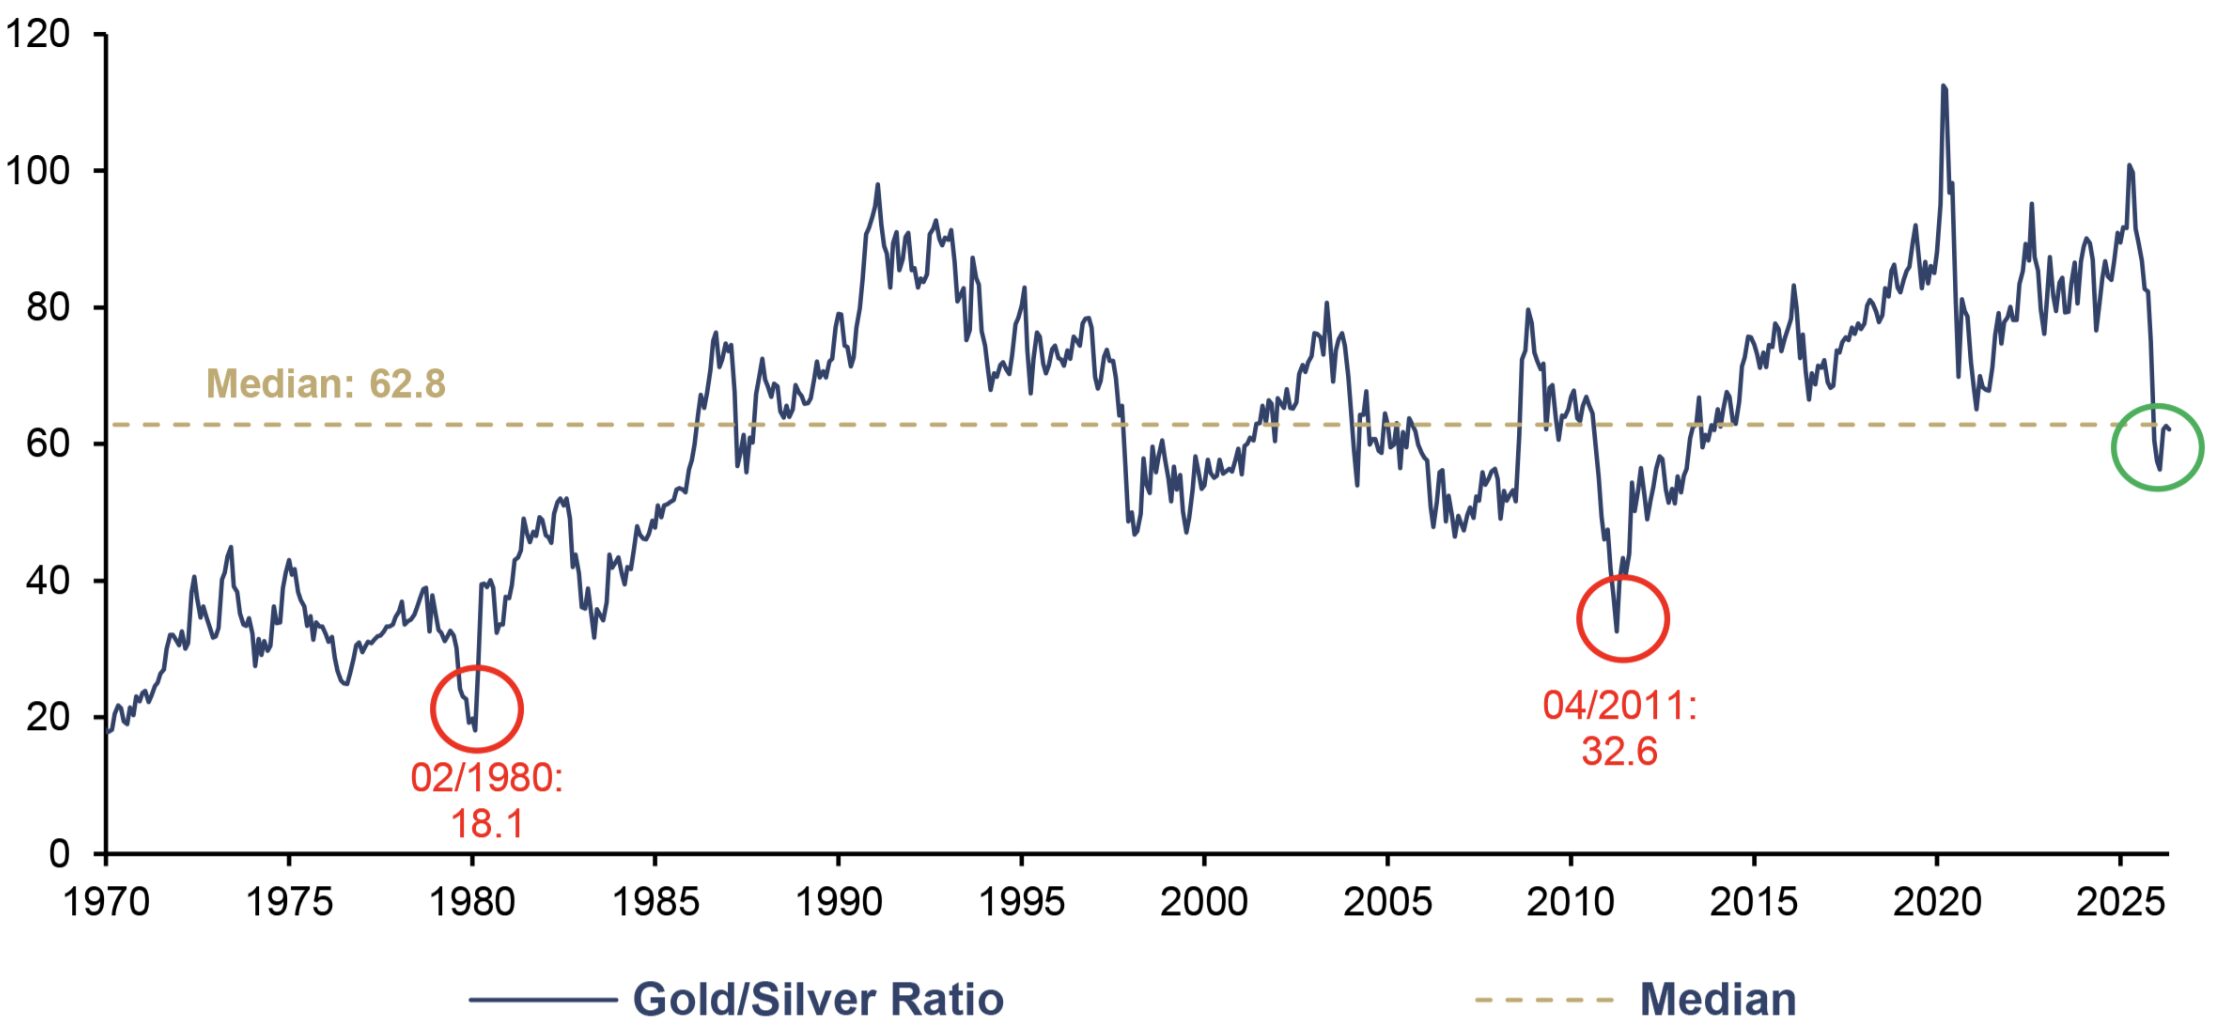
The gold-silver ratio (GSR) has already reflected this shift: From 107:1 in April 2025, it plummeted to nearly 46:1 by the end of February – the lowest level since fall 2011. With the outbreak of the Iran war, the GSR corrected sharply and has since fluctuated around 60.
The key point is this: Secular bull markets do not end at the median, but at the extreme. The median is a milestone, not a target—the history of secular silver bull markets teaches us that the ratio typically overshoots far to the downside in the final acceleration phase.[4] At the secular peaks of the silver market, the ratio stood at 18.1 (1980) and 32.6 (2011) on a monthly closing basis. Assuming the gold price remains constant, reaching these levels again would imply a silver price potential of around USD 260 and USD 150 per ounce, respectively.
Gold/Silver Ratio, 01/1970–05/2026
Source: Nick Laird, LSEG, Incrementum AG
Mining stocks: from problem child to model student
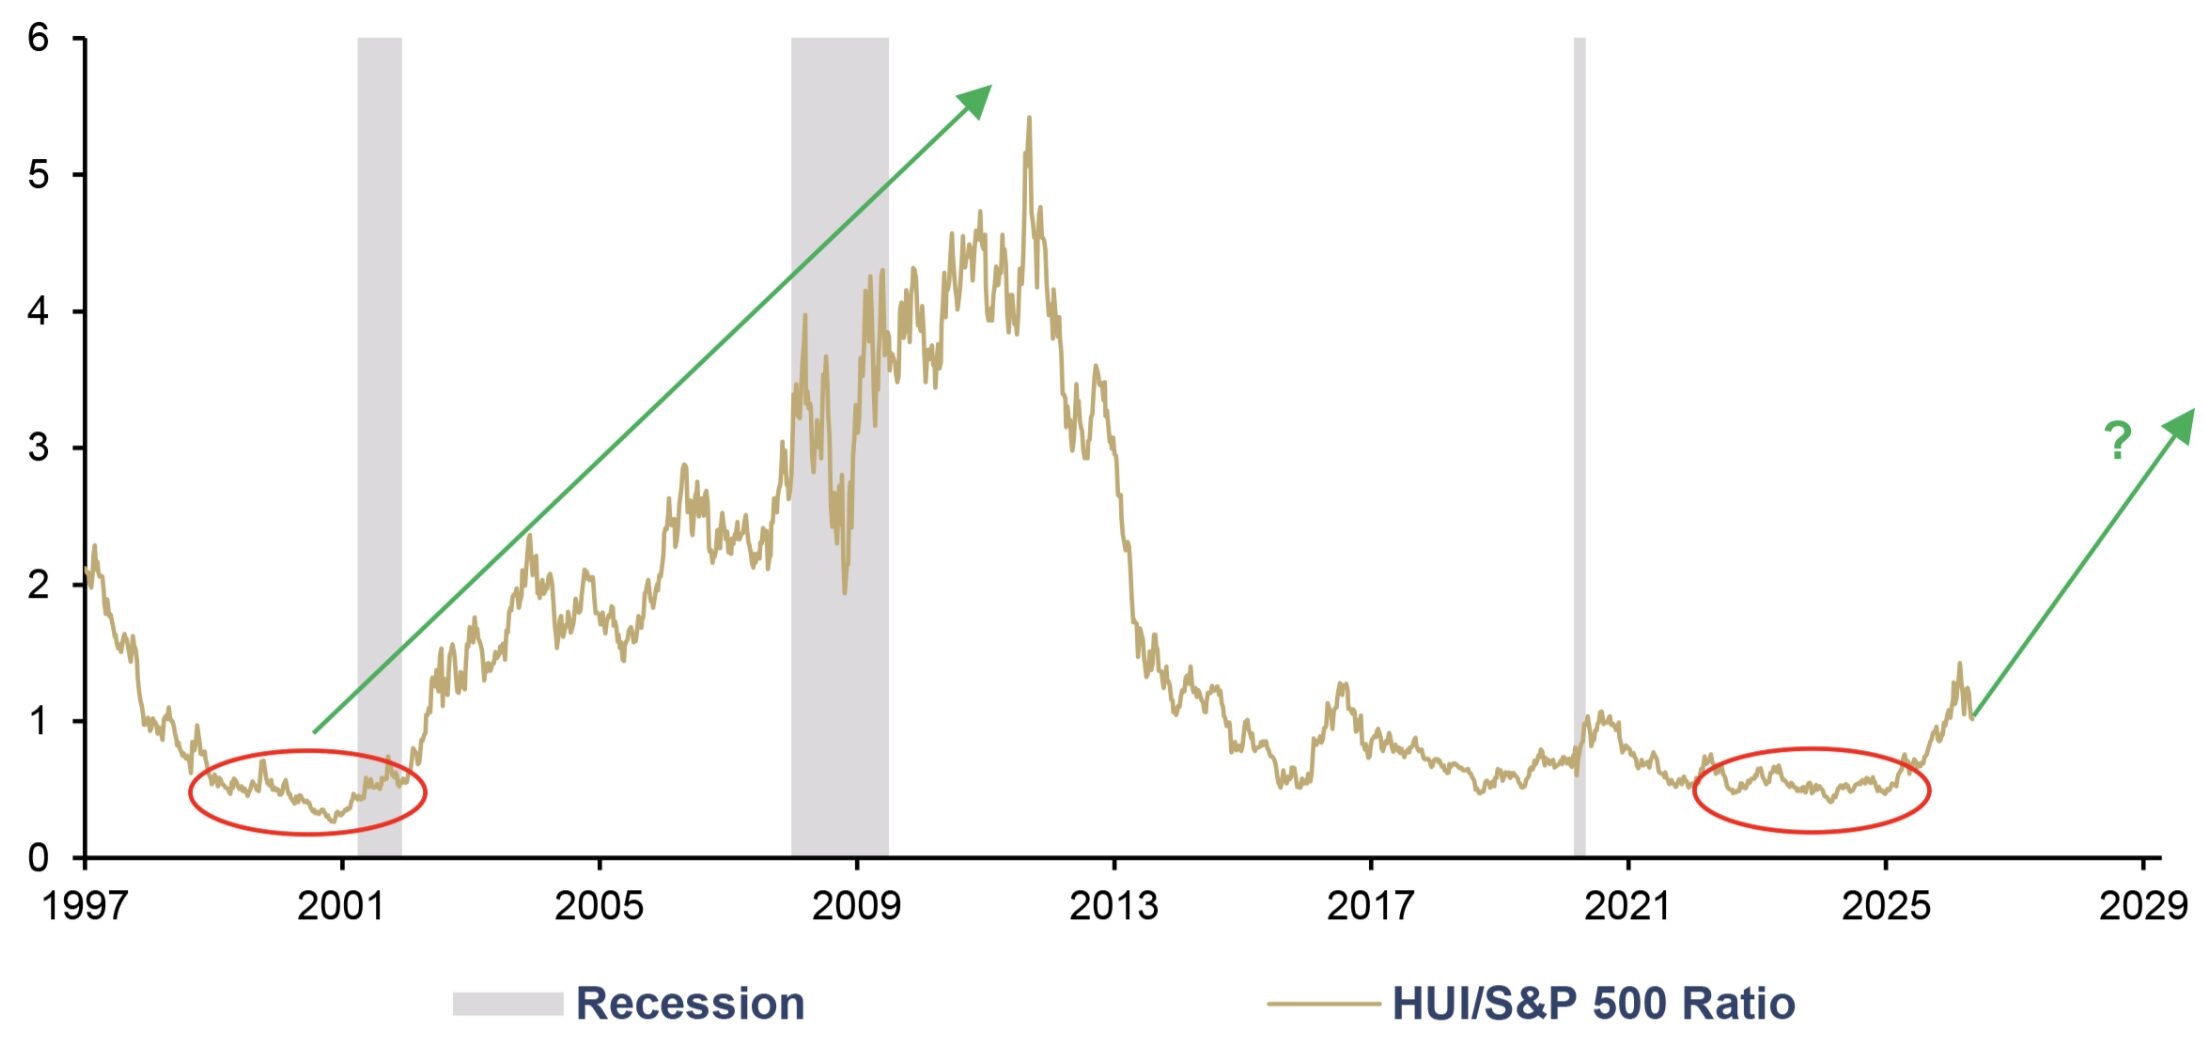
Gold mining stocks have staged a technical breakout relative to the S&P 500 over the past few months. The chart below shows the HUI/S&P 500 ratio since 1997: The lows marked in red in 2000 and 2022 bear a striking resemblance to one another – both marked the beginning of multi-year outperformance cycles for mining stocks.[5]
The classic hallmarks of an early bull market phase are unmistakable among mining stocks: widespread skepticism, structural underweighting, and defiant indifference from the mainstream. The strongest gains do not occur when everyone is invested, but precisely when the majority is still on the sidelines. As is well known, the profit lies in the purchase.
HUI/S&P 500 Ratio, 01/1997–05/2026
Source: LSEG, Incrementum AG
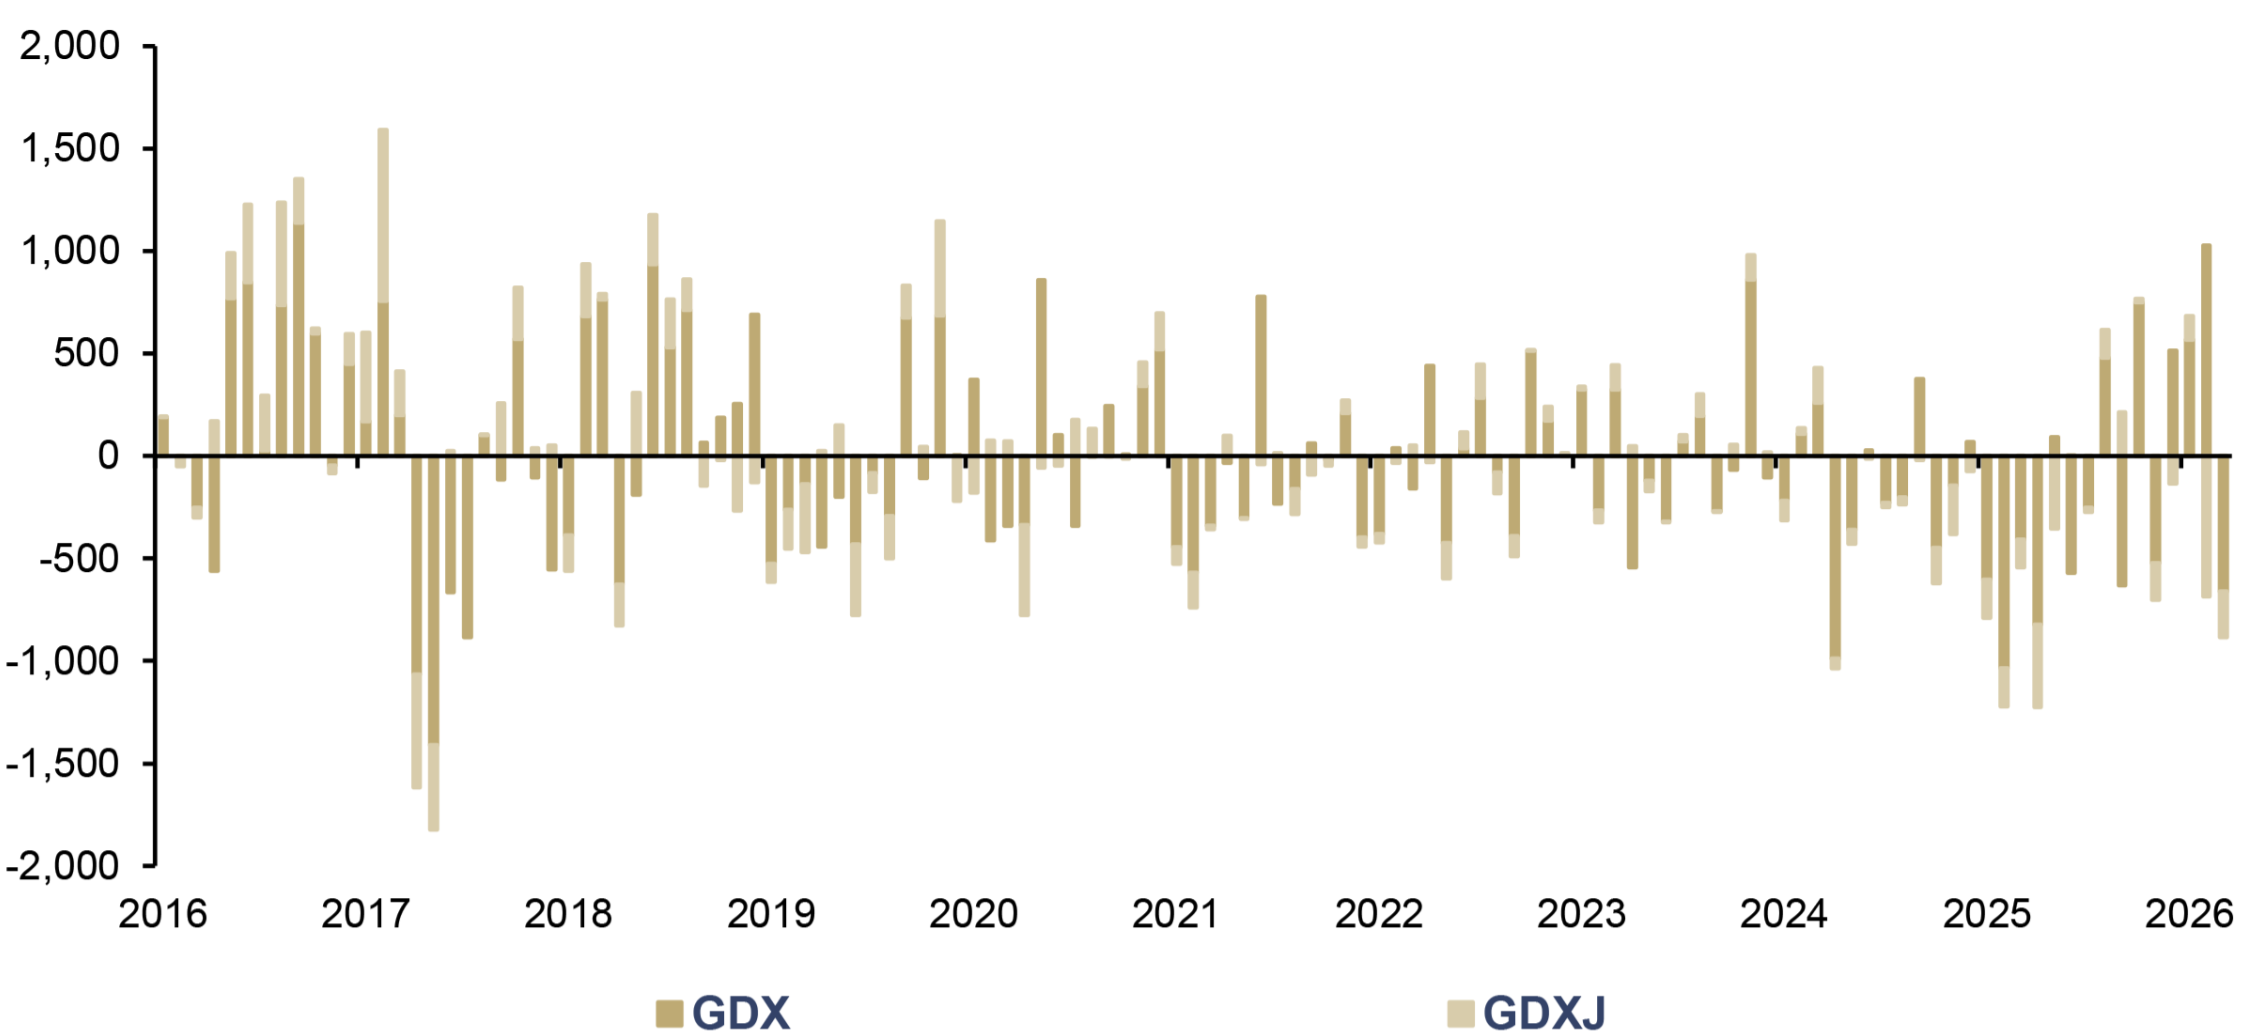
A single data point illustrates this discrepancy impressively: Despite a cumulative price gain of 167% for the GDX in 2024 and 2025, the outstanding shares of the world’s largest gold mining ETF fell by 28% over the same period. So investors not only failed to buy more – they actively sold while prices were rallying. This is not a sign of a mature bull market, but rather the opposite: a sector delivering record returns yet ignored by the broader investor community. By comparison, during the 2010–2013 bull market, GDX shares rose by around 400%.
GDX and GDXJ Fund Flows, in USD mn, 01/2016–03/2026
Source: FactSet, Incrementum AG
Even in the first four months of 2026, mining stocks lagged behind their historical leverage despite respectable performance. The often-cited 3:1 leverage relative to the gold price was not even close to being realized – or to put it positively: The catch-up potential of mining stocks remains substantial.
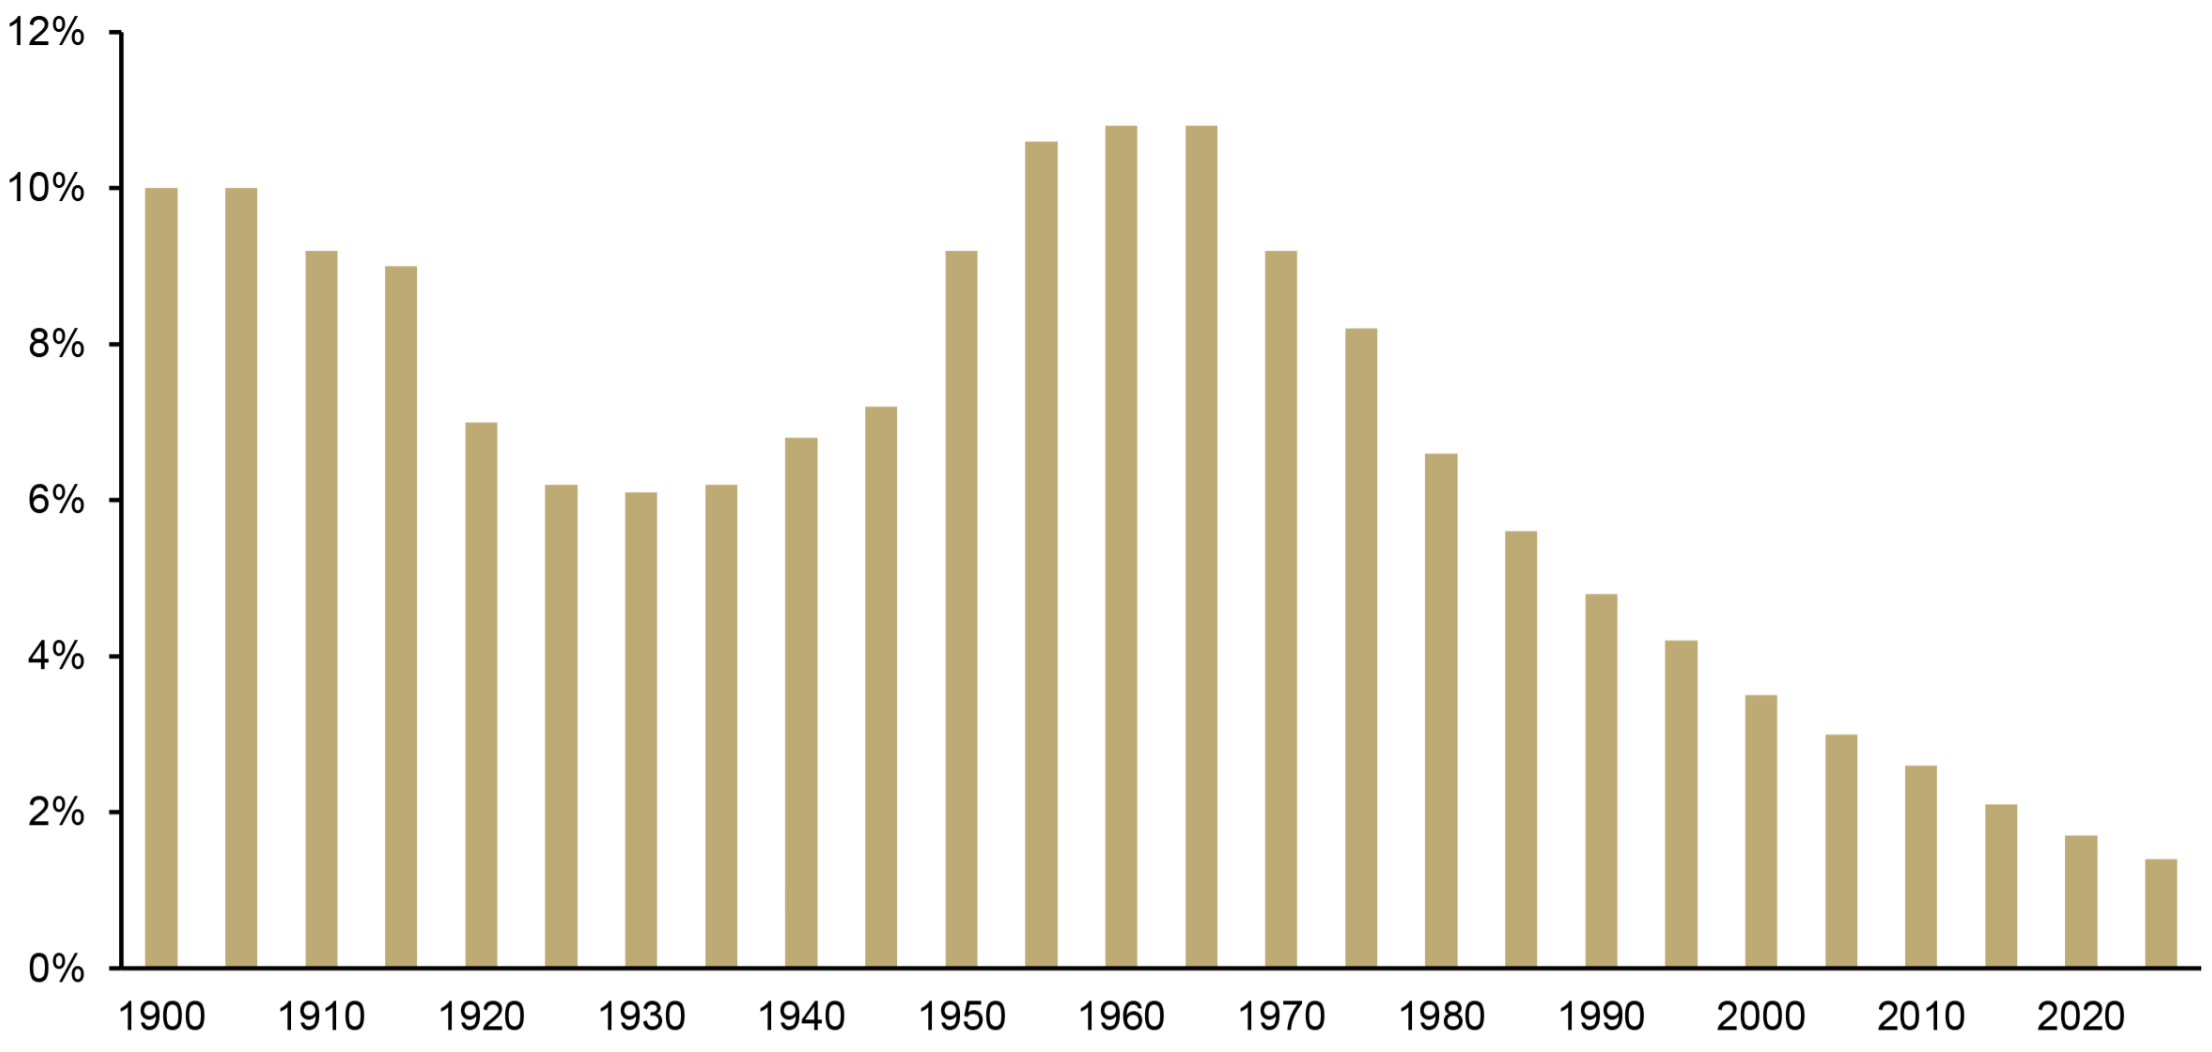
A look at the mining industry’s share of global stock market capitalization confirms its decline in importance: While its weight was still around 10% at the beginning of the 20th century and reached its peak of about 11% in the 1950s and 1960s, it stands at just 1% today – the lowest level since 1900. Marginalization is not too strong a word.
Share of Mining Industry, as a % of Global Equity Market Capitalization, 1900–2025
Source: Crescat Capital LLC, Tavi Costa, Incrementum AG
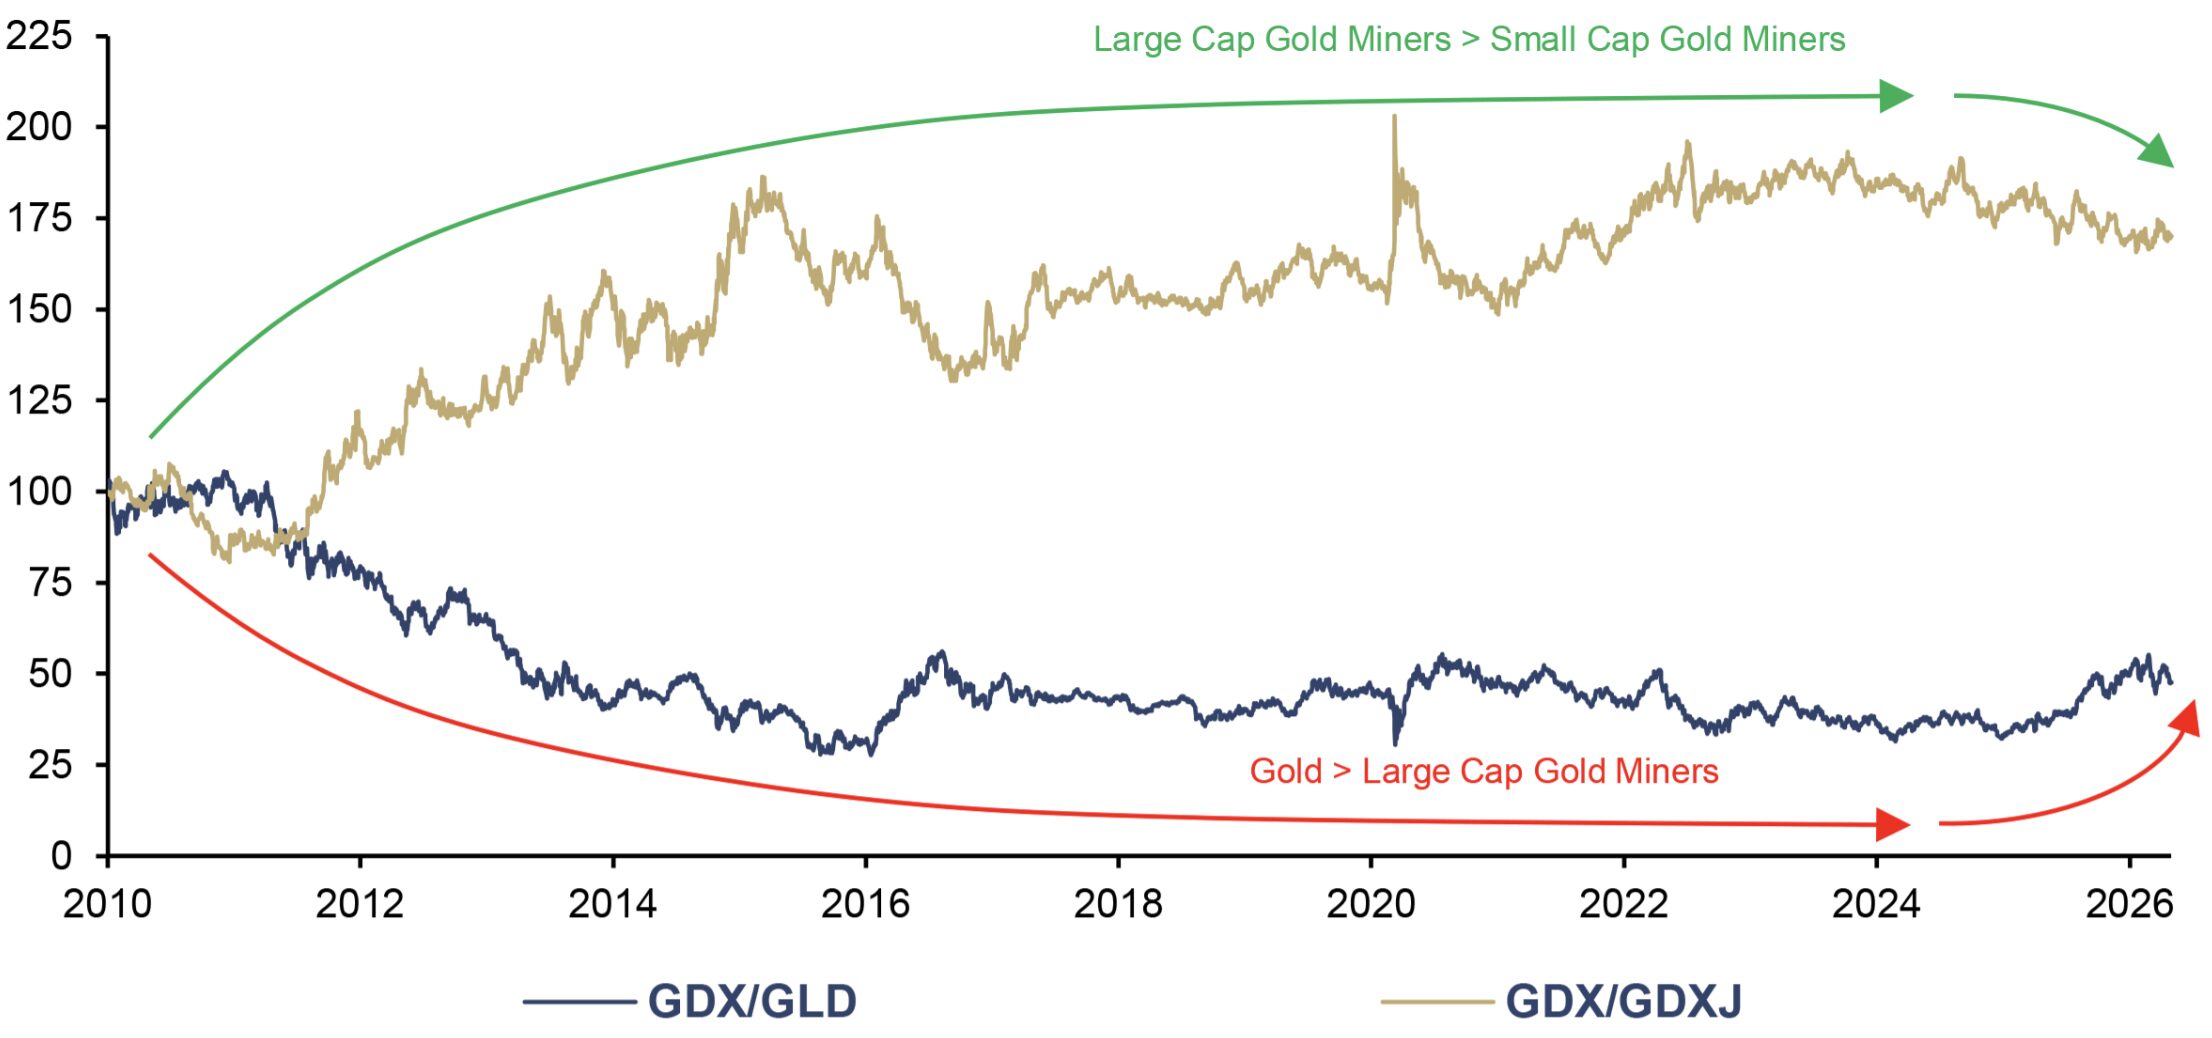
Within the gold sector, there is also a striking divergence between large and small caps – primarily a reflection of cautious risk appetite. Should the upward trend in the gold price draw greater attention to the valuation and performance potential in the mining sector, this could usher in a new phase of relative strength as part of a risk-on move – especially for small and mid caps. The valuation gap that has existed since 2011 could close rapidly in such a scenario.
GDX/GLD and GDX/GDXJ, 100 = 01/2010, 01/2010–05/2026
Source: LSEG, Incrementum AG
Commodities: back to the future of hard assets
Gold has led the way – now the commodities catch-up process follows. The latest US National Security Strategy makes it unmistakably clear: The era of “boundless globalism” is over. Free trade has been strategically downgraded, US power defined in transactional terms, and access to critical commodities explicitly treated as a matter of national security. Commodities are no longer mere production inputs; they are becoming a strategic insurance policy in a world of bilateral deals and newly formed alliances.
Yet the geopolitical realignment is merely the surface of a deeper shift. The world is undergoing a macroeconomic regime change. While demand-side constraints dominated in past decades – growth driven by consumer spending and credit expansion – supply-side constraints are now taking the lead. It is no longer “wanting” but “having” that determines growth. The economy is returning from the cloud to the ground of commodity reality.
For the commodities market, this dual shift means we are convinced that the bull market is on track. Two factors support this view. First, structural underinvestment: After a decade of radical capex cuts – driven by low prices, shareholder pressure, ESG divestment, and Covid – the project pipeline is historically thin, while declining ore grades further increase capital intensity. Second, secular demand drivers: electrification, the AI-driven hyperscaler boom, and geopolitical fragmentation that is making resource nationalism and friend-shoring the new normal.
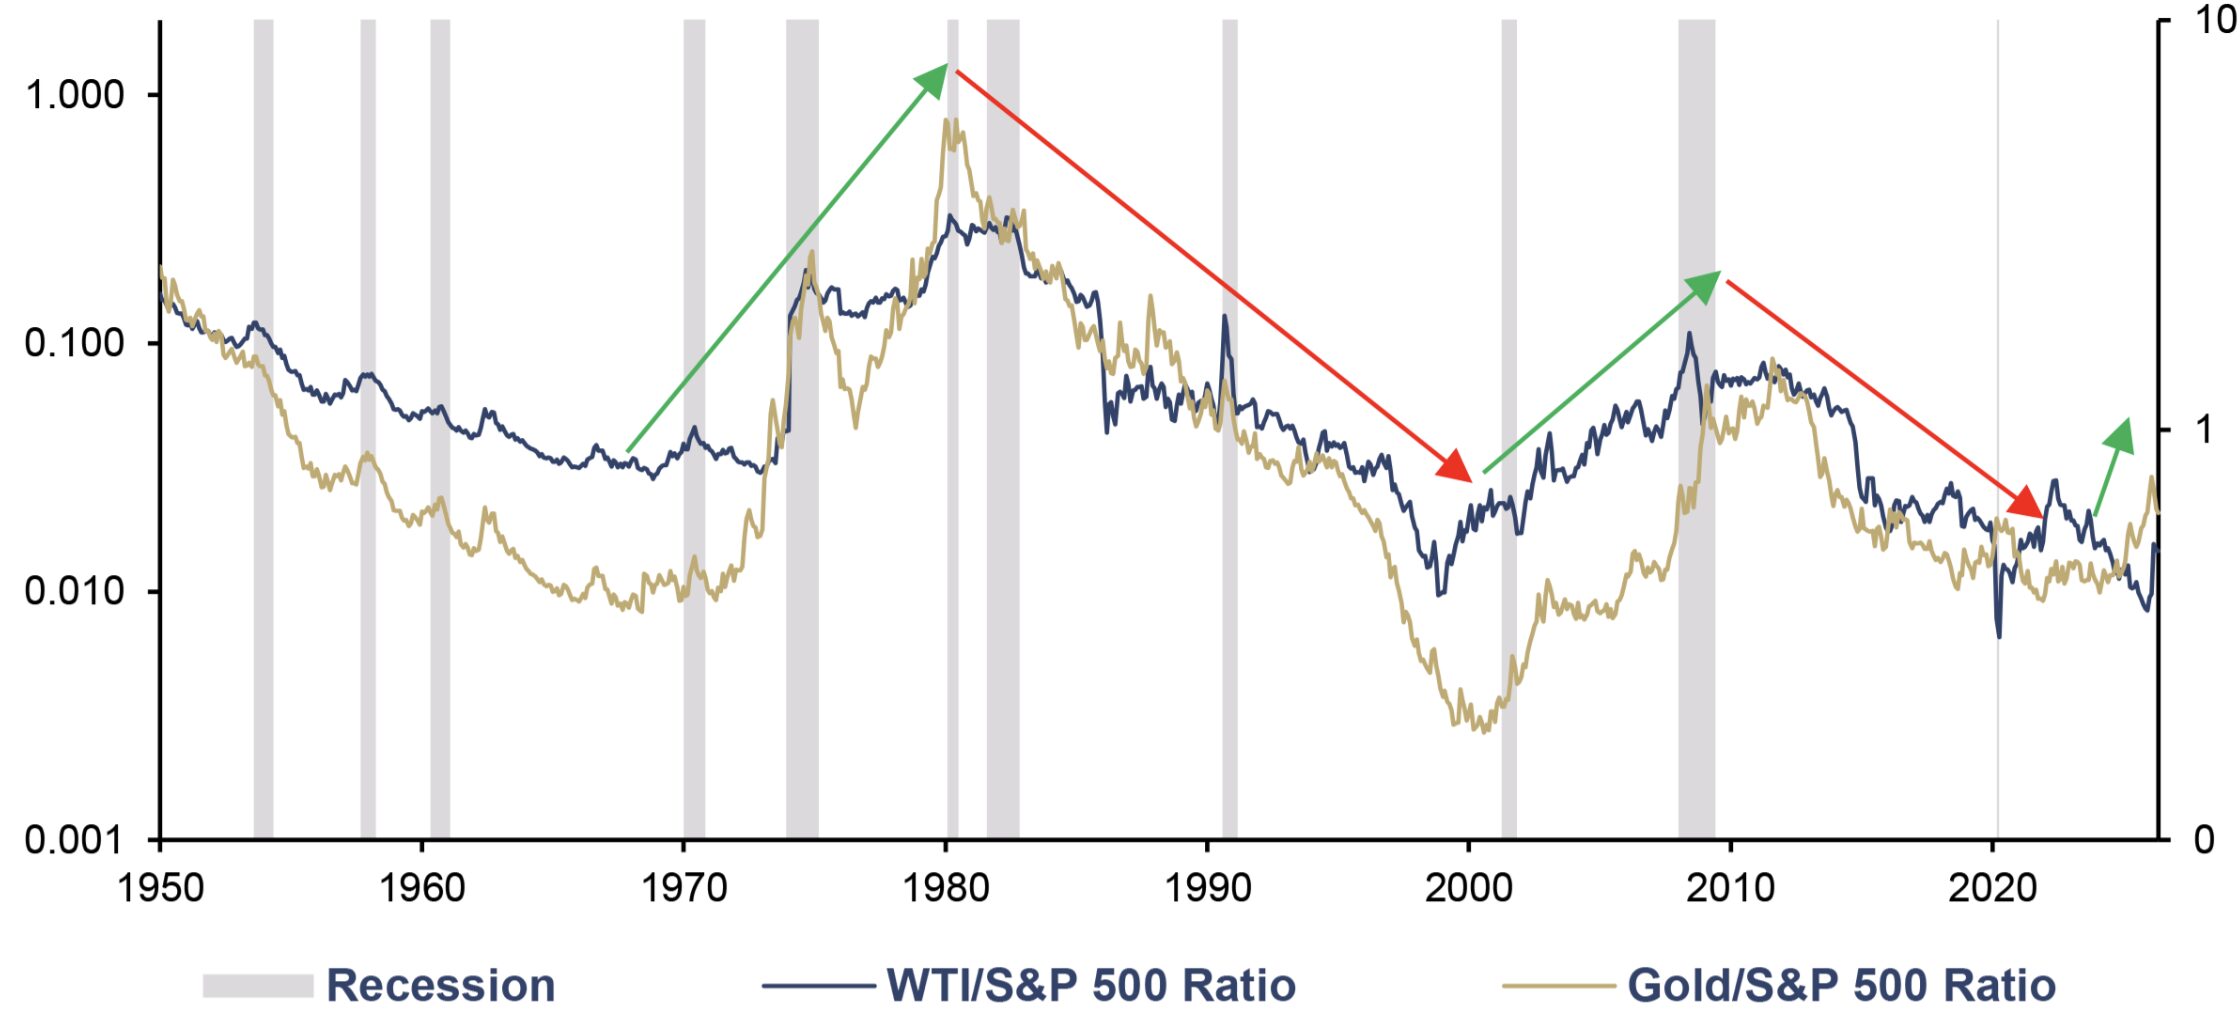
The AI revolution illustrates the paradox with almost poetic irony. Its dynamics are reminiscent of the 19th-century railroad boom: Capital flows into transformative infrastructure, many companies go under in the wake of creative destruction – yet the tracks remain in place. Data centers, semiconductors, and energy infrastructure are ultimately dependent on geological realities. The valuation anomaly has reached historic proportions: Both the WTI/S&P 500 and the gold/S&P 500 ratios are trading at historically low levels. Commodities are as cheap relative to stocks as they were last around the turn of the millennium.
WTI/S&P 500 Ratio (lhs, log), and Gold/S&P 500 Ratio (rhs, log), 01/1950–05/2026
Source: Nick Laird, LSEG, Incrementum AG
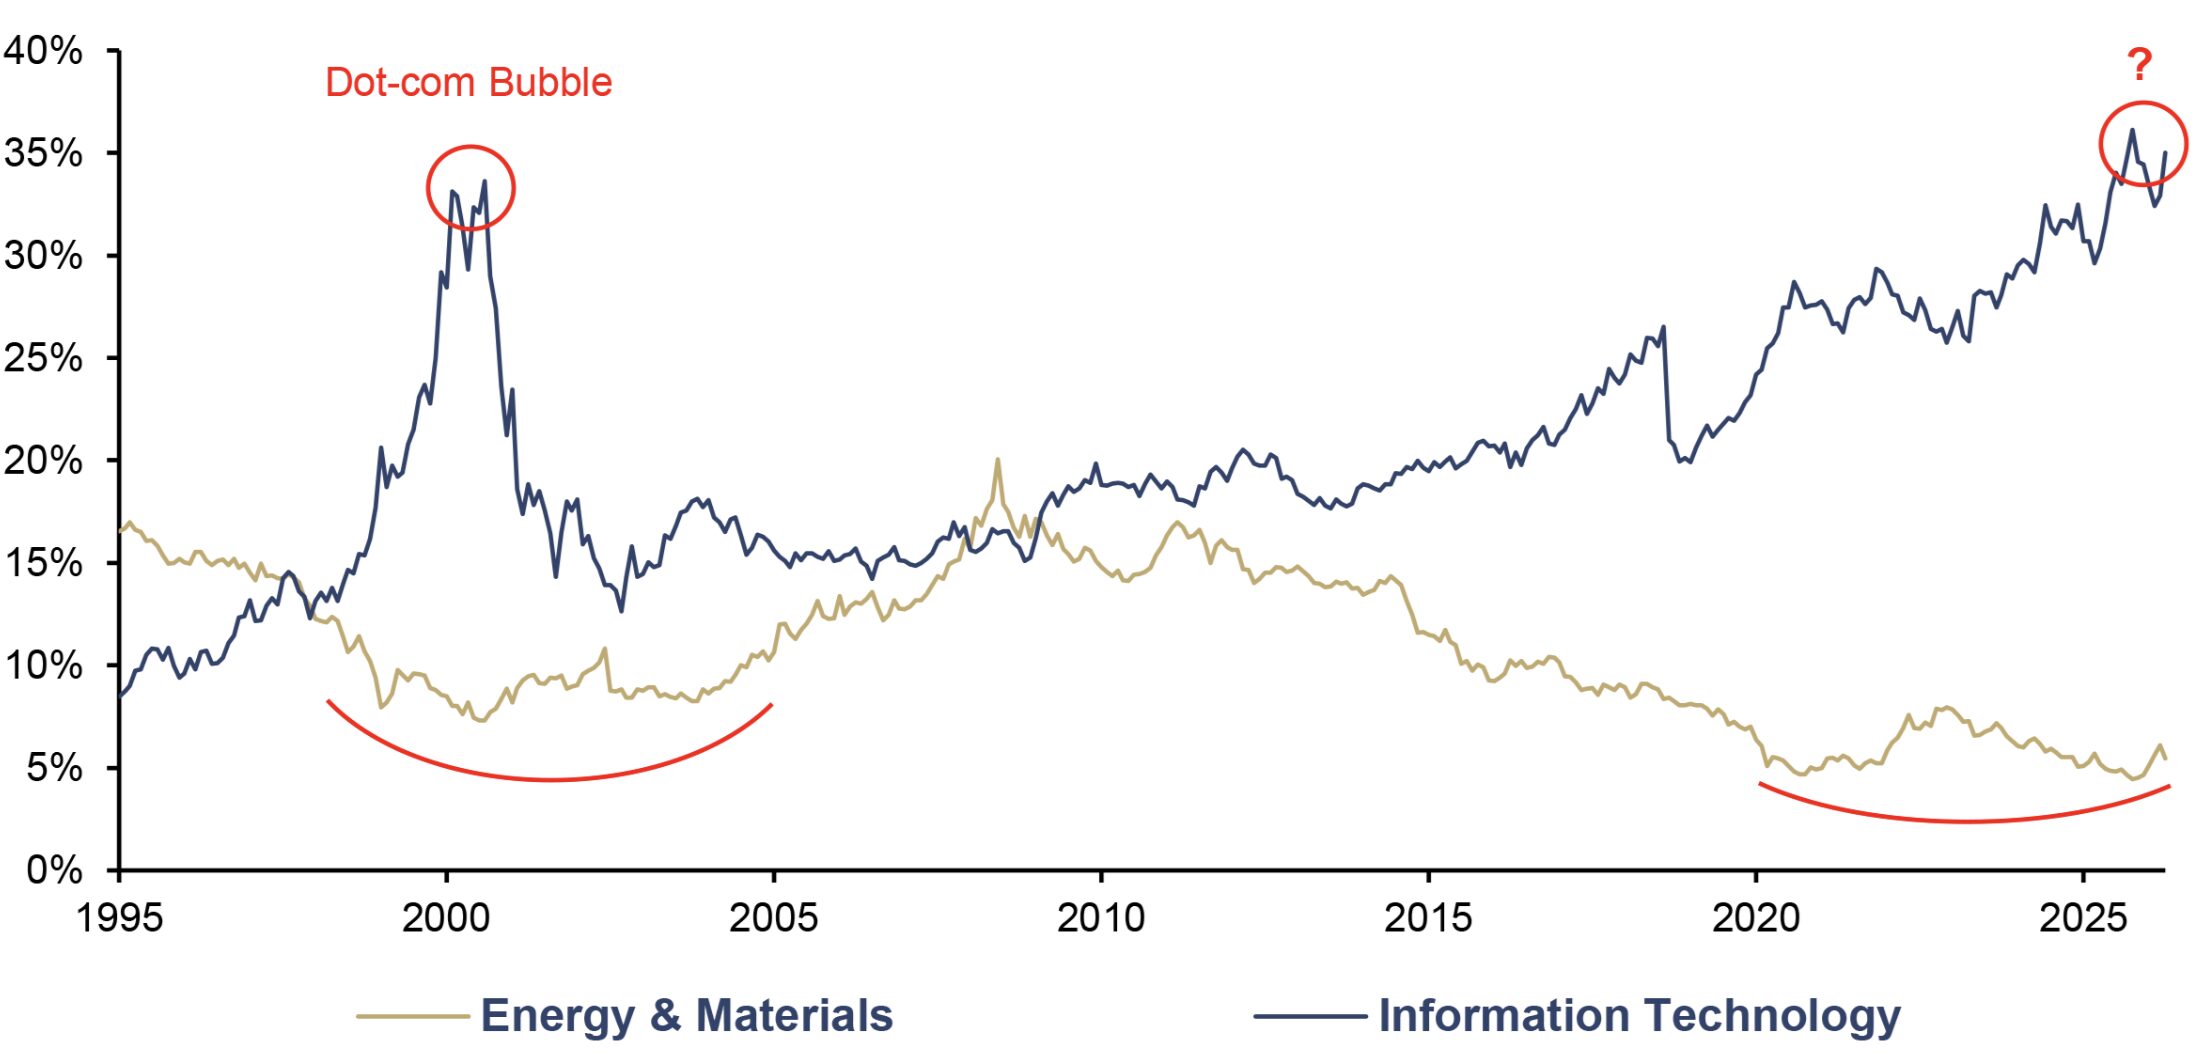
The key point is: The rally has not yet gained broad-based momentum. Gold and silver have led the way, but the broad-based rally across the entire commodities complex, as seen in the middle phase of the 2000s supercycle, has yet to materialize. Energy and materials together account for less than 6% of the S&P 500. Even marginal institutional reallocations toward real assets would trigger disproportionate price gains.
S&P 500 Sector Weights, 01/1995–04/2026
Source: Tavi Costa, LSEG, Incrementum AG
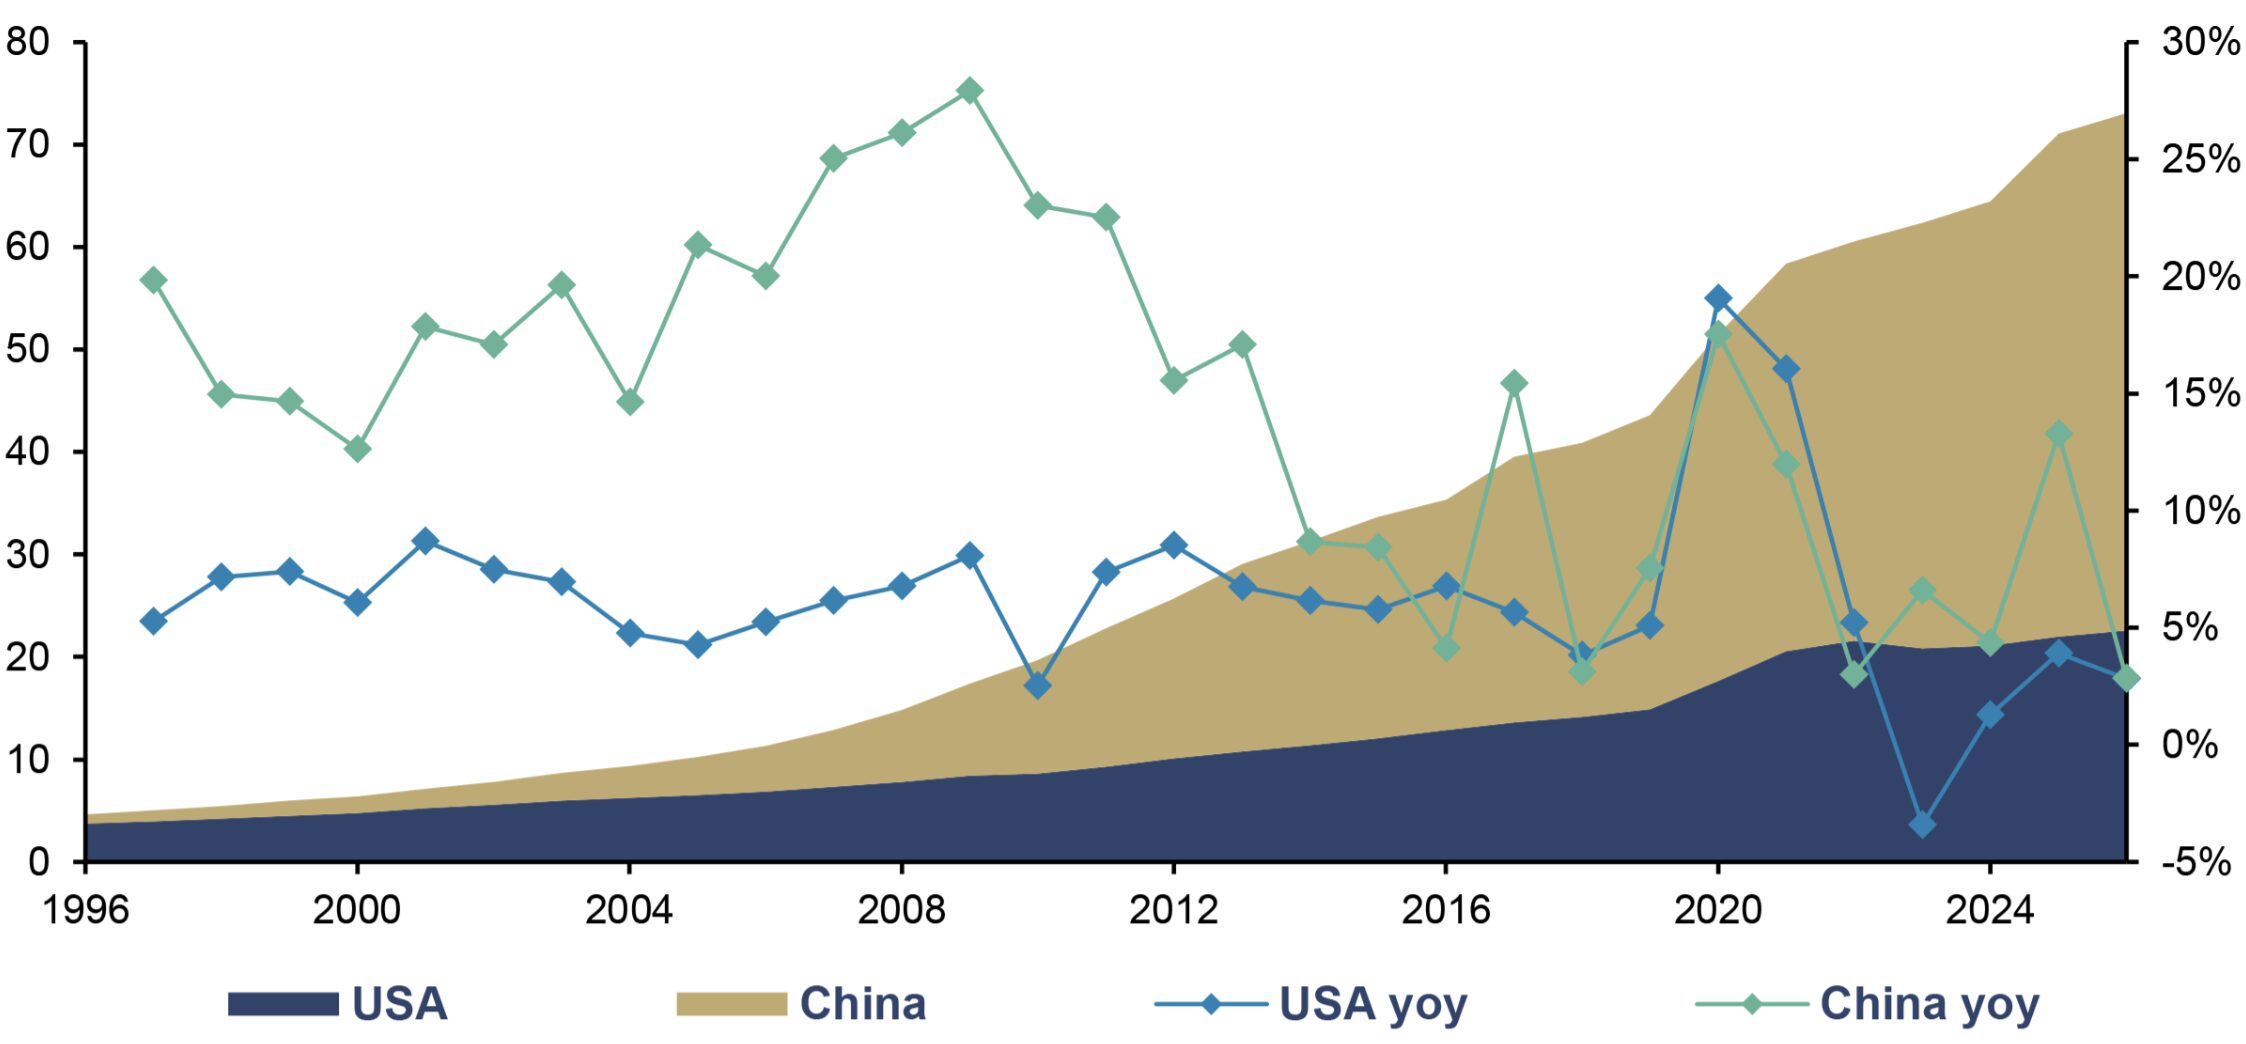
Moreover, China provides the monetary fuel for the commodities cycle. China’s M2 money supply grew by 8.5% in yuan and 13.3% in US dollars in 2025, significantly faster than nominal GDP. At just under 50trn, M2 in China is already more than twice as large as that of the US – and this in an economy whose nominal GDP is only about two-thirds of that of the US economy.
USA and China: M2, in USD trn (lhs), and yoy (rhs), 1996–2026
Source: LSEG, Incrementum AG
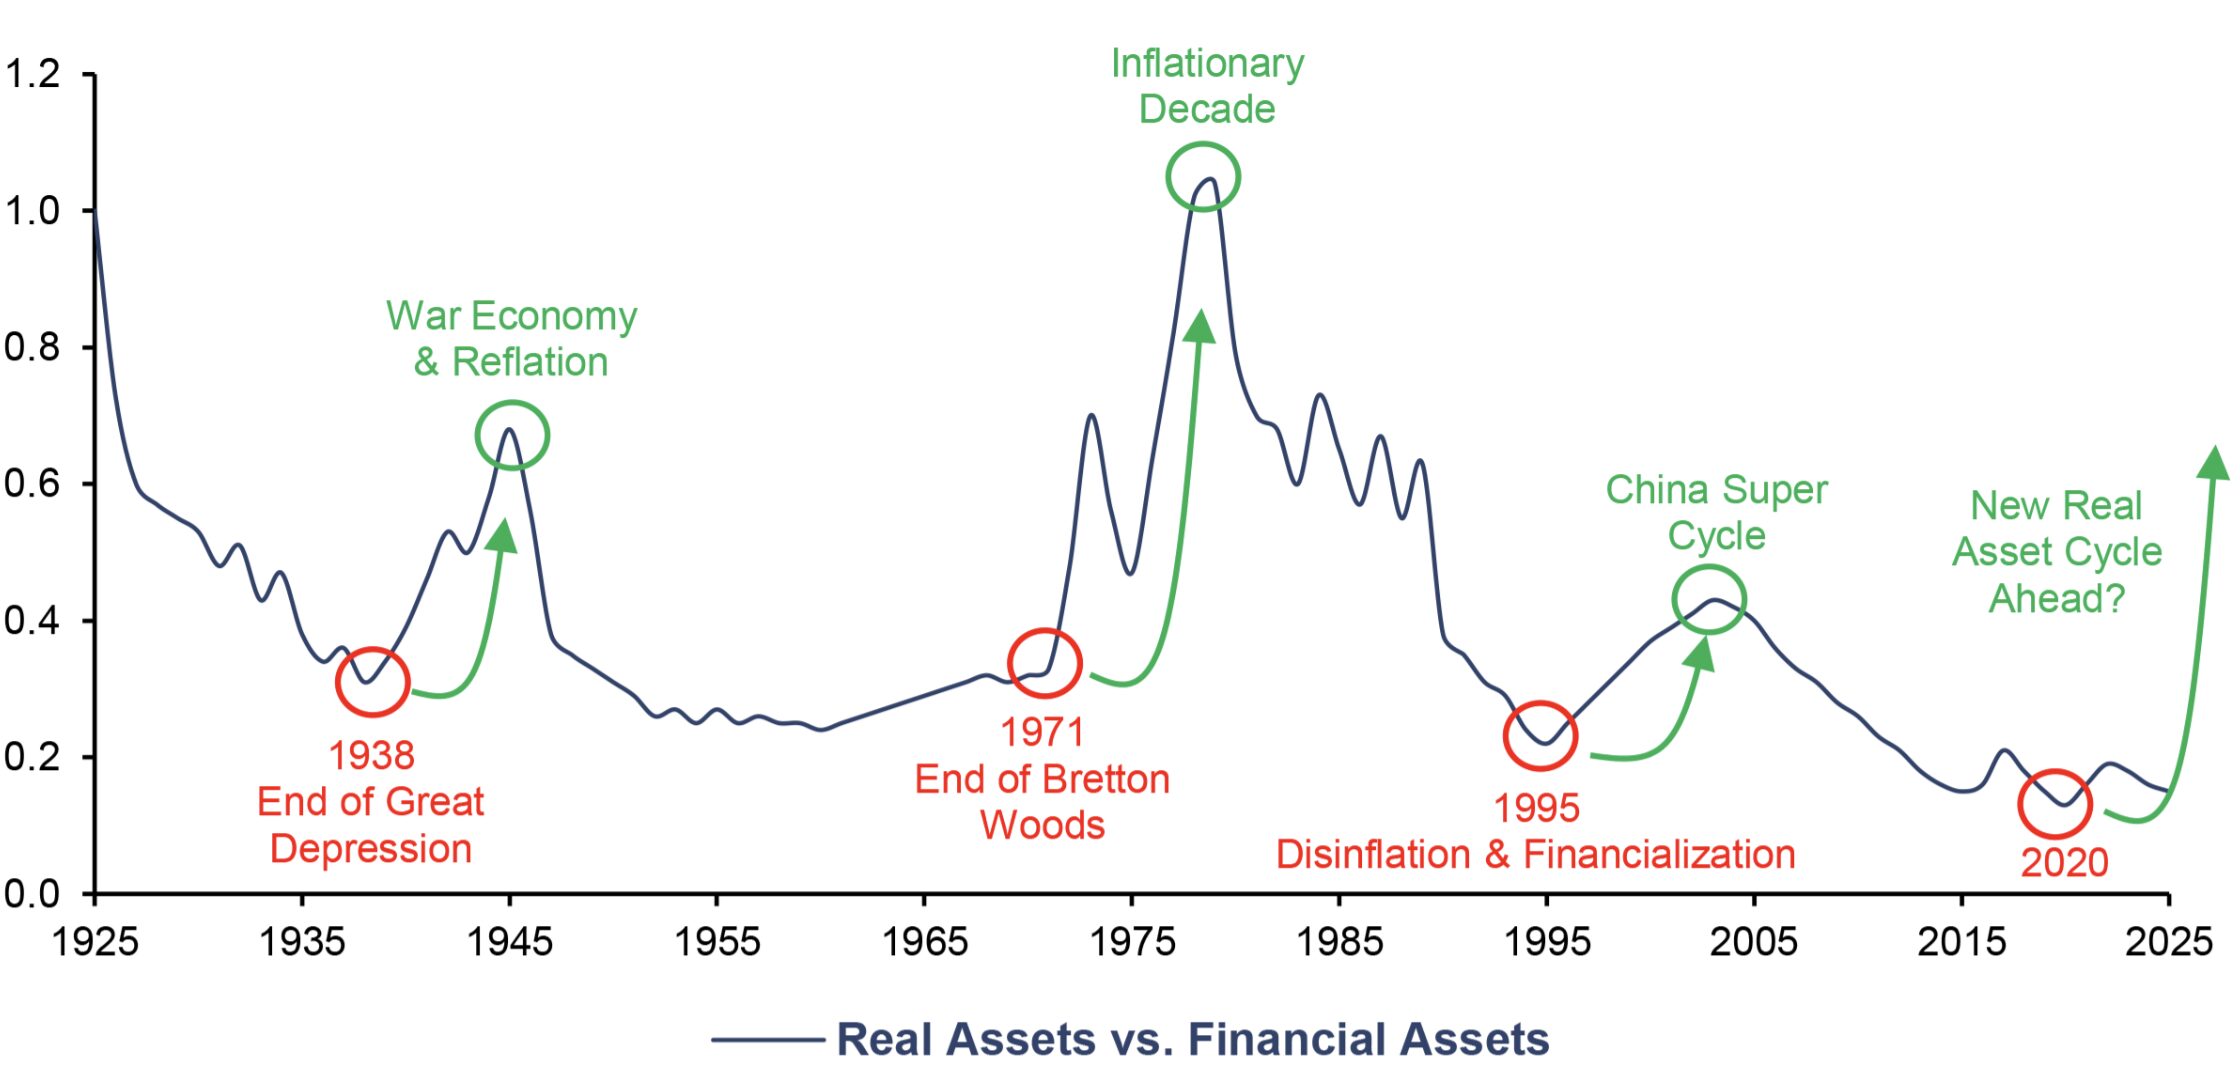
The relationship between real assets and financial assets unfolds over decades, not quarters. The chart below tells this story over the course of a century: Each significant low was followed by a phase of pronounced outperformance by real assets – in 1938 with the war economy and reflation, in 1971 with the end of Bretton Woods and the inflationary decade of the 1970s, and in 1995 with the China supercycle. In 2020, the ratio reached a new historical low. Since then, the signs of a bottoming process have multiplied. Is the next real-asset cycle now upon us?
Real Assets vs. Financial Assets, 1925–2025
Source: Bloomberg, Incrementum AG
In the medium term, the commodities market will reflect the new geopolitical landscape: As the US steps back from its leadership role, Europe, China, and the Global South are upgrading their defense and energy infrastructure. The consequence is foreseeable: Nations and corporations will compete for strategic resources as if there were no tomorrow. In the short term, additional bullish catalysts are emerging: a globally synchronized easing of monetary policy, a weaker US dollar, and expansionary stimulus from Beijing.
Back to the Monetary Future: The Conclusion
Michael Weeks sums up the case for gold – and in doing so, turns the usual valuation logic on its head: The value of the precious metal lies not in what it promises but in what it spares its owners. His via negativa approach is fascinatingly clear: Gold carries no duration risk, no credit risk, and no liquidity risk. No balance sheets imploding, no cash flows drying up, no management misallocating capital. Gold requires neither the trust nor the goodwill of a counterparty. Gold requires only a secure storage location. In a world where government bonds are increasingly becoming certificates of confiscation and the fiat money experiment is entering its late-cycle phase, it is precisely this absence of risk that constitutes the decisive competitive advantage.
From our point of view, gold will not be remonetized through an ideological return to the gold standard, but through the pragmatic restoration of its monetary and balance-sheet functions. This process will originate in the Global South. Western governments and central banks will only openly reassess the monetary relevance of gold once fiscal and balance sheet pressures have become significant enough. For investors, this means the question is no longer whether gold belongs in the portfolio, but in what amount and form.
The coming years will determine whether the fiat experiment remains a permanent deviation from the historical norm or is an episode that ends with the rediscovery of monetary principles. History clearly points to the latter.
To get to Back to the Monetary Future, you don’t need to accelerate the DeLorean to 88 miles per hour like in the Back to the Future film trilogy – this development has long since gained momentum. Marty McFly needed the flux capacitor to travel through time; investors need only the oldest store of value in the periodic table, not merely supposedly safe assets like government bonds. What we need is that monetary anchor that humanity has trusted for five millennia – not as a political instrument of power but as a neutral, debt-free basis for trade, exchange, and trust.
We have been charting this path for twenty years. Our compass still points in the same direction:
IN GOLD WE TRUST
[1] See the chapter “The Six Vectors of Gold Remonetization” in this In Gold We Trust report
[2] See also “Exclusive Interview with Zoltan Pozsar: Adapting to the New World Order,” In Gold We Trust report 2023
[3] See “Crypto: Friend or Foe?,” In Gold We Trust report 2018, our quarterly Bitcoin Compass as well as our investment solutions.
[4] See the chapter “Silver After the Surge: ‘Stairway to Heaven’ or ‘Highway to Hell’?” in this In Gold We Trust report
[5] See the chapter “Mining Stocks – Fundamental and Technical Outlook” in this In Gold We Trust report