


Gold and Silver Miners: From Problem Child to Model Student
“The secret to investing is to figure out the value of something – and then to pay a lot less.”
Joel Greenblatt
- From problem child to model student: Capital discipline, debt reduction, and transparent dividend policies have transformed the mining sector.
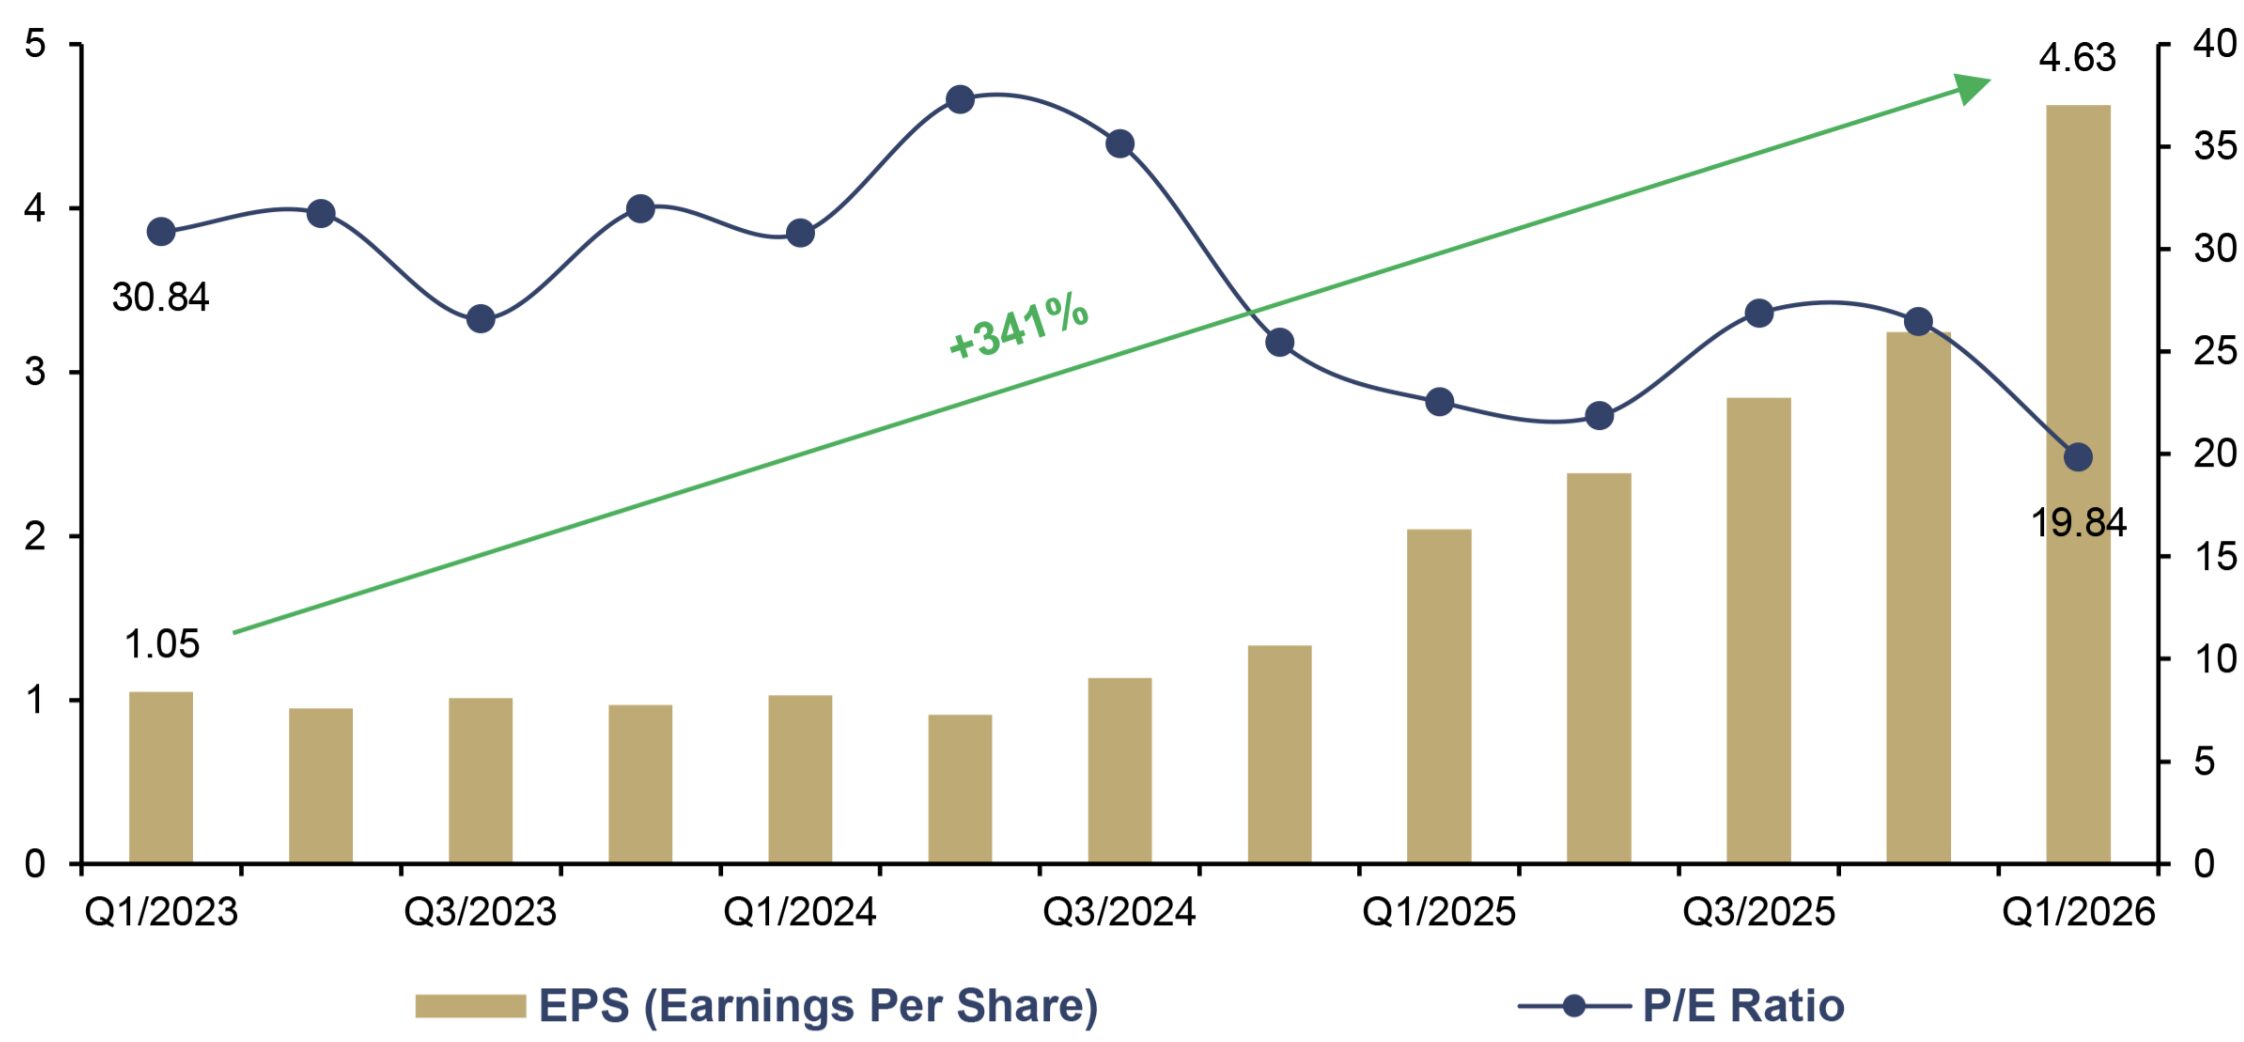
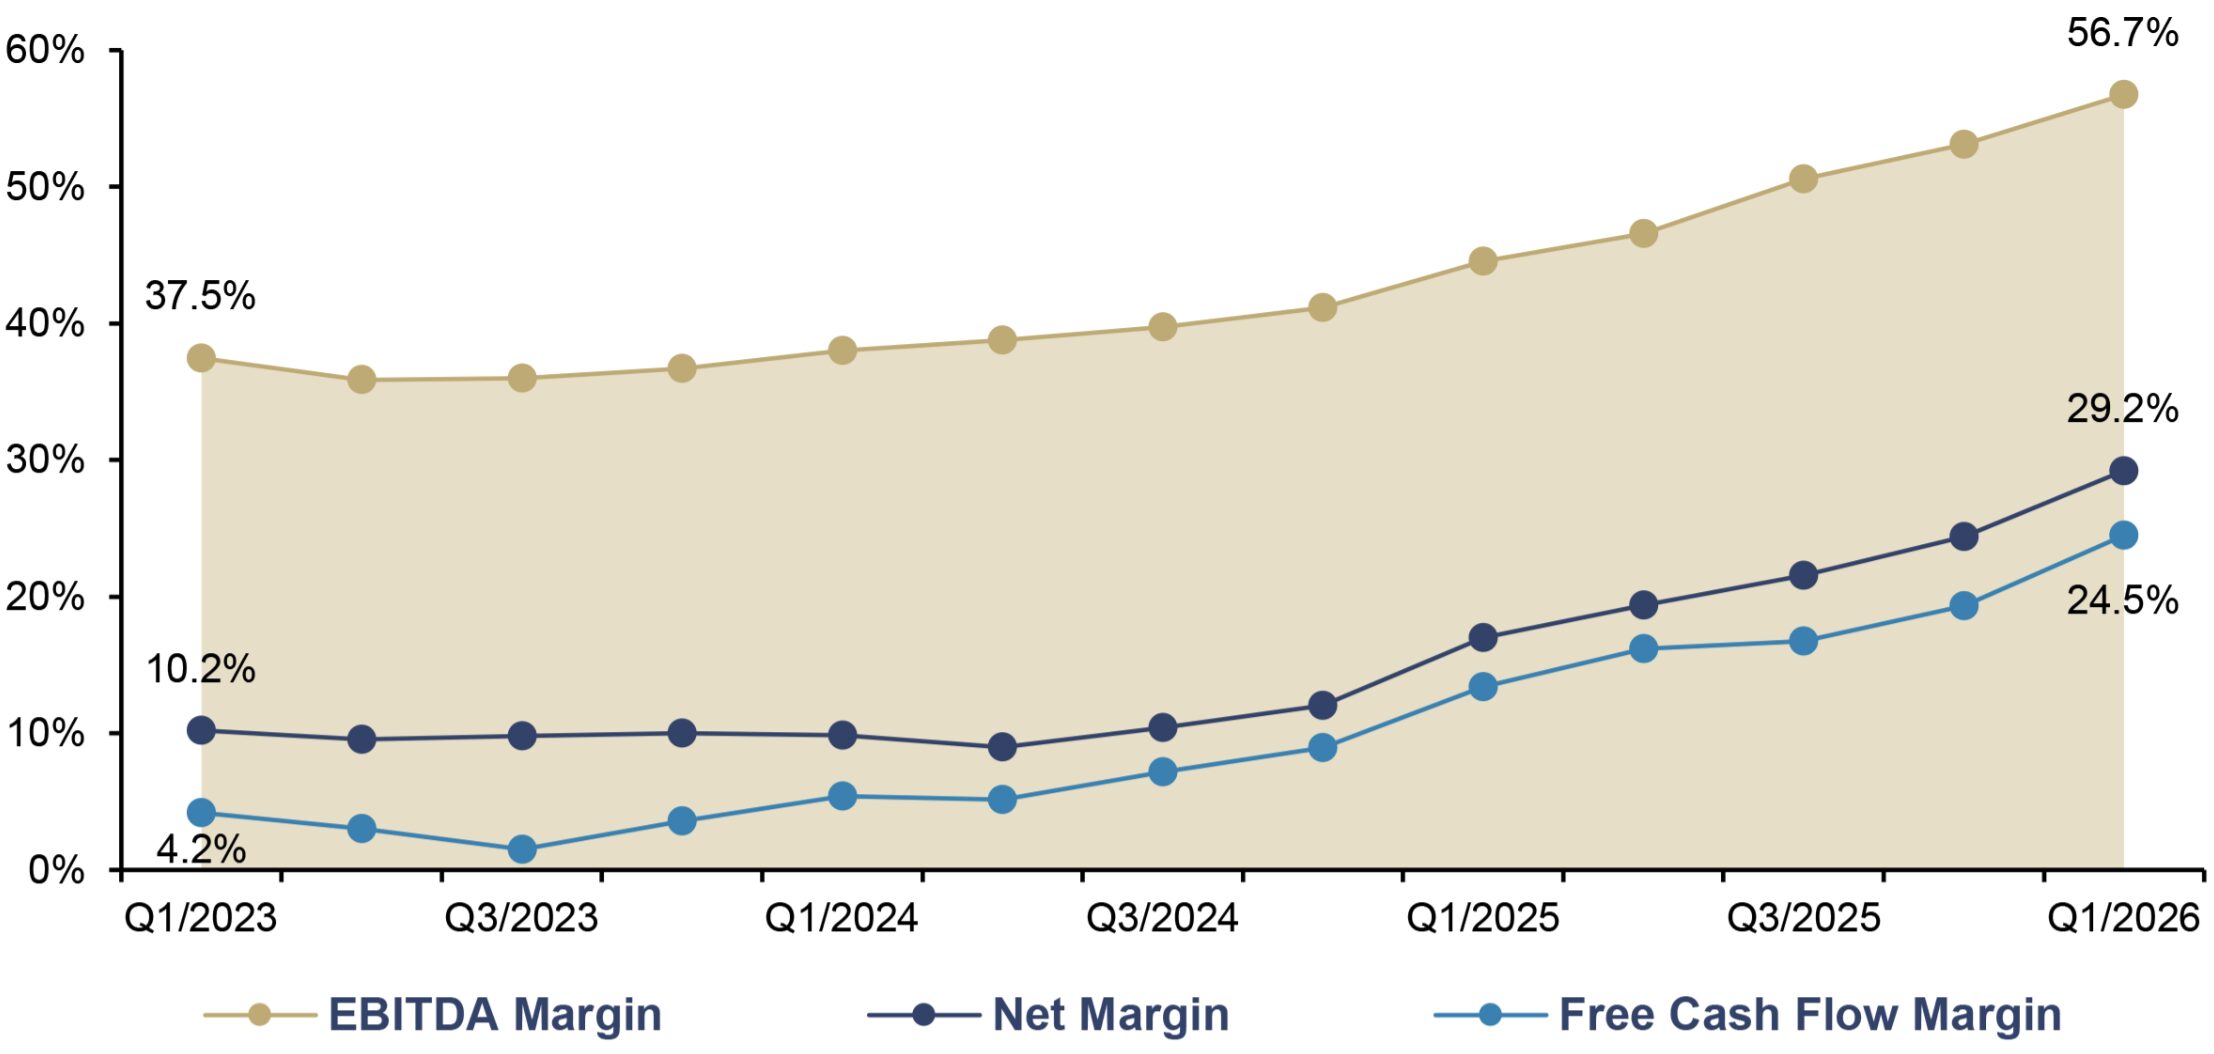
- 2025 was the most profitable year in gold mining history: The free cash flow margin of the GDX aggregate jumped from 4.2% to 24.5% and earnings per share quadrupled, while the P/E ratio fell from 30.8x to 19.8x.
- M&A as the new exploration: With USD 21.2bn in the gold sector alone, 2025 was the most active year for M&A since 2010 – driven by a structural shortage of reserves. The global discovery rate has plummeted since 2009 from 202 finds to 70–90 per year, while the cost per discovery has risen from USD 50mn to USD 200mn.
- Public participation phase, not mania: Senior producers have fired the opening salvo, mid-tier consolidation is underway, and junior financing is returning.
- Templeton litmus test passed: Generalist allocation marginal, ETF inflows anemic, people talking about AI at cocktail parties. If John Templeton was right, we are not at the end of this bull market but right in the middle of it. Bull market, not bubble.
If any sector embodies the “Back to the Monetary Future” theme of our 20th anniversary report, it is the gold mining sector. For over a decade, the sector was the capital market’s purgatory. The scars of roughly USD 500bn in destroyed shareholder value, of cyclically misguided acquisitions, and of ill-advised expansion into marginal deposits had rendered the industry largely uninvestable for a generation of institutional investors.
Attentive readers of our mining chapters will recall: In 2022, we wrote that the industry had “delivered,” but the market had not yet realized it. In 2023, we reiterated that “generalists and value investors would (re)discover the value proposition of the mining sector.” In 2024, we still described the sector as “[u]nloved, undervalued, underowned” and warned that many investors would be “surprised” by the Q1/2024 metrics. Finally, in the 2025 In Gold We Trust report, “The Big Long,” we presented the thesis of “cash flow and margin optimization.” Now it has come to pass.
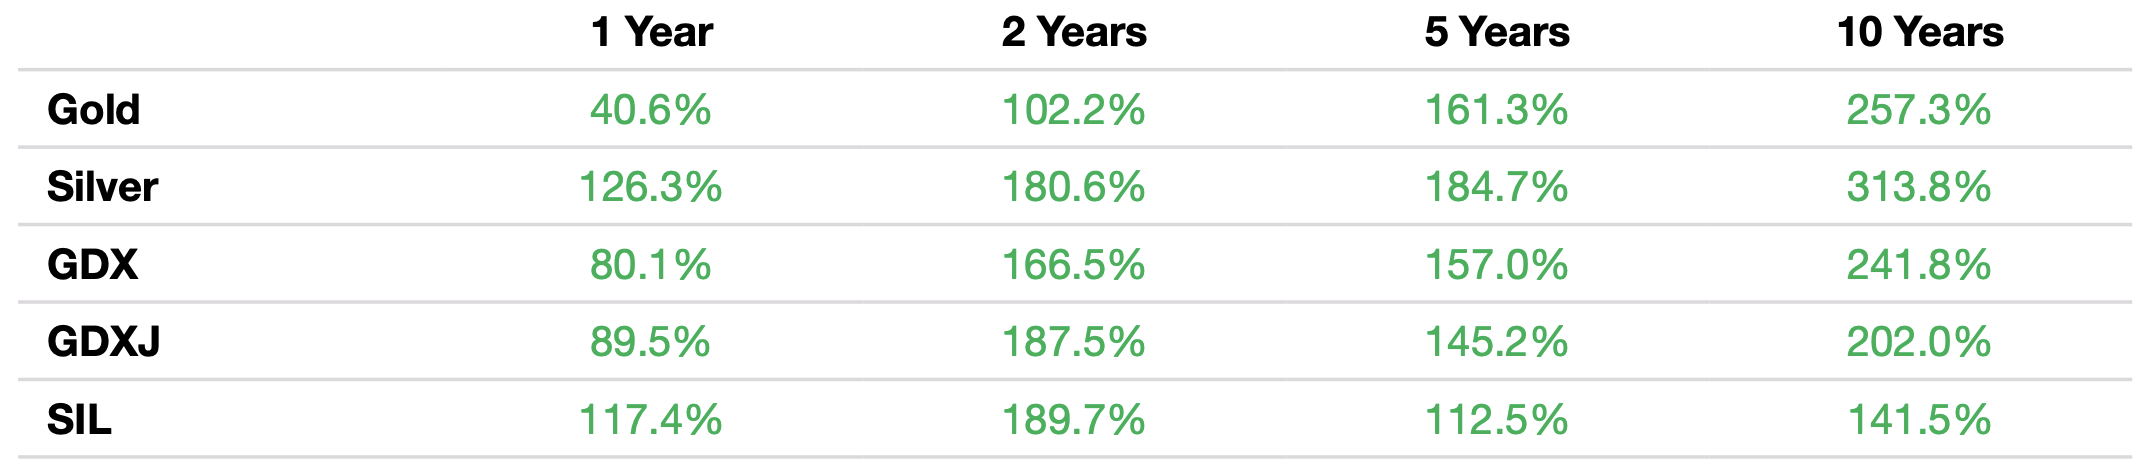
Performance of Various Precious Metal Investments, in USD, 04/30/2026
Source: LSEG, Incrementum AG
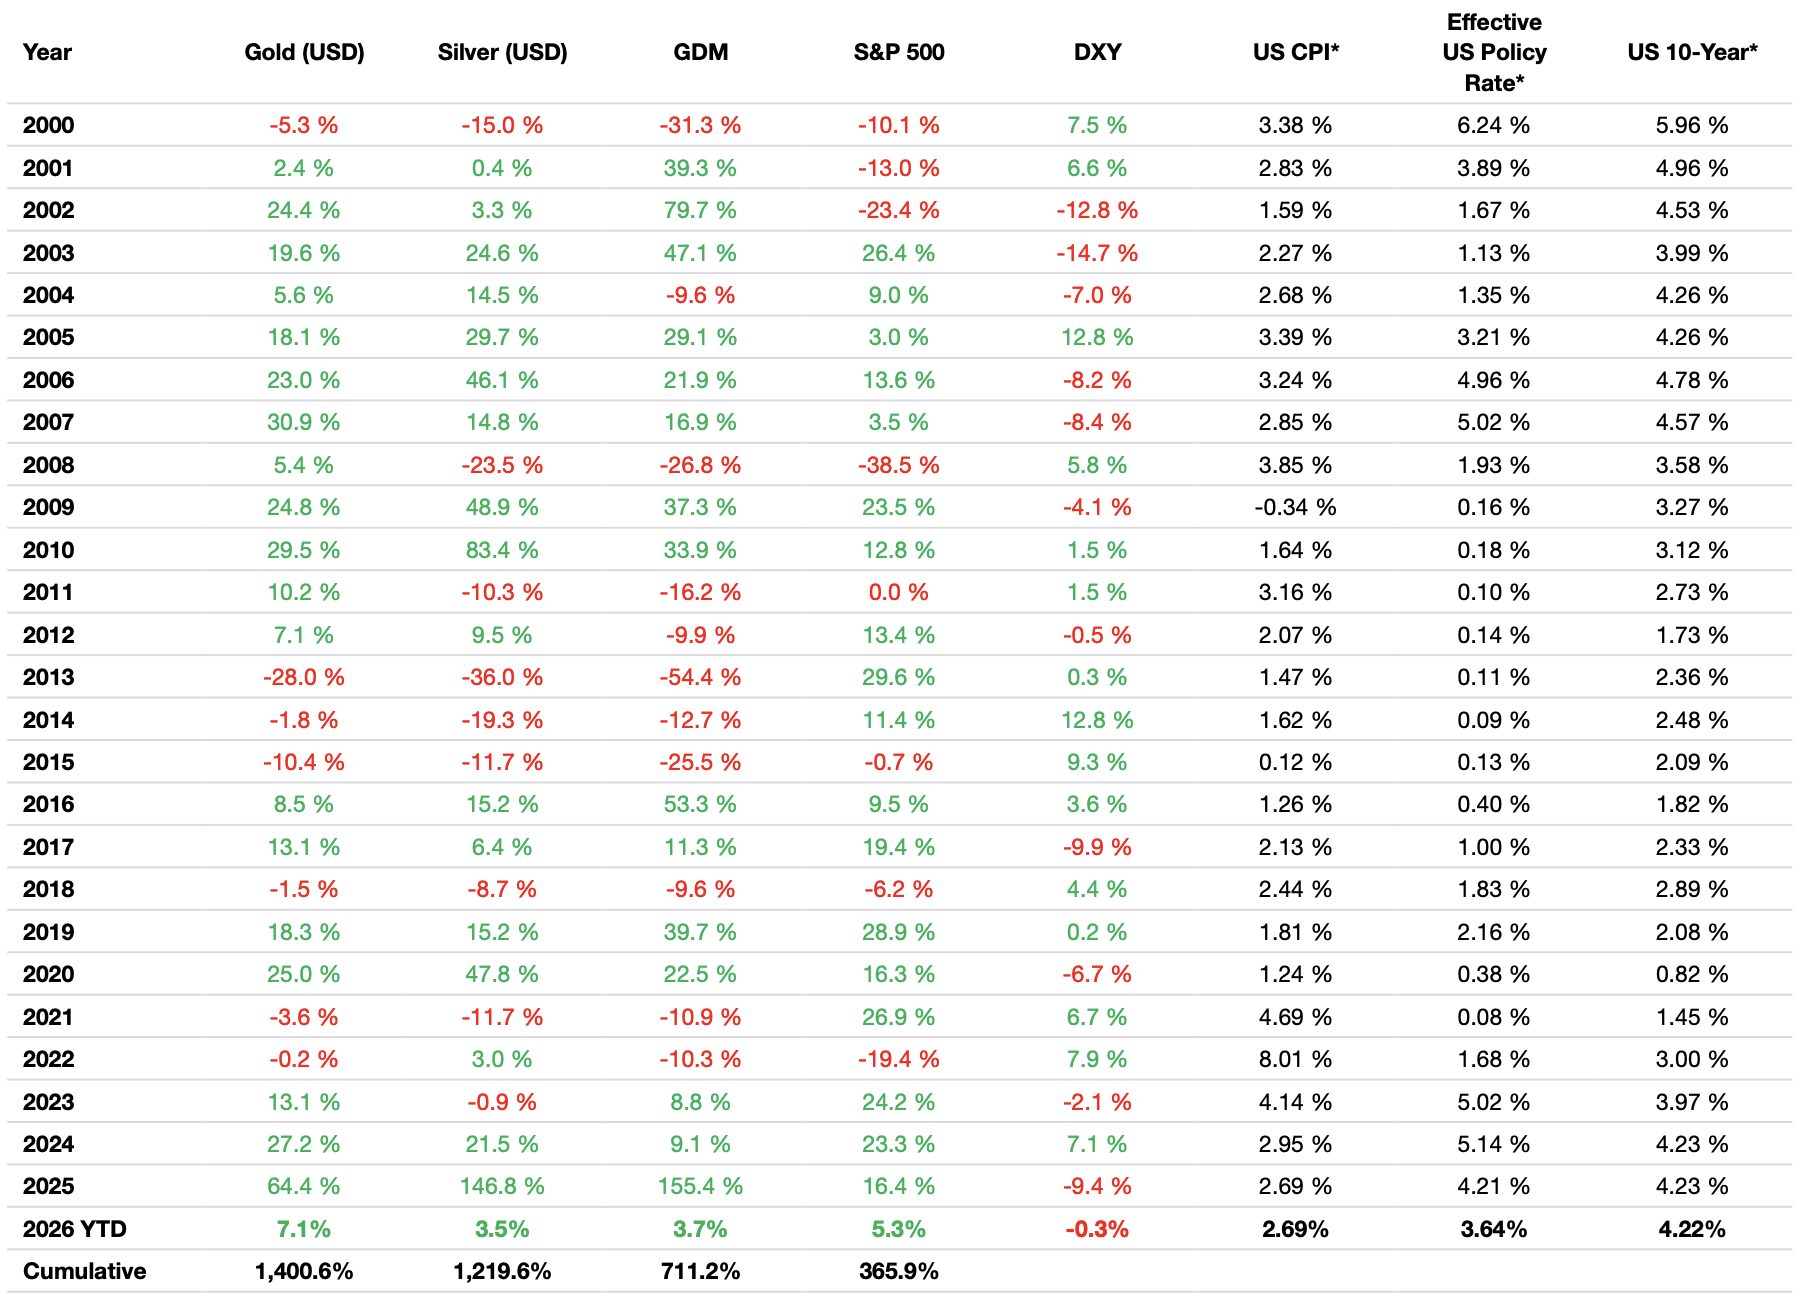
The data in the table below allows for some conclusions regarding the performance of gold, silver, and gold mining stocks. While gold does show correlations with the federal funds rate, the 10-year Treasury yield, or the CPI over short periods, these are not reliable in the long term. Only the negative correlation with the US dollar persists, and it proved itself once again in 2025: While the DXY fell by 9.4%, gold rose by 64.4%.
For gold mining stocks, the dominant driver is once again evident: the gold price itself, amplified by operational leverage. The GDM’s 155.4% rise, accompanied by the 64.4% increase in the gold price, corresponds to a beta of approximately 2.4. Silver also lived up to its reputation as “gold on steroids” – with a gain of 146.8% compared to 64.4% for gold.
Performance of Various Investments and Macroeconomic Indicators, 2000–2026 YTD
Source: LSEG (as of 04/30/2026), Incrementum AG
*Annual average
What we have been witnessing since 2025 can only be described as a golden renaissance of the mining sector – a return to financial discipline, operational excellence, and shareholder-centric governance that would have been unthinkable just a decade ago. The volatile zigzags of the bear market have given way to a volatile but clear upward trend.
Performance and Profitability 2025
2025 was the most profitable year in the history of gold mining. Operational performance was solid, but the real message is this: The sharp rise in the gold price has had a disproportionately large effect on earnings, free cash flow, and balance sheet quality. Growth through additional ounces was never the driver – it is the sheer leverage of the price on margins that has changed the picture.
Let’s take a look at the numbers: FactSet aggregates the quarterly results of all GDX constituents into a sector index. Earnings per share for the GDX aggregate quadrupled from USD 1.05 to USD 4.63 – a 341% increase. Over the same period, the P/E ratio fell from 30.8x to 19.8x. In other words: Investors are now paying a lower multiple for every US dollar of earnings than they did three years ago – even though earnings per share are now four times higher.
That is the true anomaly of this cycle. Rarely in the history of financial markets has it been possible to buy into a structural fourfold increase in profitability at a declining valuation multiple. Usually, the dynamic works the other way around: Rising profits lead to rising multiples, and the stock price reflects both – profit growth and re-rating. Here, the market has granted only the jump in profits; the re-rating is still pending.
GDX (LTM), EPS (lhs), and P/E Ratio (rhs), Q1/2023–Q1/2026
Source: FactSet, Incrementum AG
The free cash flow margin of the GDX aggregate stood at 4.2% in Q1/2023 and at 24.5% in Q1/2026. That is a sixfold increase over 13 quarters, or to put it another way: For every US dollar of revenue, nearly a quarter now flows into the balance sheet as free cash flow. The EBITDA margin grew in parallel from 37.5% to 56.7% – a level typically found only in the most profitable tech industries. It’s important to emphasize again: The entire jump in profitability came from margin expansion, not volume growth.
GDX (LTM), Margins, Q1/2023–Q1/2026
Source: FactSet, Incrementum AG
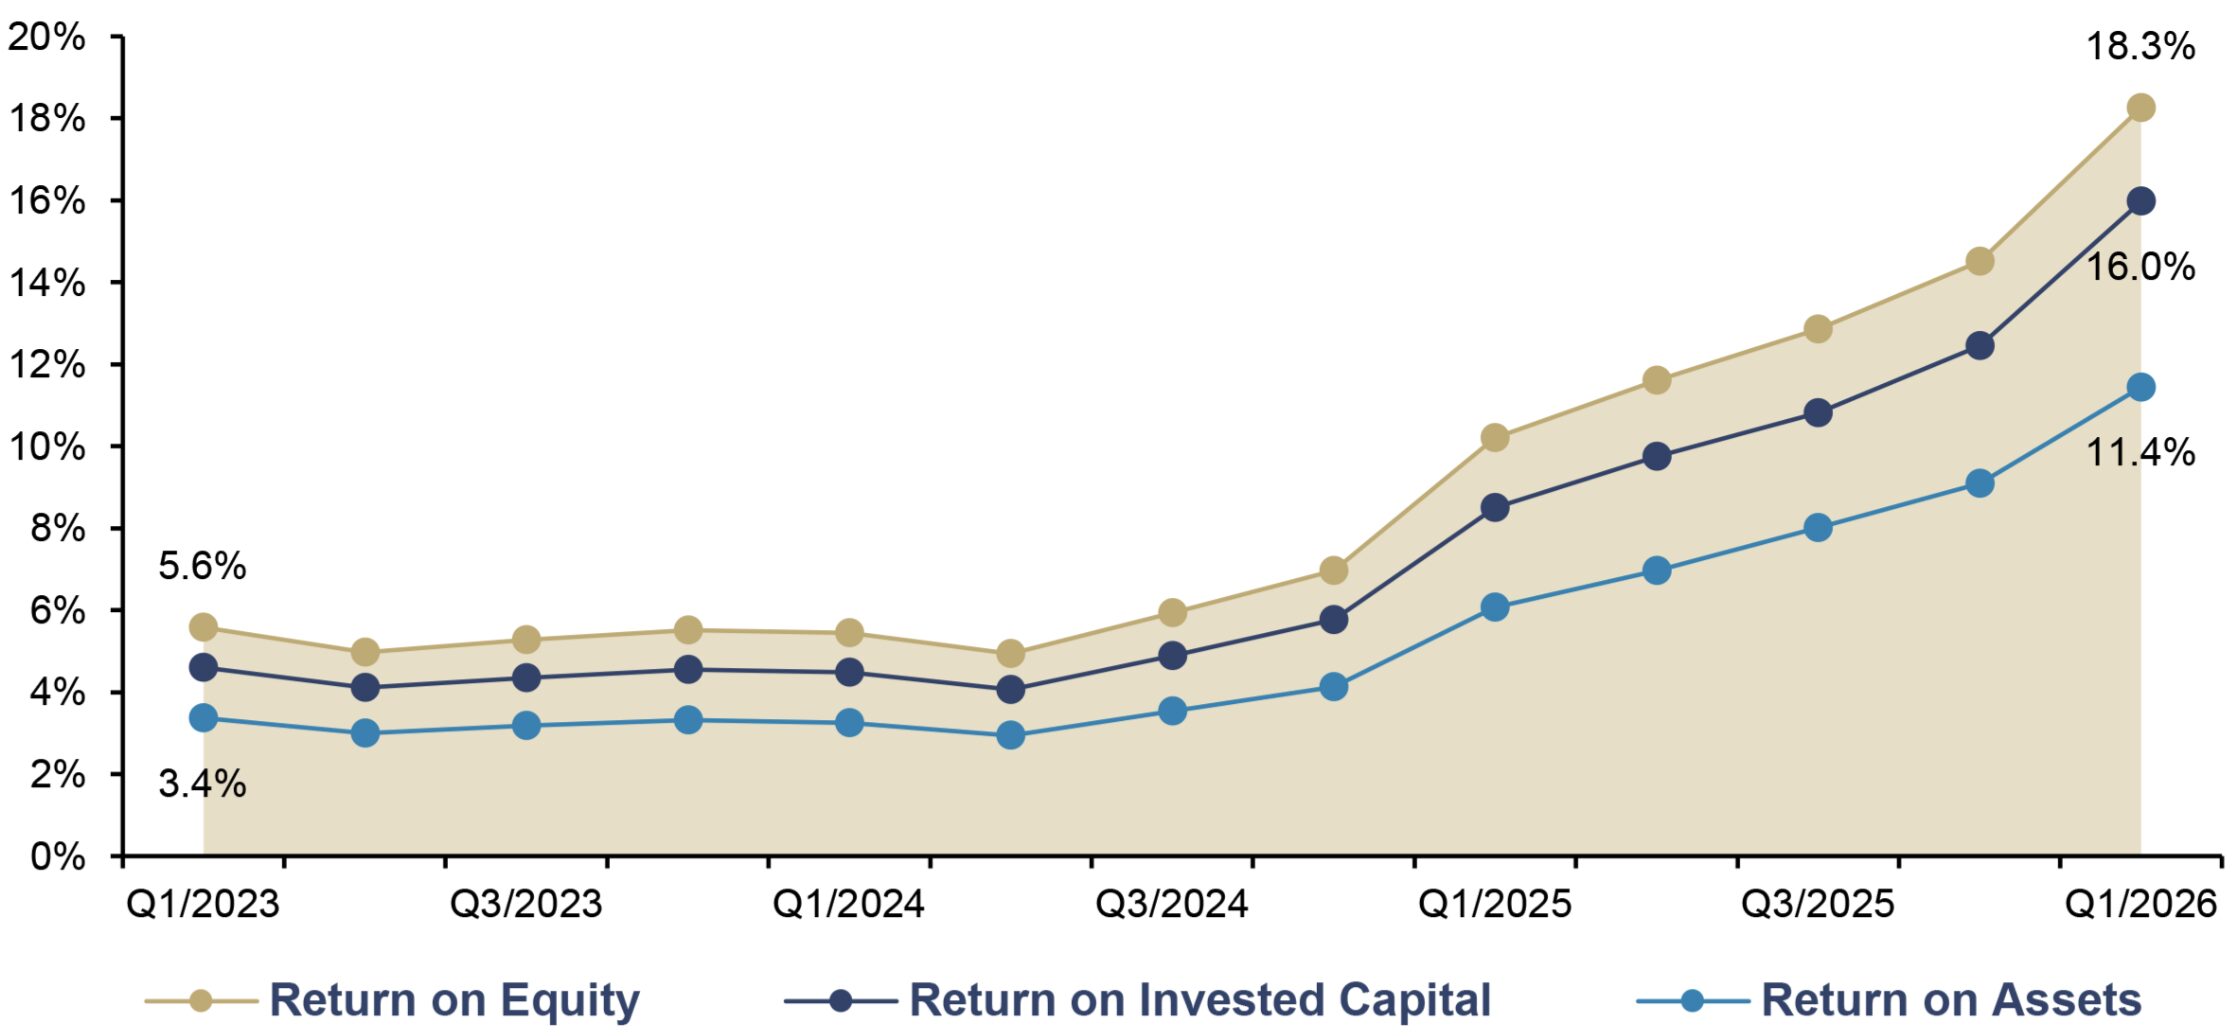
The next chart illustrates the operational leverage of the gold mining sector in its purest form. While returns on equity, capital, and total capital trended sideways for nearly two years, a marked acceleration began in Q3/2024. In Q1/2026, the return on equity reached a peak of 18.3%, a figure that seemed unthinkable just three years ago. The return on capital (16.0%) and return on total capital (11.4%) confirm this picture. The backdrop is the inverse relationship between the gold price and cash costs: With AISC margins of nearly USD 3,000 per ounce, every additional price increase flows almost entirely into the income statement. Anyone who, despite these fundamentals, continues to claim that the sector has “overheated” is confusing price performance with valuation expansion.
GDX (LTM), Profitability Ratios, Q1/2023–Q1/2026
Source: FactSet, Incrementum AG
When costs rise because the gold price rises
Upon closer inspection, the much-discussed cost increases turn out to be predominantly price-driven. Royalties, profit-based taxes, profit-sharing components, and exchange rate effects account for the lion’s share of the AISC increase, not operational deterioration.
The only significant exogenous uncertainty is the oil price. Since diesel and electricity accounted for about one-fifth of cash costs in 2025, according to S&P Global, realized AISC could trend toward USD 1,800–USD 1,900 per ounce if oil prices remain high. A BMO analysis quantifies the sensitivity precisely: For every 10% increase in the oil price, gold production costs rise by about 2%. Newmont itself calculated its February guidance based on USD 70/barrel Brent and estimates the effect of a USD 10/barrel change in oil prices on AISC at around USD 12 per ounce. With a margin expansion by a factor of 6.5 since 2015, this is a burden that gets lost in the noise of the gold price rally.
Exogenous vs. endogenous: where the real challenge lies
Differentiation is certainly warranted. The structural AISC inflation since 2020 is real – and it has two sources that must be evaluated fundamentally differently:
- Exogenous cost drivers such as diesel, steel, reagents, or tires are now well covered by the hedging and procurement policies of established producers. They are operationally controllable.
- Endogenous cost inflation, such as falling ore grades, declining mine lives, or rising stripping ratios, on the other hand, cannot be hedged. The mining industry has been operating against the law of diminishing returns for decades, and no forward contract in the world can bring back an ore grade once it has been mined.
This is precisely where the sector’s operational dividing line lies. Senior producers with Tier 1 assets and long mine lives are the structural beneficiaries – they convert margin expansion almost entirely into free cash flow. Mid-tier and junior producers with more complex assets, shorter mine lives, or capital-intensive growth projects also realize margin expansion, but with higher operational risks.
Grow, deleverage, distribute – all at once
Noteworthy is the new multidimensionality of capital allocation. The old either-or logic – growth, balance sheet repair, or distribution – is a thing of the past. Today, the industry can grow, deleverage, and distribute simultaneously. A remarkable constellation for a sector that, just a few years ago, was considered synonymous with capital destruction.
Among our premium-partner miners, 2025 was the year capital came home to shareholders rather than back into the ground. Barrick led the structural reset with a record USD 2.4bn returned to shareholders, lifting its dividend by 140% alongside a USD 1.5bn buyback and adopting a new policy targeting 50% of attributable free cash flow as annual payout, with a fixed-base quarterly dividend plus a year-end performance top-up. Newmont returned a sector-record USD 3.4bn through dividends and repurchases, drawing USD 3.6bn from its USD 6bn authorization while reducing net debt by USD 3.4bn – closing 2025 in a USD 2.1bn net cash position. Agnico Eagle returned a record USD 1.4bn (USD 803mn in dividends, USD 600mn in buybacks) and raised the dividend a further 12.5% for 2026, while protecting an unbroken payout record that dates back to 1983. Kinross lifted its dividend by 17% and its buyback target by 20% to USD 600mn. Endeavour Mining sent USD 435mn to shareholders, 93% above its own minimum commitment, and pre-committed to at least USD 1bn over 2026-2028. Harmony rewrote its policy from 20% to 30% of net free cash with optional upside to 50%, posted a record FY25 payout of ZAR 2.4bn (USD 133mn), and more than doubled its interim dividend again in H1/FY26.
Pan American Silver returned USD 221mn via dividends and buybacks and raised its payout in three successive quarters, capped by a 29% Q4 increase. Mineros returned USD 42mn against a record net profit of USD 145mn while sustaining a five-year dividend growth rate close to 17%. The royalty and streaming partners embody the new discipline most cleanly, with Royal Gold marking its 25th consecutive annual dividend increase.
Equally telling are the capital-return inflections among the rest of our partners. Equinox Gold, having cut net debt by USD 1.1bn since Q2/2025, declared its first-ever dividend (USD 0.06 annualized) and inaugural NCIB in February 2026, the classic handover from build-out to capital return. Elemental Royalty, the post-merger combination of Elemental Altus and EMX, did much the same with a maiden USD 0.12 annual dividend, and went one step further by offering registered shareholders the option to take that dividend in Tether Gold tokens. First Majestic operates a revenue-pegged formula (1% of net quarterly revenue) that nearly doubled its per-share payout across 2025 as silver and gold prices rose. Fortuna prefers buybacks to dividends, having cancelled 3.4mn shares at an average USD 9.53 before renewing the program for a further 5% of float in May 2026. The remainder of our partner roster (explorers, developers, and turnaround operators) is appropriately reinvesting in resource expansion rather than payouts, which in this part of the cycle is its own form of discipline.
The four pillars of the new discipline
Four behavioral changes are driving this turnaround and fundamentally distinguish the current cycle from previous bull markets:
- Capex discipline: Even the capex increases of around +25% yoy expected for 2026 remain well below the 2011/12 peaks. More importantly: The additional funds are flowing primarily into brownfield expansions of existing Tier-1 assets rather than into greenfield megaprojects.
- Hedging restraint: The industry has learned from the hedging debacle of the late 1990s and early 2000s: Leading producers now sell at the spot price, thereby fully participating in the rally, rather than giving it away to banks via forward sales as in previous cycles.
- Conservative valuation: The majors value their reserves at USD 1,700– USD 2,200/oz – at a spot price of around USD 4,600/oz. Double effect: Reserves are hedged against a price decline, and there is significant upside potential lurking on the balance sheets.
- Dilution discipline: The most telling indicator of the paradigm shift: During the 2003–2012 supercycle, the majors’ share count grew by double digits annually in some cases – driven by acquisitions and equity offerings. Today, dilution is significantly lower, and many producers are even actively buying back their own shares.
The industry has learned from the excesses of the past. The only open question is whether investors have also internalized this lesson.
The next wave of M&A: reserve acquisition as a strategic imperative
The growth picture remains divided: Senior producers expect an average production decline of around 4.5% by 2026, while intermediates are expanding by 5.4% and juniors by 16.8%. Organic growth is clearly shifting toward the “new generation” of mines – Côté, Greenstone, Valentine, Tocantinzinho, Blackwater, Goose, Media Luna. Any major seeking access to this generation’s reserves faces a simple choice: build, discover – or buy.
This is precisely where the next wave of M&A begins. In 2025, three major transactions dominated the market: Coeur/New Gold (USD 7bn), Gold Fields/Gold Road (USD 3.69bn), and Equinox/Calibre (USD 2.13bn). Three structural features set this wave apart from the acquisition frenzy of the 2003–2012 supercycle:
- All-stock and mixed cash-stock deals dominate; pure cash deals are the exception. Buyers are using their relatively overvalued shares as acquisition currency instead of spending scarce cash.
- Premium spreads between 11% and 39% – far removed from the 50–80% premiums of the last supercycle.
- Strategic logic consistently focuses on acquiring reserves, not diversification: Northern Star/De Grey, Pan American/MAG Silver, Coeur/New Gold, Fresnillo/ Probe – not a single conglomerate deal, not a single move into foreign commodities.
The structural context: declining discoveries. Data from Richard Schodde provides the fundamental rationale for this M&A logic: While 202 discoveries were reported in the peak year of 2009, there are currently only 70–90 per year; the average cost per significant discovery has risen from around USD 50mn before the boom to around USD 200mn today. Since 2010, only 1,967 Moz of gold have been discovered globally across 645 deposits – while 1,470 Moz of gold were mined during the same period. This sounds like reserve growth, but it is only positive if one factors in resource growth at existing mines. When it comes to genuine new discoveries resulting from independent exploration activities, the balance is negative.
Gold Mining Stocks: Active Management Is Key
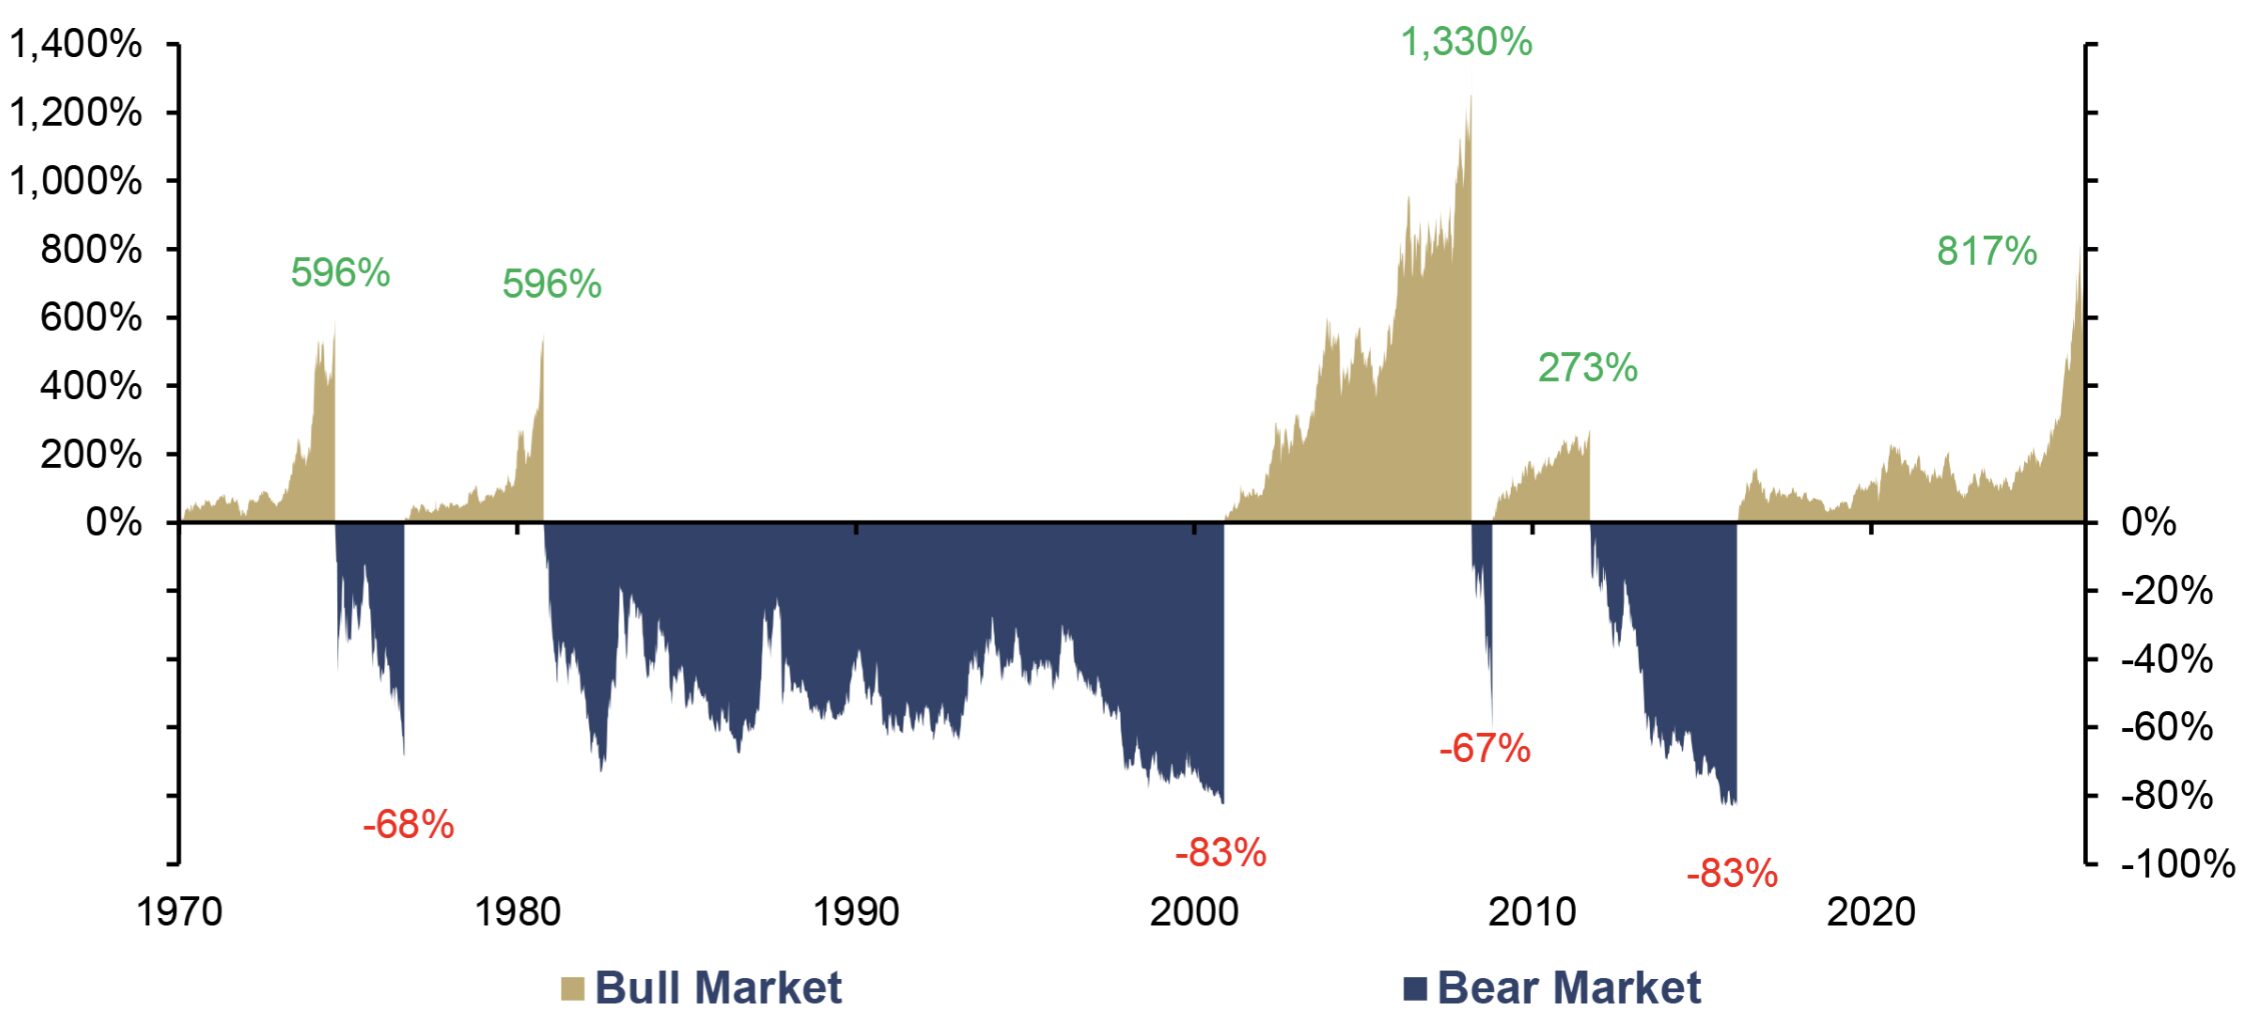
Readers are already familiar with our distinction between safe-haven gold – i.e., physical gold to preserve purchasing power – and performance gold – i.e., mining stocks and mining funds for capital appreciation. Given the diverse risks involved, we advocate an active investment strategy when dealing with gold mining stocks. This is because not only are the bull markets typically much more pronounced than in conventional stock sectors, but so are the bear markets.
Gold Miners* Bull/Bear Markets, in USD, 01/1970–05/2026
Source: Nick Laird, LSEG, Incrementum AG
*BGMI = 01/1970–11/2000, HUI = 11/2000–
The Incrementum Active Aurum Signal
But what criteria can be used to determine the optimal time to go on the offensive and add performance gold to the portfolio? And when, according to the football adage “The offense wins games, but the defense wins championships,” is it time to act more defensively?
In recent years, we have intensively explored this question and developed a signal that helps us precisely anticipate this moment. The result of our analysis is our proprietary Incrementum Active Aurum Signal, which we first introduced in the In Gold We Trust report 2024, “The New Gold Playbook”, in the chapter “Mastering the New Gold Playbook.” This signal serves to determine the optimal time to adjust gold exposure in the portfolio.[1]
Composition
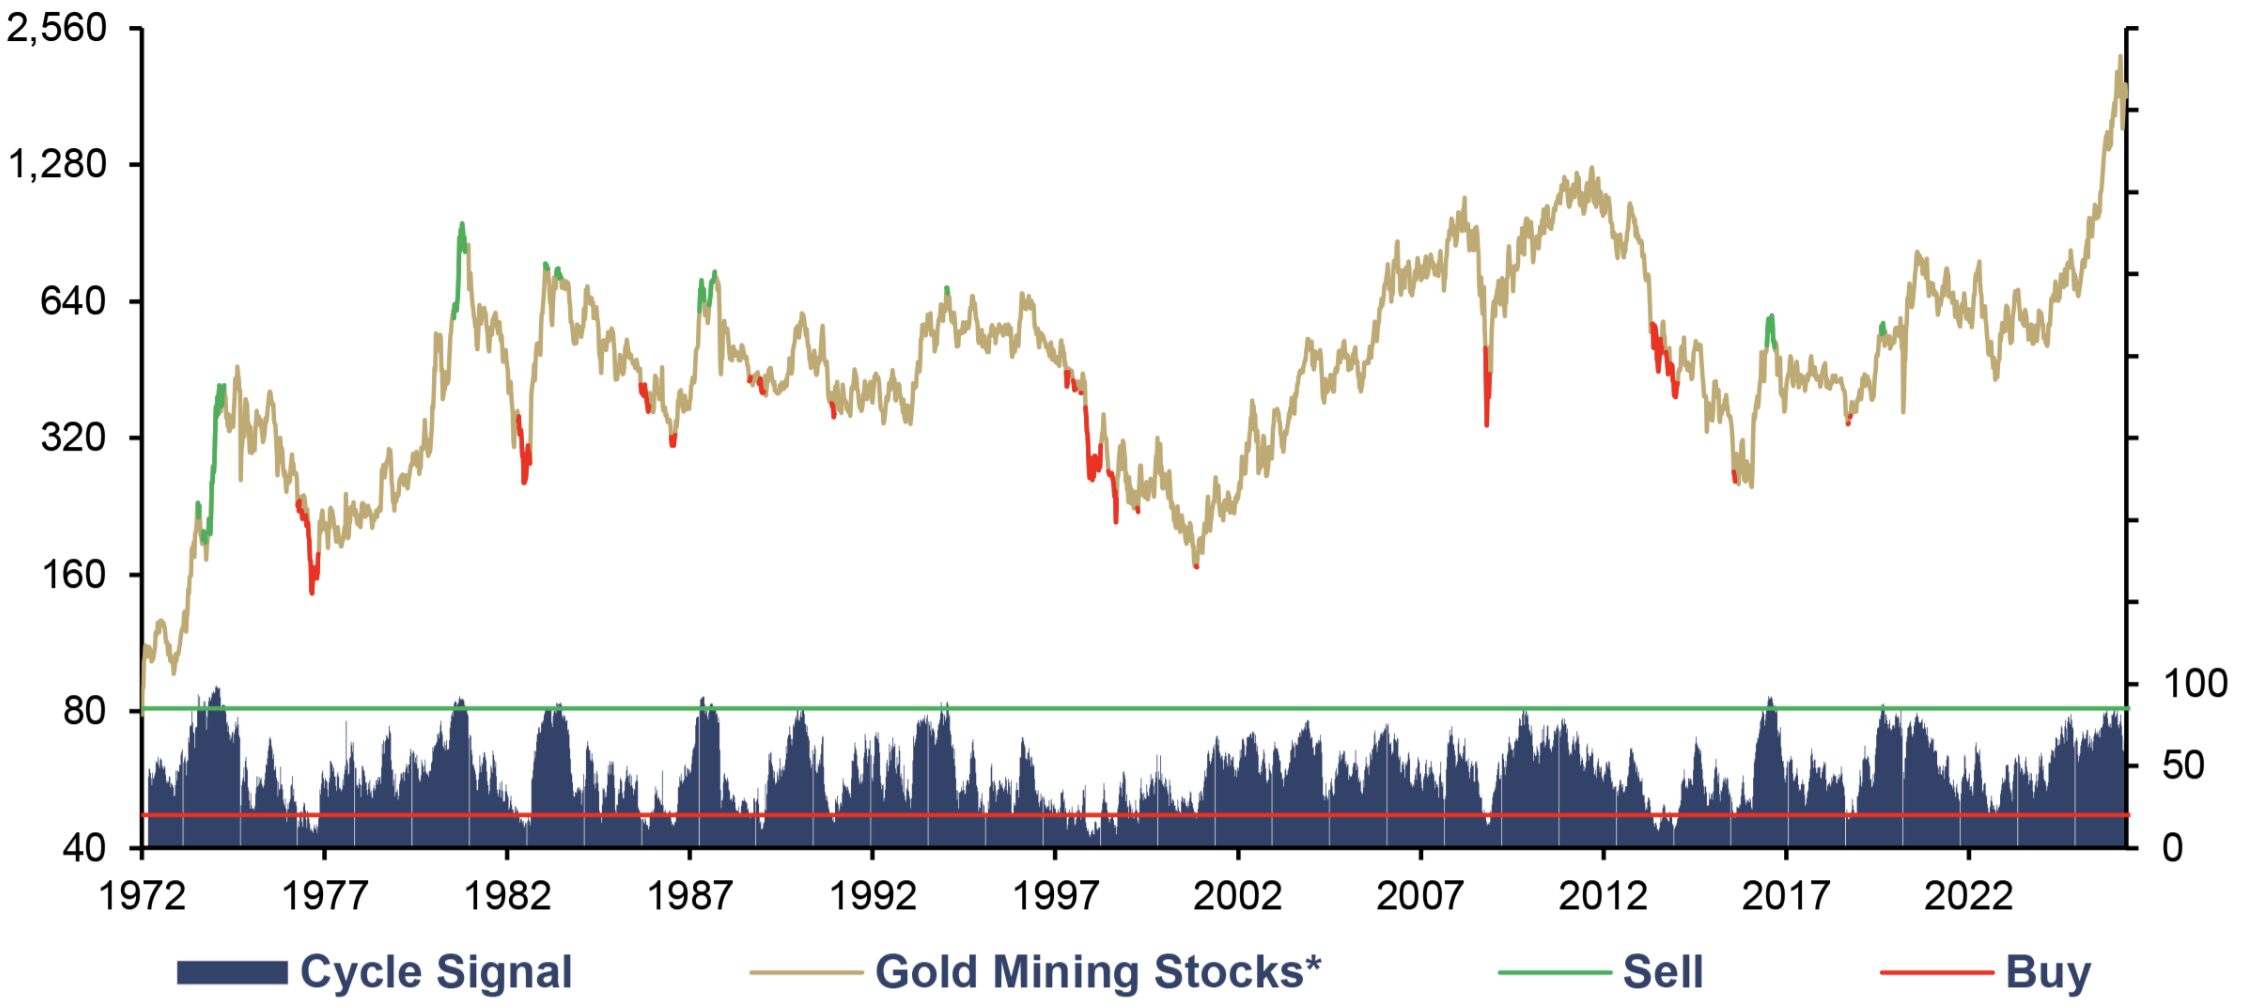
The Incrementum Active Aurum Signal consists of two subsignals: the cycle signal and the fundamental signal. The cycle signal is composed of five countercyclical components:
- Momentum: relative strength index (RSI) of gold mining stocks
- Sentiment: CFTC net gold positioning
- Risk appetite: Bollinger bands on gold mining stocks/gold ratios
- Macro environment: Treasury inflation-protected securities (TIPS)
- Boom/bust indicator: gold mining stocks relative to their moving average
All subindicators of the cycle signal oscillate between 0 and 100 and influence the cycle signal with varying weights. Together, this results in the cycle signal, which also has a value between 0 and 100. Buy or sell signals are generated when the cycle signal is above 85 (= sell signal) or below 20 (= buy signal).
Gold Mining Stocks* (lhs, log), in USD, and Cycle Signal (rhs), 01/1972–04/2026
Source: Nick Laird, LSEG, Incrementum AG
*BGMI = 01/1972–06/2006, GDX = 06/2006–
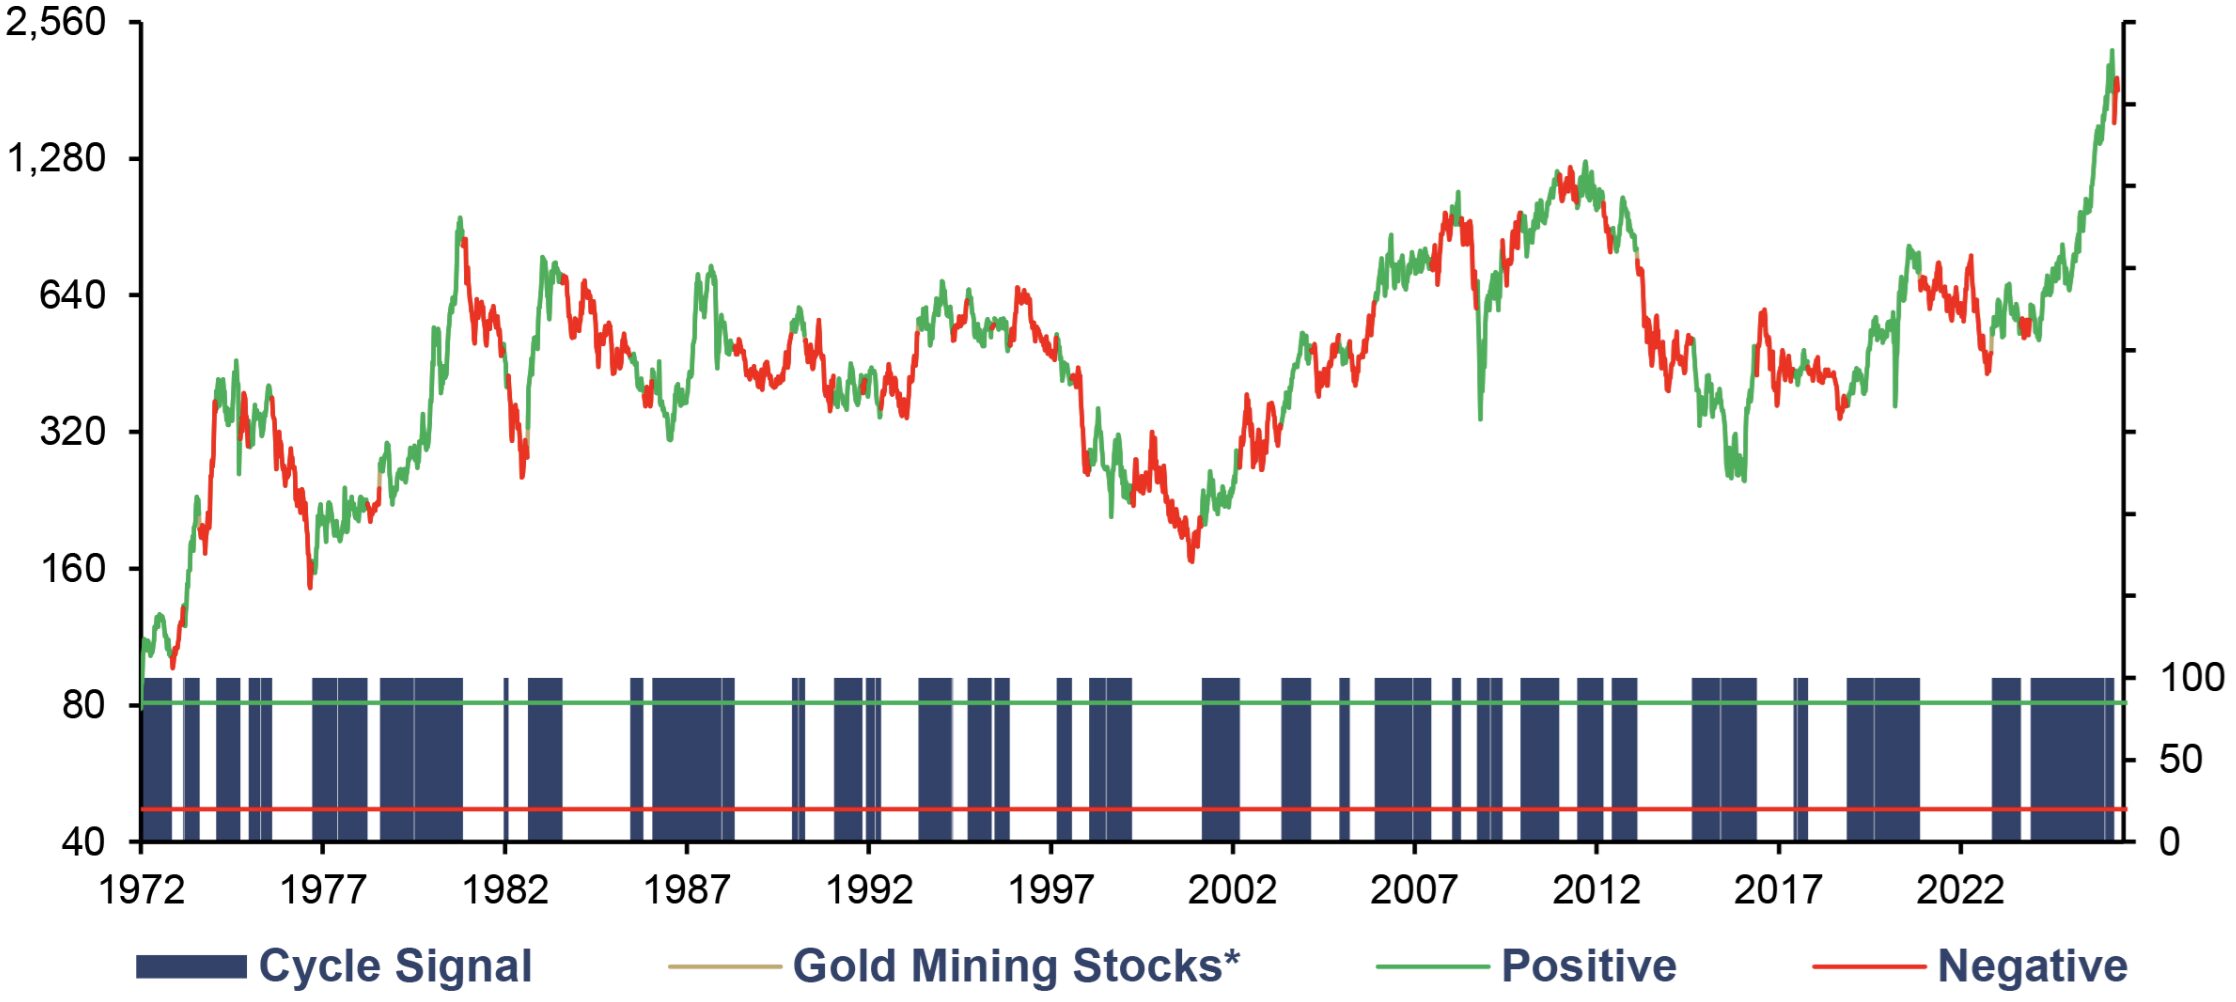
The second cornerstone of the Incrementum Active Aurum Signal is the fundamental signal, which can be understood as a procyclical market environment indicator for gold mining companies. Unlike the cycle signal, the fundamental signal has only two levels:
- 0: negative/weak fundamental environment
- 100: positive/strong fundamental environment
A value of 100 triggers a buy signal, while a value of 0 triggers a sell signal.
Gold Mining Stocks* (lhs, log), in USD, and Fundamental Signal (rhs), 01/1972–04/2026
Source: Nick Laird, LSEG, Incrementum AG
*BGMI = 01/1972–06/2006, GDX = 06/2006–
Interpretation of the signal
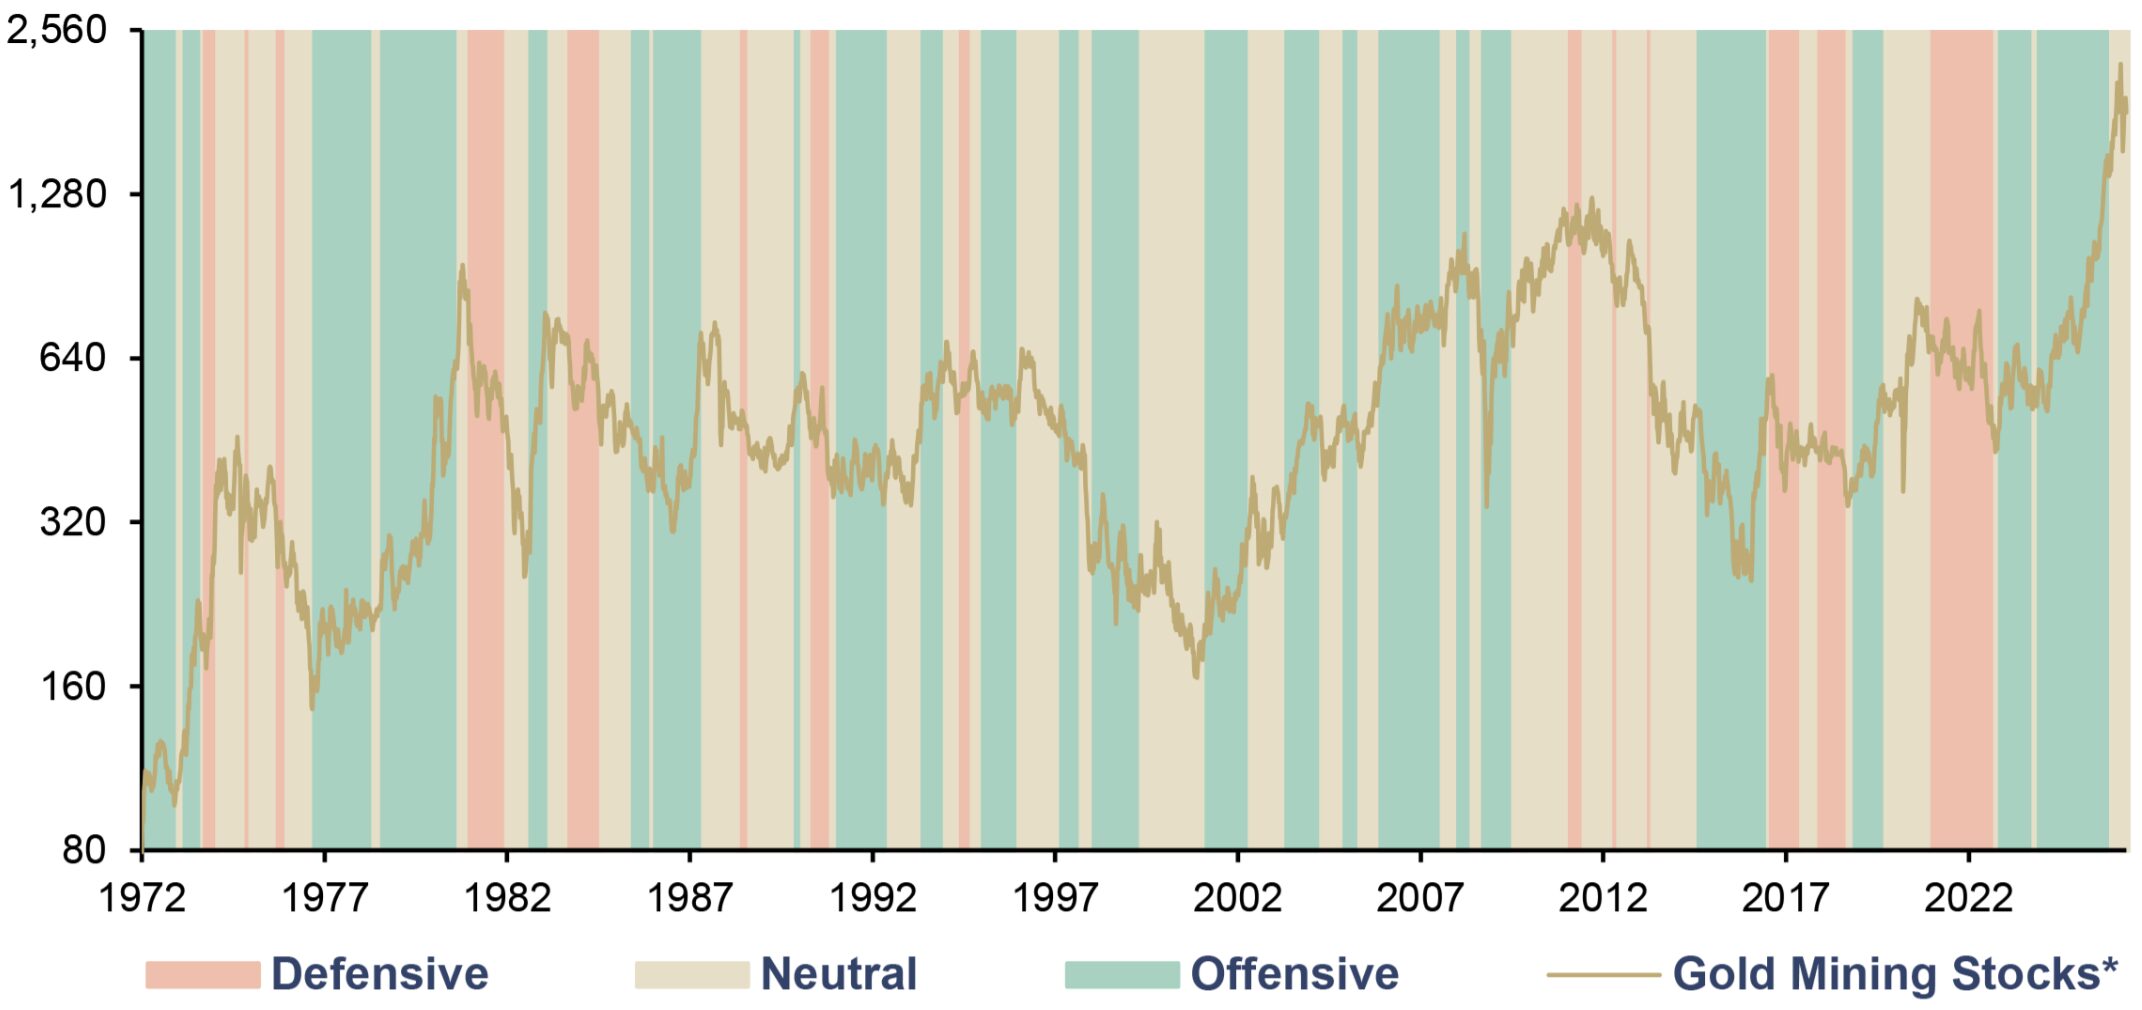
The combination of the two subsignals results in the Incrementum Active Aurum Signal, which has three levels:
- Offensive: Both subsignals are set to “buy.”
- Neutral: The two subsignals show divergent trends.
- Defensive: Both subsignals are set to “sell.”
Gold Mining Stocks* (log), in USD, and Incrementum Active Aurum Signal, 01/1972–04/2026
Source: Nick Laird, LSEG, Incrementum AG
*BGMI = 01/1972–06/2006, GDX = 06/2006–
Backtest characteristics
In backtesting since 1971, the Incrementum Active Aurum Signal indicates an average of 1.5 signal changes per year. We interpret this value as positive.
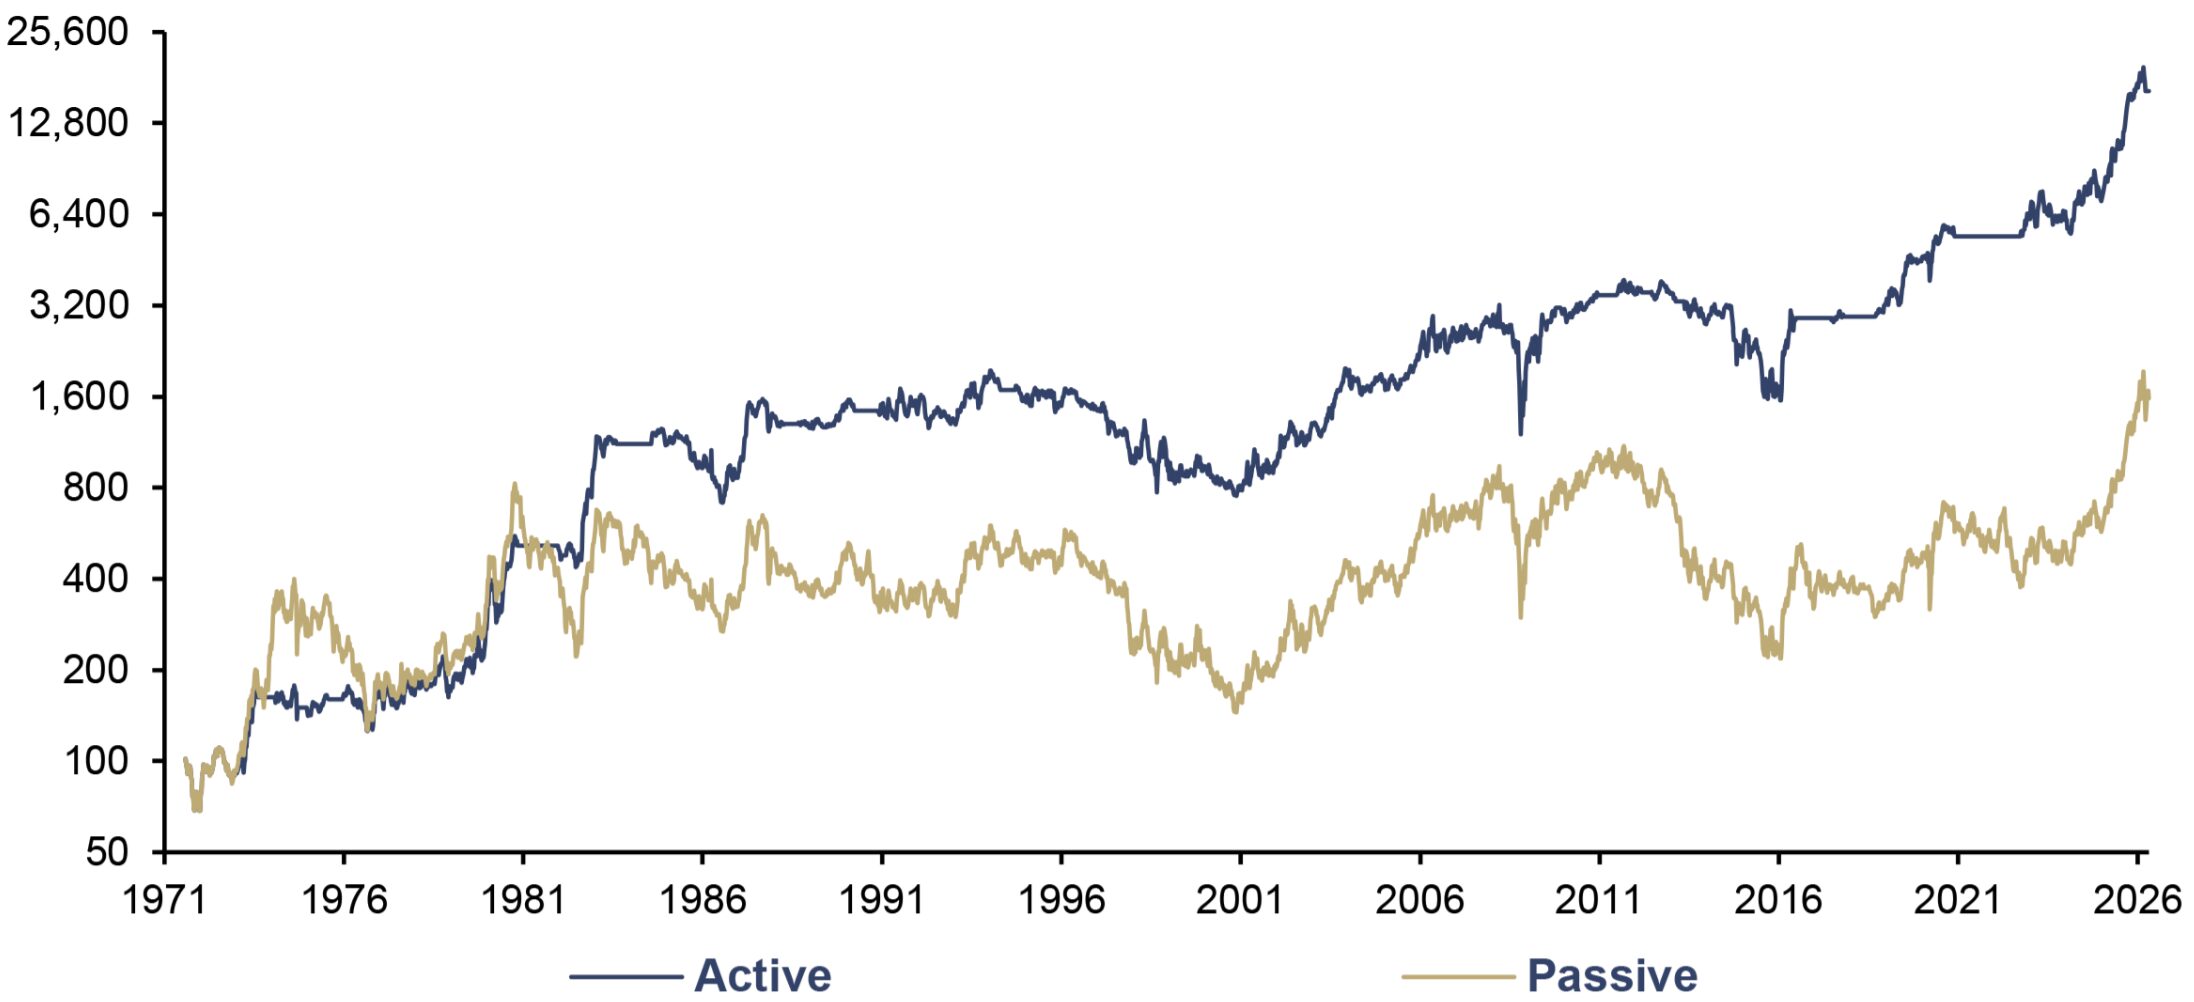
A simple backtest strategy using the Incrementum Active Aurum Signal can be implemented by investing 100% in gold mining stocks for an aggressive stance, 50% for a neutral signal, and 0% for a defensive signal. For the backtest covering 1971–2005, we used the Barron’s Gold Mining Index (BGMI) as the investment instrument, and starting in 2006, the VanEck Gold Miners UCITS ETF (GDX). While the BGMI is the oldest gold mining stock index in the world, the GDX is an investment vehicle in the gold mining sector in which the vast majority of investors globally can invest.
The key question now is: How does the performance of an active gold mining stock strategy using our Incrementum Active Aurum Signal compare to a passive strategy – that is, a strategy in which one is always 100% invested in gold mining stocks? The results speak for themselves.
Performance Comparison: Active vs. Passive Gold Mining Stocks Strategy* (log), in USD, 100 = 07/1971, 07/1971–04/2026
Source: Nick Laird, LSEG, Incrementum AG
*BGMI = 01/1972–06/2006, GDX = 06/2006–
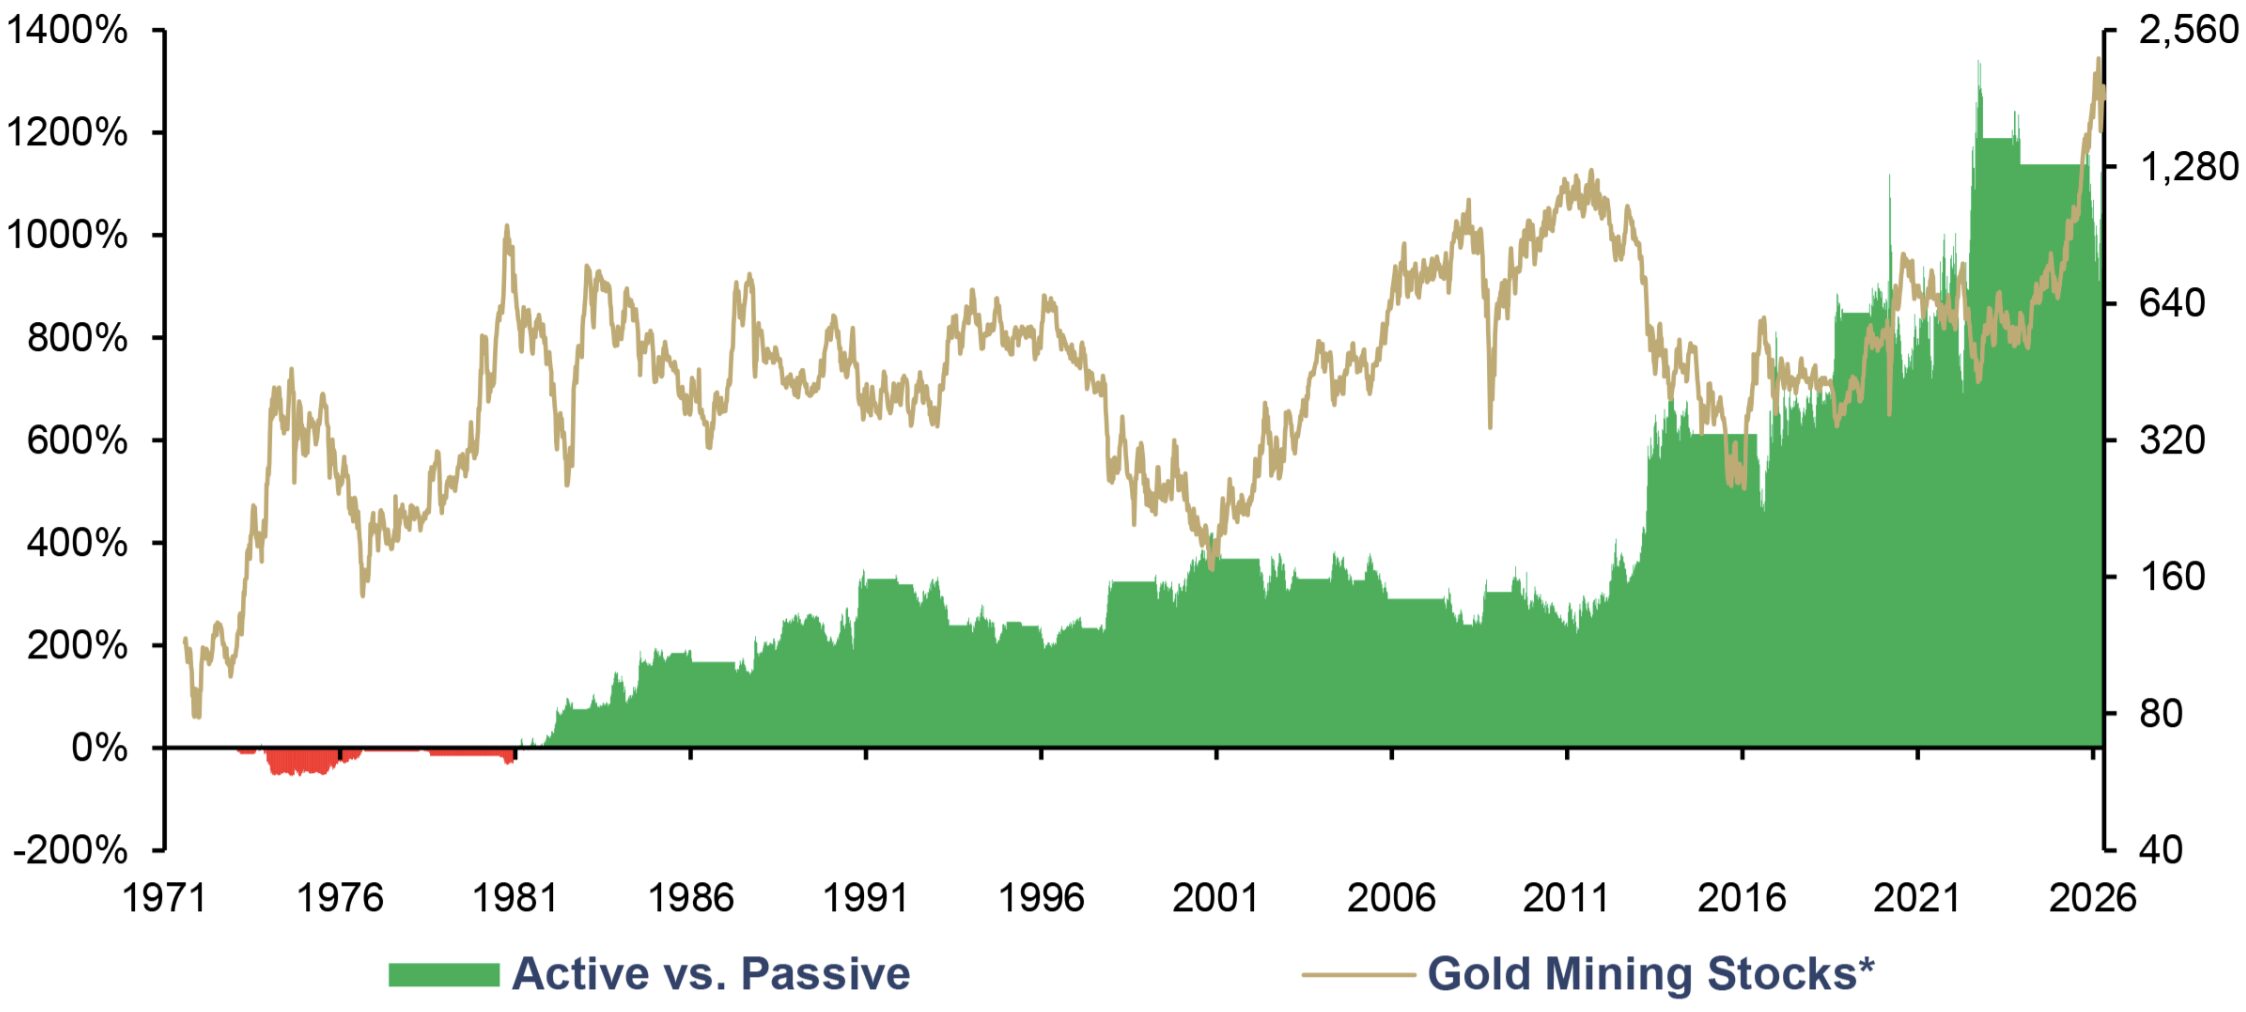
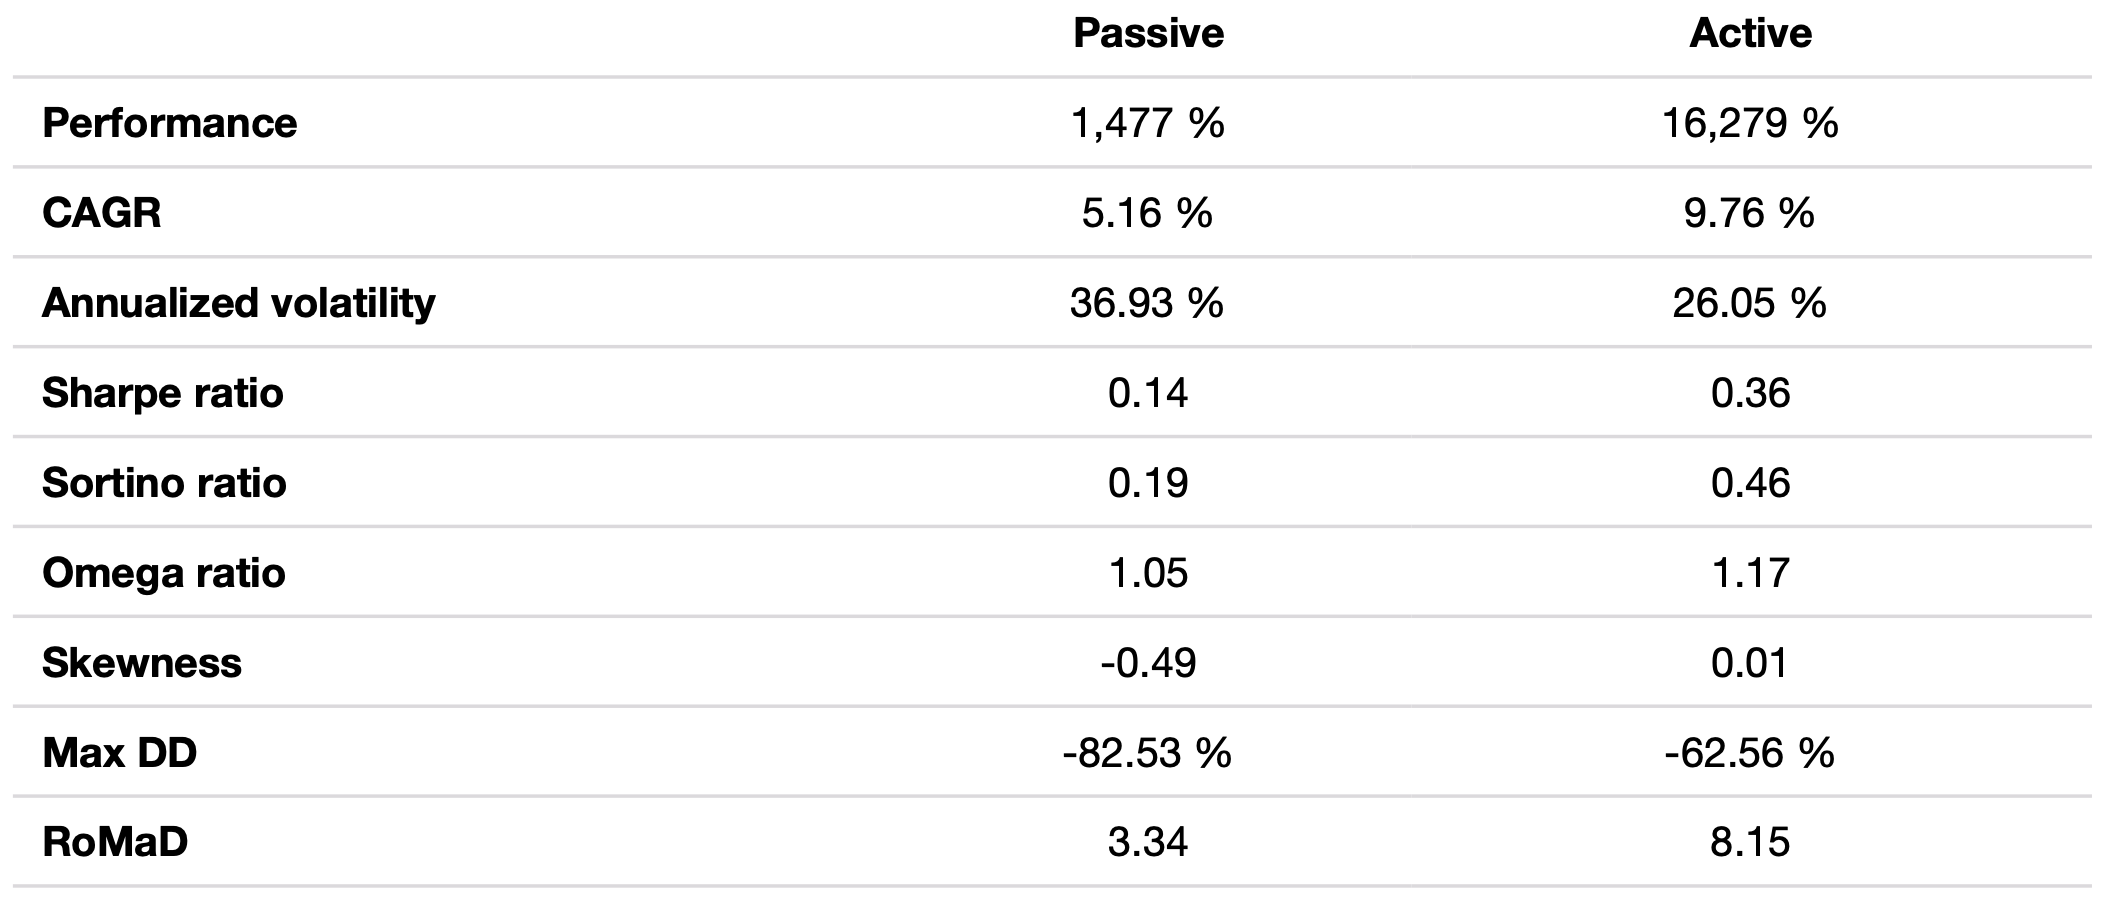
While a passive strategy has achieved a performance of approximately 1,477% (CAGR of 5.16%) since 1971, the active mining stock strategy achieved a performance of over 16,000% (CAGR of 9.76%). A positive point to note in this context is that the excess return was not achieved due to a short-term outperformance in a brief period, but rather consistently over the entire time horizon. The results of the relative performance backtest are therefore independent of the time period.
Excess Return Active vs. Passive (lhs), and Gold Mining Stocks* (rhs, log), in USD, 07/1971–04/2026
Source: Nick Laird, LSEG, Incrementum AG
*BGMI = 01/1972–06/2006, GDX = 06/2006–
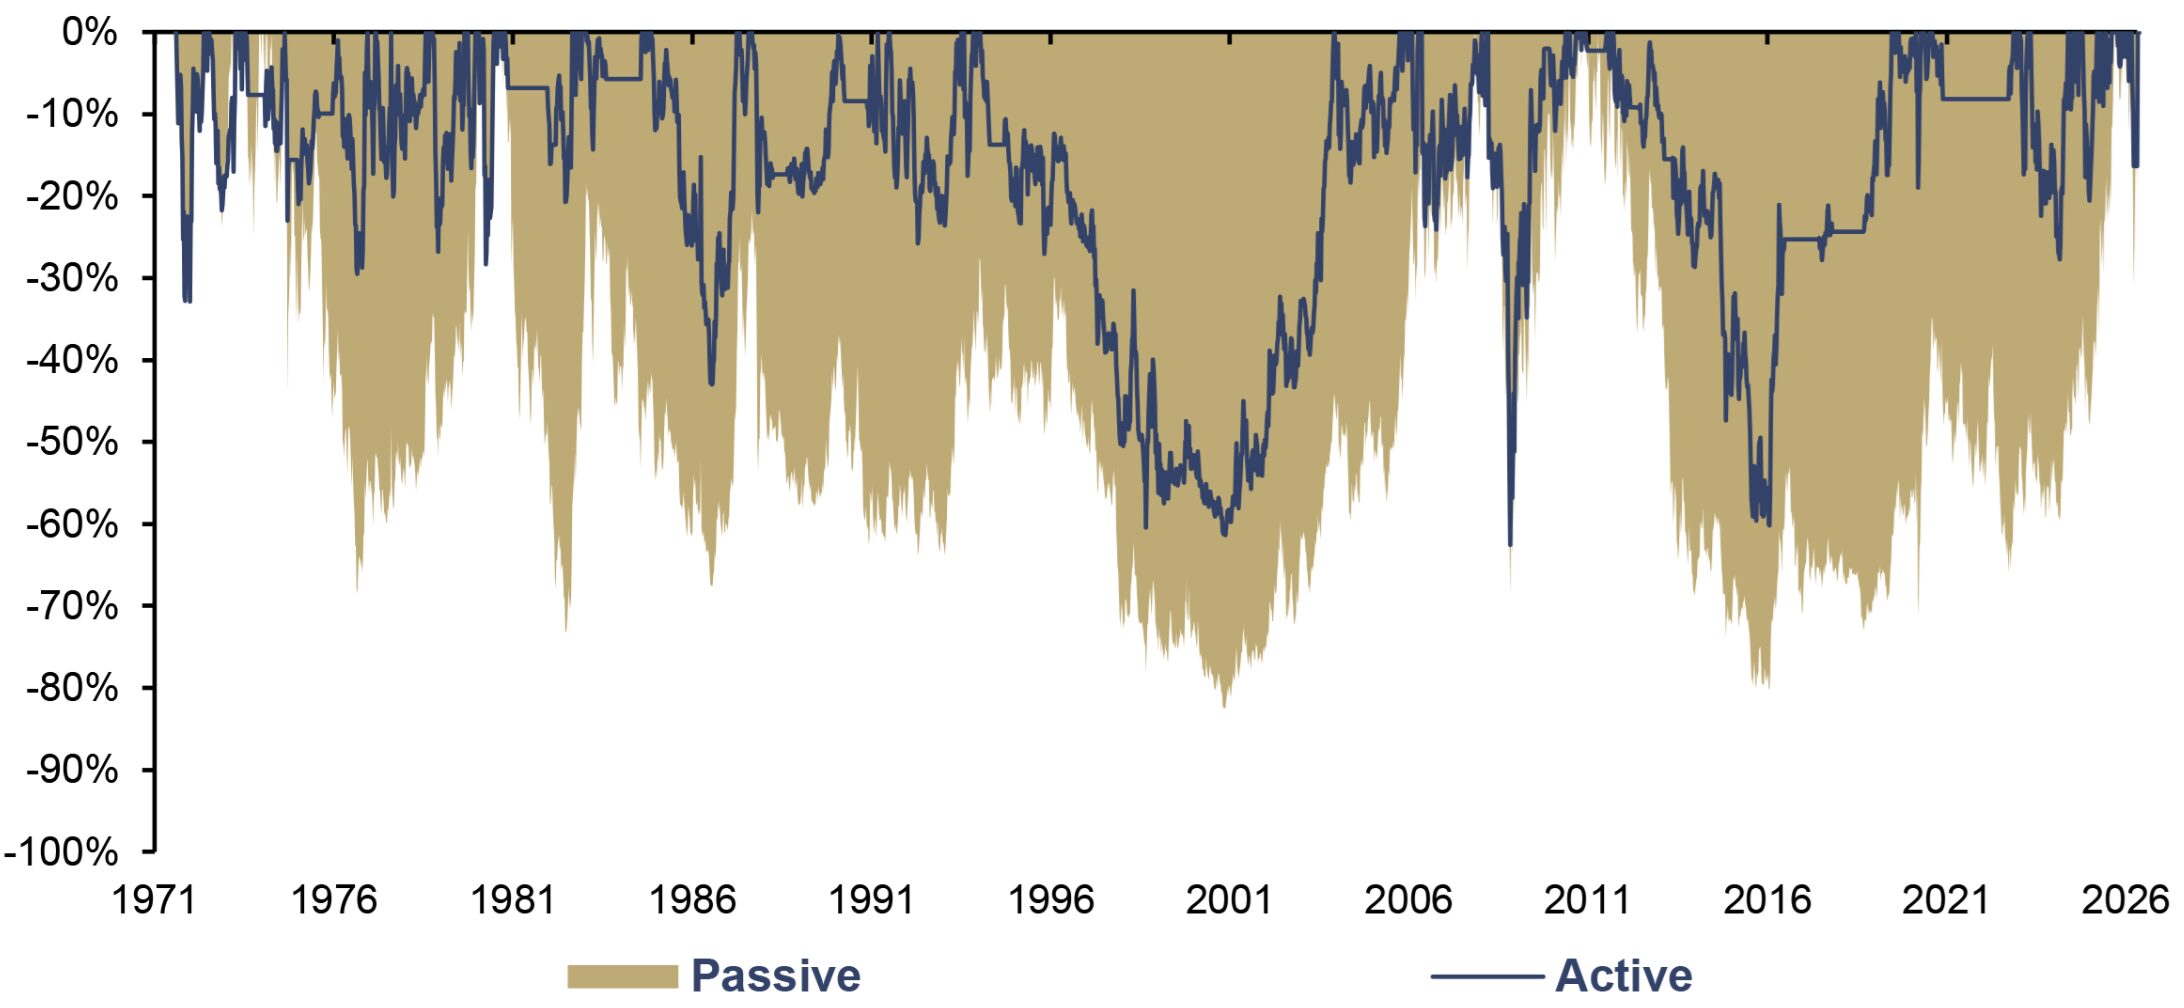
At the outset, we noted that investing in gold mining stocks may be off-putting to many investors due to their high volatility. Therefore, in the context of the backtest, it is important not only to examine performance but also to analyze risk metrics.
The next chart illustrates the drawdown comparison between a passive mining strategy and an active strategy using the Incrementum Active Aurum Signal. The result is clear: The active strategy recorded significantly lower drawdowns. Furthermore, the annualized volatility of the active strategy is 26.05%, which is ten percentage points lower than the volatility of a passive strategy (36.93%).
Drawdown Comparison: Active vs. Passive Gold Mining Stocks Strategy*, 07/1971–04/2026
Source: Nick Laird, LSEG, Incrementum AG
*BGMI = 01/1972–06/2006, GDX = 06/2006–
The results thus suggest that an active strategy supported by the Incrementum Active Aurum Signal is clearly superior to a passive gold mining stock strategy in terms of both performance and risk characteristics.
The signal enables an investment process that takes into account not only long-term market cycles but also short-term volatility and trends, in order to better align the portfolio’s exposure to gold (and gold mining stocks) with changing market conditions. In backtesting, the Incrementum Active Aurum Signal impresses with a clear outperformance relative to a passive mining stock strategy. This is illustrated by the table below, which lists both performance and risk metrics.
Passive vs. Active Mining Stock Strategy, in USD, 07/1971–04/2026
Source: Nick Laird, LSEG, Incrementum AG,
*BGMI = 01/1972–06/2006, GDX = 06/2006–
Current developments of the signal
Following an impressive rally in the precious metals sector, the Incrementum Active Aurum Signal initially shifted from offensive to neutral as of October 10, 2025. This marked the first signal change since live tracking began on January 1, 2024. During the offensive phase from December 1, 2023, to October 10, 2025, the HUI Index, calculated in USD, recorded an increase of approximately 150%. The change was based on countercyclical market overheating in the cycle signal, while the fundamental signal remained positive.
On March 20, 2026, the shift from neutral to defensive occurred. The trigger for the signal change was the significantly deteriorated market environment in the precious metals sector in the wake of the Iran war, causing the fundamental signal to turn as well. Rising energy prices are fueling new inflation concerns, driving yields higher, and making interest rate expectations more hawkish. At the same time, this creates a challenging combination for gold mining stocks. Furthermore, potential risk-off movements in the stock markets could put additional pressure on mining stocks, as their equity nature makes them sensitive to general market sentiment.
The current defensive signal should not be interpreted as a structurally negative assessment of gold and mining stocks, nor as a general sell recommendation. Rather, the signal suggests tactically reducing risk exposure in the mining sector in order to be able to act more aggressively again once conditions improve. From today’s perspective, the longer-term structural investment case for gold and mining stocks remains intact. It is precisely in this area of tension that the added value of active management – which combines strategic convictions with a disciplined, quantitative signal system – becomes apparent.
Where Are We in the Cycle? The Three Phases According to Dow and Their Application to the Mining Sector
Charles Dow described the public participation phase as the longest of the three phases of a bull market: increasing public participation, trend-confirming fundamentals, broadbased price increases – and, crucially, a rotation of capital from early-stage to late-stage asset classes. Applied to the mining sector, this means: first royalties & streamers as well as senior producers, then mid-tier, and finally junior explorers.
Gold mining bull market Dow Theory

Source: Incrementum AG
Where do we stand today? In the midst of the public participation phase. Four empirical indicators paint a consistent picture:
- The senior producers fired the opening salvo. The first 18 to 24 months of the bull market clearly belonged to the major cash flow generators – those companies that were able to convert margin expansion most directly into free cash flow.
- Mid-tier consolidation is in full swing. Gold M&A transactions reached their highest level since 2010 in 2025, totaling USD 21.2bn across 32 deals. The strategic logic is clear: acquiring reserves through mergers and acquisitions, because greenfield exploration has simply become too slow and too expensive.
- Junior financing is making a comeback. After five years of weak capital inflows, which hit a low of USD 10.27bn in 2024, a turnaround is now on the horizon. There has also been significant activity at the lower end of the market in 2025. We have seen the second-best year for financing since 2011. Through early March, 2026 looked set to be a record year, though the crisis in the Middle East has somewhat curbed investors’ risk appetite.
The diagnosis is clear. We are neither at the beginning nor the end of the public participation phase, but right in the middle of it. The rotation from seniors to midtier producers and developers has begun, but the final, loud wave toward junior explorers is still missing.
Thus, the remaining sweet spot of this bull market clearly lies with mid-tier producers, developers, and high-quality juniors. The senior producer rally from 2024 to 2025 was the opening salvo. The main act – the rotation toward late-stage leveraged classes – is yet to come.
The time lag of gold miners: 1980s vs. 2011 patterns
One of the key timing questions for mining investors is: Does the mining sector peak before or after the gold price? The historical answer is surprisingly ambiguous, as the last two secular bull markets show an exact mirror-image pattern.
1980: Mining Peak AFTER the Gold Peak. Gold reached its then-all-time high of USD 850 on January 21, 1980. The Barron’s Gold Mining Index (BGMI) followed nine months later, on October 17, 1980, at around 1,285 points. While gold corrected by 41% between January and April 1980, the BGMI began a six-month rally in April and nearly doubled – even though the gold price had already fallen well below its January high. A textbook example of mania distribution: General investors jump in late and concentrate their purchases on mining stocks because that’s where the biggest returns beckon in the final crescendo.
2011: Mining Stocks Peaked BEFORE Gold. During the 2000s bull market, the pattern was reversed. The HUI hit its all-time high as early as April 2011, at around 638 points. Gold didn’t follow suit until five months later, reaching a price of USD 1,921 in September 2011. The miners thus began their bear market while gold was still in its final upward move. The result was brutal: The HUI lost 83% by January 2016, while gold lost “only” 45%.
The two scenarios could hardly be more different. In 1980, the market was dominated by cost-disciplined, debt-free, high-grade producers – South African underground mines and North American Tier-1 projects – that participated in the gold price without leverage. In 2011, by contrast, the industry was deep in a phase of ill-timed mega-acquisitions, extrapolated reserve prices, and runaway capex programs. The margin story was overshadowed by structural balance sheet and governance issues – and the market discounted this discrepancy before the gold price correction even began.
The lesson for today: With net-cash balance sheets, hedging restraint, conservative reserve price assumptions, and strong capital discipline, the mining sector of 2026 structurally resembles the disciplined 1980s setup far more than the overly optimistic 2011 setup. If this parallel holds, miners will not peak before gold, but after it. Even if gold reaches its cyclical peak in the coming quarters, mining outperformance could continue for another six to twelve months – and it was precisely this distribution phase that was the most profitable period of the entire cycle in 1980.
The relative valuation of miners
Gold stocks are historically attractively valued, whether measured by net asset value, production, reserves, or book value. But let’s now look at the relative valuation of mining stocks.
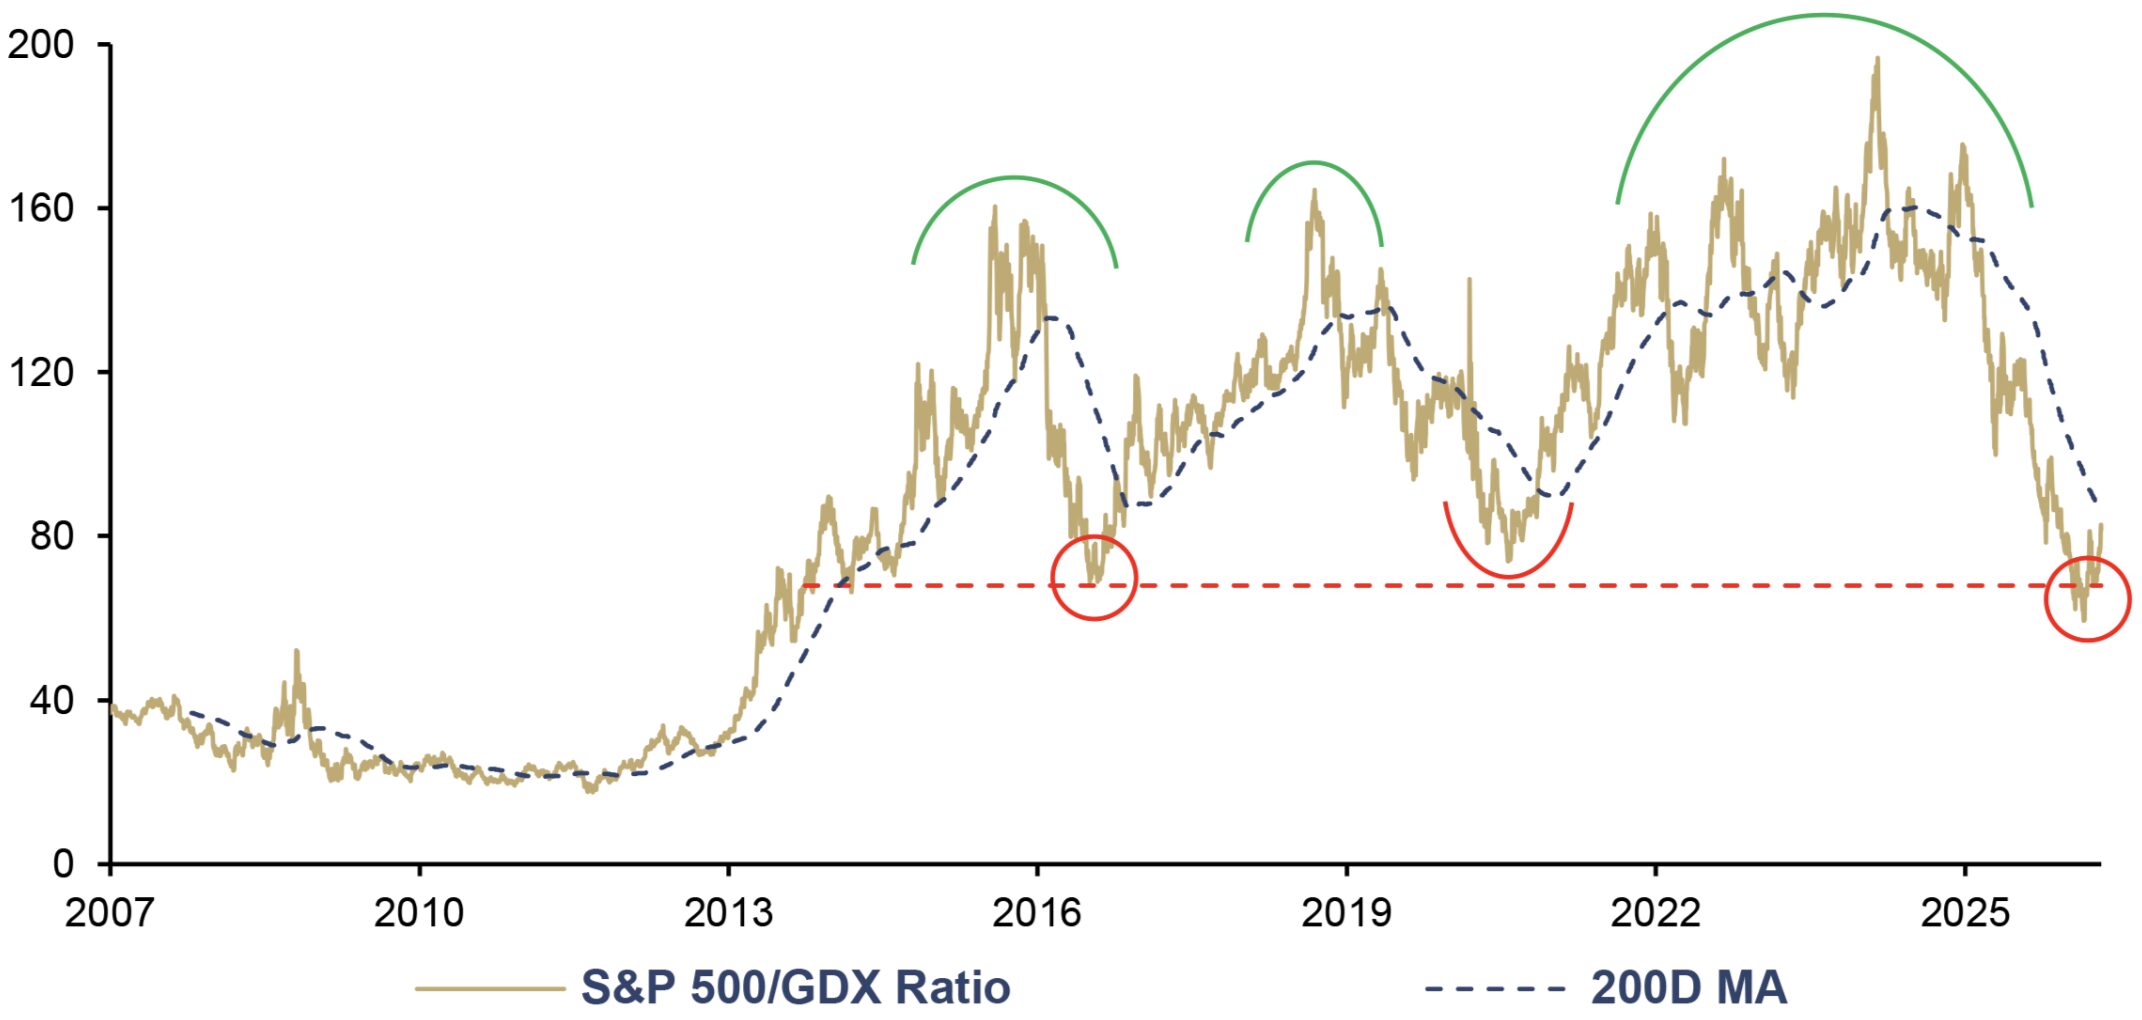
he first chart illustrates the relative strength of gold mining stocks compared to the S&P 500. After years of relentless underperformance, the miners have regained the initiative since early 2025 and pushed the ratio down to around 76 – a level last seen in early 2016. The ratio is now trading well below its 200-day moving average. Nevertheless, we are still far from the historical extreme: At the end of the last major gold cycle, the ratio bottomed out at 18.
S&P 500/GDX Ratio, 01/2007–04/2026
Source: LSEG, Incrementum AG
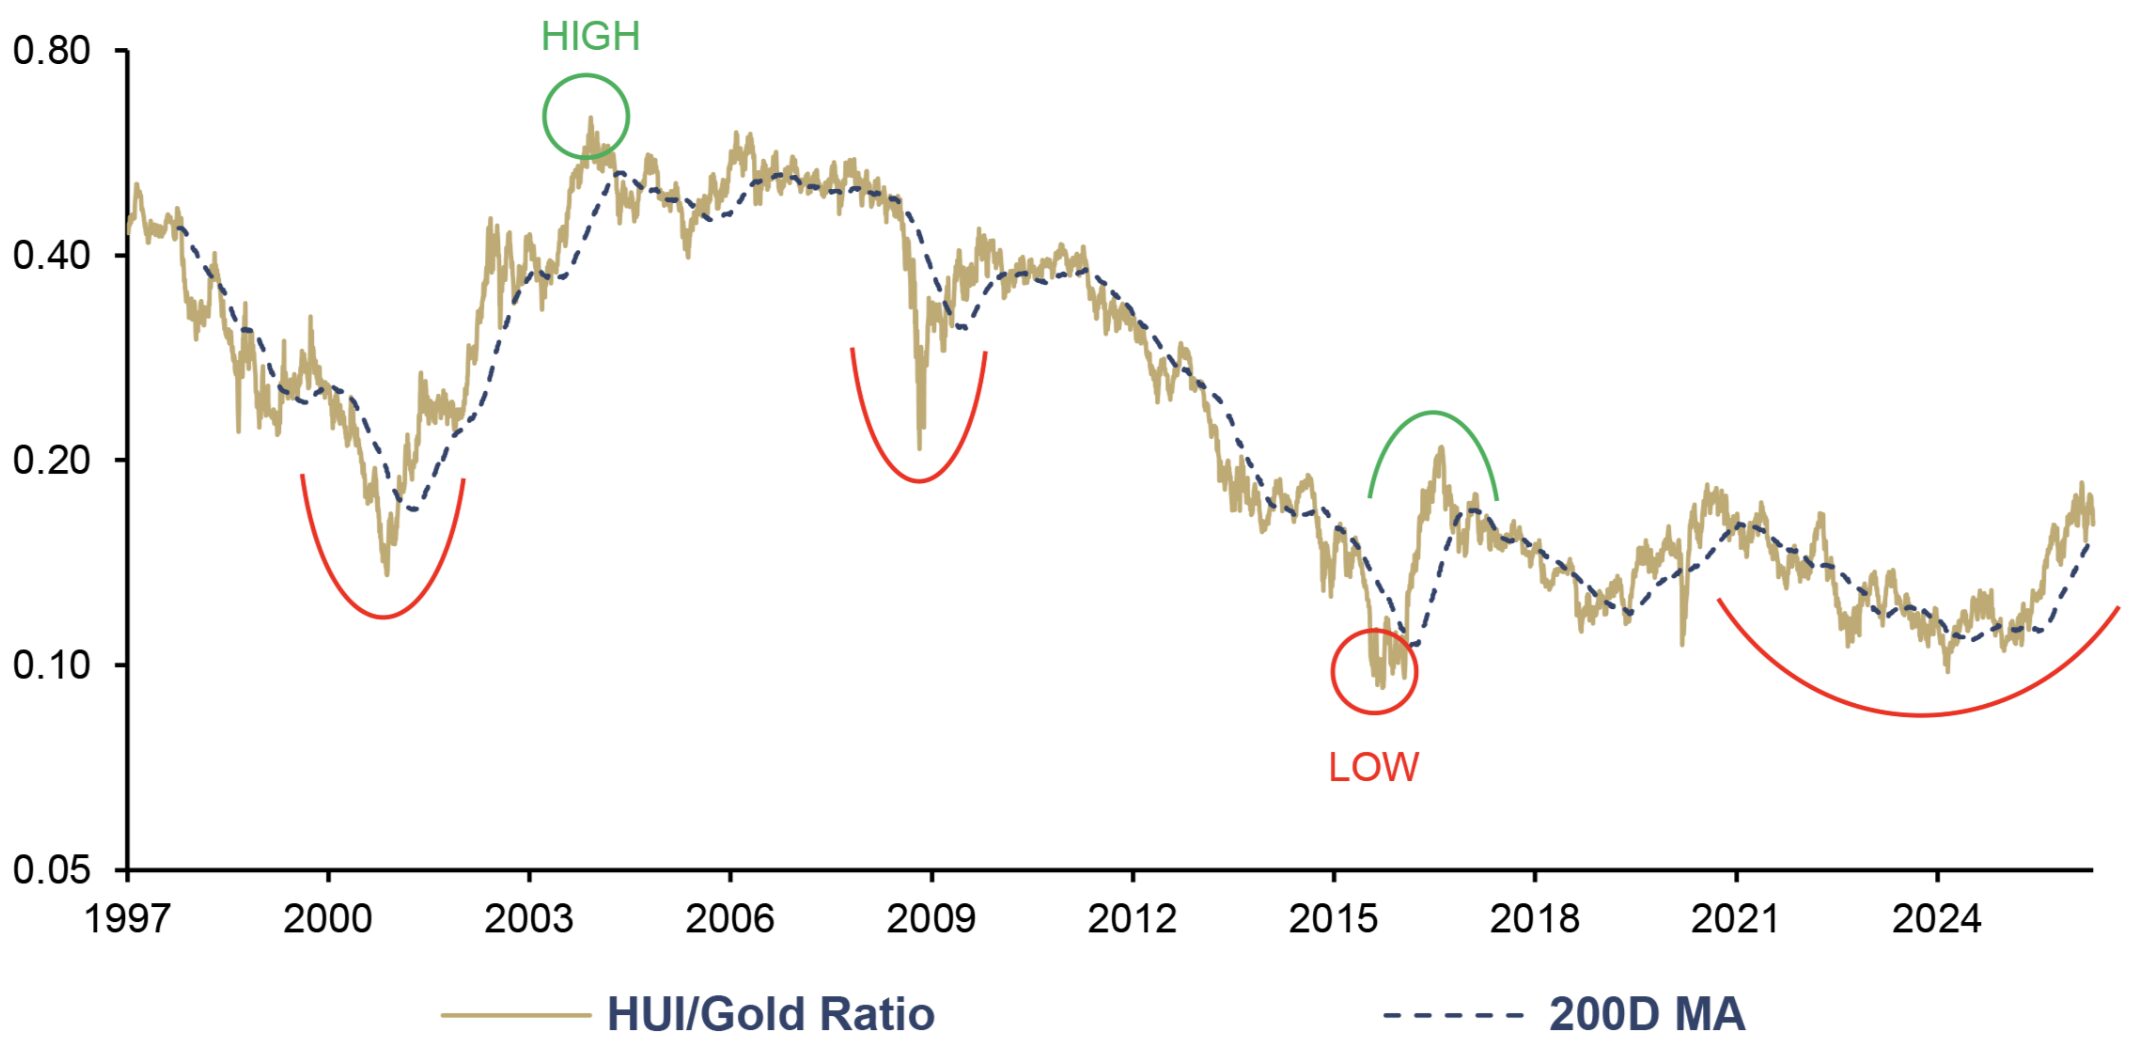
The HUI/gold ratio paints a remarkable picture: Currently at around 0.11, it is trading well below the long-term average of 0.28. To put this in context: At its peak, the ratio stood at 0.64, and at its 2015 low around 0.10 – so we are currently near the low point. A simple mean reversion to the historical average would imply a doubling of the relative valuation; a rise to the previous high would imply a sixfold increase. Despite record free cash flows, net cash balance sheets, and a 6.5-fold expansion in margins since 2015, the market continues to price miners as if the last decade had never happened.
HUI/Gold Ratio, 01/1997–04/2026
Source: LSEG, Incrementum AG
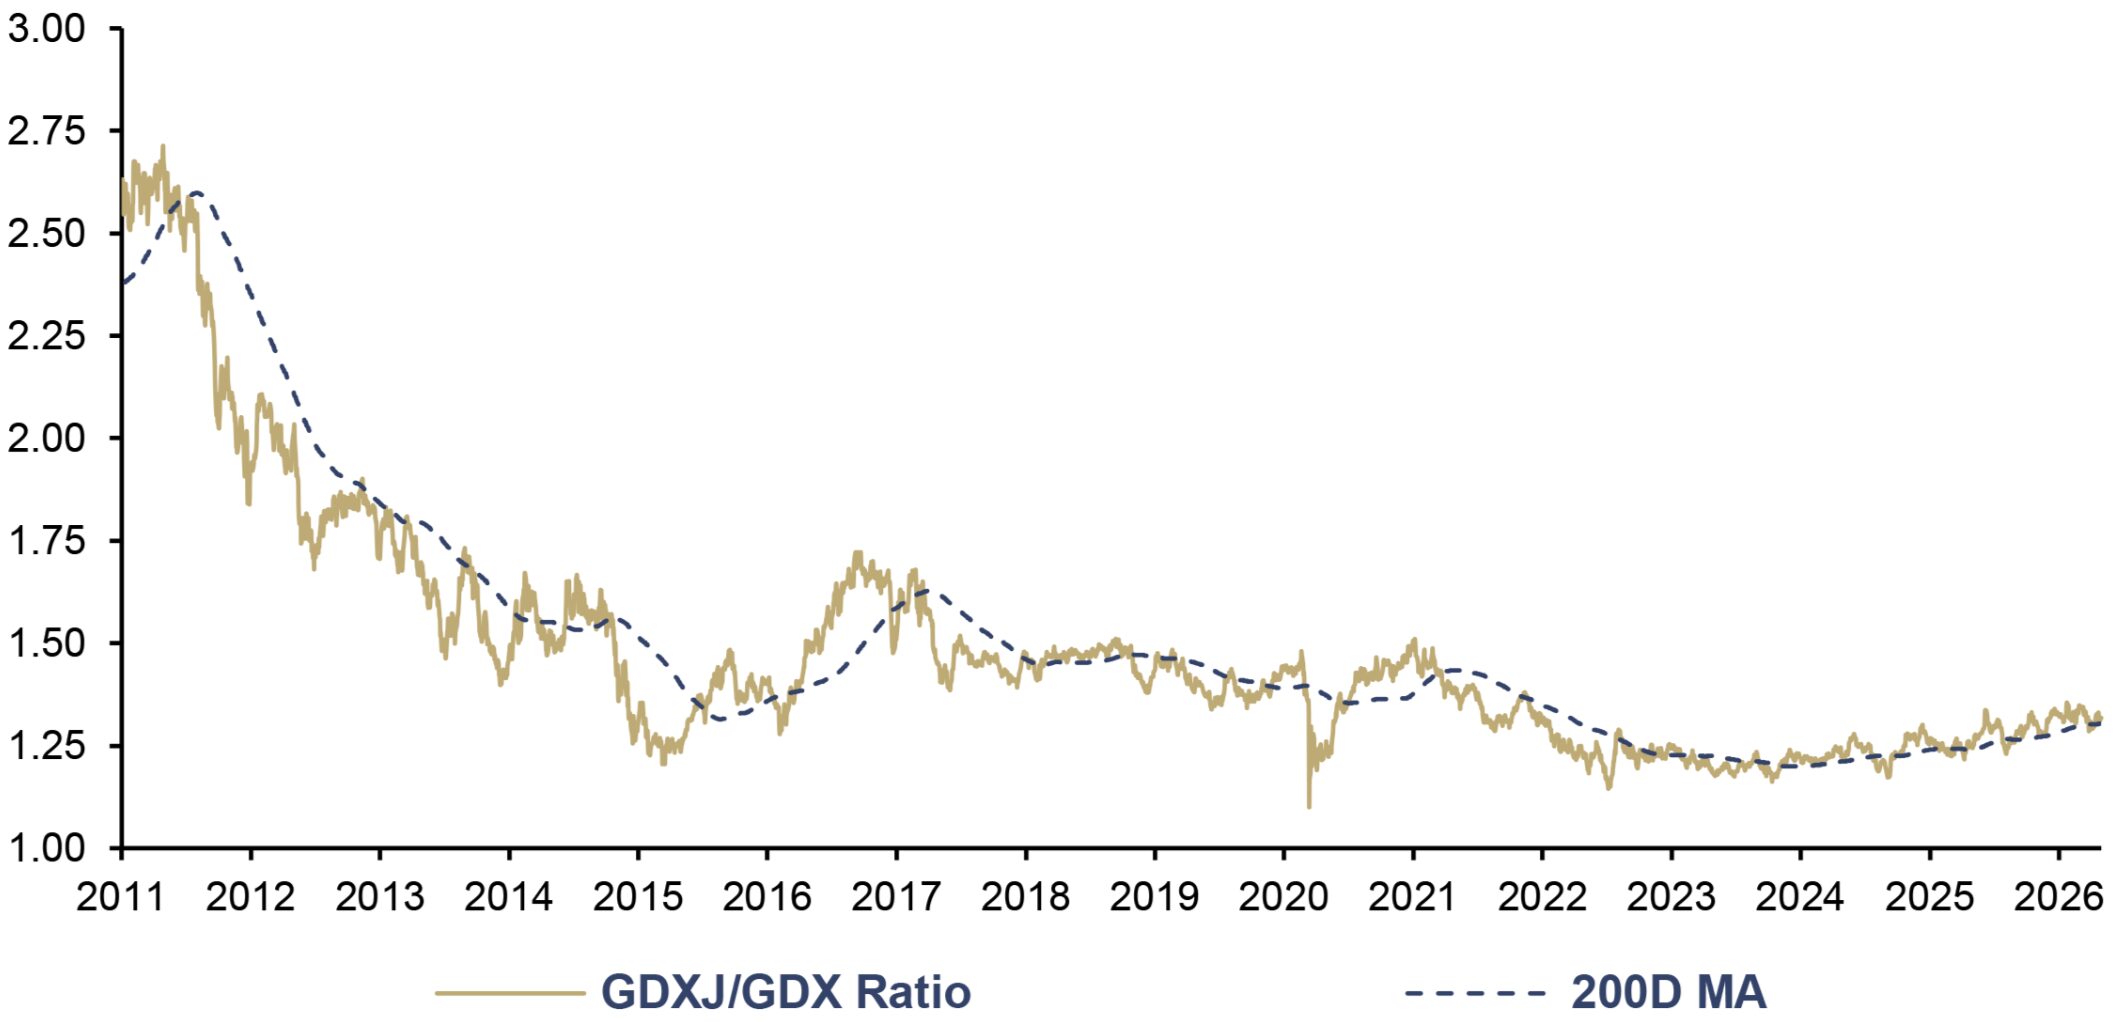
While senior producers (GDX) have rallied massively in recent quarters, junior miners (GDXJ) are still lagging behind their big brothers. The GDXJ/GDX ratio is trading at around 1.30, near its structural low – almost 50% below the level at the start of the observation period in 2011. Since 2024, however, a cautious trend reversal has emerged: The juniors are slowly gaining relative strength. As we transition into the public participation phase, the structural underweighting of the juniors is thus what it historically tends to be: a setup for disproportionate catch-up rallies.
GDXJ/GDX Ratio, 01/2011–04/2026
Source: LSEG, Incrementum AG
Conclusion: Bull Market, Not a Bubble
Last year, in the chapter “Performance Gold – Is It Time for Mining Stocks?”, we wrote:
…we expect mining stocks – and their shareholders – to reap a rich harvest over the next few years after a grueling dry spell. However, it is now up to the sector to deliver on the promises made in recent years and build new investor confidence.
This has come to pass and has rewarded patient investors with substantial price gains.
The industry has learned from the trauma of the last cycle – McKinsey estimates the value destruction from 2003–2012 at around USD 500bn, primarily due to top-of-themarket acquisitions and oversized capex programs. This time is different. Where greenfield gigantism, balance sheet leverage, and double-digit shareholder dilution used to be the order of the day, operational efficiency, solid balance sheets, and transparent dividend policies now reign supreme. What looks like a consolidation boom is, in reality, the rational response to a secular shortage of reserves: Incremental, capital-efficient ounces beat the spectacular greenfield bet as a growth strategy.
The aggregate figures speak for themselves. The top 10 precious metal producers tripled their free cash flow within a year – from around 9bn (2024) to just under 27bn (2025). With an expected AISC margin of around USD 3,000 per ounce – a historic level of profitability. The margin leverage, which the GDX profitability chart has already made visible, translates directly into free cash flow. Despite this profitability, the sector remains a minnow in absolute terms.
Market Capitalization (log), in USD bn, 05/2026
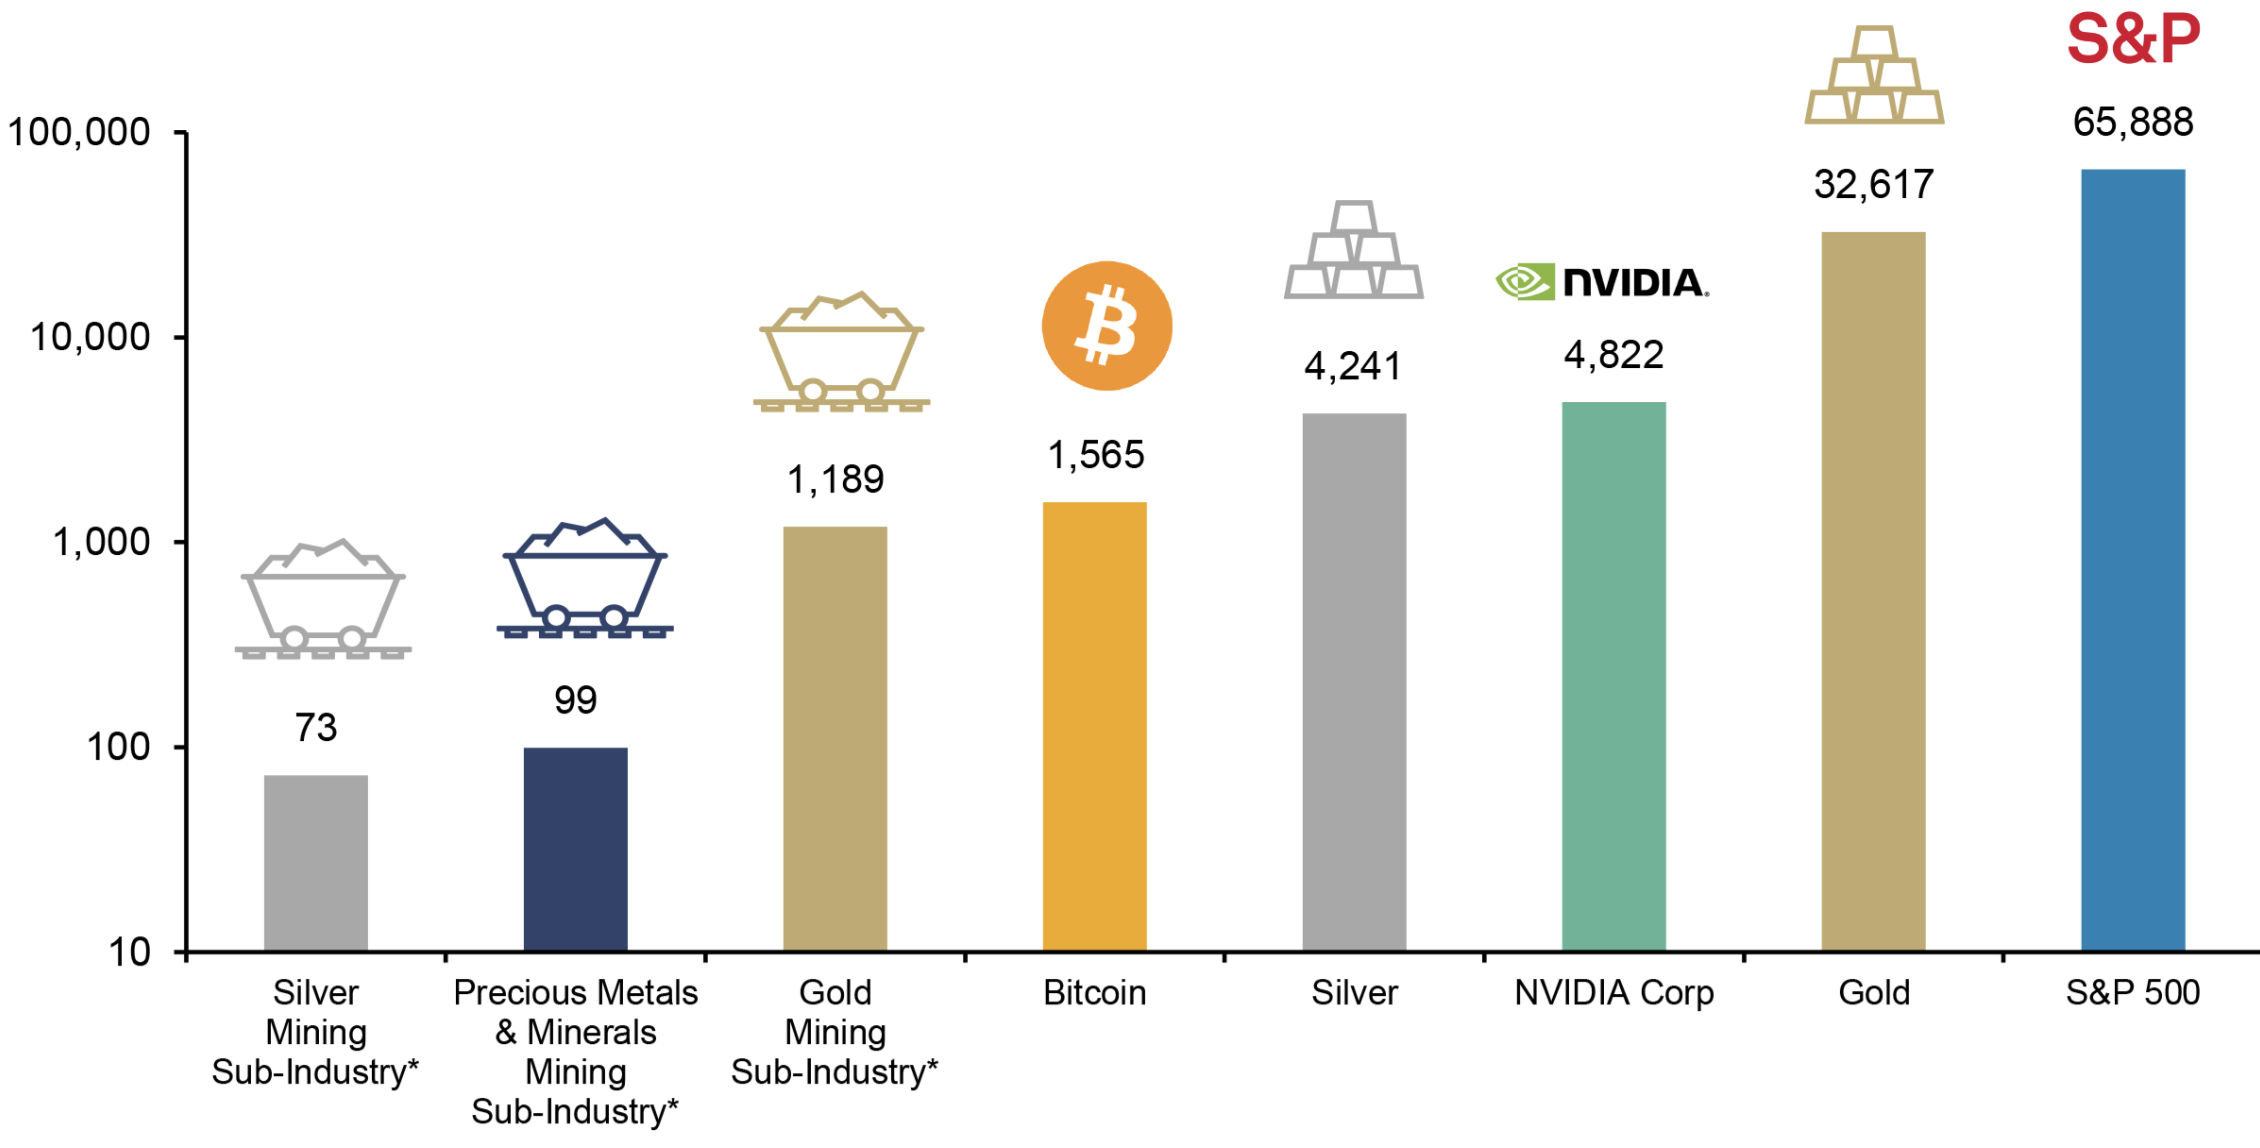
Source: CoinMarketCap, CompaniesMarketcap.com, Wikipedia, World Gold Council, LSEG, Incrementum AG, *GICS classification (Global Industry Classification Standard)
Added to this is a hidden option right. While reserve prices in the planning models have been raised – senior companies are counting on around USD 1,760 per ounce, intermediates on USD 1,840 per ounce – both figures are dramatically below the 2025 spot average of around USD 3,432 per ounce. What looks like caution is in fact a massive call option on higher gold prices: If the spot price continues to rise, millions of ounces will move from the resource to the reserve category – without a single additional meter of drilling being required.
So the question is no longer whether the industry can deliver. It is delivering. The only question now is when the market will take note. Because despite its spectacular performance, the gold mining sector remains about as popular with investors as a debate on wealth taxes at a private equity conference.
In our view, a balanced allocation in a mid-to-late bull market would include the following breakdown:
- 40–50% royalty and senior producers – stable cash flow core
- 30–35% mid-tier producers – the sweet spot of the phase 2b/2c
- 15–20% junior developers in Tier 1 jurisdictions – asymmetric upside
- 5–10% speculative explorers – highest leverage, highest risk
This allocation combines cash flow stability with asymmetric upside potential.
Sir John Templeton’s famous dictum goes: “Bull markets are born on pessimism, grow on skepticism, mature on optimism, and die on euphoria.” Applying this litmus test to today’s mining sector, the diagnosis is clear: We are far from euphoria. Generalist allocation remains marginal, institutional positioning defensive; no mining CEO has graced a Time cover yet. At cocktail parties, people talk about AI – not gold mines.
Bull market, not bubble.
[1] This proprietary signal supports the weightings of the Incrementum Active Gold Strategy.