Urban Mining for Gold and Silver
“We were into recycling before recycling was cool.”
Anthony Pratt
- The importance of gold and silver recycling is often underestimated. Around 25% of the global gold supply and approximately 18% of the silver supply come from recycling.
- The most significant source of gold recycling is jewelry, accounting for 90%, while for silver it is the industrial sector. Naturally, the major gold refiners also play a crucial part in gold recycling.
- Price is the key factor influencing the recycling supply, with jewelry being particularly sensitive. Silver recycling is less price-sensitive and mostly driven by industrial demand.
- Since 2015, scrap gold has represented a steady share of around 25% of the global gold supply. The current scrap gold ratio of 27.5% falls significantly short of pre-2015 levels. This comparatively modest increase despite record gold prices can be interpreted as a fundamental shift in gold owners’ perception of the metal.
- Gold recycling is more flexible, faster, and more sustainable than mining, with savings of up to 90% in CO2 Recycling therefore significantly reduces the ecological footprint of gold in particular.
- The recyclability of gold – and the large volumes in which it is recycled – highlights its environmental benefits. In other words, gold is far too valuable to be used only once.
The sharp rise in gold prices over recent years has greatly boosted the metal’s popularity. While publications and search queries around gold have multiplied, gold recycling has remained under the radar. In the following, we explore gold and silver recycling in more detail, from precious metals urban mining to the various steps within the recycling process, examining the ecological benefits of recycling, analyzing key drivers of global recycling dynamics, and shining a light on key players.
In 2023, recycled gold increased by 8.6%, followed by a 10.9% increase in 2024. This coincided with gold price surges of 13.1% in 2023 and 27.2% in 2024. In absolute terms, 1,370 t were recycled in 2024, compared to 1,234 t in 2023 and 1,163 t in 2022. The 2024 figure surpassed the previous high of the 2010s, which stood at 1,276 t in 2019. This trend is unsurprising – recycling has become considerably more profitable, offering higher returns for those who recycle gold from old jewelry, electronics, or other sources.
Recycling has temporarily boosted gold supply, but its role remains secondary to mining. Still, price rallies drive investor interest and reinforce gold’s role as an inflation hedge.

Source: World Gold Council, Incrementum AG
Urban Mining
Urban mining refers to reclaiming valuable materials, such as gold and silver, from urban waste streams, including electronic waste (e-waste), old jewelry, and other discarded items. It represents a sustainable approach to recovering resources that would otherwise be lost or disposed of, while also reducing the environmental impact of traditional mining. The World Gold Council employs a strict definition of “recycled gold as that sold for cash by consumers or other supply-chain players, such as jewelry manufacturers that sell old stock”. This definition, however, excludes gold involved in gold exchanges at jewelry stores, as well as manufacturing residue or new scrap.
One advantage of silver and gold is that they can be melted down repeatedly without compromising on quality. This remarkable feature enhances their sustainability profile compared to most other investment choices.
Urban mining – gold
A significant portion of the global gold supply – approximately 25% – stems from recycled gold, with the remainder primarily sourced from traditional mining. Over recent years, looking at the annual supply statistics, this ratio has remained relatively stable despite considerable fluctuations in gold prices. This stability results from the fact that mine production has also increased during this period. Nevertheless, the relative contribution of recycled gold to total annual supply increased from 23.9% in 2022 to 27.5% in 2024, a 15% relative increase in scrap gold’s share of the total annual gold supply.
Before 2015, scrap gold peaked at 42% of supply (2009). After the financial crisis, the price-recycling link weakened briefly but resumed at lower levels post-2012.
Recycled Gold, as % of Supply, 2004–2024
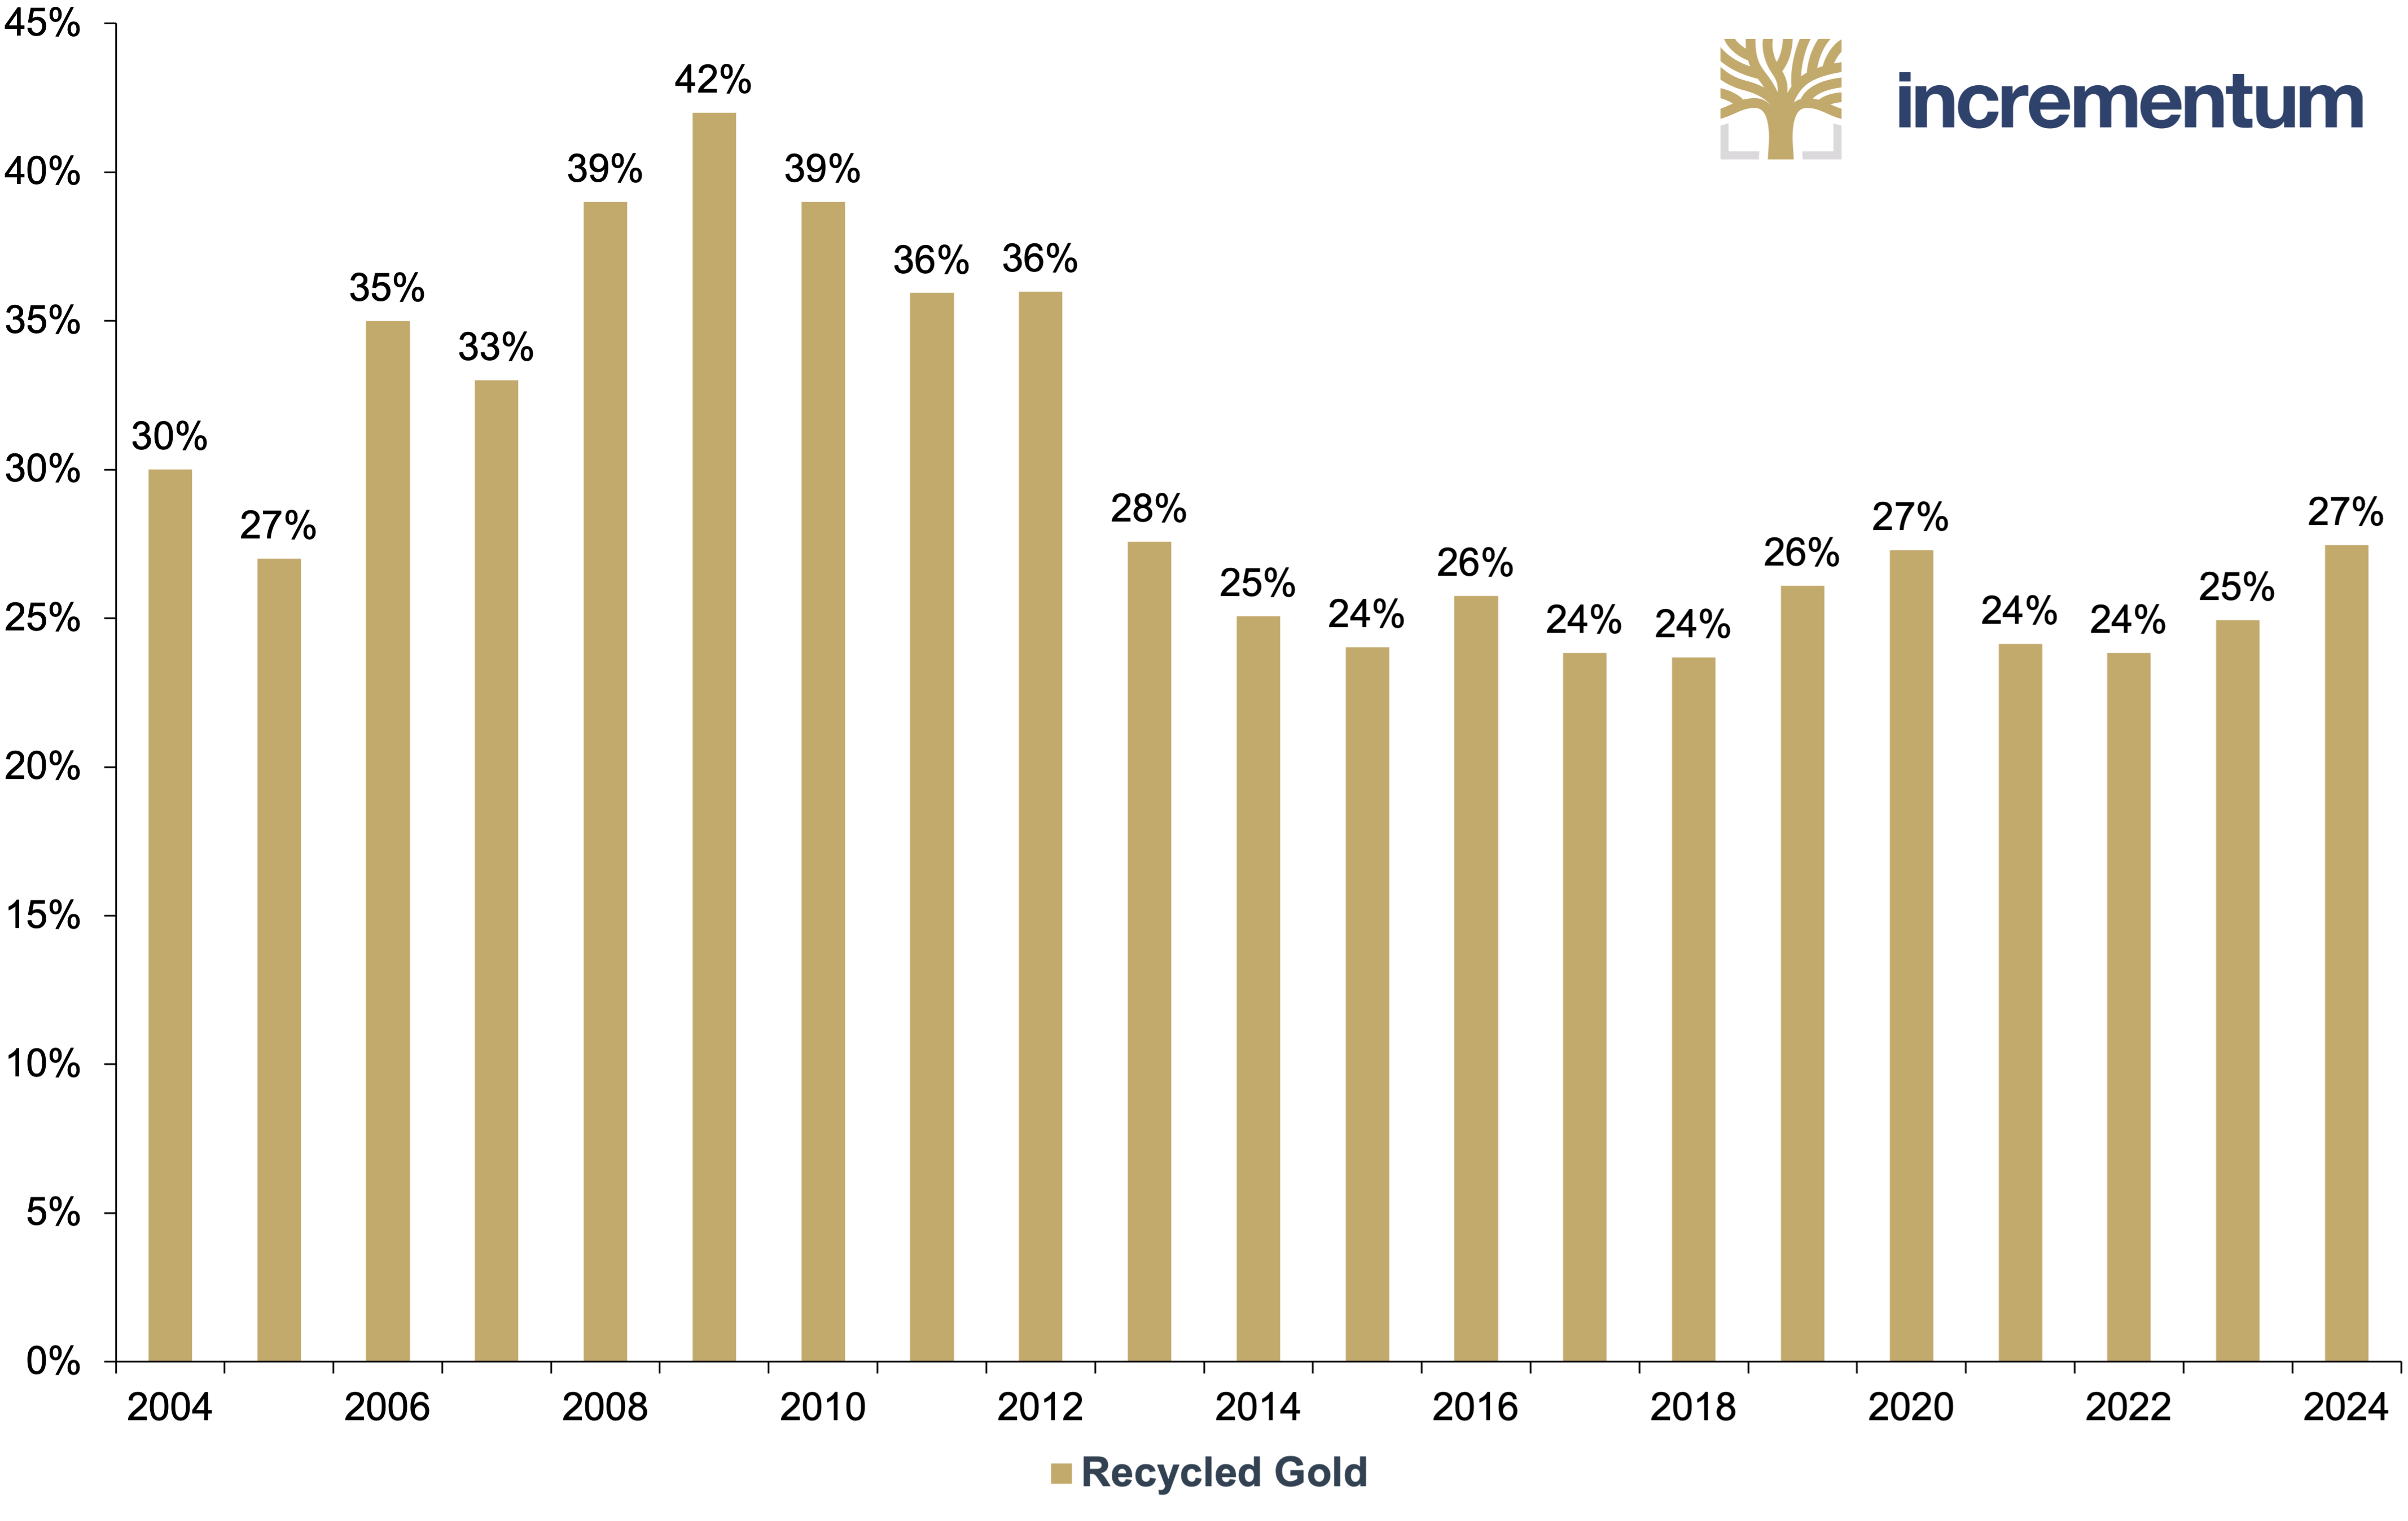
Source: Thomson Reuters GFMS, World Gold Council, Incrementum AG
Excursus: peak gold?
For many years, gold experts have discussed the concept of peak gold, i.e. the idea that global gold mining production is approaching its peak, after which production will slow and no longer grow at the historical rate of 1.8% annually seen over the past century. The peak gold theory, which we have already discussed on several occasions,[1] is part of the debate between Malthusians and Cornucopians about the interplay between population growth and resource availability. While Malthusians – named after Thomas Malthus, an 18th–19th century British scholar – believe that population growth will eventually outstrip the Earth’s ability to provide for its growing population, leading to resource scarcity, famine, and widespread suffering. Cornucopians – a term referring to the belief in abundance, often symbolized by the cornucopia or horn of plenty – believe that human ingenuity, technological advancements, and innovation can overcome any resource limitations. They argue that the Earth has an abundance of resources that can be accessed, expanded, or replaced through creativity and progress.[2]
The Simon-Ehrlich wager best illustrates this philosophical divide. In 1980, professors Paul Ehrlich, a biologist, and Julian Simon, an economist, made a bet on the inflation-adjusted 10-year price trend (1980–1990) of five raw materials – copper, chromium, nickel, tin, and tungsten. Ehrlich predicted that prices of all the metals would rise due to resource scarcity exacerbated by population growth. Simon bet that the prices of these commodities would not be higher than on the day of the wager. All prices fell in real terms, resulting in Ehrlich losing the bet.
Similarly, peak gold proponents argue that global gold supply is finite and that two thirds of all gold mined to date (212,582 t) has been mined since the 1950s. A recent report from S&P Global, authored by Paul Manolo, forecasts that global annual gold supply will peak in 2026 at 110 Moz or 3,420 t. One of the primary reasons cited is the lack of high-quality gold discoveries in the recent past, with only five major gold discoveries totaling 17 Moz of gold. In fact, not only has the number of new gold discoveries been trending downwards since 2000, but their size has also diminished significantly, with no discoveries in the past decade ranking among the top 30 discoveries since 1990. As Rick Mills states in an article for mining.com: “As for peak gold, it’s already here.”
However, the question of global gold supply presents a more complex picture than simply asking “When will we run out of gold?”. Historical data reveals that global gold production has experienced multiple peaks throughout the past century – notably in 1912, 1940 and 1970 –each followed by periods of decline. Some analysts suggest that another peak occurred in 2018, when production reached 2,554 t.
Yet contrary to these predictions, a definitive peak in gold mining has not materialized. Technological advancements continue to enhance mining productivity and efficiency, maintaining the upward trajectory of gold production. Should global mining supply begin to decline, the gold recycling market would likely serve as a buffer against supply deficits.
The global volume of recycled gold has grown steadily over recent decades. During the 1990s, annual recycling volumes typically ranged between 800–900 t. By the 2000s, this figure topped 1,000 t, reaching a peak of 1,500 t in 2010 due to elevated gold prices before retreating to around 1000 t. In recent years, recycled gold supply reached 1,237 t in 2023, thus representing 25.3% of the total global gold supply and a 9% increase compared to the previous year. Newly mined gold accounted for the remaining 74.4%, or 2,544 t.
The upward trend continued in 2024, with recycled gold reaching 1,370 t. While this figure remains below the all-time high of 2009 of 1,728 t, equaling 42% of the total supply that year, it exceeds the 1,292 t during the first Covid year of 2020. This robust year-over-year increase in the recycling supply of 11% in 2024 was observed across all regions, except the Middle East.
Gold recycling from jewelry
Jewelry recycling represents the most traditional form of gold recycling, accounting for approximately 90% of all gold recycled globally. This percentage varies regionally, with higher rates in countries with a strong gold jewelry tradition like India, and lower rates in Western countries, where gold jewelry plays a smaller cultural role and other segments like electronic scrap are relatively more significant.
Recycled and ethical gold has become a prominent trend within the global jewelry industry. Brands including Chopard, Prada, Tiffany, and Pandora have committed to sourcing materials responsibly, particularly through the use of recycled gold. Additionally, numerous emerging jewelry startups exclusively utilize recycled precious metals, further driving demand for recycled gold.
Gold recycling from e-waste
E-waste has emerged as an increasingly important source of recycled gold. Global e-waste generation currently exceeds 60mn t annually, and is projected to more than double to 137mn t by 2050, representing a significant value. A substantial percentage of this e-waste contains precious metals, including gold. For context, studies have shown that a typical mobile phone contains approximately 7 to 34 mg of gold. Higher-end electronic devices, such as high-end desktop computers and server-grade motherboards, may contain as much as 1 g of gold.
Historically, e-waste recycling yielded relatively low recovery rates for precious metals. However, improvements in refining and separation techniques have significantly improved these rates, with modern e-waste recycling plants now capable of recovering over 90% of the gold contained in discarded electronics. Recent scientific papers have even introduced the use of biodiesel in gold recycling processes as an alternative to fossil fuels. However, as a recent study by the University of Pforzheim highlights, gold recycling from e-waste remains considerably more energy-intensive than jewelry recycling. According to estimates, up to 15% of the world’s gold supply could be derived from e-waste by 2030. Currently, however, e-waste generation is growing five times faster than e-waste recycling.
A paradigm shift is underway in the sector. Most recently, UK Royal Mint has established a recycling facility in Wales, using cutting-edge processes to extract precious metals from circuit boards in discarded electronic devices. Collaborating with the Canadian start-up Excir, the Royal Mint is pioneering a new sustainable precious metal technology allowing gold extraction from e-waste in seconds. The Royal Canadian Mint and clean tech start-up Enim have formed a similar partnership. On a national level, the United States leads in gold recovery from discarded electronics, followed by China and Germany, according to a recent study by The Gold Bullion Company. Based on 2022 data, the US generated 4.1bn kg of formally documented electronic waste, from which an estimated 13,767 kg of gold could be recovered. Despite generating only half as much e-waste, China follows in second place with an estimated 6,630 kg of recycled gold.
On a per capita basis, Norway leads globally with the highest amount of gold recycled from e-waste, at 0.066 grams per person. Rounding out the top five are Finland, Austria, Switzerland, and Sweden.
Drivers of global gold recycling
Before concluding our examination of urban gold mining, it is worthwhile analyzing the drivers of global gold recycling, particularly the price sensitivity of scrap gold. Specifically, how does the supply of scrap gold, both in absolute terms and relative to mined gold, respond to significant fluctuations in the market price of gold?
A preliminary observation: Despite expectations, comprehensive studies on the price sensitivity of gold recycling supply are scarce. Most research in this area focuses primarily on the technical procedural aspects, presenting substantial opportunities for future research.
As noted earlier, the total above-ground stock of gold – estimated at approximately 212,582 t – is stored in its various forms and has the potential to re-enter the market through recycling. The largest portion exists as jewelry (44%), followed by investment gold (24%) in the form of bars and coins, central bank holdings (21%), and technology (5%).
Above Ground Gold Stock by Sector, in Tonnes, 2024
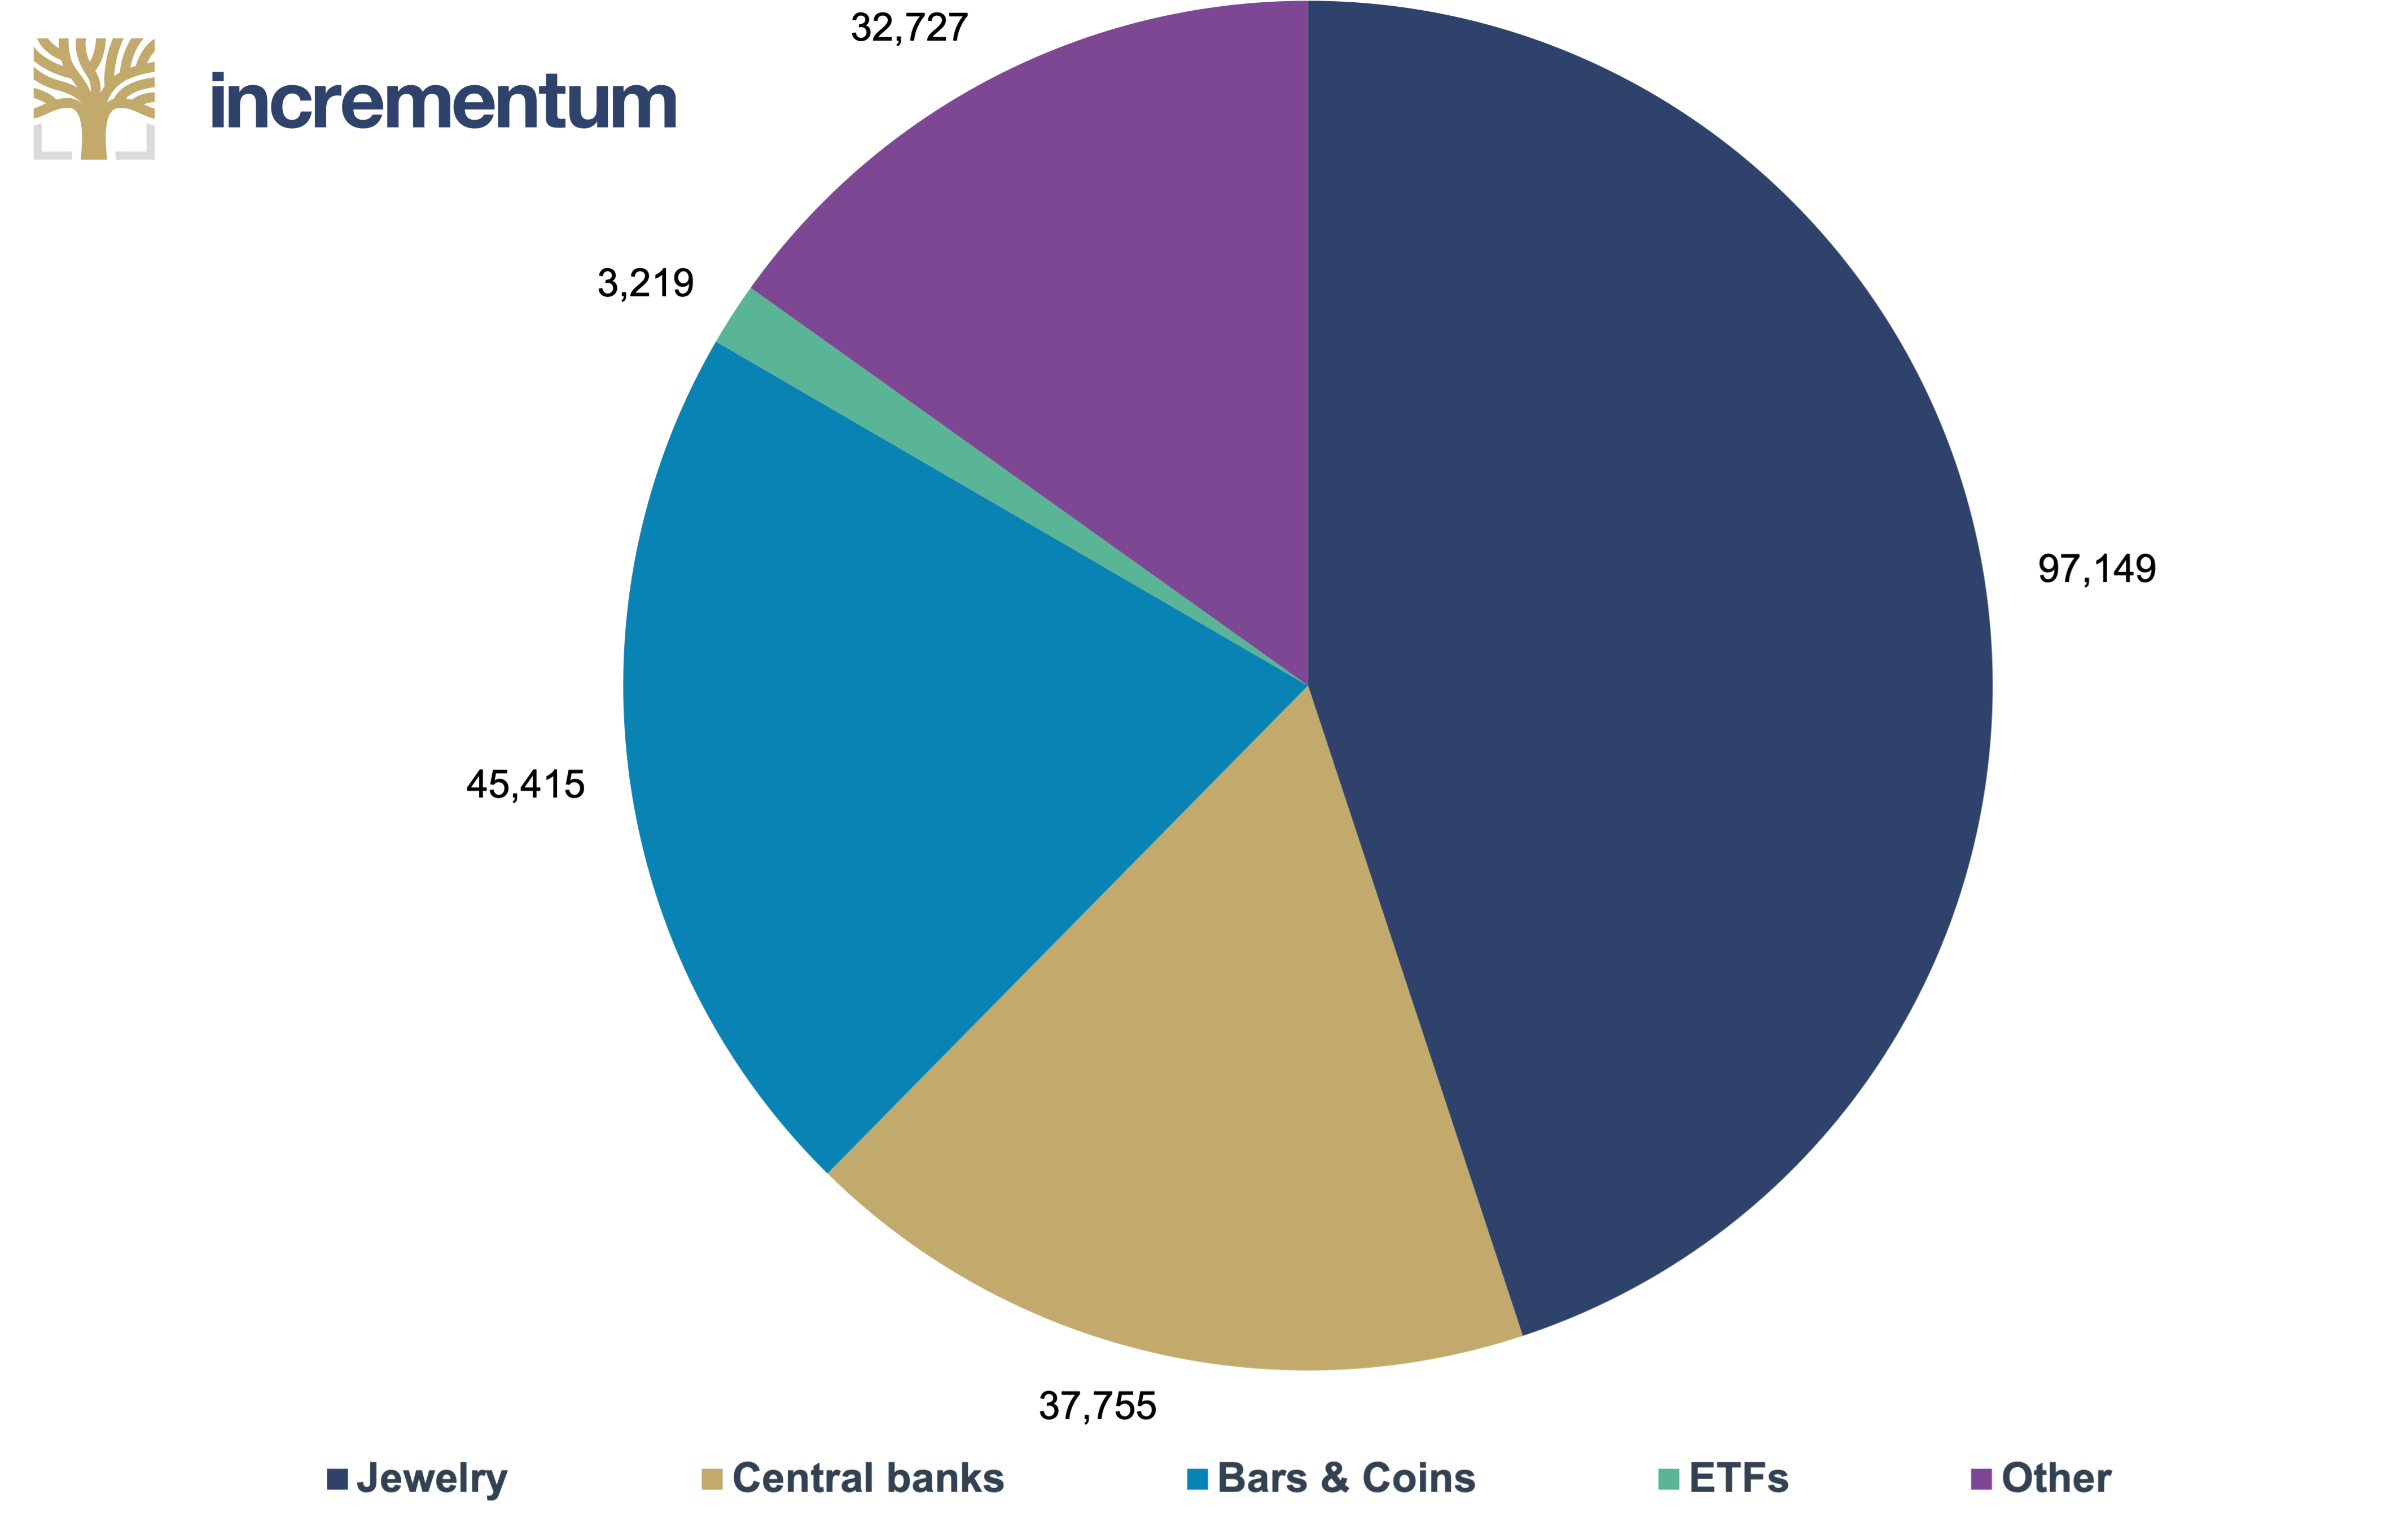
Source: World Gold Council, Incrementum AG
In practice, however, only a fraction of this above-ground stock will return to the market via recycling. Various factors contribute to this limitation, including family heirlooms being passed through generations, central banks storing gold as reserve assets, and electronic waste being discarded in landfills without precious metals recovery. As of 2025, only approximately 0.5% of the total above-ground stock of gold is being recycled annually.
With mining supplying most of the global gold, it undoubtedly wields considerable market power. Consequently, a supply shock – whether positive or negative – would significantly impact prices.[3] However, mining production involves substantial lead times.[4] Often, several decades elapse between the exploration and discovery of precious metals deposits and the subsequent development of mines before production can commence. As a result, precious metals mining responds relatively slowly to market price changes.
Gold scrap supply exhibits greater volatility due to its much shorter time-to-market. Unlike mining, it is not subject to seasonality. However, seasonality in mining output does influence the relative importance of recycling, which typically increases during the first quarter of each year.
Mine Production and Recycled Gold (lhs), in Tonnes, and Recycled Gold (rhs), as % of Supply, Q1/2010–Q4/2024
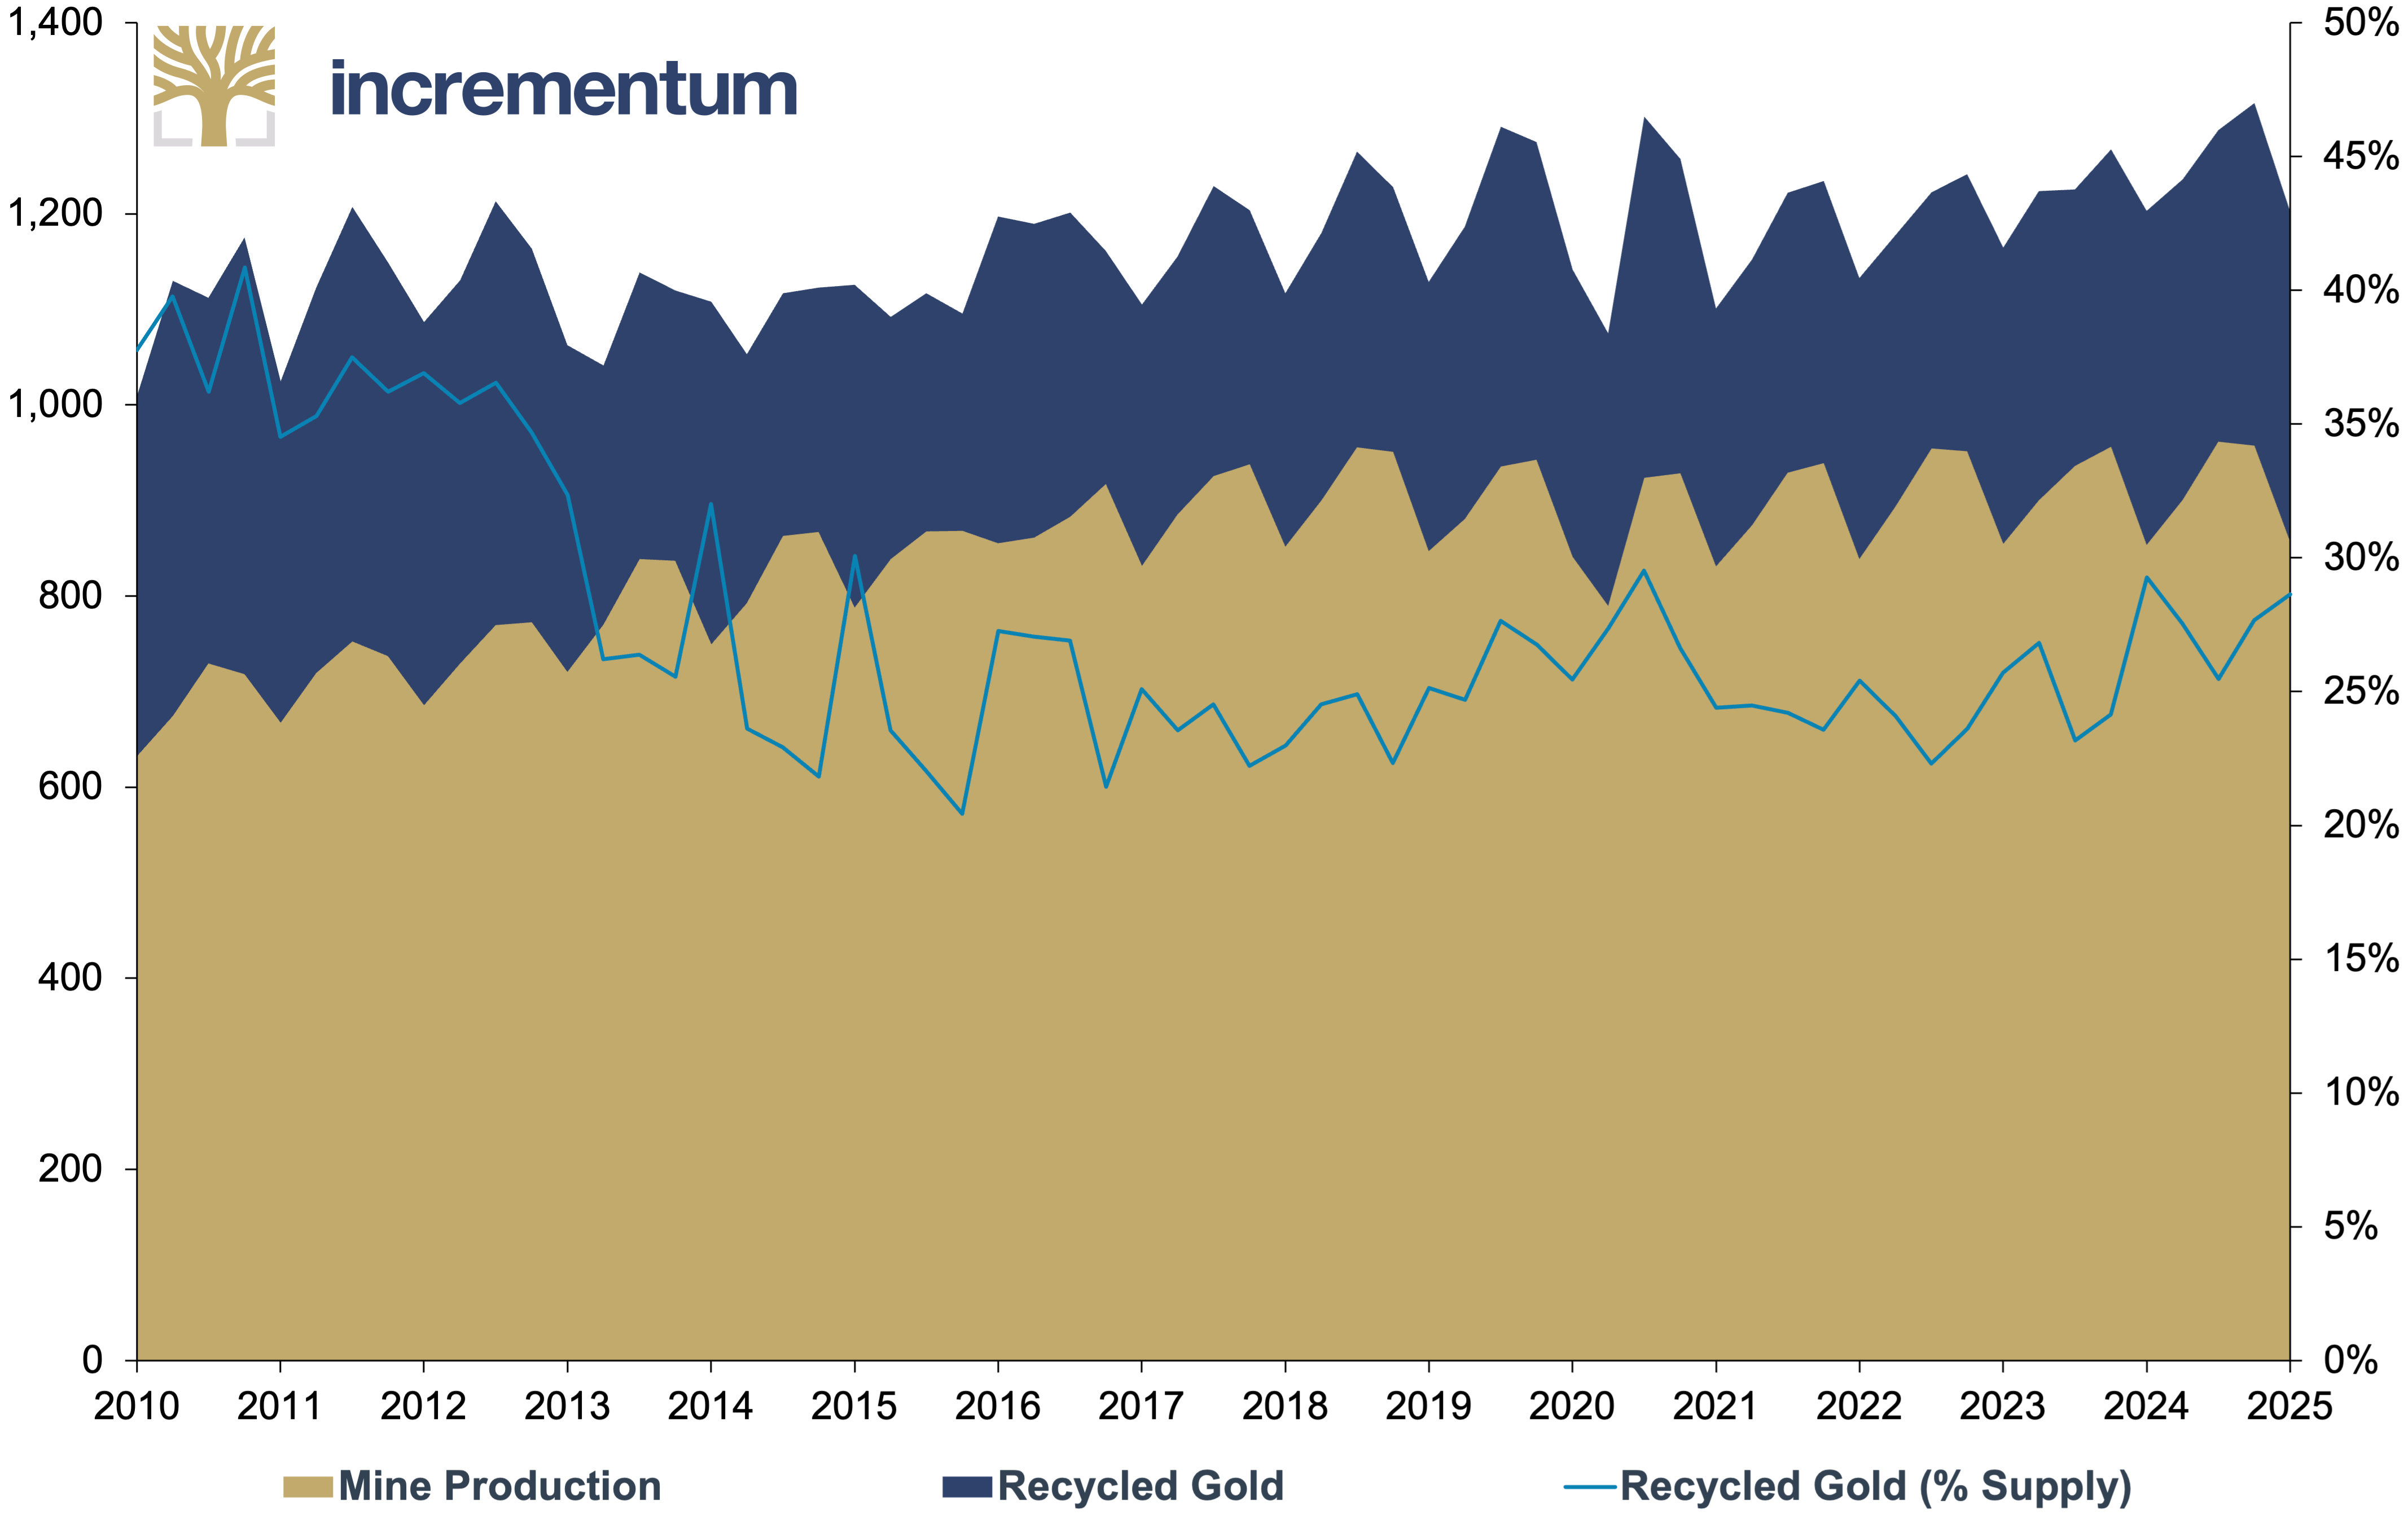
Source: World Gold Council, Incrementum AG
While the scale and variability of scrap gold give it significant potential to influence the gold price, the relationship operates in reverse: The key driver of recycling volumes is the gold market price. Thus, recycling is a price taker.
A primary reason for this dynamic lies in the composition of the gold scrap supply: Over 90% originates from jewelry, of which almost three quarters comes from emerging markets. These countries have highly price-sensitive jewelry sectors that respond rapidly to market price fluctuations, with individuals often liquidating gold jewelry when they require immediate funds. Beyond China and India, countries such as Turkey, Iran, Iraq, Egypt, and Thailand play significant roles.
While gold recycling generally functions as a price taker globally, it can become a price driver in more localized markets. At times, swings in country-level jewelry demand may cause local markets to trade at discounts relative to world prices. According to the LBMA, weak Chinese gold demand has sometimes been responsible for the Shanghai Gold Exchange trading at a discount.
A recent study by Goldbroker examined recycled gold. It calculated the elasticity of recycling gold at a value of 3, implying that a 1% increase in the gold price results in a 3% increase in recycled gold supply. Research by BCG arrived at a different conclusion, estimating an elasticity of 0.6. According to our analysis, the supply of recycled gold is significantly influenced by the gold price, albeit with varying effects.
One explanation for this volatility can be found in human psychology. For instance, the breaching of significant price thresholds, such as the 3,000 USD mark, produces a psychological impact, particularly when widely covered by the media. Additionally, human expectations are not necessarily rational but are often influenced by hopes, fears, and wishful thinking. Consequently, sudden consumer interest – buying or selling – can be triggered. Local gold prices are key in this regard, as shown in November 2022 when euro gold topped EUR 50 per gram, March 2024 when Swiss gold broke CHF 2,000 per ounce, and September 2024 when British gold exceeded GBP 2,000 per ounce.
Currency crises and economic recessions are additional powerful catalysts for gold recycling, as individuals are often compelled to liquidate their gold during financial hardship. The Egyptian currency crisis of 2015/16 illustrates this phenomenon: Egyptian scrap supply exploded from 6t in Q4/2015 to 27t in Q2/2016. A crucial prerequisite for significant recycling volumes is, of course, a substantial local pool of gold products, particularly jewelry. Hence, countries with strong gold jewelry traditions demonstrate greater potential for recycling.
An examination of historical data confirms the positive correlation between gold price increases and recycling supply growth. Every major price rally in the past was followed by a visible uptick in recycling output – whether during 2010/11 in the aftermath of the global financial crisis, in 2020 during the Covid-19 pandemic, or in 2023/24 after the outbreak of the Ukraine war.
All these examples beautifully illustrate the power of the market process. Gold price increases incentivize miners to boost output and potentially render previously uneconomical deposits viable for extraction. Similarly, businesses and individuals become motivated to monetize their gold holdings once prices reach certain thresholds. On a more abstract level, the ratio between mining supply and recycling supply is equilibrated by the same market signal: the price of gold.
Gold Stock-to-Flow Ratio (lhs), and Above Ground Gold Stock (rhs), in Tonnes, 1900–2024
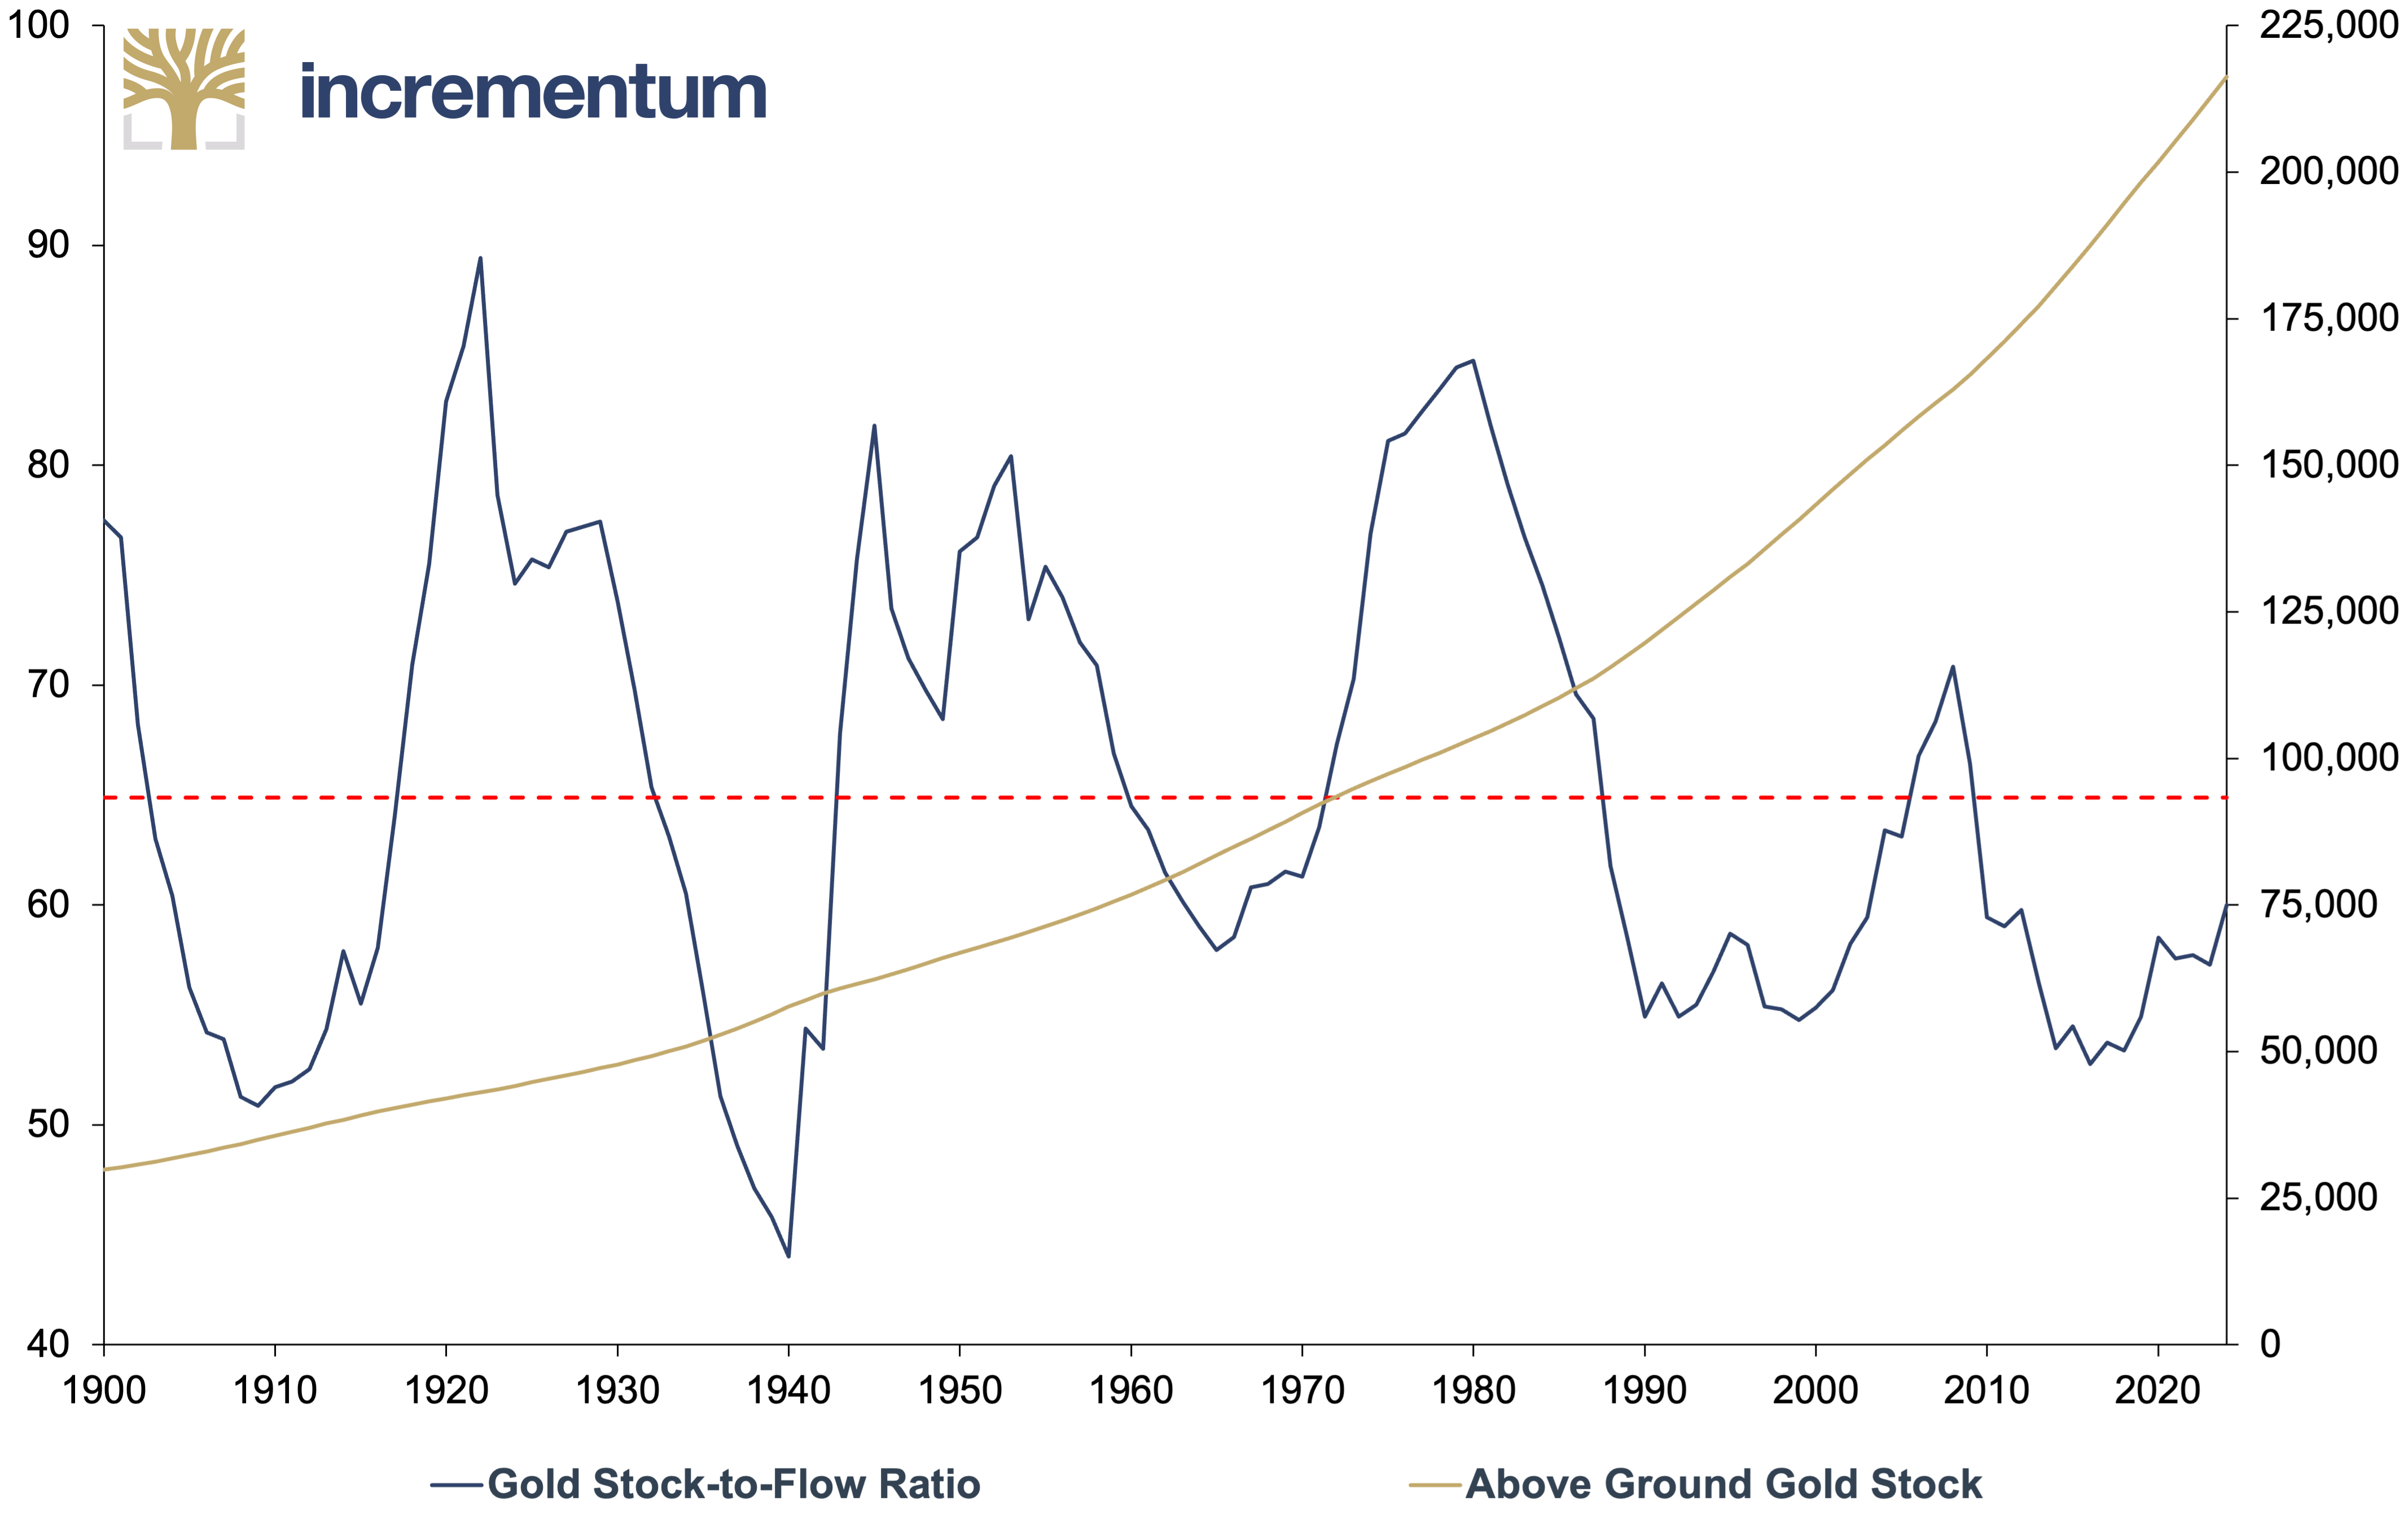
Source: LSEG, Incrementum AG
Another critical observation emerges when examining the total stock-to-flow ratio (SFR) for gold. Since the beginning of the 20th century, annual gold production has remained relatively constant relative to the amount of gold already mined.[5] The stock-to-flow ratio compares the current stock of a commodity against the flow of new production. A high ratio, typical for gold or Bitcoin, indicates scarcity and signals lower inflationary pressure, as new supply has little impact on the market. In contrast, a low ratio suggests greater susceptibility to inflation, since new production carries more weight.
This fact is well illustrated by the following chart: The global stock of gold per capita has fluctuated within a narrow range of 0.70 to 0.85 ounces. This is particularly noteworthy considering the global population has exploded from 2.5bn people in 1950 to some 8bn people today. In other words, this data contradicts the peak gold theory, as supply has grown more or less in parallel with population growth.
Above Ground Gold Stock (lhs), in Tonnes, and Gold per Capita (rhs), in Ounces, 1950–2024
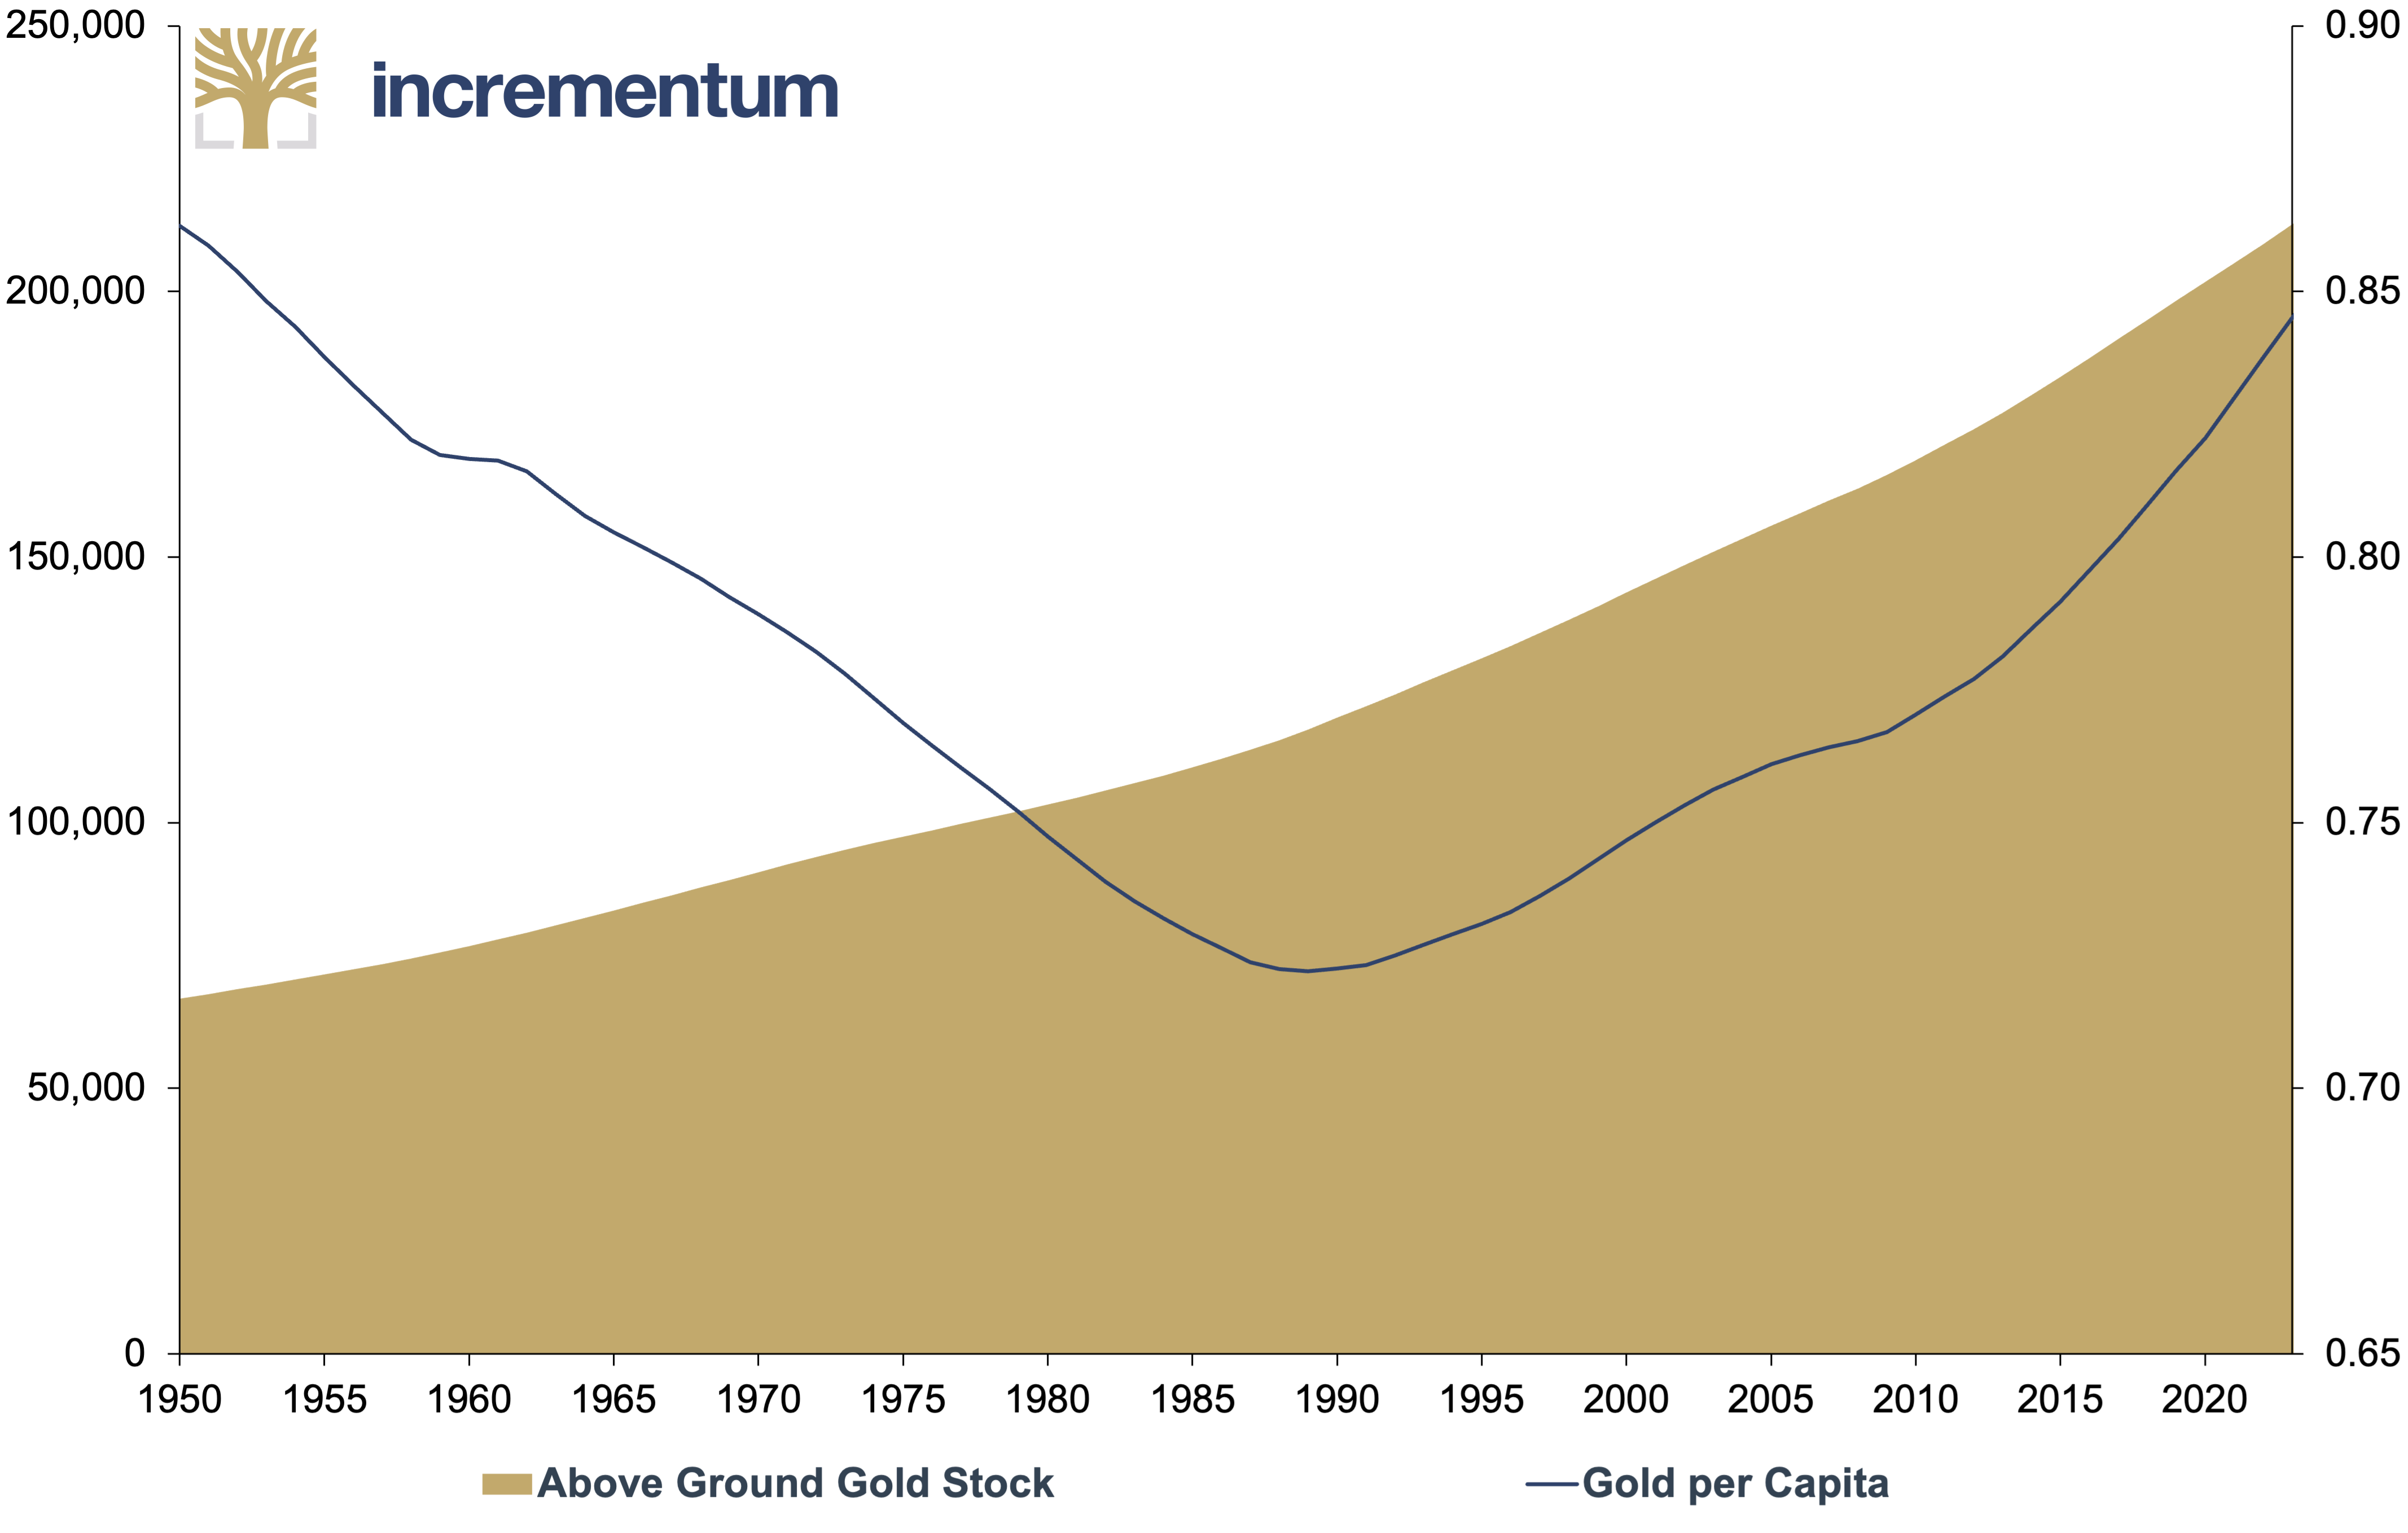
Source: UN, World Gold Council, Incrementum AG
Therefore, returning to the question of what drives gold recycling supply, the answer is remarkably straightforward: the market mechanism itself. As long as there is a free price determination mechanism, absent price controls or similar interventions, the gold price can function as a signal to all market participants. There is always enough gold to satisfy demand at the given price.
Urban Mining – Silver
Silver, the second most prominent precious metal, shares many features with its golden counterpart, including its use as both a monetary metal and an investment asset. Its durability, scarcity, decorative beauty, and special physical and chemical properties – such as electric and thermal conductivity and resistance to atmospheric oxidation – make it a highly sought commodity. According to Sprott, silver is the second most used commodity after oil, and is found in electronic devices, solar panels, electric vehicles, semiconductors, and more than 10,000 other applications.[6]
In contrast to gold, however, silver finds much broader usage in industrial applications and experiences actual “consumption”. This means that a portion of all silver ever mined disappears irrecoverably, for example due to abrasion (coins) or as silver-containing solid waste and solutions. As a result, the Silver Institute considers the total historical mine production of silver – approximately 57bn ounces up to 2023 – an inappropriate measure for the actual size of the above-ground stock of silver.
Further, a significant proportion of silver contained in fabricated products will never be recycled, as the amount is too small to justify the economic effort of recycling. This silver is effectively lost. The specific threshold determining whether silver is worth recycling depends on the prevailing market price. For gold, however, most of the above-ground stock exists in jewelry and bullion and therefore theoretically remains available to the market.
The following chart highlights silver’s strong and growing industrial demand over recent decades, with jewelry making up only a small share. This distinct demand profile—unlike gold’s—also affects its recycling potential, as we’ll examine further.
Global Silver Demand by Sector, in Moz, 2016–2025e
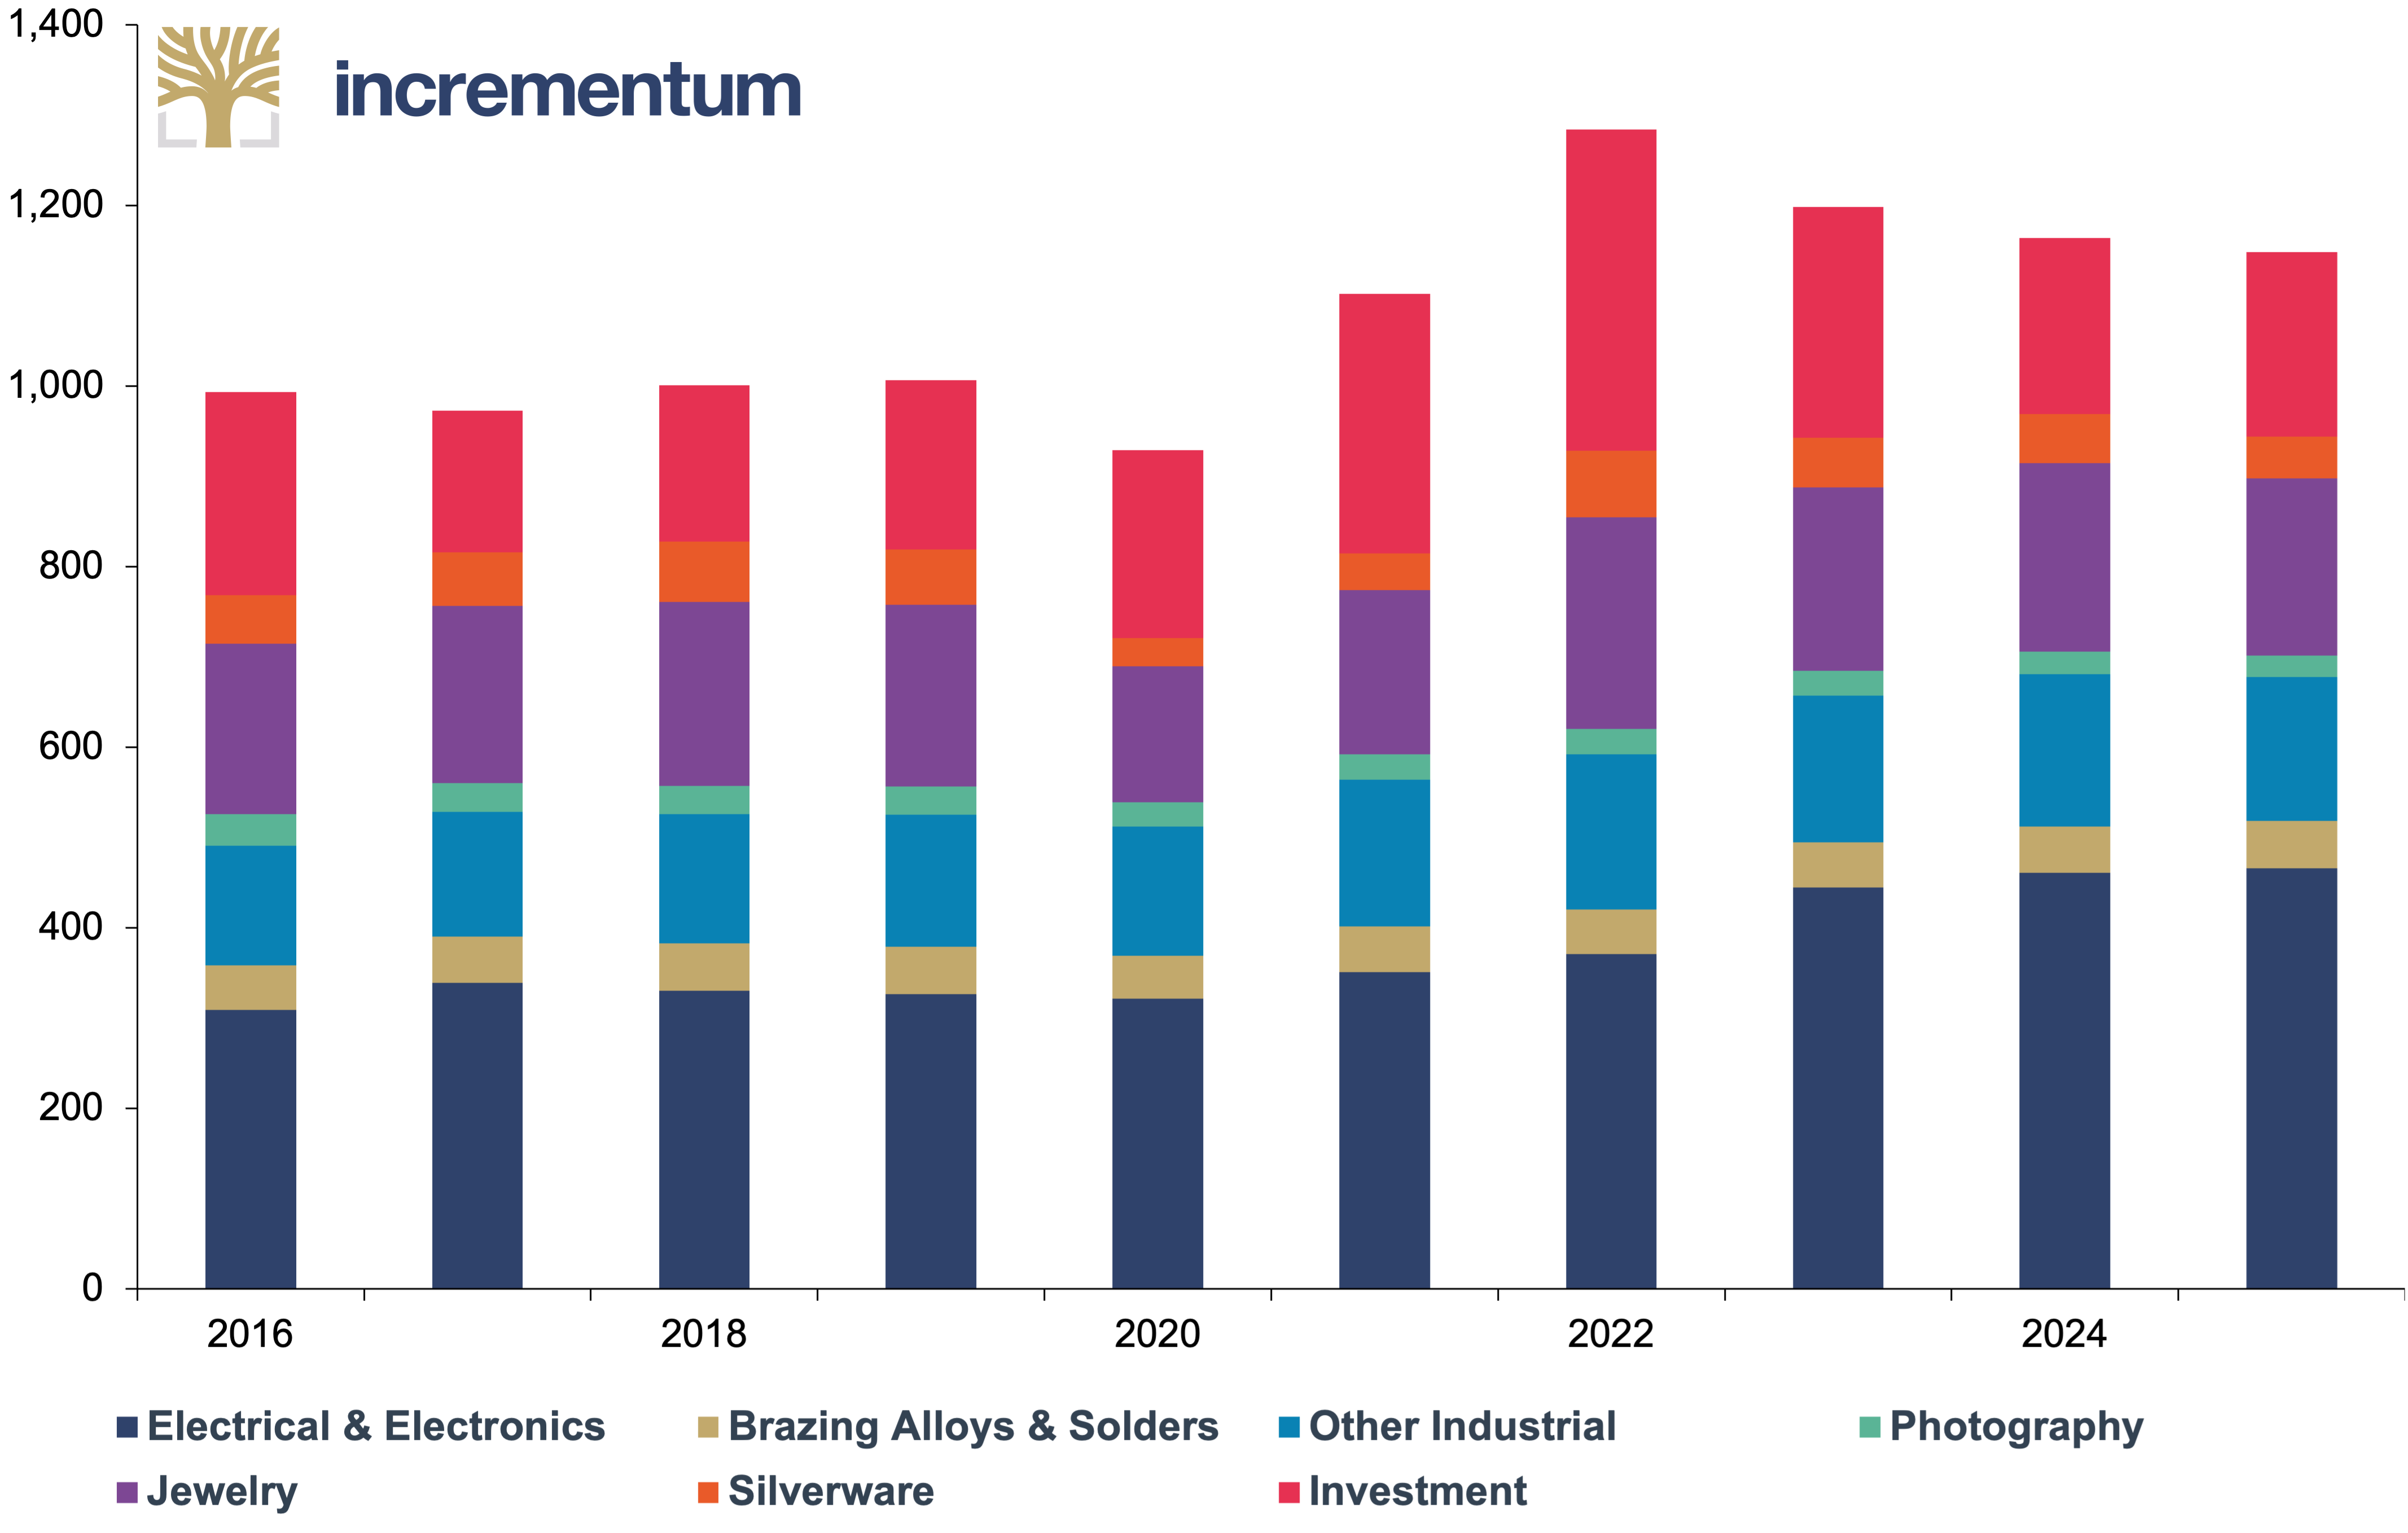
Source: The Silver Institute, Incrementum AG
On the supply side, traditional mining dominates silver production. Over 80% of the global silver supply stems from primary silver mining or byproducts of gold, copper, and zinc mining.
Silver recycling accounts for a smaller share of total supply than gold, amounting to 178.6 Moz or 5,063 t, i.e. 18% of supply in 2023. The industrial sector was the most significant contributor by volume, driven particularly by increased recycling of EO catalysts and pent-up recycling from the Covid years. Jewelry contributed 31.7 Moz, followed by Silverware at 22.7 Moz and photographic scrap (including medical x-ray and industrial X-ray scrap film containing silver) at 17 Moz. Coin recycling remained minimal at just 3.2 Moz.
From a regional perspective, East Asia is the leader in recycled silver, accounting for 55.3 Moz in 2023, almost one third of the global total. North America and Europe lagged, with 51.7 and 31.1 Moz respectively. This counterintuitive discrepancy likely stems from significant exports of waste from European countries to Asia.
An interesting development to monitor will be the recovery of silver from retired photovoltaic panels. On average, a solar panel contains 20g of silver, making it a key component. Currently, only about 10% of panels are recycled due to limited economic incentives, but this situation might change in the coming years as more photovoltaic panels reach the end of their operational life. Similarly, electric vehicles, which contain 25–50g of silver each, will become increasingly important as a recycling source. In general, recycled silver is refined to a purity level of 99.9%, allowing for further processing into alloys or silver bars and coins.[7]
The Silver Institute has recently published a detailed analysis with intriguing conclusions regarding the price sensitivity of silver stocks and recycling volumes. Contrary to what might be expected, there is no direct correlation between the above-ground stock of silver and the silver market price, as illustrated below. One explanation for this disconnection is the “immobility” of a majority of silver – most is integrated into products such as cell phones, x-ray equipment, and other goods, making it difficult to access.
Above Ground Silver Stock (lhs), in Moz, and Real Silver Price (rhs), in USD, 1970–2023
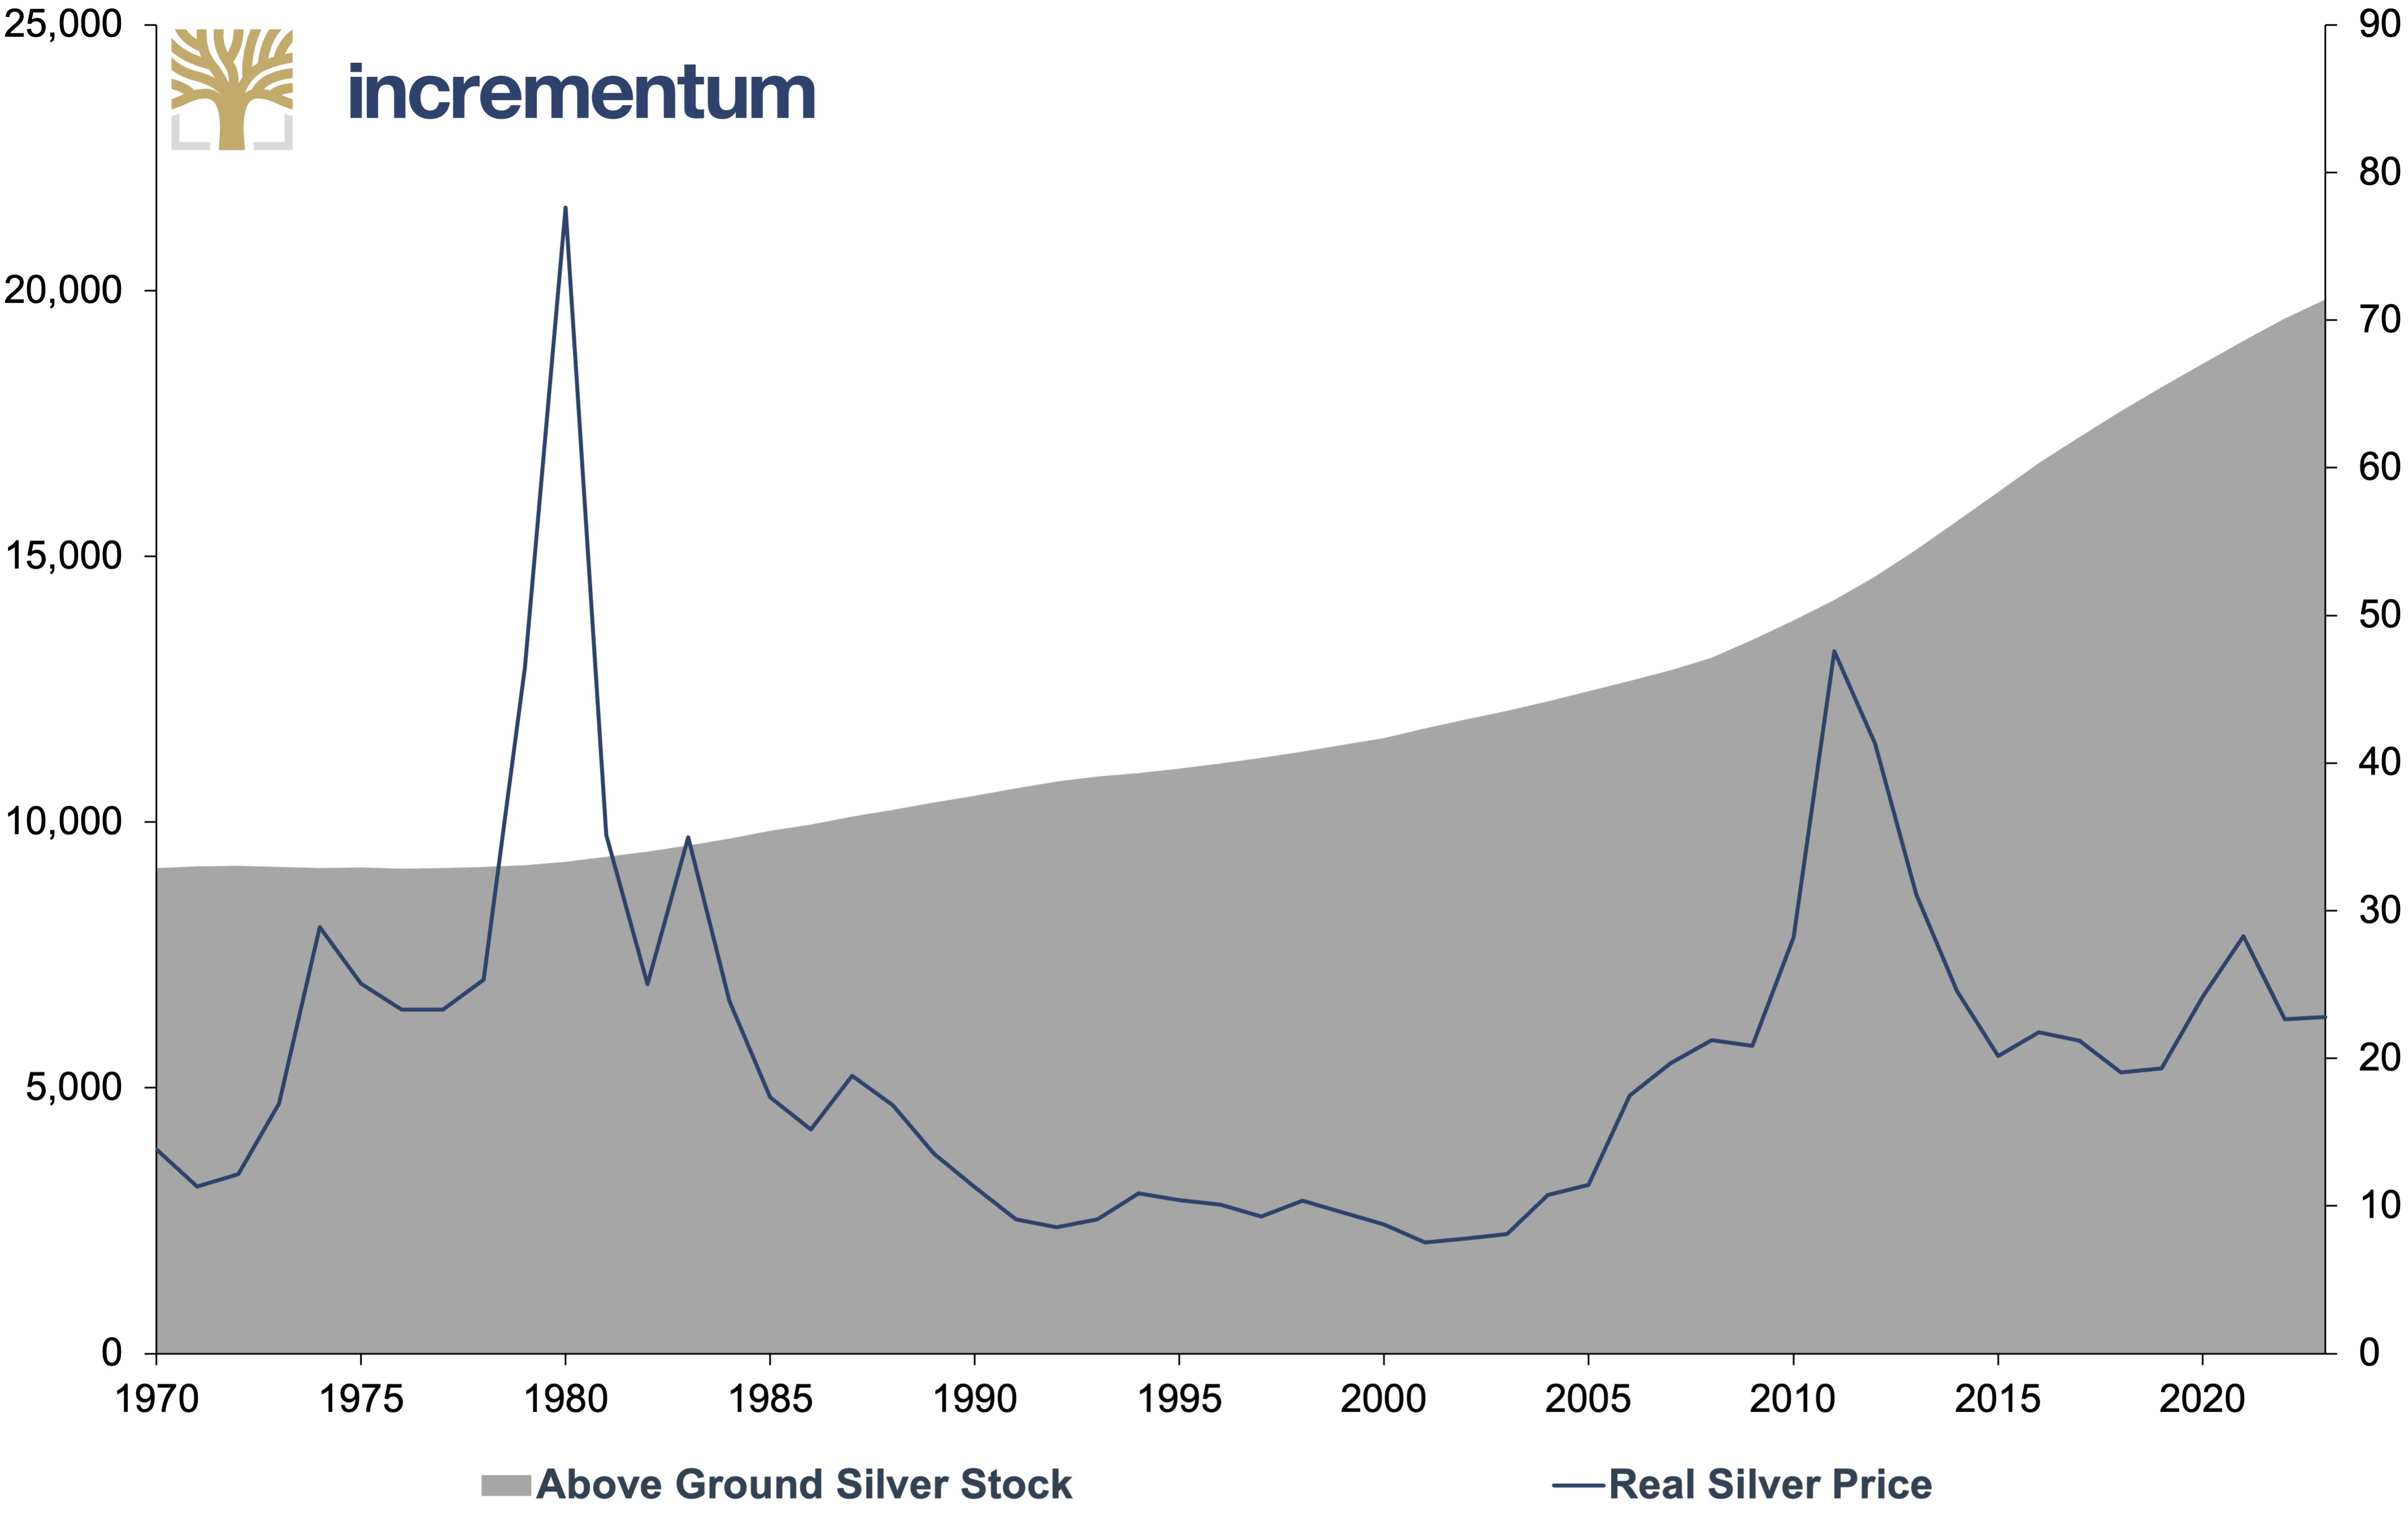
Source: The Silver Institute, LBMA, Precious Metals Insights, LSEG, Incrementum AG
At the same time, additions to or deductions from the bullion stock do show significant price impacts. For example, growth in the stock of silver often correlates with market price increases, as buyer demand drives prices upward.
Similarly, fabricated products demonstrate far less price sensitivity than silver bullion, again, due to the “immobility” of the silver. This observation extends to the final lifecycle stage of fabricated products – recycling. Consequently, scrap recycling is only partially influenced by price changes. Environmental policies and product life cycles exert a greater impact.
Nevertheless, significant changes in silver scrap supply can affect market prices on a secondary level. Generally, significant decreases in available silver scrap supply tend to support price levels, whereas considerable increases tend to limit price appreciation.
Scrap Silver (lhs), in Moz, Real Silver Price (lhs), in USD, and Scrap Silver (rhs), as % of Supply, 1970–2024
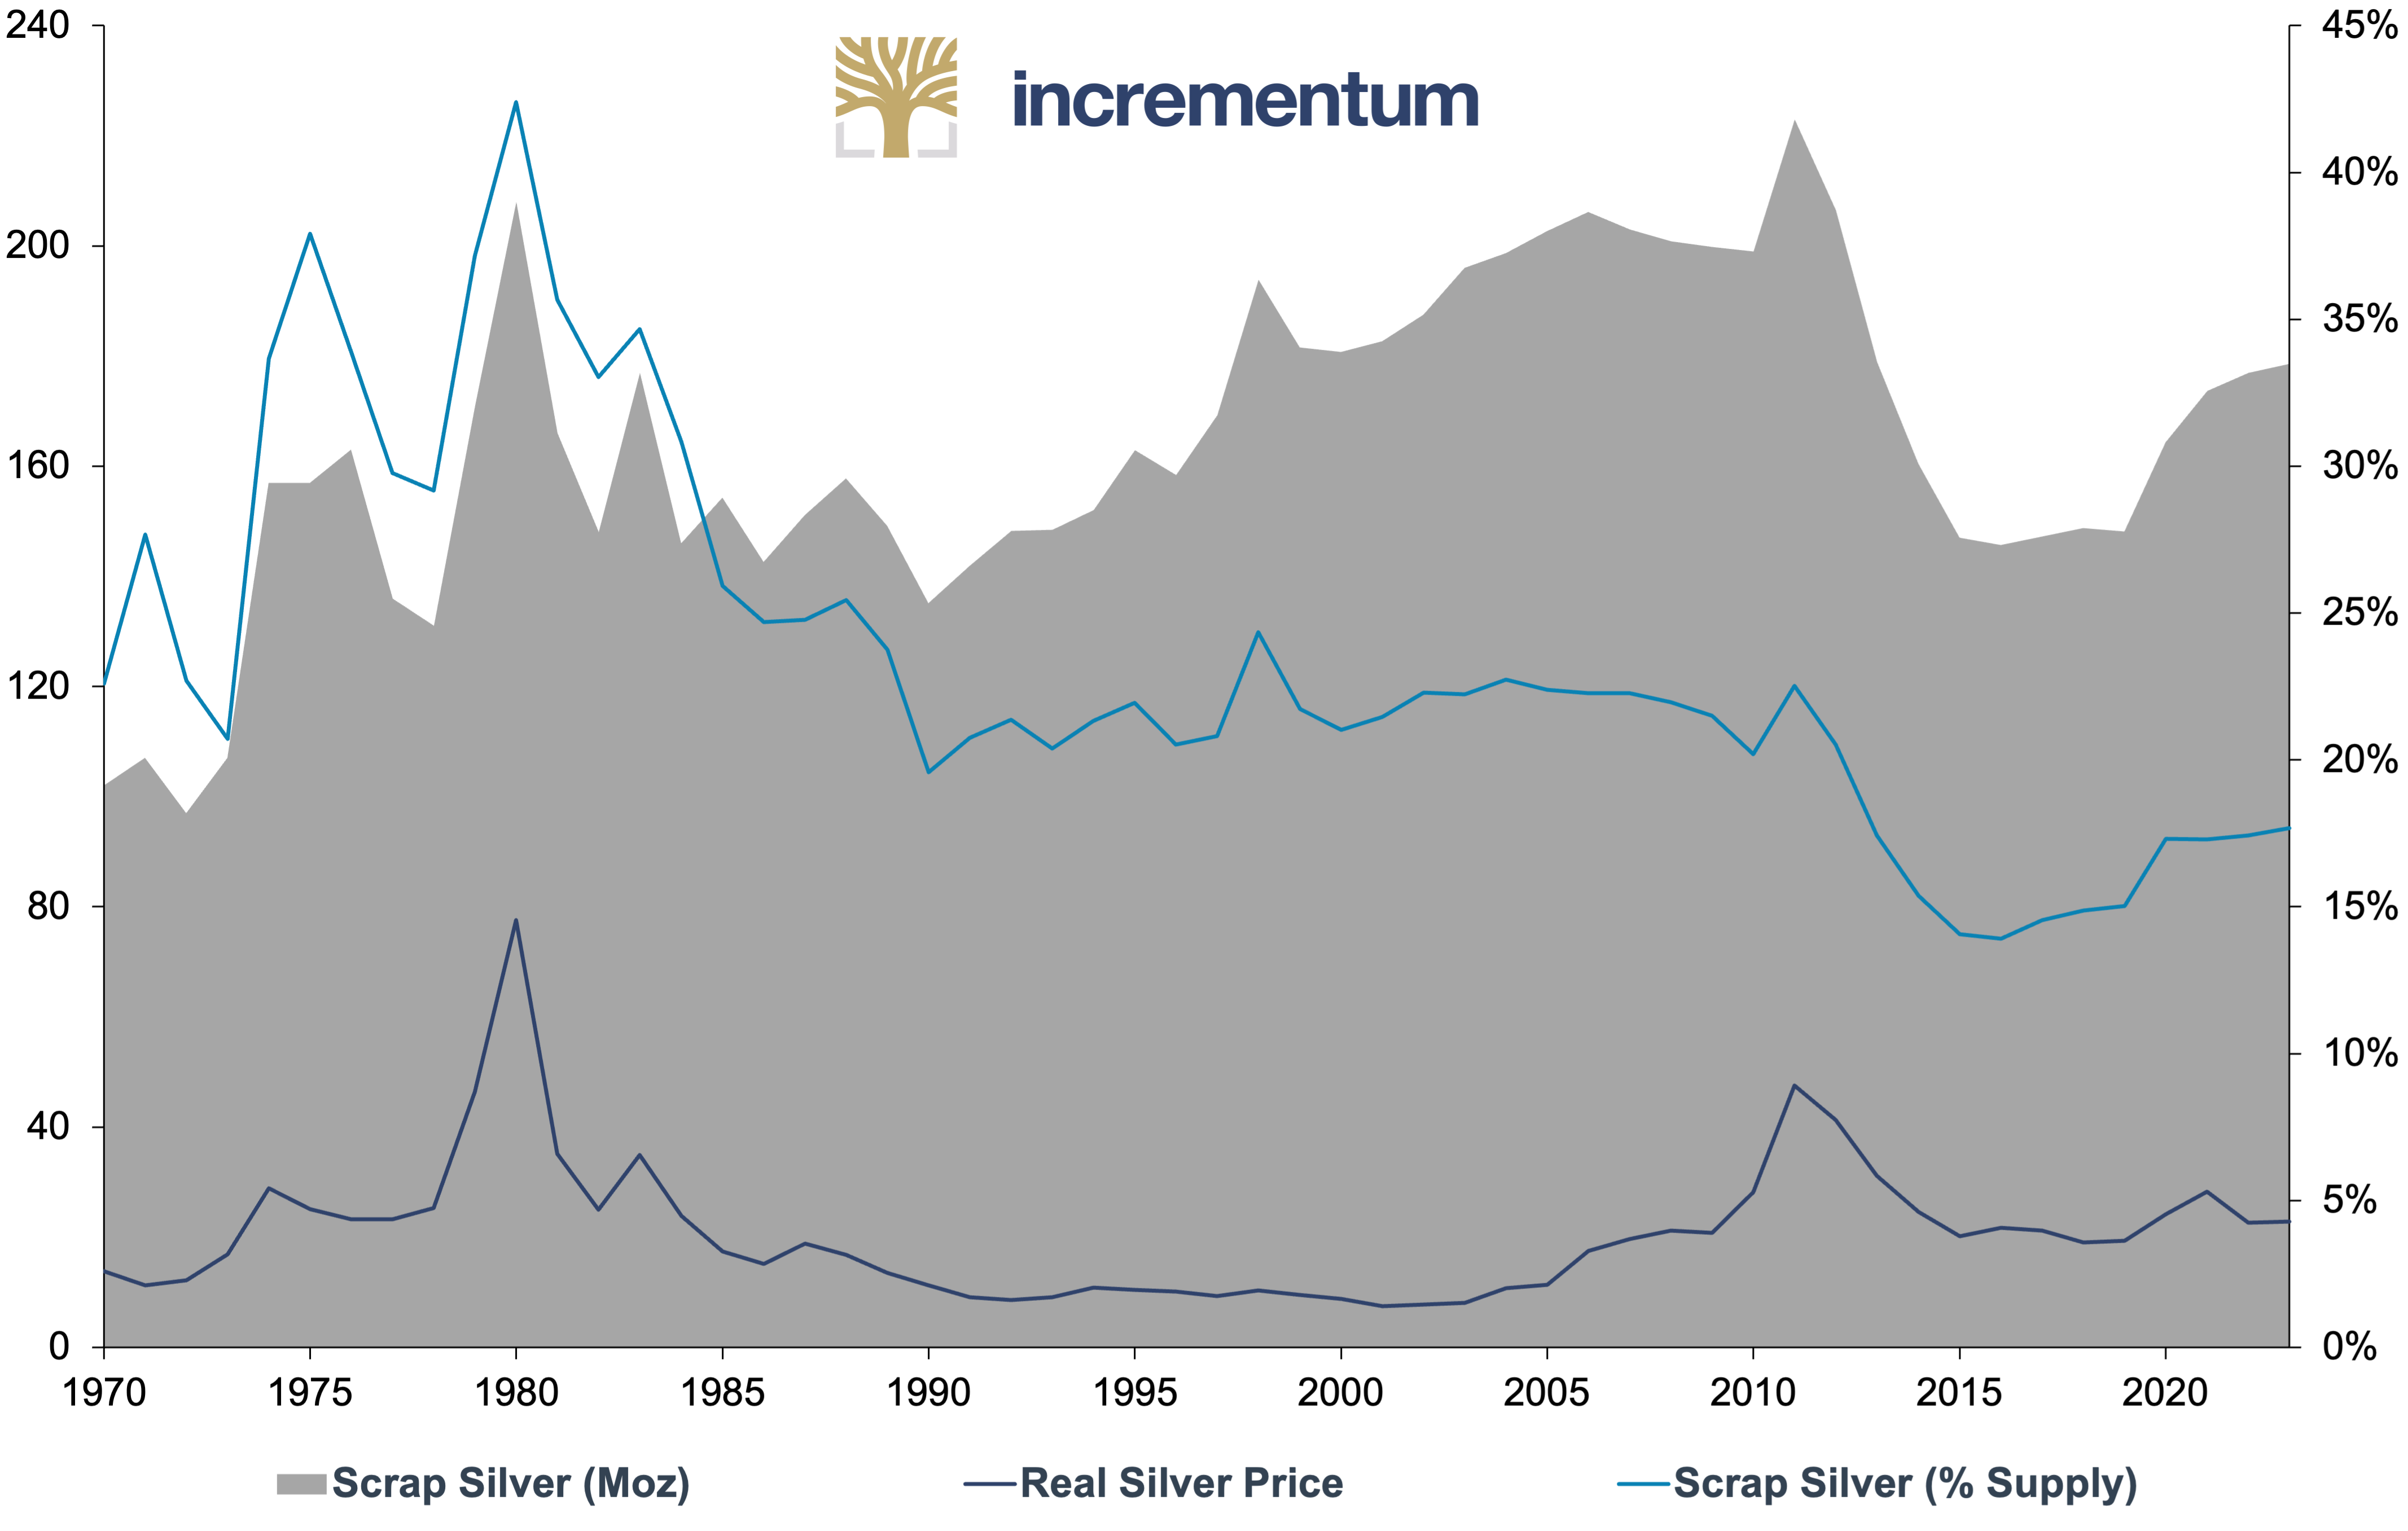
Source: The Silver Institute, LBMA, Precious Metals Insights, LSEG, Incrementum AG
However, focusing solely on market price dynamics in relation to silver scrap supply would be misleading, as becomes evident when taking a longer-term perspective: Over the past 20 years, real silver prices have doubled while the overall amount of silver scrap supply has declined, from 199 Moz in 2004 to 177 Moz in 2023. The composition of the scrap supply is a much more important driver. While industrial production, particularly electronics, has grown massively, photographic demand has plummeted. Scrap supply from silver jewelry and silverware has fluctuated over this period. According to the Silver Institute’s research, silver prices and industrial scrap supply exhibit a positive correlation of 0.65 for the period 2011–2023. As expected, the relationship between silver prices and silver jewelry and silverware scrap is even stronger at 0.93.
Sustainability Benefits of Recycling
Our analysis would not be complete without acknowledging the positive contribution of gold and silver recycling to environmental sustainability. During the “green” wave of recent years, many have positioned urban mining as the only alternative to traditional mining. This is an incomplete perspective, as all above-ground stocks of gold and silver had to be mined at some point. Relying exclusively on recycled precious metals does not eliminate the alleged negative environmental impact. However, recovering scrap gold from waste before it enters landfills might typically be more resource-efficient than extracting the same amount of gold from ore. To quantify this difference, the production of one ounce of gold through traditional mining emits, on average about 1 t of CO2.[8]
By recycling gold and silver, the need for traditional mining practices is reduced, decreasing the carbon footprint associated with production. Gold’s quasi-infinite lifespan means that its carbon emissions predominantly occur during the initial mining process. Therefore, each recycling round saves approximately 90% of CO2 emissions compared to primary mining. However, this needs to be put into further perspective: Aluminum, steel, copper, coal, and zinc all have much larger CO2 footprints than gold. For environmentally conscious investors, this presents a compelling case for a gold allocation in order to achieve an improved overall sustainability score across their portfolios.
Emissions Intensity per Value Unit, in kg CO2/USD
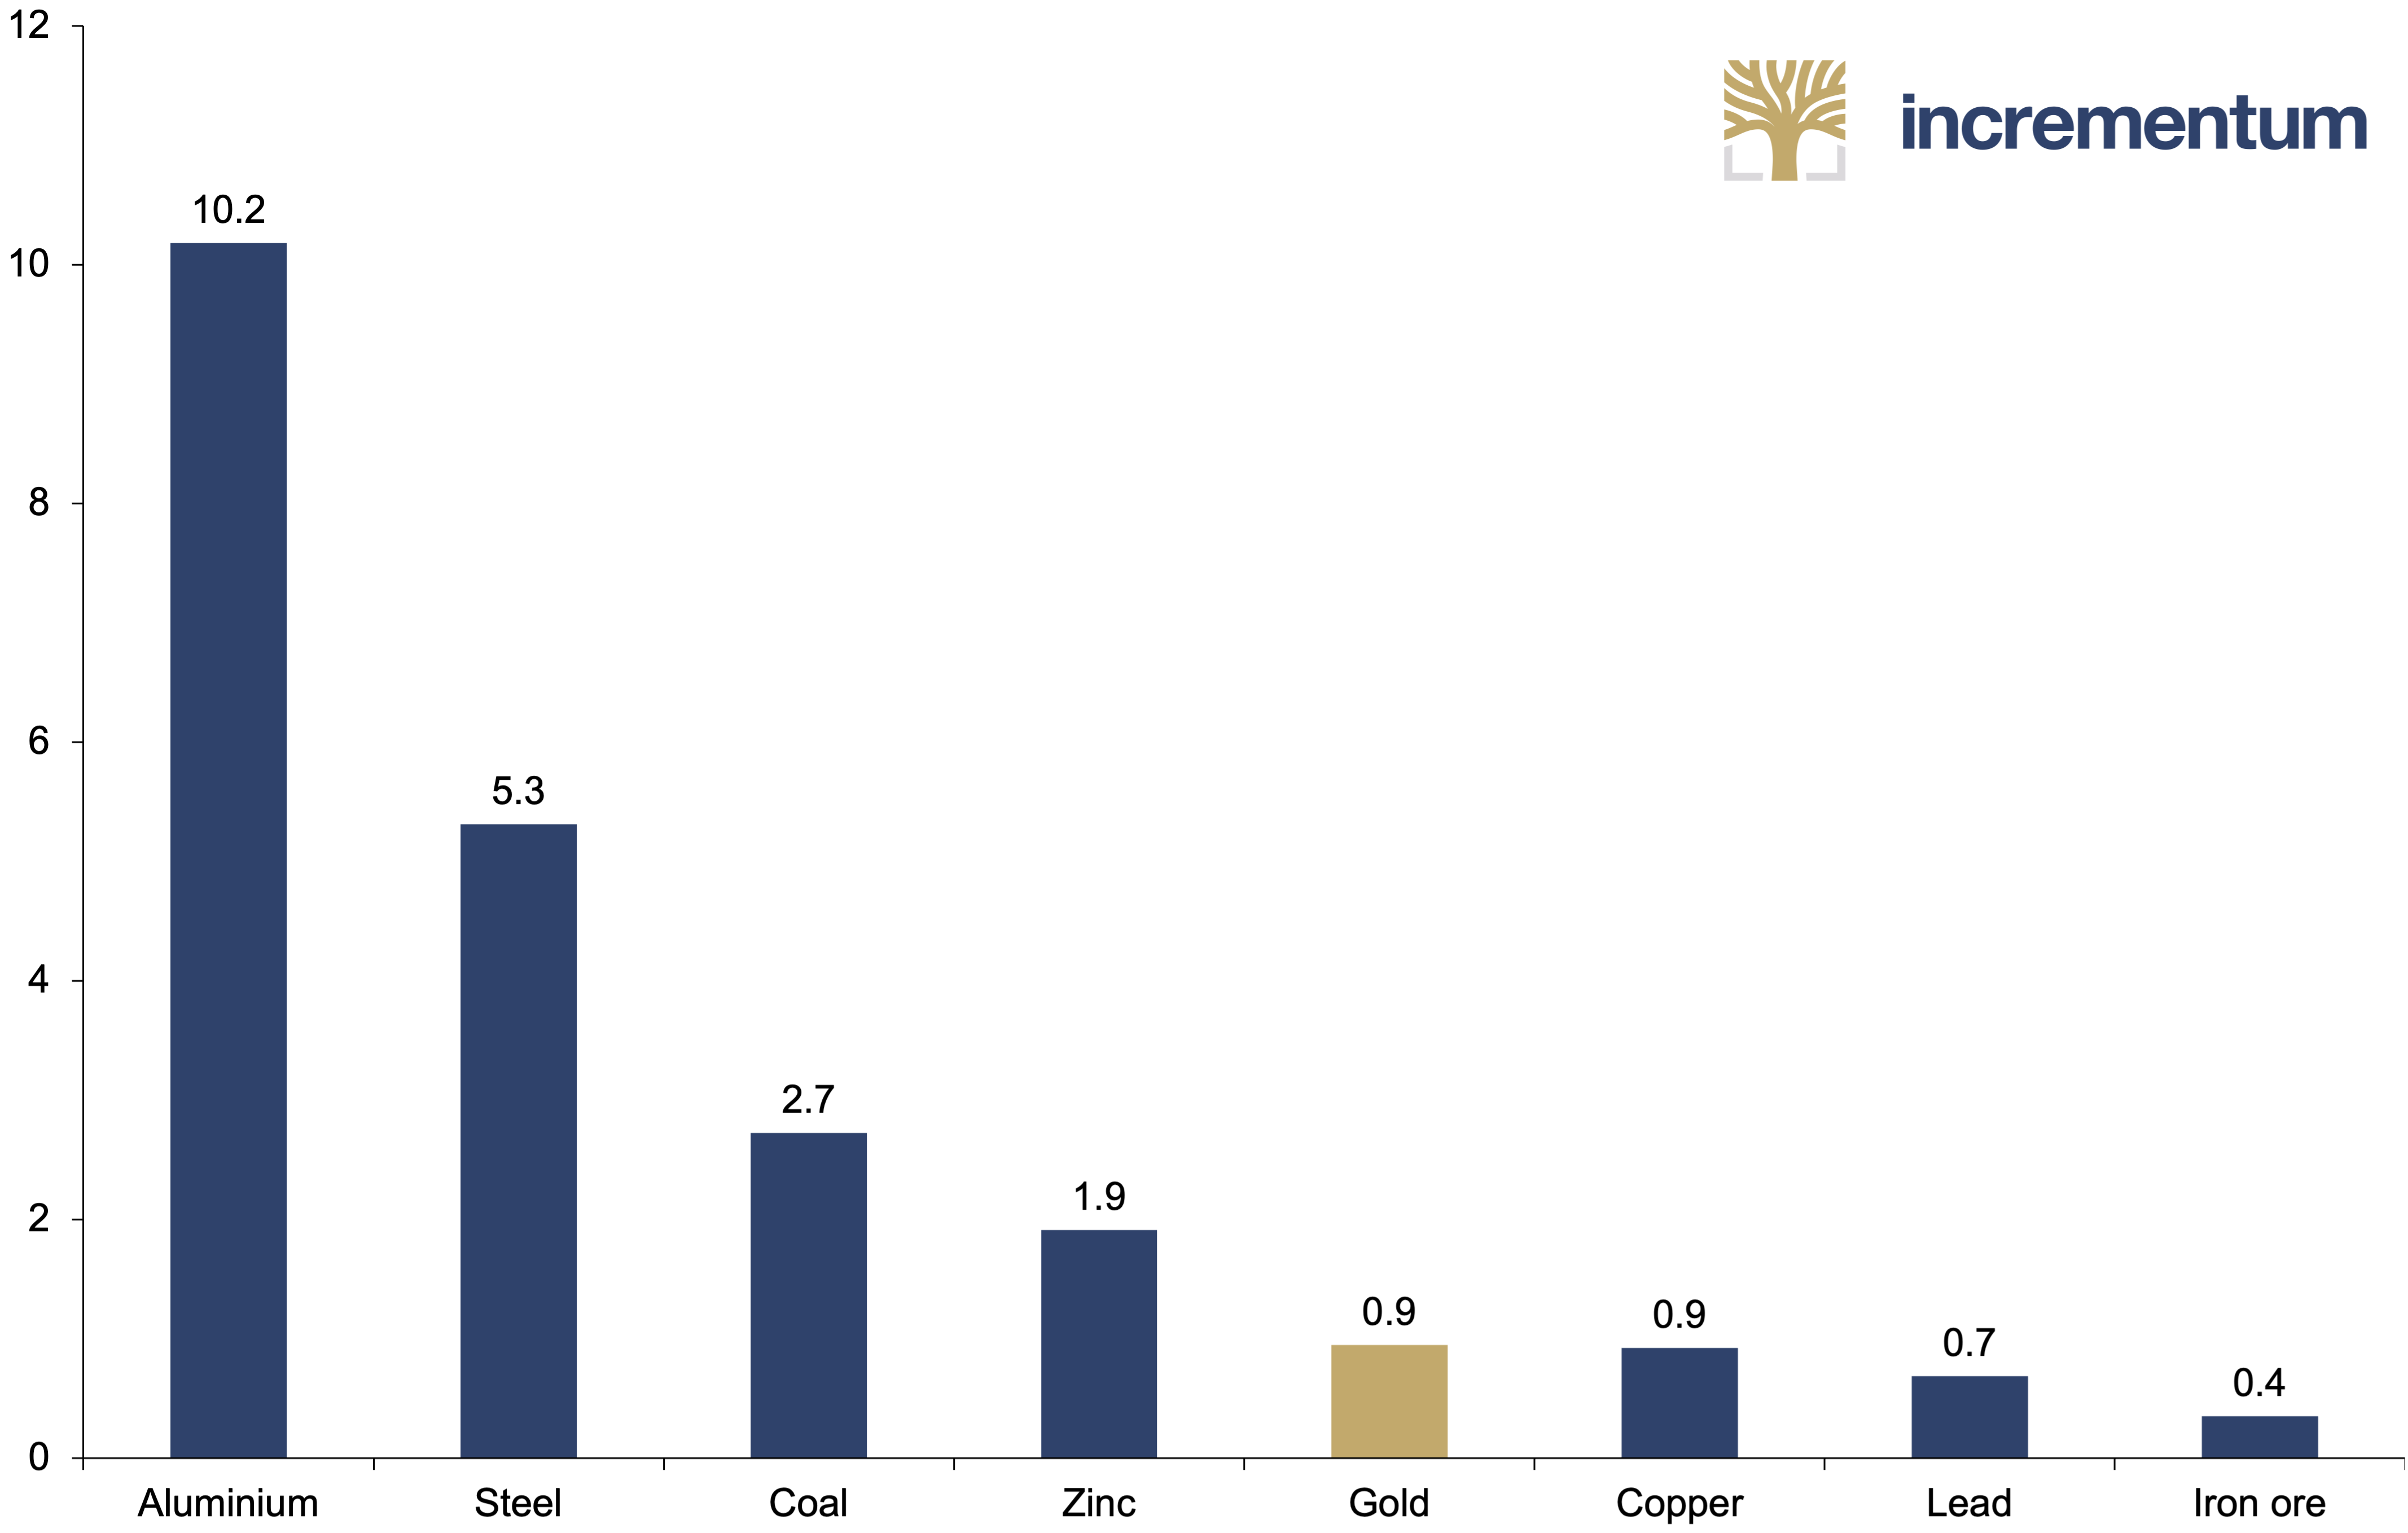
Source: Metals Focus, S&P Global Market Intelligence, World Steel Association & EIU, World Gold Council, Incrementum AG
As a result of geopolitical tensions, recycling is now also taking on strategic significance. After all, recycling reduces the demand for newly mined metals, some of which have to be sourced from countries with which the importing country has a critical relationship. For example, the EU meets 100% of its demand for heavy rare earths from China, 98% of its demand for boron from Türkiye, and 71% of its demand for platinum from South Africa.
Thus, there is a need for at least 25% of the annual consumption of the 34 minerals listed as critical raw materials in the EU to be obtained through recycling by 2030. This would also contribute to developing the circular economy desired by the EU.
Where Are Precious Metals Recycled?
The gold recycling market can be divided into high- and low-grade categories. Depending on the category, different factors influence the recycling location.
High-grade scrap
High-grade scrap consists primarily of metal with minimal nonmetallic components that displays a minimum of 40% gold purity, with most of it achieving higher percentages. Due to its high monetary value and expensive transportation and insurance costs, high-grade scrap is typically refined in its country of origin.
The United States occupies a central position in the precious metals recycling ecosystem. In 2023, it contributed 100 t of recycled gold to the global supply. Major US-based refineries specializing in gold recycling include Asahi Refining (which acquired Johnson Matthey in 2015), The Refining Company, and Palladium Refining. China and India also account for a substantial share of the global recycled gold supply.
In Europe, Italy has developed a well-established jewelry industry, particularly in cities like Florence and Vicenza, which drives significant gold recycling in the region. The country’s focus on high-quality gold jewelry and luxury goods has created a robust market for recycled gold, especially in gold scrap from old jewelry. The Italian gold recycling market also benefits considerably from the EU’s open borders, importing large volumes of gold scrap from neighboring countries. Italy had firmly established itself as the world’s 3rd largest gold scrap supplier, recycling 116.5 t and ranking alongside the US and China.
Dubai plays a similar central role for the Middle East. Its outstanding importance for the gold trade was recognized in an entire chapter of the In Gold We Trust Report 2024. While the city is renowned as the region’s gold trading center – with 20–30% of all gold traded globally each year passing through the city –, it unsurprisingly also handles large volumes of gold recycling for neighboring countries that lack gold refinery facilities.[9] Today, some of the world’s largest refineries operate in Dubai, including MTM Gold Refinery DMCC, Emirates Gold, and SAM Precious Metals.
Switzerland, the world’s dominant gold refining country, is also a major player in gold recycling. Home to five of the world’s largest and most essential refineries – MKS PAMP, Argor-Heraeus, Metalor, Valcambi, and Cendres Métaux – Switzerland processes and mints approximately 70% of all globally mined gold. Valcambi is the largest refinery worldwide, processing more than 2,000 t of gold, silver, platinum, and palladium per year.
A survey of 2,633 Swiss people conducted by the University of St. Gallen on behalf of philoro Edelmetalle in 2023 showed the widespread use of gold recycling in Switzerland. 52% of respondents stated that they had sold old gold jewelry at least once. 35% of respondents who cited “quick money” as the reason for selling were particularly pleased with the gold price rally and the high liquidity of gold. However, to profit appropriately and achieve an adequate selling price, the price estimation method and the buyer’s seriousness are essential. 12% of respondents stated that an estimate was based on gut feeling or a sense of proportion, while only 10% required the use of the precise method of X-ray fluorescence analysis to determine the price.
Low-grade scrap
Lower-grade scrap material contains a very low precious metal content of around 1% or less, found in sources such as burnt electronic scrap or non-auto catalysts. Compared to high-grade scrap, low-grade precious metal scrap has a lower monetary value per unit, consequently presenting less financial risk to transport. As a result, there is worldwide competition for these materials, although fewer specialized refineries can process them efficiently. Japan has developed expertise in this sector, becoming well known for importing and recycling this category.
Worldwide, countless gold and silver refineries operate; however, the most important ones have received accreditation by the LBMA (London Bullion Market Association) for adhering to the stringent standards of Good Delivery or by the Responsible Jewelry Council (RJC) Chain of Custody standard (COC). On a global scale, the top refineries are: Agosi (Pforzheim, DEU); Argor-Heraeus (Mendrisio, CH); Cendres + Métaux (Biel, CH); Emirates-Gold (Dubai, ARE); Engelhard (Newark, USA); Heimerle+Meule (Pforzheim, DEU); Heraeus (Hanau, DEU; Johnson Matthey (London, GBR); Metalor (Neuchâtel, CH); PAMP (Castel San Pietro, CH); Perth Mint (Perth, AUS); Rand Refinery (Germiston, ZAF); Tanaka-Kikinzoku (Tokyo, JAP); Umicore (Brussels, BEL); Valcambi (Balerna, CH).
The Good Delivery standard (GDG) by the LBMA, not only specifies strict criteria for gold and silver bars to be allowed in settlement at the wholesale London bullion market, but also includes a comprehensive list of all approved refineries capable of producing gold and silver bars adhering to those criteria. For example, GDG-approved refineries must produce at least 10 t of refined gold or 50 t of refined silver per year. They must have a long-standing history in the market, solid financial standing, including a tangible net worth of at least GBP 15mn, and produce bars of approximately 400 oz for gold and 1,000 oz for silver.
Furthermore, the casting process, final appearance, markings, size, and other specifications are laid out. Additionally, all bars not meeting the high technical standards must be stamped as NGD (Non-Good Delivery) near the LBMA-approved manufacturer’s mark. Strict independent quality controls ensure the maintenance of this high standard.
Thanks to the reputation and market trust placed in Good Delivery, the direct trade of precious metals (OTC) in the Loco London Market has evolved to its current size. All market participants can trust that all bars have the same fine ounce weight, purity, and physical appearance. Currently, a total of 85 refineries in 27 countries are listed as approved for Good Delivery by the LBMA.
Many international precious metals exchanges refer partly or fully to the LBMA’s Good Delivery Standard to categorize the refiners accepted in their markets. International exchanges using the LBMA reference include ICE, Borsa Istanbul, CME Group, TOCOM, the Singapore Bullion Market Association, Shanghai Gold Exchange, and Dubai Multi Commodities Centre. Importantly, beyond the outlined criteria for a Good Delivery Bar by an accredited refinery, only acceptance by a London vault transforms such a bar into a London Good Delivery (LGD) bar. In other words, the London vault managers serve as the true gatekeepers for Good Delivery by accepting LGD bars into their vaults and, hence, into the Loco London marketplace.
On the other hand, the Chain of Custody (COC) Standard by the Responsible Jewelry Council (RJC) specifies an approach for participants in the jewelry market on how to trade precious metals in a fully traceable, ethical, and responsible way.
Key Steps in Gold and Silver Recycling
Gold and silver recycling follow similar processes, with a few distinctions due to their different physical and chemical properties. The key steps in gold and silver recycling include collection, sorting, physical processing, chemical processing, and refinement to meet market standards.
Collection
The recycling journey begins with the collection of gold- and silver-containing materials:
- Gold: Sourced primarily from old jewelry, as well as electronics (smartphones, computers, and circuit boards), dental work, and industrial machinery.
- Silver: Collected from jewelry, coins, flatware, photographic film, electronics, and older mirrors.
Sorting and Pre-Treatment
Materials undergo sorting to separate precious metals from other components:
- Gold: Jewelry or electronics require disassembly to isolate gold-containing components (e.g., connectors or pins).
- Silver: Items are cleaned to remove tarnish or contaminants and sorted based on their purity.
Shredding or Crushing
- For larger items or bulk materials, gold and silver are shredded or crushed to make extraction easier.
- Electronics, for instance, are often crushed to release small gold or silver components.
Melting
- The gold pieces are placed in a furnace, where they are heated to a temperature of approximately 1,064°C, i.e. the melting point of gold. Any non-gold components, such as stones or plastic, are removed or separated.
- The process of separating silver from gold is known as “parting.” Depending on the desired purity of the final gold, either the Miller or the Wohlwill process is used.
Refining
- Once the gold is melted, it is refined to remove impurities and other metals. There are several refining methods used to purify gold, including:
- The aqua regia process: This chemical method involves a hydrochloric and nitric acid mixture. The gold dissolves in this mixture, and the impurities are separated. The dissolved gold is then precipitated out using other chemicals.
- The electrolytic process: This method uses electricity to purify the gold. The gold is placed in a solution of gold chloride, and an electric current is passed through it. The gold is deposited onto an electrode, leaving impurities behind.
- The cupellation process: This involves heating the gold to high temperatures in a cupel, where it is oxidized and impurities are absorbed by the cupel, leaving pure gold behind.
- Both metals undergo various treatments to ensure high purity, typically over 99%.
Purification
- Further purification steps are sometimes required to achieve the highest purity level, especially if the metal is used for specific high-grade applications.
Casting
- After purification, gold and silver are cast into bars, ingots, or coins. This allows them to be stored, traded, or reused in manufacturing processes.
- Gold is often cast into large gold bars or ingots, or is shaped into coins or jewelry, depending on demand.
- Silver: After refining, silver is cast into bars, coins, or sheets for industrial use.
Quality Control and Reintroduction into the Market
- A final inspection ensures the metals meet the required purity and quality standards.
- Both gold and silver are tested, often by assaying, to ensure that they meet industry specifications.
- The final step in the recycling process is selling and distributing the refined gold. Recycled gold is sold to manufacturers who use it to produce new jewelry, electronics, or investment products.
- Gold from recycled jewelry is indistinguishable from newly mined gold, making it a valuable resource for various industries. As demand for gold continues to rise, recycled gold will play an increasingly important role in meeting the supply requirements.
Conclusion
Precious metals recycling has flown under the radar of public interest despite the growing popularity of gold and silver as investment assets. Yet recycled gold accounts for 25% of the global gold supply, while recycled silver represents 18% of the total silver supply. The remainder of the supply for both metals comes from traditional mining operations, with the ratio between recycling and mining supply remaining surprisingly constant over recent years.
The recycling markets for gold and silver exhibit fundamentally different drivers, reflecting their distinct usage profiles and market structures. For gold, recycling is dominated by jewelry, which accounts for roughly 90% of scrap supply, while electronic waste plays a minor role. This composition makes gold recycling highly price-sensitive, as individuals typically sell jewelry in response to financial distress or psychological triggers – such as record-high prices. Consequently, gold scrap acts more as a price taker than an independent supply buffer.
In contrast, silver recycling is shaped by its industrial applications. A significant share of fabricated silver is never recovered due to uneconomically small quantities per unit. The largest sources of recycled silver — electronics, solar panels, and legacy photographic films – are less responsive to price fluctuations, as recycling rates depend more on product life cycles and environmental policies. However, jewelry and silverware scrap remain price-sensitive, mirroring gold’s behavior but on a smaller scale.
These differences highlight a key divergence: gold recycling is driven by emotional and economic factors, while silver recycling is largely dictated by industrial and regulatory forces. Understanding these dynamics is critical for assessing secondary supply elasticity in precious metals markets.
Closer examination reveals an intriguing trend: since 2015, scrap gold has represented a steady share of around 25% of the global gold supply. The current scrap gold ratio of 27.5% falls significantly short of pre-2015 levels. Despite record gold prices, this comparatively modest increase can be interpreted as a fundamental shift in gold owners’ perception of the metal. Increasingly, physical gold is viewed not merely as a disposable asset to be liquidated when prices rise but as a long-term store of value to be retained through economic cycles.
[1] See “Gold Mining in China,” In Gold We Trust report 2021; “Mining Stocks: The Party Has Begun,” In Gold We Trust report 2020; “Precious Metals Shares – More Than a Silver Lining?,” In Gold We Trust report 2018
[2] Naudé, W.: “The Malthusians and the Cornucopians”, In: Naudé, W.: Economic Growth and Societal Collapse, 2023
[3] See “Asteroid Mining and Deep-Sea Mining,” In Gold We Trust report 2024
[4] See “Life Cycle of a Mining Project,” In Gold We Trust report 2023
[5] See “Stock-to-Flow Ratio as the Most Important Reason for Gold’s Monetary Importance,” In Gold We Trust report 2013
[6] See also “Breakout or Fake-out: Is this Silver’s Golden Moment?,” In Gold We Trust report 2024; “Silver’s Time to Shine?,” In Gold We Trust report 2023
[7] See also “Breakout or Fake-out: Is this Silver’s Golden Moment?,” In Gold We Trust report 2024; “Silver’s Time to Shine?,” In Gold We Trust report 2023
[8] See “The New Low-Emissions Economy: Gold as a Savior,” In Gold We Trust report 2022
[9] See “Dubai, the Golden Oasis Driving the UAE Gold Market’s Growth,” In Gold We Trust report 2024