The Challenges of the Gold Mining Industry
“Either you understand your risk, or you don’t play the game.”
Arthur Ashe
Key Takeaways
- Although there are some exceptions, the gold miners as a group tend to underperform gold in the long term.
- The main reasons for the underperformance have been CAPEX overruns, growing production costs, problems with permitting of new mines, governments wanting a bigger share of the pie, political instability, and declining reserves and a lack of new major discoveries.
- It is possible to expect “all-in sustaining cost” (AISC) to keep on growing in the foreseeable future, due to rising energy and construction materials prices, wage demands, and inflation in general.
- A segment of the mining industry that should do well in the inflationary environment are the royalty & streaming companies.
As history demonstrates, every gold rush has ended up in vain for the vast majority of participants. Thousands and thousands of people left their homes and wandered to the far ends of the Earth to find gold and secure a better life for themselves and their families. But only a small fraction of them really found what they were looking for; Gold, wealth, and a better life.
Times have changed, and modern-day gold rushes do not take the form of thousands of prospectors crossing a continent. Today, the hordes of prospectors have been replaced by hundreds of mining companies of all sizes. And hundreds of thousands of investors are betting on the success of these companies. But as the chart below shows, the gold mining sector as a whole is not a good long-term bet. Although there are some success stories – just as there are also many companies that deliver to their investors only losses, or at least long-term stagnation and frustration. Thus, when investing in gold mining stocks, two things are important: 1) pick the mining company wisely, and 2) have good timing. It is optimal, of course, to combine both.
The following chart shows the long-term development of gold prices and the Barron’s Gold Mining Index (BGMI). As can be seen, the difference in yield has widened over the years to a very high level. While between January 1970 and December 2021 the gold price increased by 4,937%, the BGMI grew by “only” 1,027%. The difference in performance was relatively small for decades – both curves were moving in the same direction without any major deviations. However, over the last 15 years the situation has changed rapidly. The gold miners have lagged behind the gold price.[1]
Gold and BGMI, 0% = 01/1970, 01/1970-05/2022
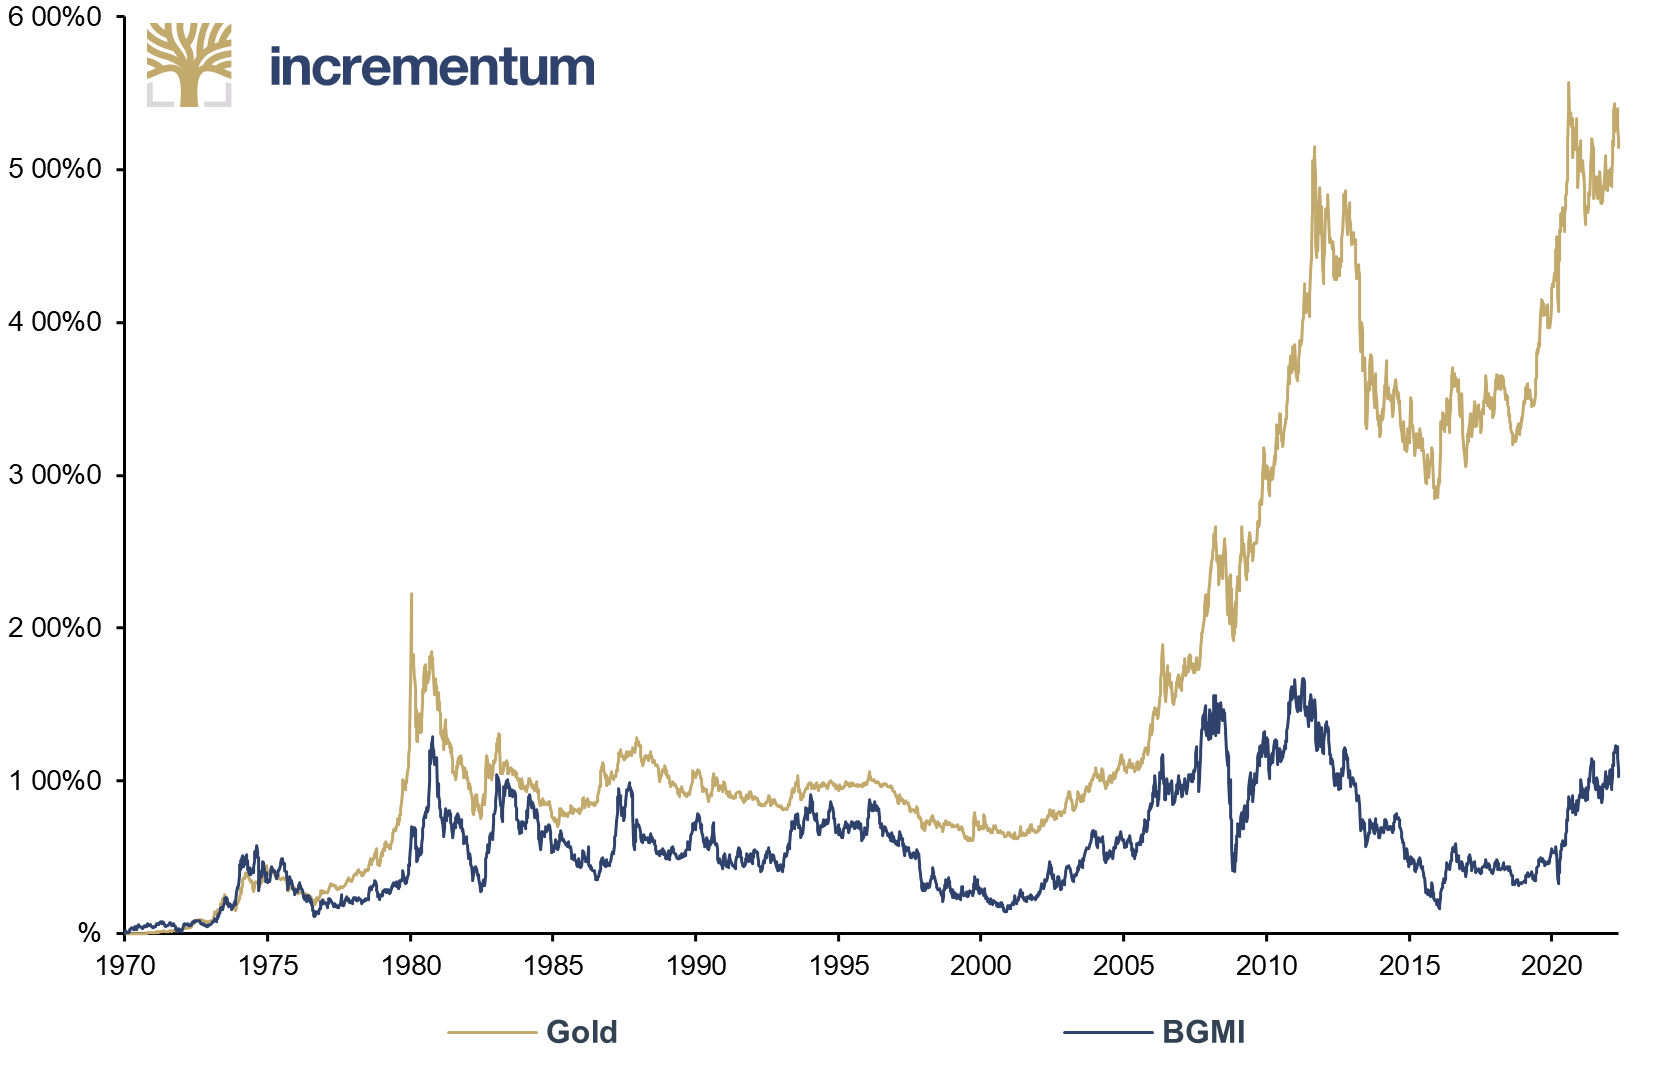
Source: Nick Laird, Reuters Eikon, Incrementum AG
In the early phases of the Global Financial Crisis of 2008, the gold price fell. However, it started to recover very quickly, erased its losses in early 2009, and continued in 2011 to new record highs just below USD 2,000. However, at the same time, the gold miners were barely able to return to the pre-crisis highs. But when the gold price again started to decline, they declined even more strongly. And during the current gold market, as gold prices have broken the USD 2,000 barrier and set new record highs, the BGMI has been unable to even approach its previous highs.
Over the whole 52-year time period, the correlation between gold and the BGMI was 0.56, which is a relatively strong positive correlation. But the numbers start to be really interesting when the time period is divided into two subperiods. Between January 1970 and August 2008, the correlation was 0.9, which is very strongly positive. However, between September 2008 (with the collapse of Lehman Brothers and official start of the Global Financial Crisis) and December 2021, the correlation was only 0.35.
This trend is also confirmed by the performance of the popular investment products SPDR Gold Trust ETF (GLD), VanEck Vectors Gold Miner ETF (GDX), and VanEck Junior Gold Miners ETF (GDXJ). The observed time period starts on November 11, 2009, when GDXJ (the youngest of the three ETFs) was established. While the gold price grew by 54% over the 12-year period, GDX, focused on the bigger gold producers, declined by 33%; and GDXJ, focused on smaller producers, explorers, and developers, declined by 50%. But despite the overall declines, there were subperiods when good timing of the market could result in very pleasant gains.
GLD, GDX and GDXJ, 0% = 01/2010, 01/2010-05/2022

Source: Reuters Eikon, Incrementum AG
Why the poor performance of the gold miners? Actually, there are several reasons. Some of the companies are impacted by only one or two of the factors, while some, the less lucky ones, are burdened by all of them. The main factors that need to be mentioned are CAPEX overruns, growing production costs, environmental constraints and problems with permitting, governments wanting a bigger share of the pie, and political instability, as well as declining reserves and a chronic lack of new “major discoveries”.
Environmental Constraints and Problems with Permitting
Permitting a mine is becoming ever more challenging. Even in mining-friendly countries, the procedure is becoming increasingly complex and time-consuming. Thus, obtaining permits takes ever more effort and resources. And sometimes even those efforts and resources are not a warranty of success. A good example is Taseko Mines’ New Prosperity project, situated in British Columbia, with reserves of 11mn toz gold and 4.2bn lb copper. Back in 2010, the project received provincial permits – but not federal ones. Taseko modified its development plans and resubmitted the application, but unsuccessfully. Now, more than 10 years later, the project is still frozen, without any meaningful progress having been made.
Well-known is the story of the giant Pebble deposit in Alaska. Its resources contain copper, gold, silver, molybdenum, and rhenium worth more than USD 600bn at current metal prices. However, there is strong opposition against the project, due to the potential damage that could be caused to the salmon population in Bristol Bay. As a result, the permitting process turned into a never-ending story.
Also worth mentioning is the story of Lydian International. The company was building the Amulsar gold mine in Armenia. Yet shortly before the mine was completed, some of the locals who opposed the mining project initiated a road blockade that disrupted construction activities. An Armenian court declared the blockade illegal, but the Armenian government was unable to enforce the law and end the blockade. As a result, Lydian went bankrupt, as it was unable to start repaying the debts it took up to fund mine construction.
Resource Nationalism: Governments Want a (Much) Bigger Share of the Pie
Another problem miners have to face are growing government demands. In developed countries it is harder and harder to get a mine permitted; but at least, after permission is granted and the mine built, ownership rights are well protected. On the other hand, in emerging and developing countries it is often easy to build a mine; however, it is harder to keep it, as governments want bigger and bigger shares of the pie. Besides increasing production taxes, they sometimes decide to seize a mine.
The latest example is Centerra Gold and its Kumtor mine. The mine is located in Kyrgyzstan, a central-Asian former Soviet republic. The giant mine has been in production since 1997, and over the last 5 years it produced 561,000 toz gold per year on average. Moreover, all-in sustaining costs (AISC) are only around USD 700/toz gold, and reserves should be sufficient for another 10 years of mining at current rates. Centerra has long had problems with local authorities, who accused the mine of violating environmental regulations. Moreover, the Kyrgyz government demanded higher taxes. The situation escalated in spring 2021 when a tailor-made law enabling the government to impose external management over the Kumtor mine was adopted by the Kyrgyz parliament, and the mine was subsequently nationalized. An arbitration between Centerra and Kyrgyzstan is underway, but the damage to Centerra’s share price was already done.
But this is no exception. Barrick Gold has been in disputes with the government of Papua New Guinea over the Porgera mine for years, and Freeport-McMoRan was forced to give away the majority stake in the Indonesian Grasberg copper-gold mine.
Political Instability
Politics does not impact the miners only through higher taxes and mine seizures. For example, Africa has recently been hit by a wave of coups. In 2021, coups occurred in Mali, Sudan, Guinea, and Chad, and also Burkina Faso in January 2022. The coups bring a lot of insecurity, as they are usually accompanied by some violence that may escalate rather quickly. Moreover, it is usually hard to guess what policies to expect of the new government, which is often led by military leaders whose ability to throw their weight around far exceeds their ability to understand simple economic mechanisms. This is why investors tend to punish mining companies operating in politically unstable countries, even if their operations are not affected, or at least not directly.
Of the Western gold miners with notable exposure to Russia, Kinross is the biggest. The Kupol mine was projected to produce 350,000 toz of gold equivalent in 2022, which would equal to 13% of Kinross’ overall production. However, Kinross also owns the feasibility-stage Udinsk project. According to this prefeasibility study, Udinsk was meant to produce nearly 300,000 toz gold per year at an AISC of USD 580/toz on average, over a 7-year mine life. Shortly after the beginning of the war, Kinross has suspended its Russian operations. The initial market reaction to the war in Ukraine sent Kinross’ shares down 10% , but the losses were recovered in less than two weeks. According to the latest news, Kinross made an agreement with Highland Gold, to sell Kupol and Udinsk for USD 600mn.
Share Dilution
Another potential problem is share dilution. For mining companies, equity financing is often the only option for financing common operations and further development of mining projects. The negative impacts of share dilution are most visible in the case of the explorers and junior miners. They often have only very limited access to other financing options; and due to the risky nature of their business, they often have to undergo equity financings at very unfavorable terms. That means they must issue new shares at very low prices, and they often have to add some warrants in order to attract more investors. As a result, their share counts may grow by hundreds of percent in only a few years.
Basic Weighted Average Shares Outstanding, 100 = 2012, 2012-2021
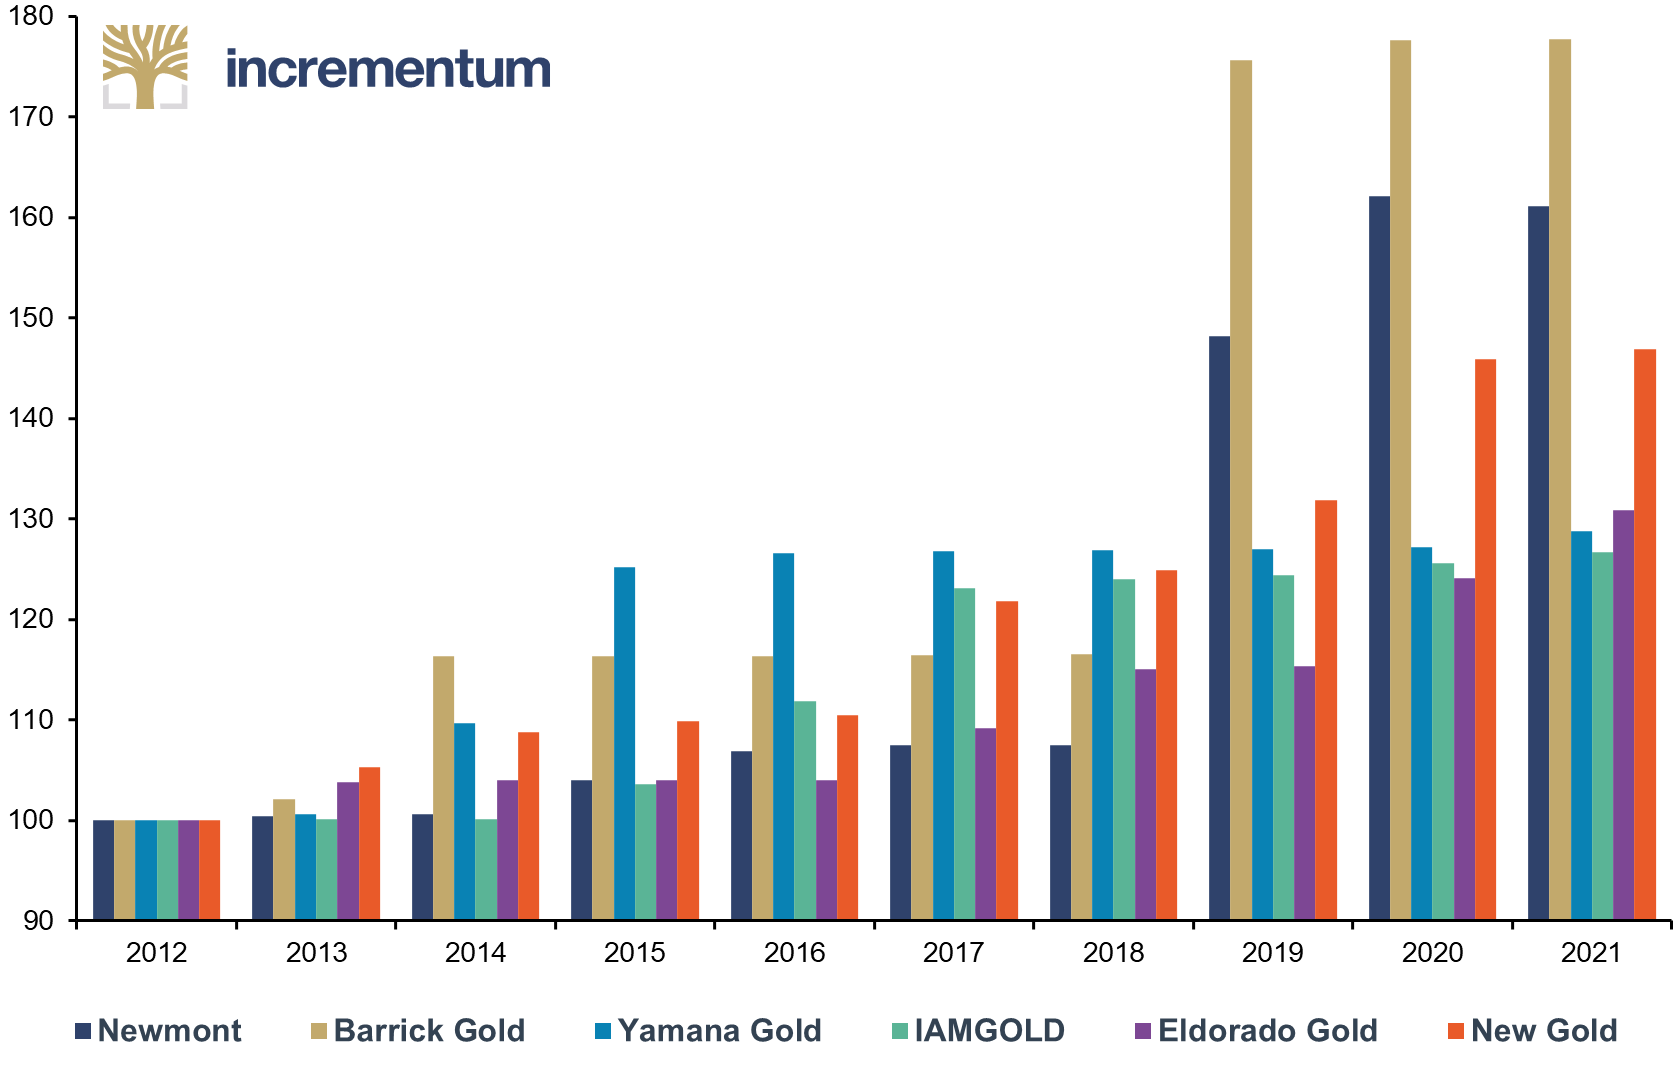
Source: Company Annual Reports, Incrementum AG
The chart above demonstrates that share dilution also impacts the bigger players in the gold mining industry. They are less dependent on equity financings, as they have much better access to debt financing. However, they often use shares as compensation for their managers and directors. And, sometimes, they encounter operational issues, and as their debt capacity is exhausted, equity financing is the only option for getting out of trouble. For example, CAPEX overruns during Rainy River mine construction were a major factor behind New Gold’s 47% growth in share count between 2012 and 2021. And Eldorado Gold was negatively affected by operational issues at the Kisladag mine, which contributed to 31% growth in share count over the same time period.
Moreover, the mining companies commonly pay for acquisitions of new projects or whole companies with their shares. As can be seen in the chart above, Barrick Gold’s share count grew by 78% over a 10-year period. However, the majority of the growth is attributable to the merger with Randgold that was completed in 2019. Similarly, the majority of Newmont’s share count growth is attributable to the merger with Goldcorp. In these cases, share dilution doesn’t have to be a bad thing. Of course, that assumes that the asset that is being acquired is reasonably valued and the acquirer is not overpaying.
Declining Reserves and Number of New Discoveries
A big problem of the gold mining sector is the declining number of new gold discoveries, regardless of the volume of exploration budgets.[2] As shown in the chart below, although exploration budgets are more than twice as high as in the 1990s or early 2000s, the volume of discovered gold is much smaller. This means that in general it has become significantly more expensive to discover an ounce of gold. As a result, it has become more and more difficult – and also more expensive – for the gold miners, especially the big ones, to replenish the extracted ounces.

A study by S&P Global Market Intelligence shows that in recent years the companies focused more on exploration of known deposits, i.e.brownfield exploration, instead of grassroots exploration. Therefore, out of 329 gold deposits discovered between 1990 and 2020, only 29 were found over the last decade. Moreover, they contain only 8% of all gold discovered since 1990. This is the main reason why S&P expects gold production to be relatively flat in 2022 and 2023 and to start declining in 2024.
As can be seen in the next chart, even the biggest gold miners, despite their expertise and deep pockets, have problems replenishing reserves. Out of the top five gold miners, only Polyus Gold did not experience a decline over the past decade. The reason is the giant Sukhoi Log deposit, where reserves of 40mn toz gold were outlined in 2020. Newmont’s reserves experienced only a slight decline, thanks to the merger with Goldcorp back in 2018. The main reasons for declines are depletion of deposits; sale of assets, usually the non-core ones; and, in 2012–2013, following the steep gold price decline, updating reserves figures using lower gold prices, as a smaller portion of resources is now economically mineable and can thus be classified as reserves.
Volume of Gold Reserves, in mn Troy Ounces, 2011-2020
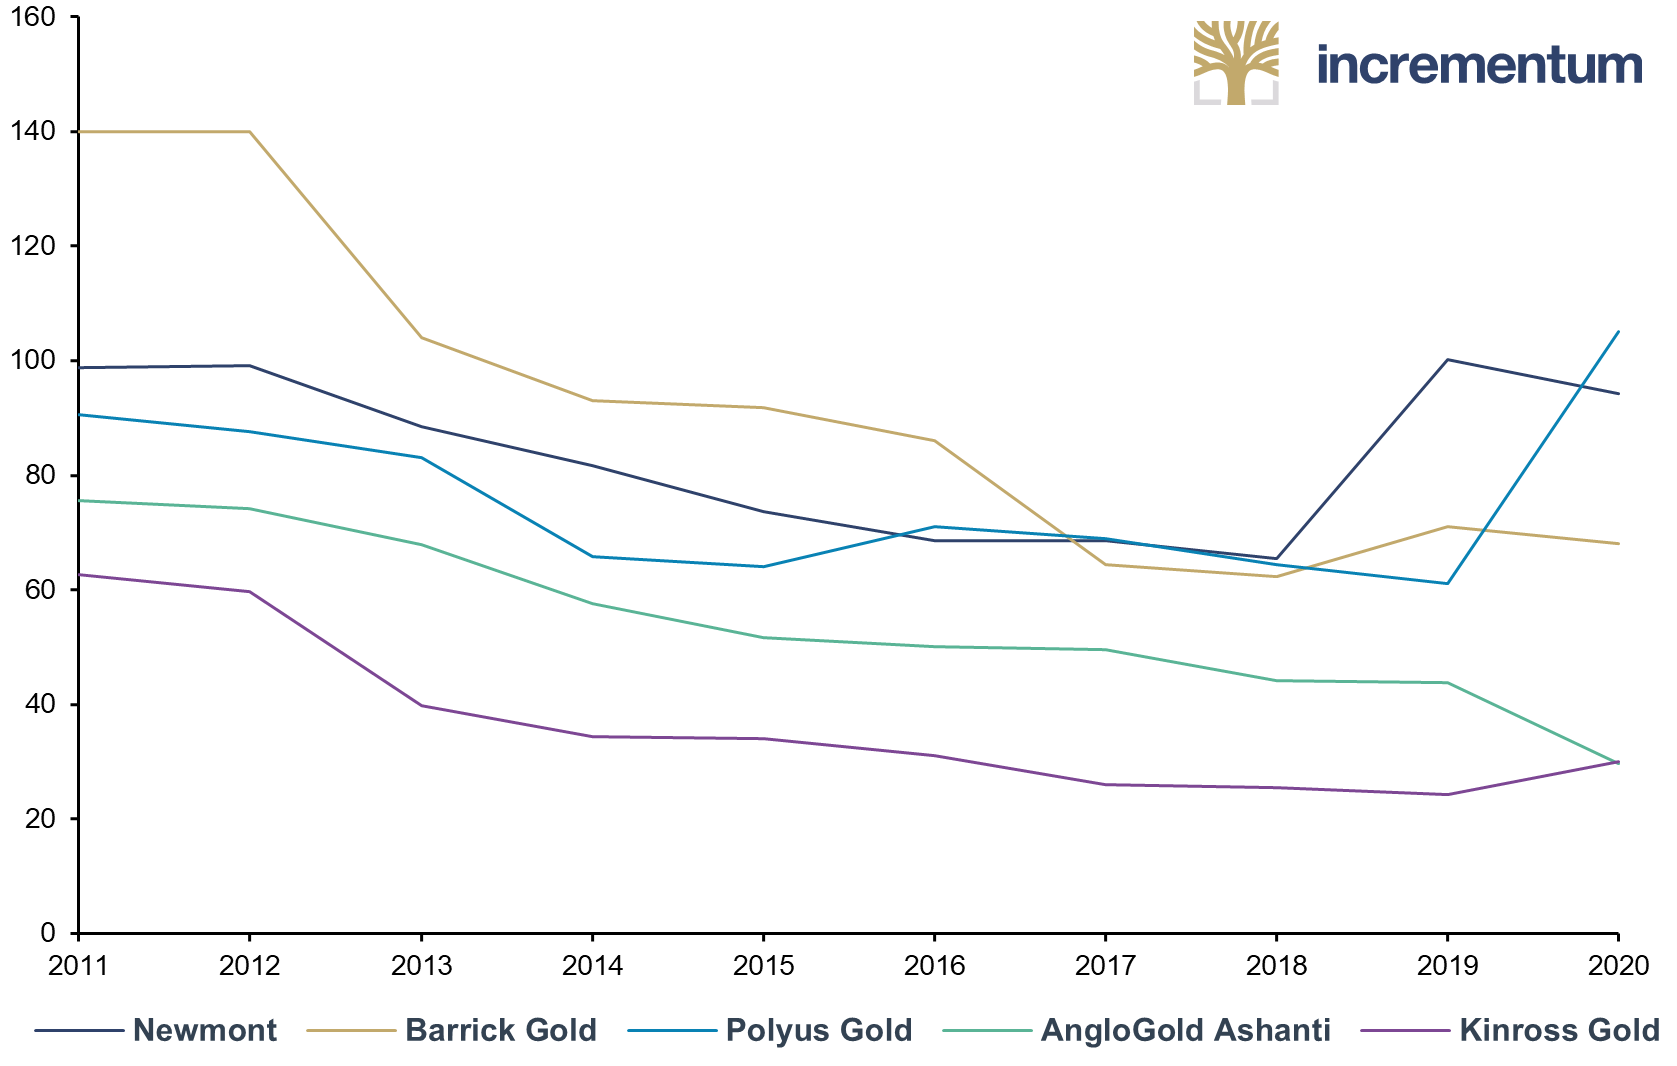
Source: Compnay Annual Reports, Incrementum AG
CAPEX Overruns
A study prepared by McKinsey and PDAC investigated 41 gold mines established between 2008 and 2018 that had a CAPEX of USD 0.5bn or higher. According to their results, only 20% of investigated projects experienced no cost overruns. On the other hand, 44% of projects experienced 15-100% cost overruns, and 19% of projects suffered even greater than 100% cost overruns.
A notorious example of a giant cost overrun is Barrick Gold’s Pascua Lama project. Its initial CAPEX was, back in 2000, estimated at USD 1.2 bn. By 2004, the estimate grew to USD 1.4–1.5bn. In 2009, when mine construction started, CAPEX was estimated at USD 2.8–3.0bn. In 2011, Barrick announced that mine construction would cost USD 4.7–5.0bn. However, in 2012 the number increased further to USD 7.5–8.0bn. In 2013, rumors that the CAPEX would exceed the USD 10bn mark started to spread. This is when Barrick decided to halt Pascua Lama mine construction indefinitely. Barrick blamed the cost overruns on construction delays and higher labor, energy, material, and project-management costs.
The latest example, although much less dramatic, is Argonaut Gold and its Magino project. When mine construction started in early 2021, CAPEX was projected at USD 510mn. However, in December 2021 Argonaut announced that the price tag had increased to USD 800mn, that is, by 57%. And investors should prepare to see similar announcements more frequently in the near future, as prices of steel, copper, and other materials needed for mine construction are rising, just like energy prices. Furthermore, current inflation levels will soon lead to increasing wage demands. Thus, the probability of CAPEX overruns is growing rapidly, especially in the case of mining projects that are in the construction phase, but for which feasibility studies were completed a year or two ago, or even earlier.
Growing Production Costs
A similar problem is growing production costs. This indicator is hard to follow on a longer time span, because the generally accepted methodology of reporting production costs, AISC, was adopted only in 2012. Before 2012, gold miners used different reporting methods and it was hard to compare their actual production costs. However, it is not hard to see how much those costs have gone up. Today, the biggest gold miners, except for Polyus Gold, have AISC in the USD 1,000/toz range. But only 20 years ago, in 2002, the gold price was around USD 300/toz. Therefore the AISC (although no one used the measure back then) had to be below USD 300/toz. At the current AISC, the whole industry would have been dead.
The next chart shows the development of AISC of major gold producers between 2012 and 2021. Between 2012 and 2016, the miners were able to push AISC down. They were able to do so because of weak construction materials markets, declining energy prices, and a low-inflation environment. Declining gold prices helped as well, as a lower gold price means that the miners pay lower royalties. Moreover, declining gold prices forced some of the higher-cost miners to suspend some operations or to re-evaluate their mining plans and focus on high-grade sections of the deposits. Of course, this cannot be done forever. After some time, the strategy fails, as the high-grade material gets extracted, there is only the low-grade material left, and costs shoot back up. After 2016, AISC started to stagnate or even began to rise.
All-in Sustaining Costs (AISC), in USD per Troy Ounce, 2012-2021
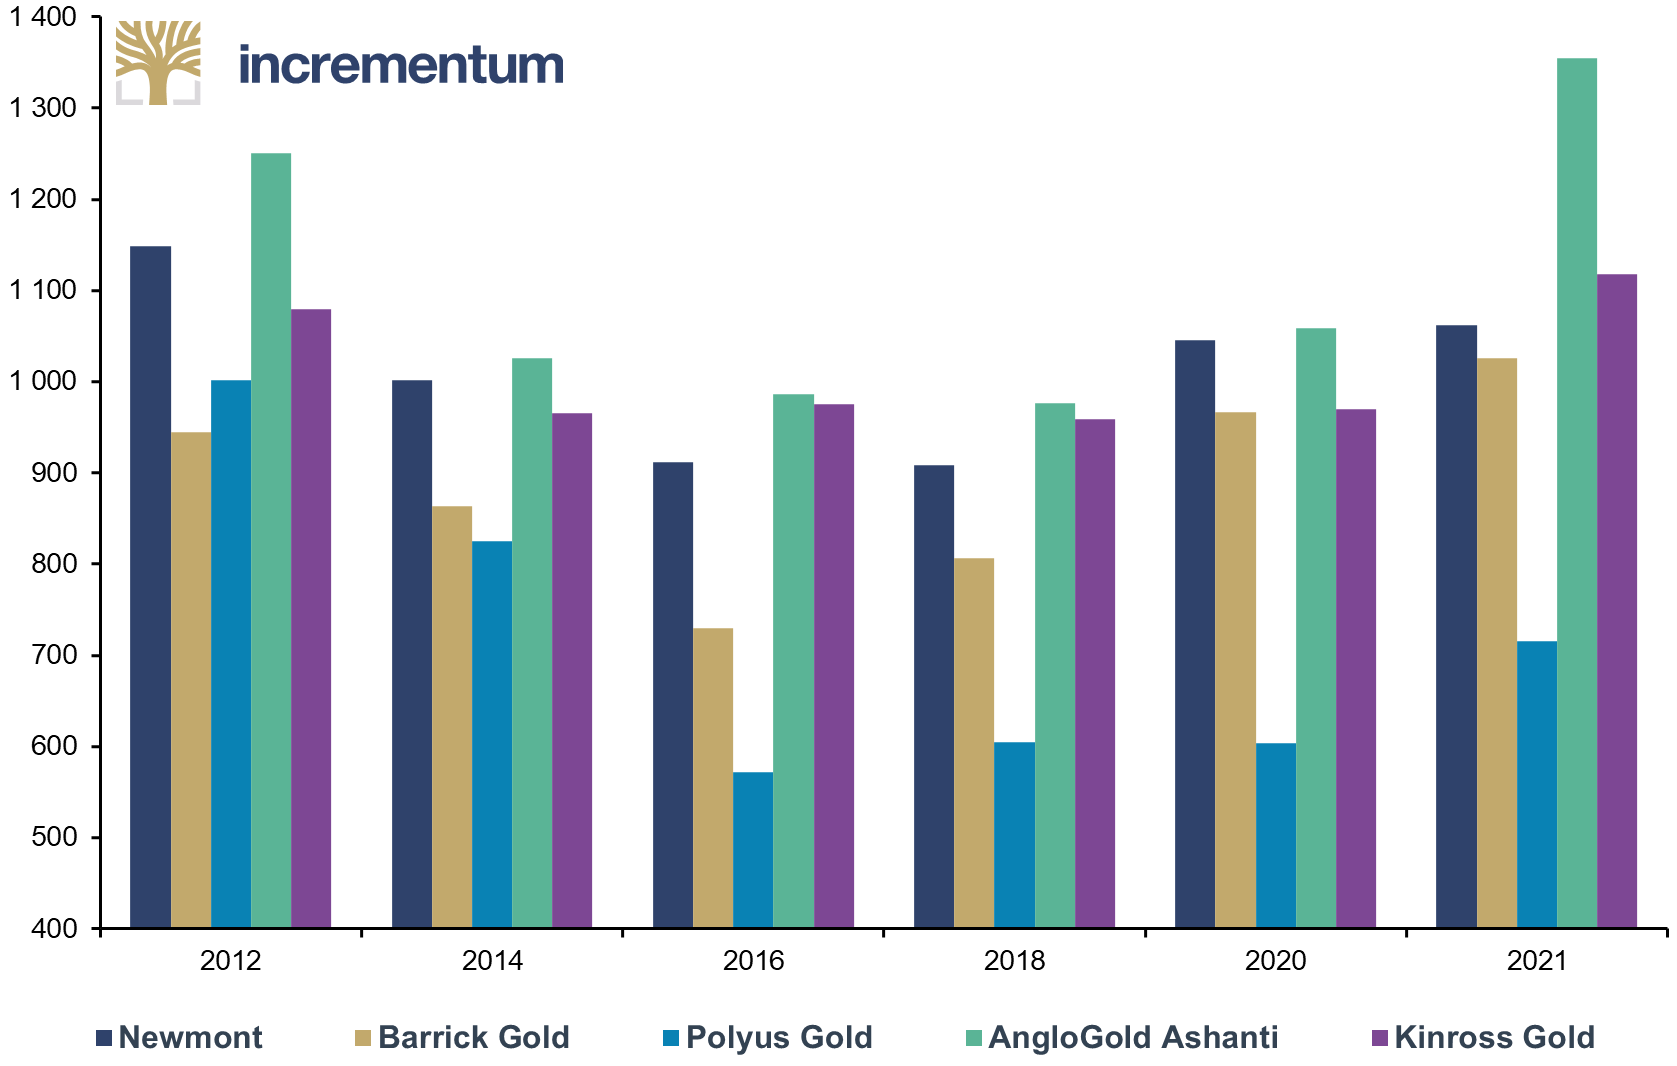
Source: Compnay Annual Reports, Incrementum AG
This trend was exacerbated by the Covid-19 pandemic, as some miners had to interrupt production, which pushed production volumes lower and production unit costs higher. Moreover, even miners that were not impacted by the pandemic directly had to adopt some pre-emptive measures that added to their costs. Moreover, over the past year or two, energy prices increased significantly, construction materials prices did too, and inflation came roaring back; thus, we may expect that escalating wage demands are only a matter of time. Add to this higher gold prices and therefore higher royalties to be paid by the miners, declining gold grades and the need to extract gold from greater depths or from deposits located in remote places with extreme weather conditions, and we could see an AISC of over USD 1,000/toz become the new normal.
The Current Inflation Environment and Related Challenges
The last two factors, CAPEX overruns and growth of production costs, are poised to be especially haunting to the mining industry in the foreseeable future. The reason is that the genie of inflation has escaped the bottle. The chart below shows the evolution of annual inflation rates in some of the major gold-producing countries over the last 10 years. The current trend in all of the seven countries is clear. Prices are growing strongly. For countries like Russia, Mexico, or South Africa, this situation isn’t new. But that cannot be said about the US or Canada, where in April 2022 the inflation rate increased to 8.3% and 6.8% respectively. For the US, this is the highest inflation rate since the early 1980s. For Canada, inflation is at its highest point since 1991.
Inflation, yoy%, 01/2012-04/2022
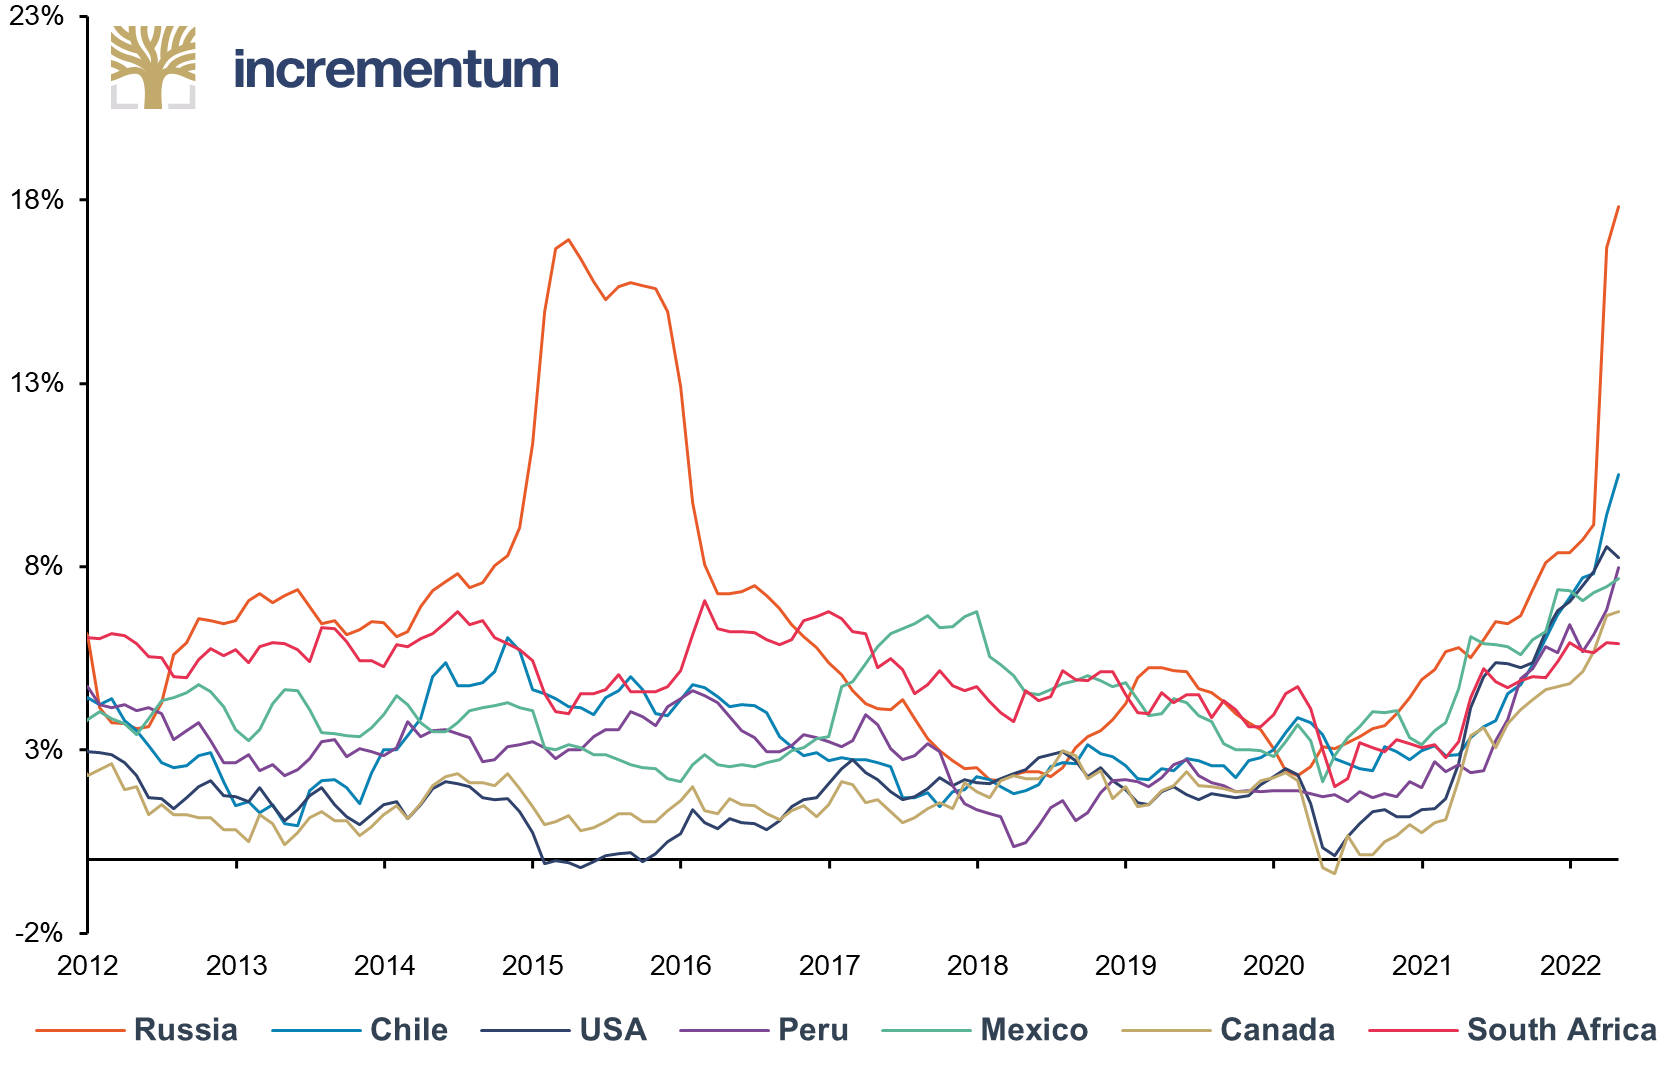
Source: Reuters Eikon, Incrementum AG
According to a study by Goldmoney, the biggest operating cost of the top gold miners is labor (39%), followed by fuel and power (20%), consumables (20%), maintenance (11%), and other costs (10%). Fuel and energy costs have already increased. Oil prices crossed the USD 100/bbl level, a level last seen back in 2014. Given current inflation levels, more meaningful growth in labor costs is also only a question of time. Thus, investors should be prepared for gold production costs to keep on growing for some time.
The industry is already feeling the impacts. The table below shows the development of AISC of major gold producers during 2020 and 2021. As can be seen, companies like AngloGold Ashanti, Kinross Gold, and Polyus Gold experienced significant AISC growth in 2021. Newmont and Barrick Gold have managed to keep their costs under control for now; however, given the growing inflation pressures and oil prices reaching their highest level in more than a decade, this shouldn’t last for much longer.
All-in Sustaining Costs (AISC), in USD per Troy Ounce, Q1/2020-Q4/2021
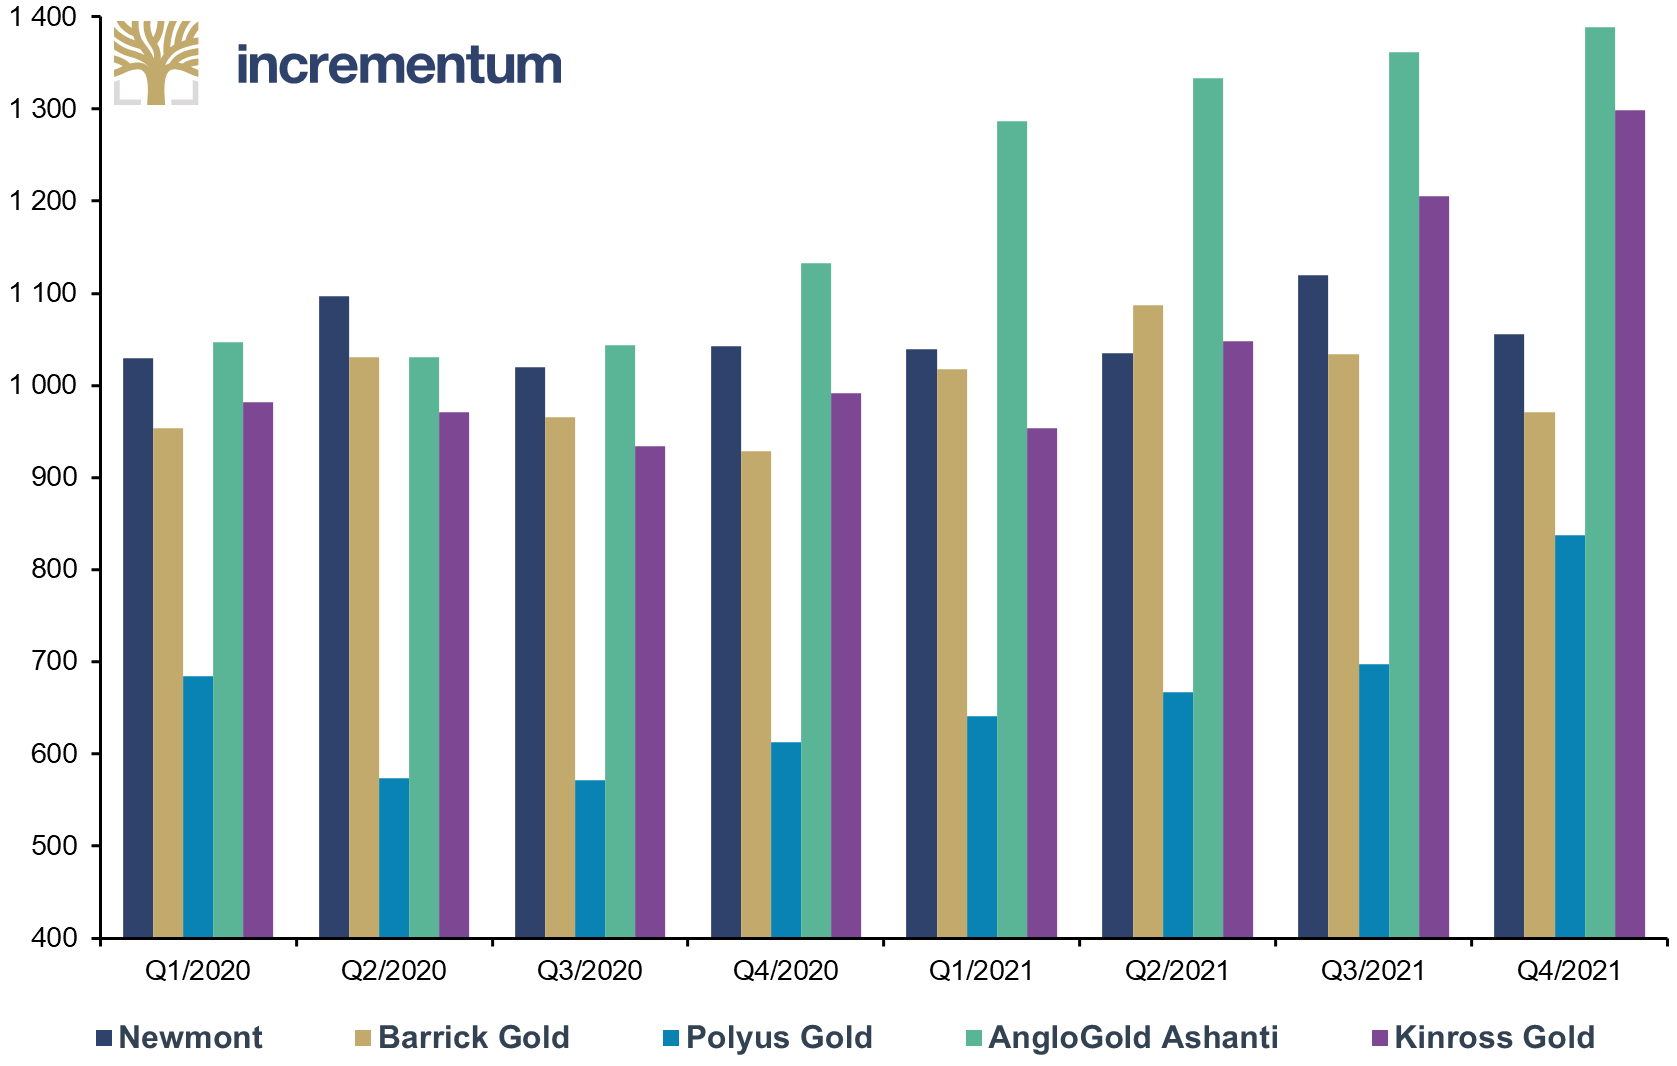
Source: Compnay Annual Reports, Incrementum AG
The growing labor and energy costs will also push mine construction expenditures higher. Moreover, prices of other goods important for construction are rising, according to the data of the Construction Association.
Prices Change for Important Construction Goods, in %, 2021
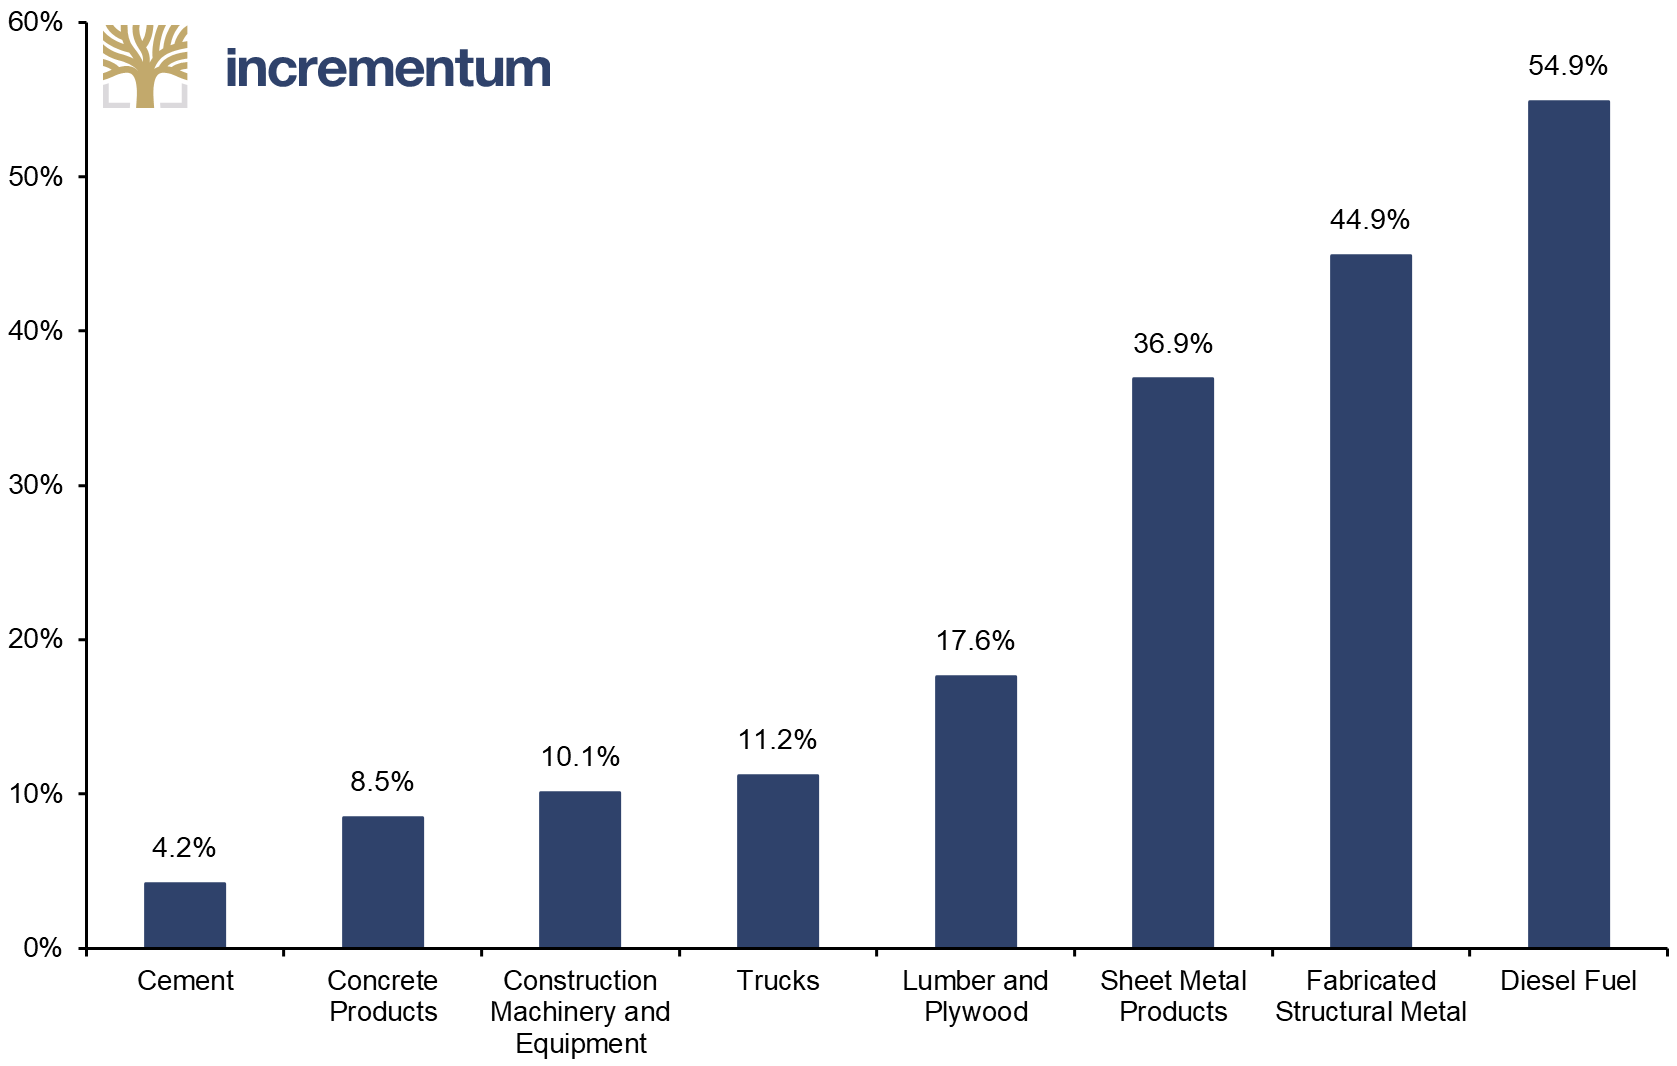
Source: Construction Association, Incrementum AG
The increased costs may be partially reflected in feasibility studies that were completed in Q4 2021 or in 2022, but all of the older studies used lower prices. As a result, investors should be prepared for a wave of negative surprises in the form of CAPEX overruns. And subsequently, after the projects get into production, actual production costs will most likely be notably above original projections. Some companies may decide to delay mine construction and prepare an updated feasibility study first, in order to avoid negative surprises. However, the resulting delays and, almost certainly, the worsened economics of the projects will not bode well for the companies’ share prices.
Of course, the higher-inflation environment should be positive for gold prices, which should compensate for the higher capital and production costs. But there is no guarantee that the gold price will increase enough to fully offset the higher costs. However, there are also the royalty & streaming companies, which will benefit from higher gold prices while not having to worry too much about inflation, as their “production costs” are more or less fixed.
Conclusion
Although there are relatively short time periods when shares of gold miners record really great returns, over the last 15 years they underperformed gold heavily. This wasn’t always the case. For decades, the gold miners were closely correlated with the gold price and the returns were similar. The abrupt change came during the Global Financial Crisis of 2008, when the gold miners as a group started to underperform. Of course, not all of them did. There are exceptions that are able to outperform gold even over longer-term investment horizons, but they are just a strong minority.
The main reasons for the underperformance are CAPEX overruns, growing production costs, problems with obtaining permissions for new mines, governments wanting a bigger share of the pie, political instability in some countries where gold mines are located, as well as declining reserves and numbers of new discoveries. As not all of the miners are impacted by all of these factors and not equally, it is important to choose the right company when making a long-term investment in the gold mining industry.
The best strategy is to buy shares of a company operating in a safe and mining-friendly jurisdiction, with low production costs, reasonable CAPEX, and good exploration potential. And, of course, to buy the shares at the right price. That means timing the market properly and avoiding buying at the top of the cycle. As Baron Rothschild once cynically remarked, the best time to buy is when there is blood in the streets, even if it means holding the shares for several years without any major gains and waiting for the next bull market.
In the foreseeable future, inflation should be an important factor impacting the performance of the gold miners. High-cost producers especially may get into trouble if their production costs increase further. Some unpleasant surprises may also be encountered by the development-stage companies, due to the high probability of CAPEX overruns. However, there are also the royalty & streaming companies, a segment of the mining industry that should do very well in an inflationary environment, and that is why we will do a deep dive into the R&S sector in the following chapter.
[1] We did discuss this problem in: “Mining Stocks: The Party Has Begun,” In Gold We Trust report 2020
[2] See “Gold Mining Stocks –After the Creative Destruction, a Bull Market?,” In Gold We Trust report 2019