


Status Quo of Inflation Dynamics
“Inflation is a choice and the Fed must take responsibility for it.”
Kevin Warsh
- The attack on Iran triggered an energy price shock that, at least in the first month, was on par with the 2022 energy crisis. Until then, inflation in the US remained stubbornly at elevated levels, as we had expected. In the euro area, the inflation rate even fell below the 2% mark, partly due to the euro’s appreciation.
- The oil intensity of Western economies has declined significantly compared to the era of the two energy price shocks of the 1970s. This is also due to the significantly greater importance of the services sector.
- A few days ago, Kevin Warsh succeeded Jerome Powell as the new Chair of the Federal Reserve. Warsh hopes the AI boom will spur a productivity surge in the US economy. This is expected to lay the groundwork for lower interest rates. Additionally, the Federal Reserve’s balance sheet is set to shrink.
- Warsh clearly sees the responsibility for preventing elevated and high inflation rates as lying with the Federal Reserve. As he put it in one of his pithy statements: “Inflation is a choice.”
- Even after the current energy price shock subsides, we expect higher inflation rates – along with increased inflation volatility – when base effects are factored out.
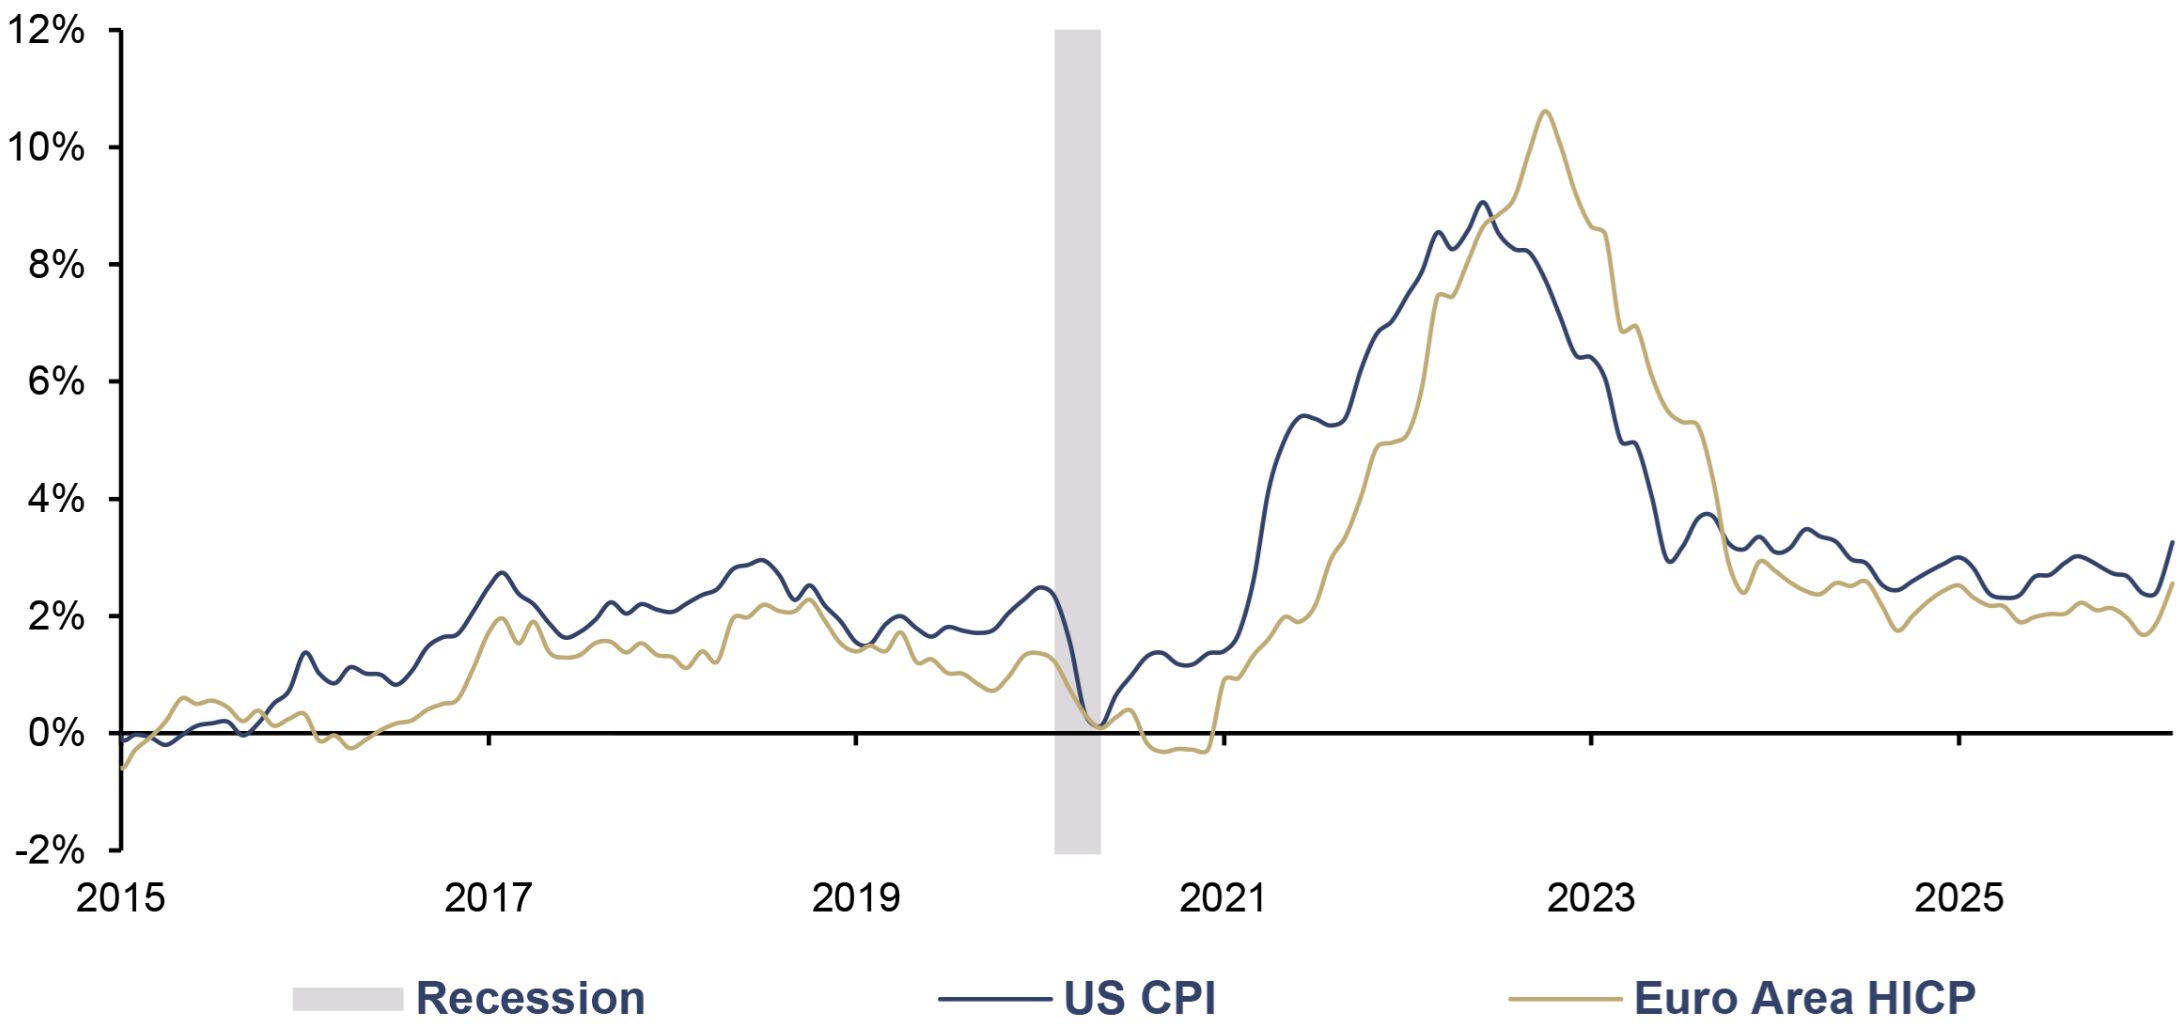
Actually, this chapter should have begun as follows: Persistently elevated inflation rates coupled with increased inflation volatility – that is the shortest possible summary of our inflation forecast from recent years. For the US, at least, this inflation forecast proved accurate. Since May 2021 – and thus for five years – the CPI has not reached the Federal Reserve’s 2% target, let alone fallen below it. This also applies to the Federal Reserve’s preferred indicator, the core PCE. In January, this had even exceeded 3.0% again. In the euro area, however, the HICP fell below the ECB’s inflation target of 2.0% in January and February, largely because energy prices continued to decline yoy and were supported by the euro’s significant appreciation since January 2025.
US CPI and Euro Area HICP, yoy, 01/2015–03/2026
Source: LSEG, Incrementum AG
But on February 28, the US and Israel attacked Iran – and the inflation landscape was redrawn overnight. Energy prices shot up sharply. However, the blockade of the Strait of Hormuz is not only leading to a price increase but also to a rapid shortage of supply. Within a short time, initial administrative measures were imposed, particularly in Asia, to curb energy demand.
It remains entirely unclear how long-lasting the disruption to the energy markets will be. The damage to energy infrastructure in the Gulf states is, in some cases, significant, so force majeure clauses have already had to be invoked on multiple occasions. The blockade of the Strait of Hormuz – initially by Iran and, since midApril, also by the US – has nearly completely shut down this lifeline, which is vital for global trade and, in particular, energy trade. Where up to 100 ships used to pass through the strait daily, there is now an eerie silence.
The severity of the energy price shock was already evident in the initial data releases. The ECB was the first major central bank to publish its flash estimate for March. The HICP, which had been pushed below the 2% mark in January and February by falling energy prices and the appreciation of the euro, rose sharply from 1.9% to 2.5%, later revised to 2.6%. On a month-over-month basis, the increase was 1.2%, corresponding to an annualized inflation rate of 15.4%. This is significantly higher than the peak of 11.5% during the 2021–23 inflation wave. The flash estimate for April shows headline inflation rising further to 3.0%.
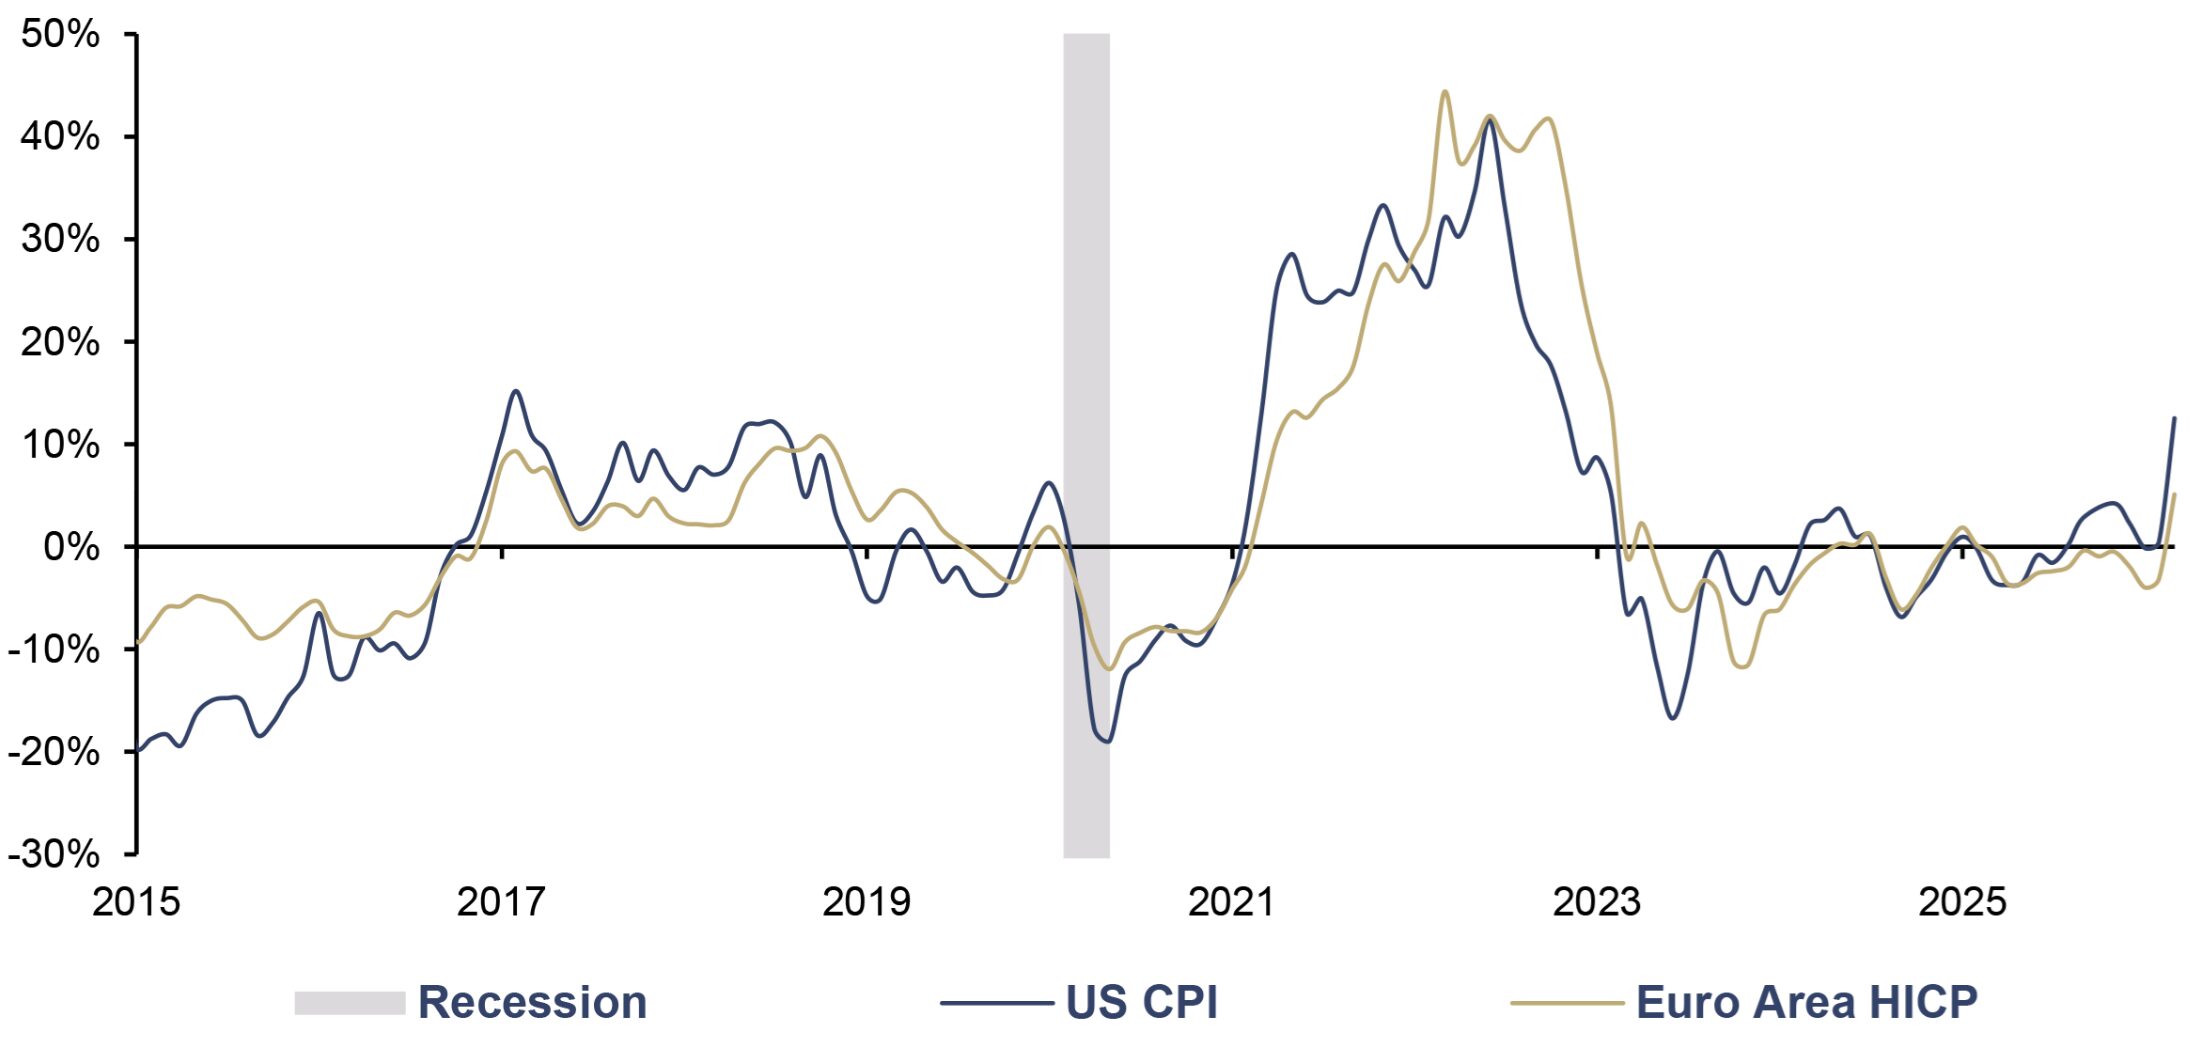
Unsurprisingly, energy prices were largely responsible for this steep rise, shooting up 4.9% yoy after falling 4.0% and 3.1% yoy in the previous two months. Compared to the previous month, energy prices exploded by 6.8%, which, annualized, corresponds to a 120% increase – more than double.
In early April, the US released its first CPI inflation figures following the outbreak of the Iran war. The headline CPI rose by 0.87% month-over-month, which corresponds to an annualized rate of 10.9%. This figure was surpassed only during the peak of the inflation surge in mid-2022. As a result, the CPI rose by 3.3% yoy, the highest figure since early 2024. Energy prices, which account for just over 7.0% of the basket of goods, surged by 12.5% yoy and 10.9% month-over-month – significantly more than in the euro area in both cases.
Inflation Component: Energy, yoy, 01/2015–03/2026
Source: LSEG, Incrementum AG
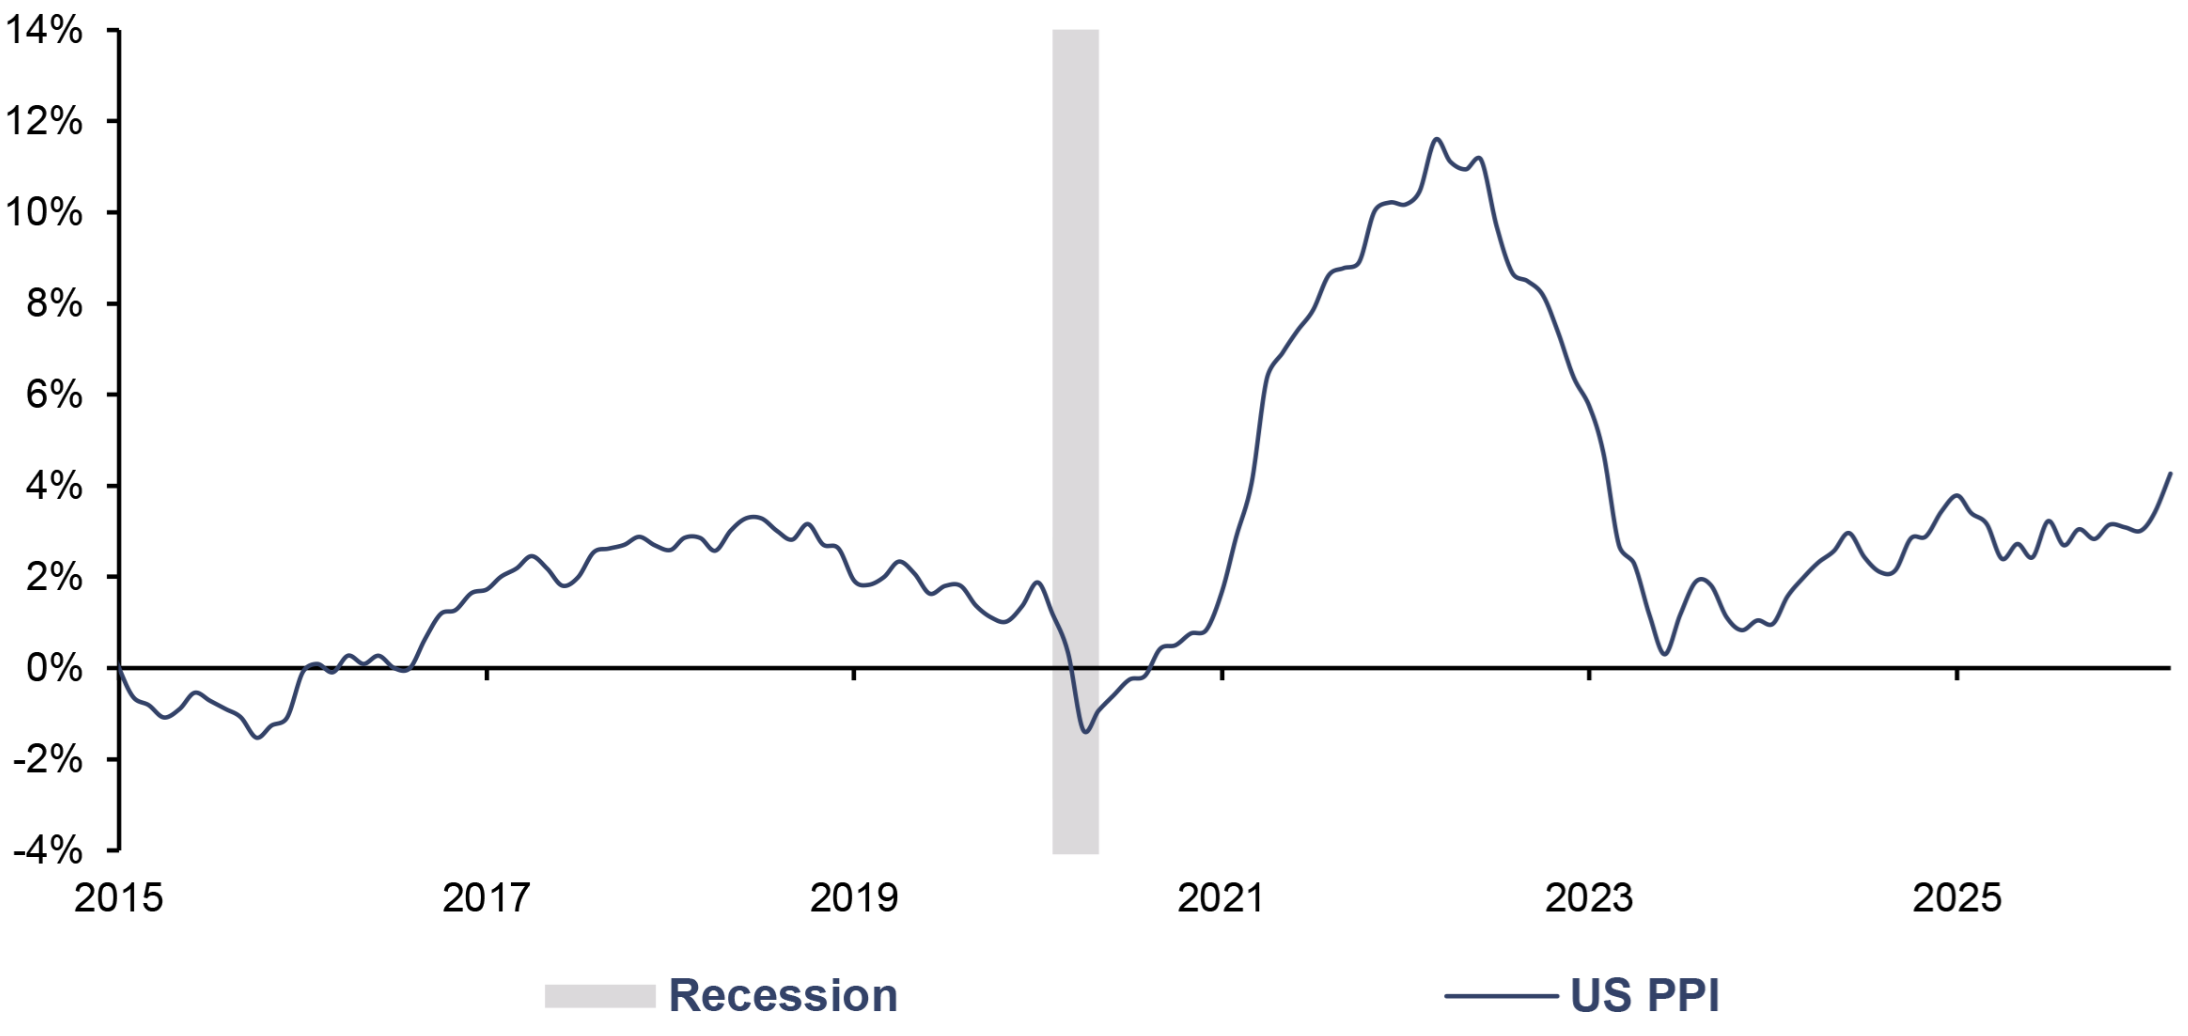
The first data on producer prices also show mounting inflationary pressure. It should be noted that, unlike in the euro area, annual change rates in the US were below zero only during the first months of the Covid-19 pandemic. Since the annual rates of change normalized in 2024, a clear upward trend has emerged, reaching 4.0% in March – the highest level since February 2023. On an annualized basis, producer prices exceeded the 6.0% mark in all three months of the current year.
US PPI, yoy, 01/2015–03/2026
Source: LSEG, Incrementum AG
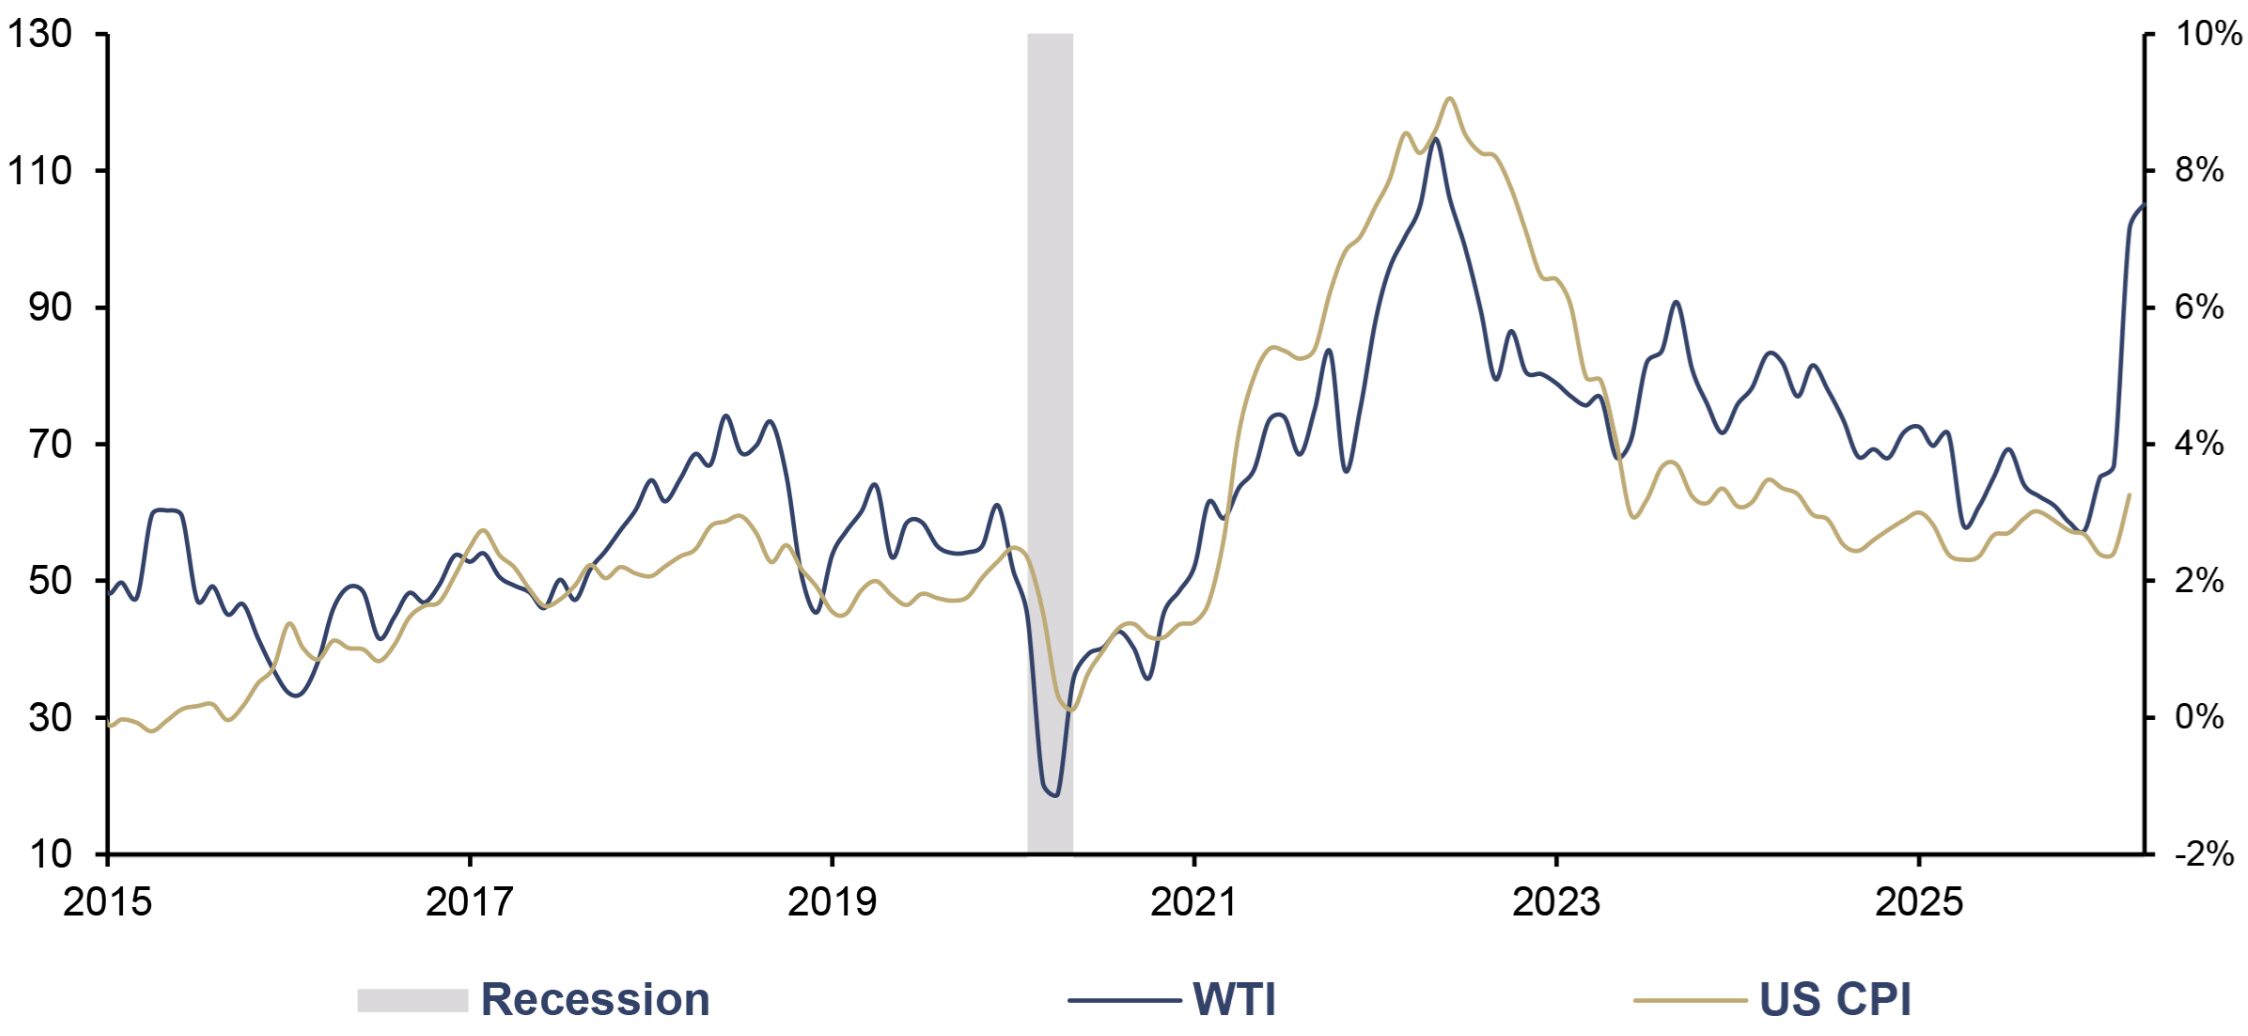
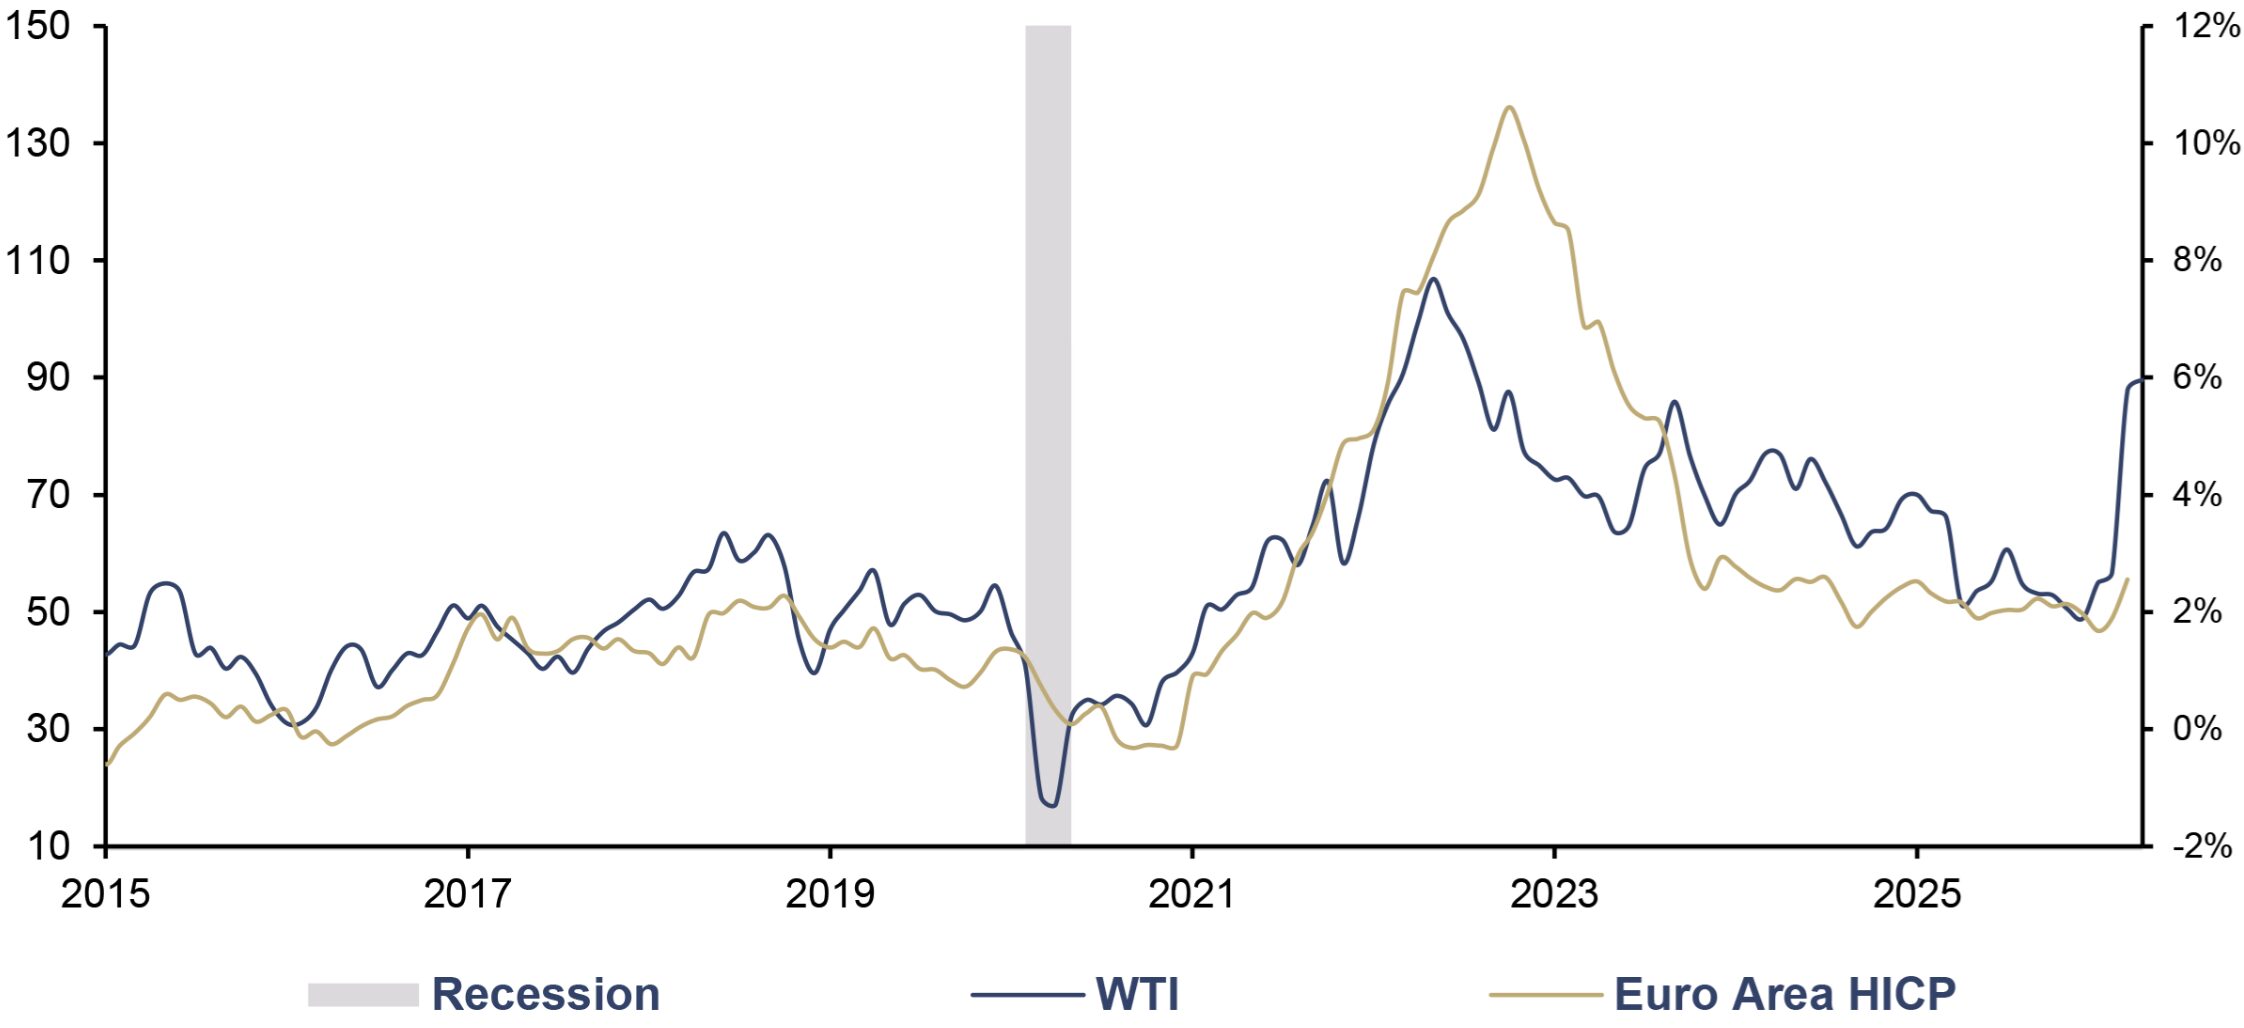
The correlation between oil prices and the inflation rate remains very high despite the economy’s declining oil intensity. During the recent inflationary surge, other prices followed the trend in energy prices with only a few months’ delay.
WTI (lhs), in USD, and US CPI (rhs), yoy, 01/2015–04/2026
Source: LSEG, Incrementum AG
WTI (lhs), in EUR, and Euro Area HICP (rhs), yoy, 01/2015–04/2026
Source: LSEG, Incrementum AG
For the US, simulation calculations by the Federal Reserve using its FRB/US model showed that a USD 10 increase in the price of oil raises the inflation rate by 0.2 percentage points. The second-round effects accounted for in this model nearly double that effect to 0.35 percentage points. With an oil price of USD 95 per barrel, analysts expect a US inflation rate of around 3.2%; at USD 110, 3.5%; at USD 130, 3.9%; and at USD 150, 4.3%.
These calculations also show how uncertain inflation forecasts are for the coming months. Given the high level of (geo)political uncertainty, no reliable forecasts can be made, with two very general exceptions: (1) The risk of (significantly) rising inflation rates is significantly higher than that of structurally falling inflation rates; (2) Inflation volatility will rise.
Indirectly, energy is contained in every (consumer) product and every service, meaning that a prolonged energy price shock has a ripple effect. In this respect, analyses that do not take second-round effects into account fall significantly short. During the 2021–2023 inflation wave, rising energy prices were already making themselves felt in the other subsectors of the consumer basket after just a few months. Furthermore, with a slight delay, even the more rigid energy prices, such as retail electricity prices, are beginning to rise.
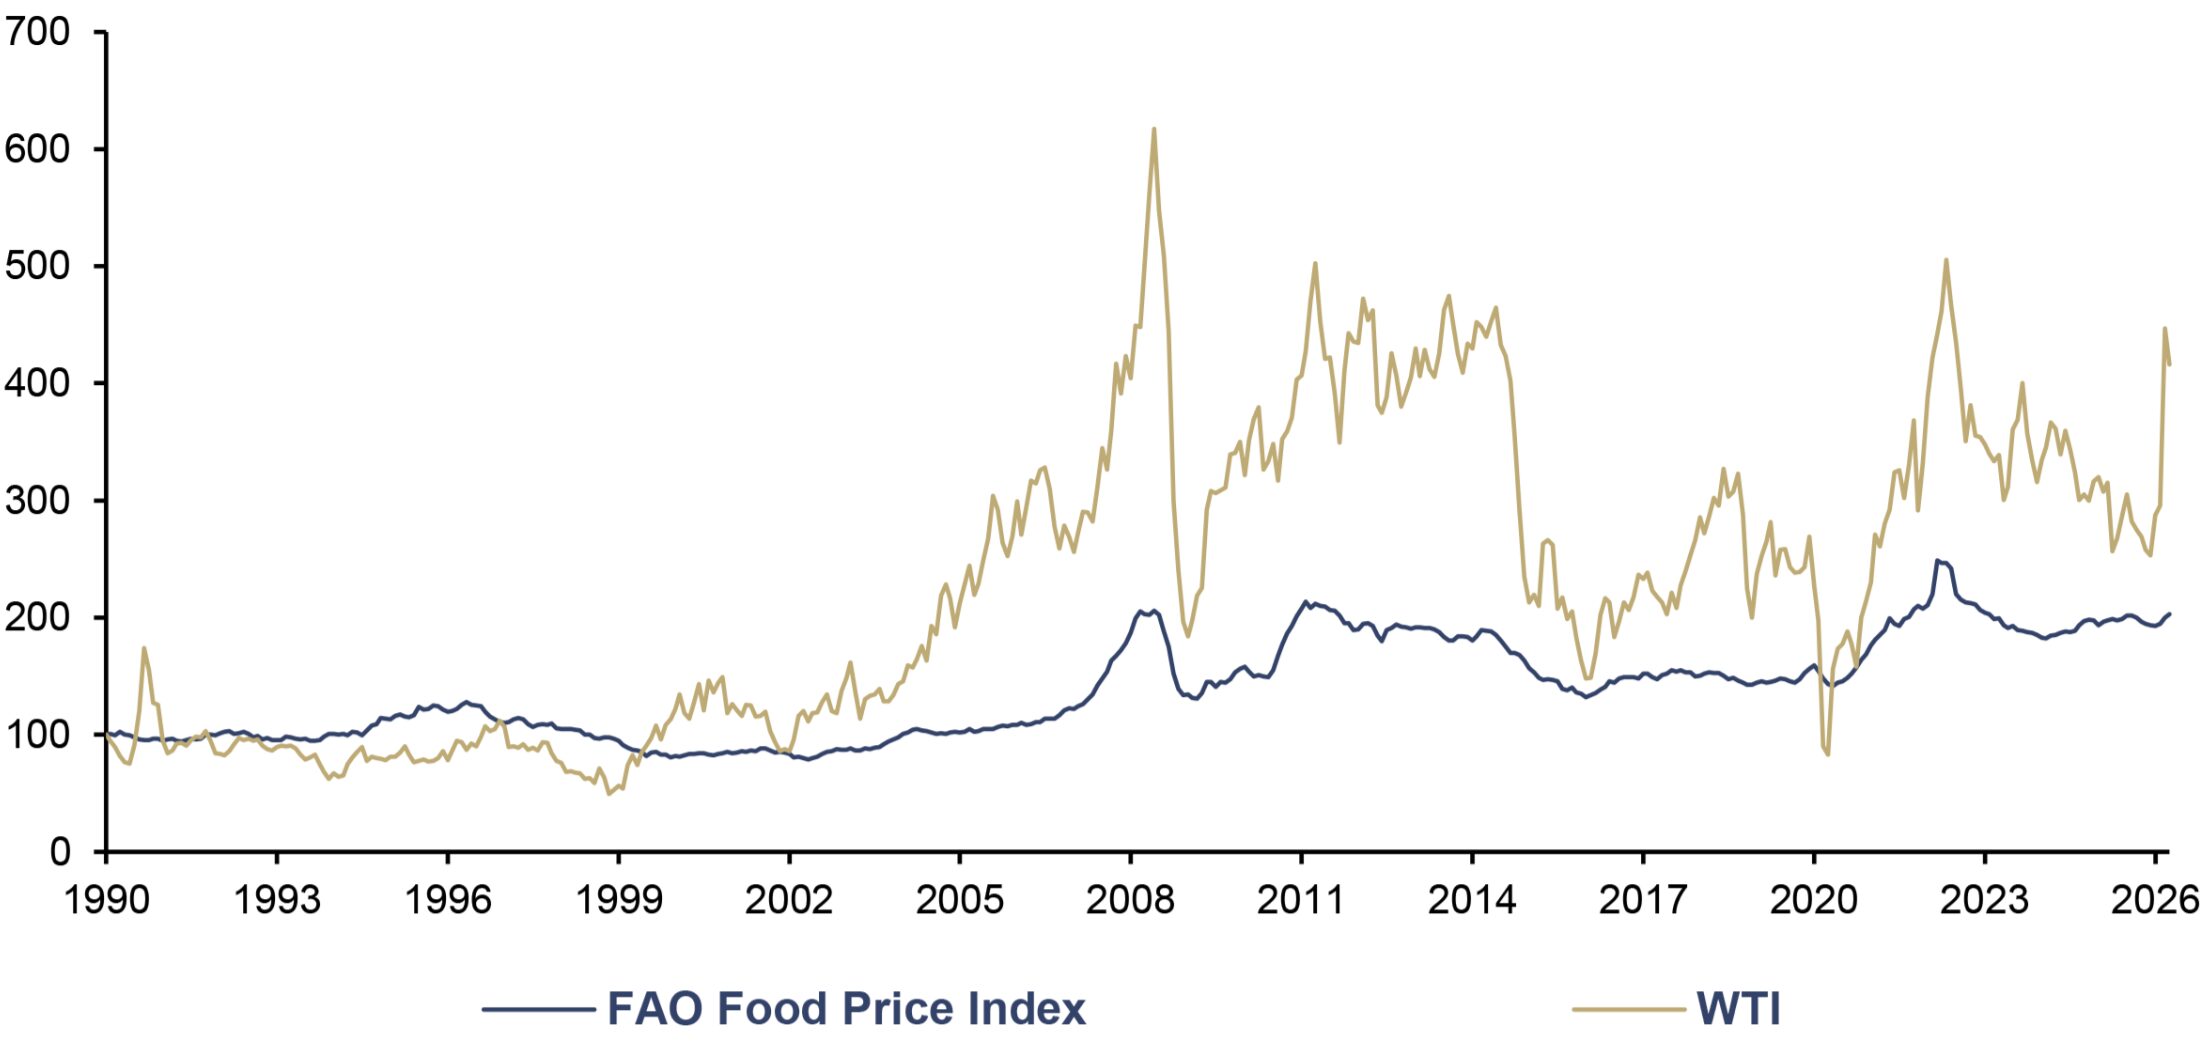
The correlation between oil prices and food prices is also positive. Modern agriculture in particular is energy-intensive, from tilling the fields to harvesting and transporting crops to cities; moreover, the fertilizers themselves require substantial energy to produce – or are based on gas.
FAO Food Price Index, and WTI, in USD, 01/1990–04/2026
Source: FAO, Incrementum AG
Central banks once again in a dilemma
The expected sharp rise in inflation is putting central banks under considerable pressure. This is because both the Federal Reserve and the European Central Bank completely underestimated the surging wave of inflation in 2021. Jerome Powell’s assessment that the higher inflation rates were merely “transitory” and Christine Lagarde’s downplaying of the situation as a “hump” – after which the inflation rate was expected to more than double – are not exactly a source of pride. ECB President Christine Lagarde, who will remain in office until the end of October 2027, likely does not want to make this mistake a second time, especially since rumors of her early resignation have not materialized – at least so far.
Jerome Powell, whose term as chair ended just a few days ago, will nevertheless be confronted with the threat of a second wave of inflation. After all, his term as a regular member of the Board of Governors does not end until January 31, 2028.
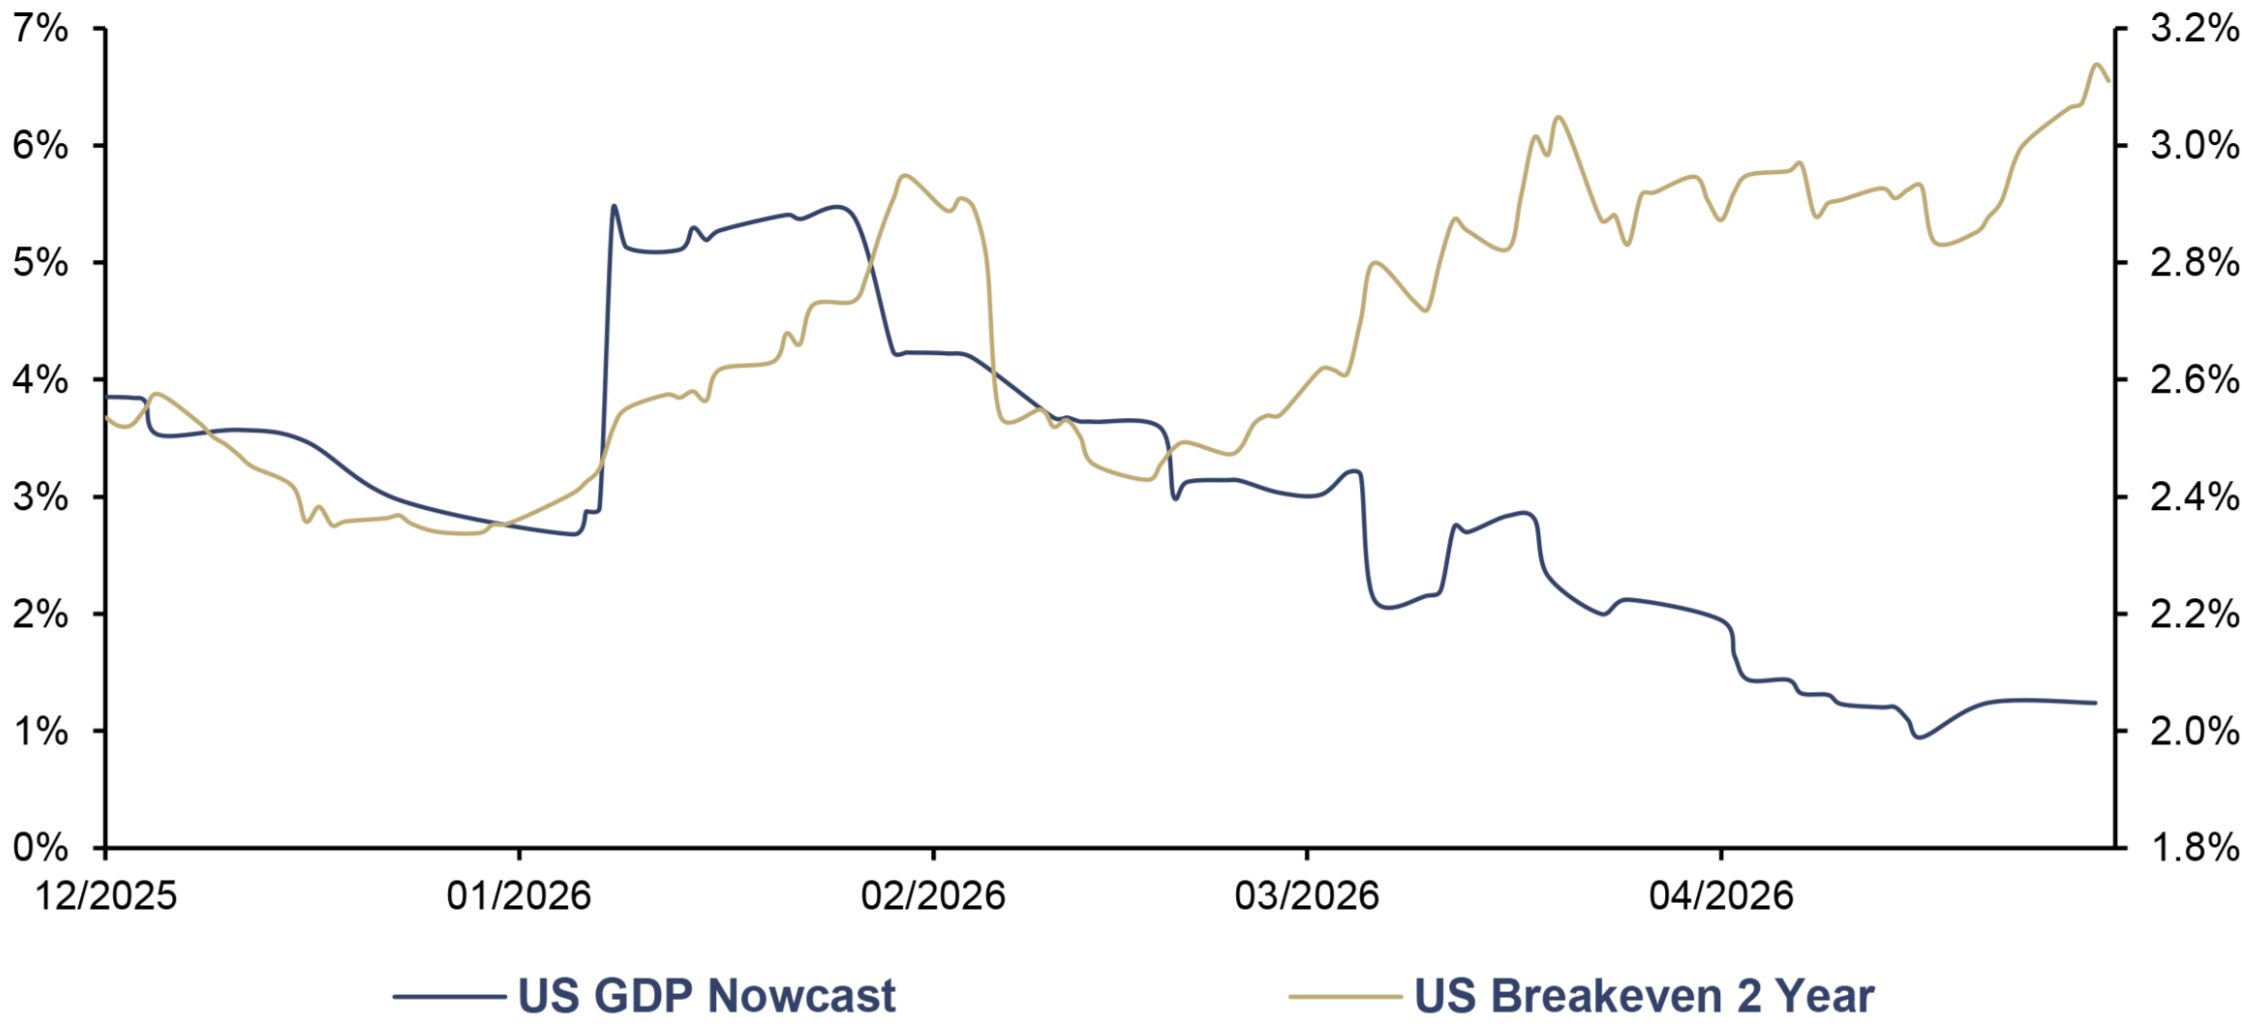
Either way, interest rate hikes would further dampen the economic outlook, in addition to the significant consequences of higher energy prices. Prospects have brightened to a modest degree in the euro area over the past few quarters, while the US continues to post surprisingly strong growth and is likely to be able to weather an interest rate hike economically. However, the Federal Reserve Bank of Atlanta’s real-time GDP indicator for Q1/2026 has deteriorated significantly since the outbreak of the Iran war. In the first days of the war, the GDPNow forecast was still well above 3.0%; the last estimate from the end of April stood at just 1.2%.
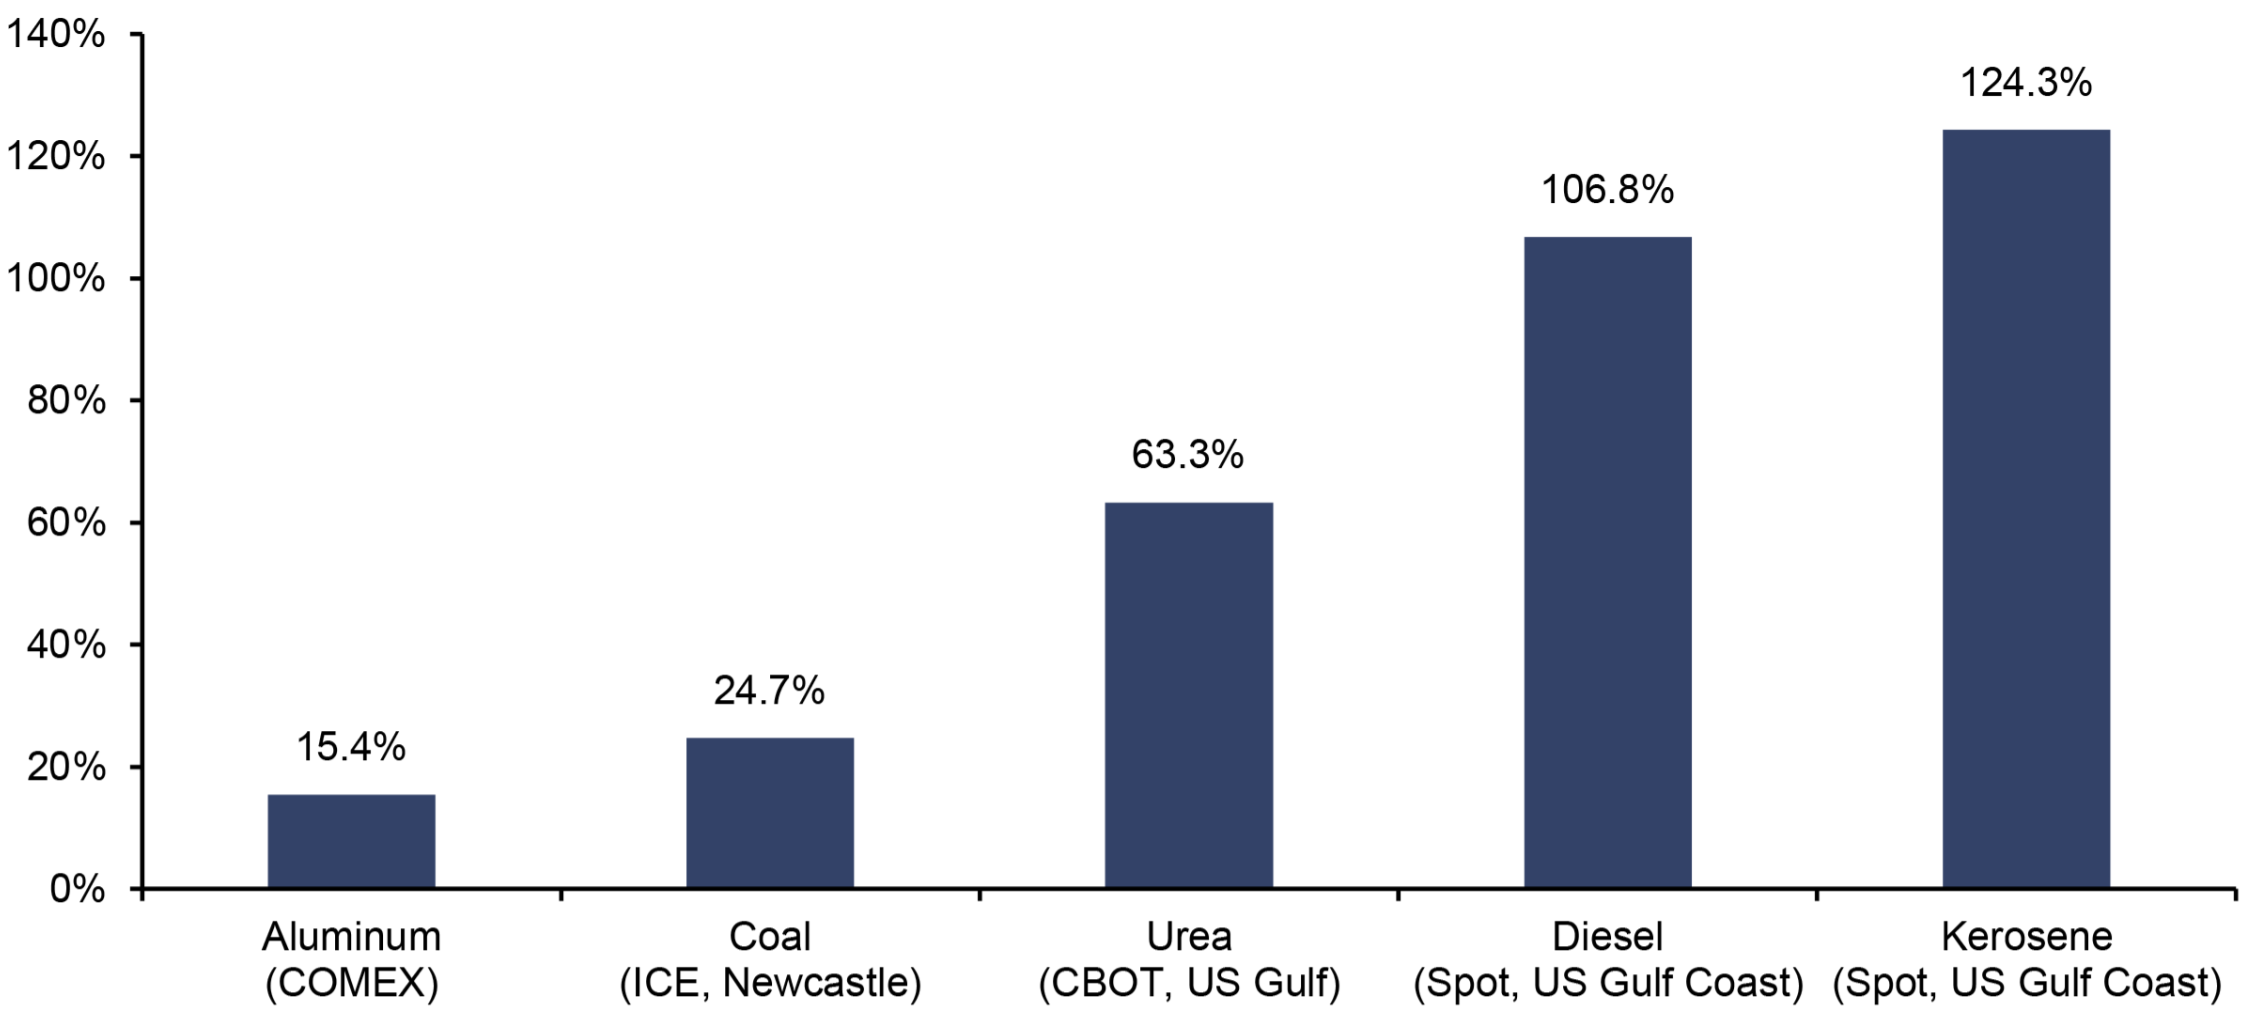
What many may not realize is that the Gulf region is not only an exporter of oil but also of many byproducts, such as helium, fertilizer, and feedstocks for synthetic fertilizer production. Furthermore, the Gulf states are among the major exporters of energy-intensive raw materials such as aluminum. In homogeneous markets, the loss of marginal supply leads to a price increase across the entire market.
Performance of Various Commodities, in USD, 01/2026–04/2026
Source: Federal Reserve St. Louis, Investing.com, Trading Economics, Incrementum AG
In any case, the probability of a stagflationary scenario has risen significantly.[1]
US GDP Nowcast (lhs), and US Breakeven 2 Year (rhs), 12/2025–04/2026
Source: Federal Reserve Bank of Atlanta, Incrementum AG
The return of the 1970s in a different guise?
A comparison with the two waves of inflation in the 1970s is obvious. These were strongly influenced by political developments in the Arab world, whereas the first wave of inflation in the late 1960s had monetary and economic causes. The first oil crisis was triggered by the deliberate 5% cut in oil production by OAPEC (the “Organization of Arab Petroleum Exporting Countries”). The Arab states wanted to force Western nations to withdraw their support for Israel in the wake of the Yom Kippur War. The oil price initially rose from USD 3 to USD 5 per barrel – a 70% increase – and later to USD 12, a fourfold increase. In today’s terms, based on a price of USD 60, this would represent a rise to as much as USD 240.
The second oil crisis followed in 1979–1980 in the wake of the Islamic Revolution in Iran and the First Gulf War (Iraq vs. Iran) that began shortly thereafter. The oil price doubled within a year to just under USD 40.
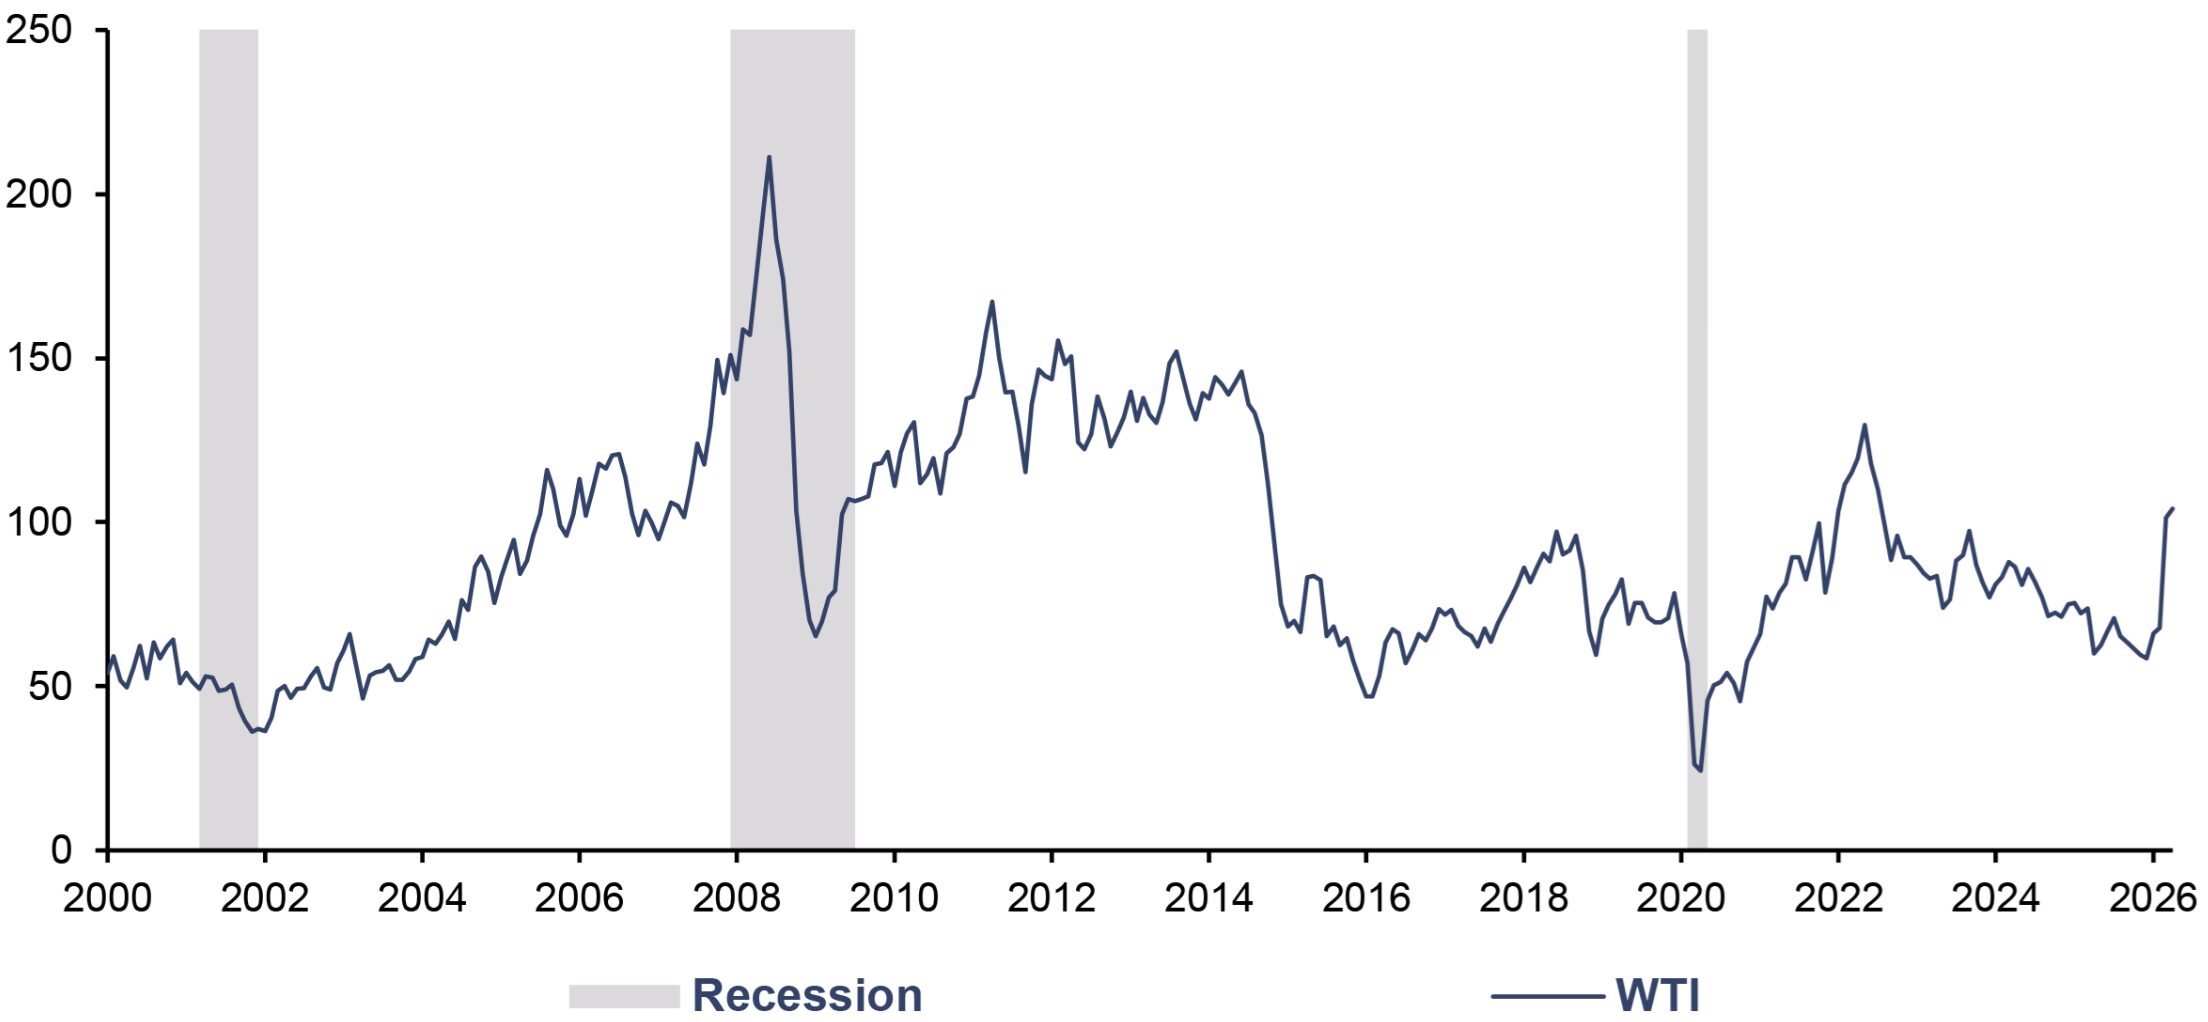
However, the oil price is still far from its record highs. The nominal all-time high for WTI was reached on July 11, 2008, at USD 147 per barrel; adjusted for inflation, this currently corresponds to around USD 220.
WTI, US CPI Adjusted, in USD, 01/2000–04/2026
Source: LSEG, Incrementum AG
Since the 1970s, the share of petroleum in primary energy demand has fallen significantly, from just under 45% in 1971 to around 30%. However, the share of natural gas has risen, from just over 16% in the early 1970s to just under 25%. Natural gas is considered, in particular, a substitute for coal. Over these five and a half decades, however, primary energy demand has nearly tripled, which is why – despite its declining relative importance – demand for oil has more than doubled in absolute terms.
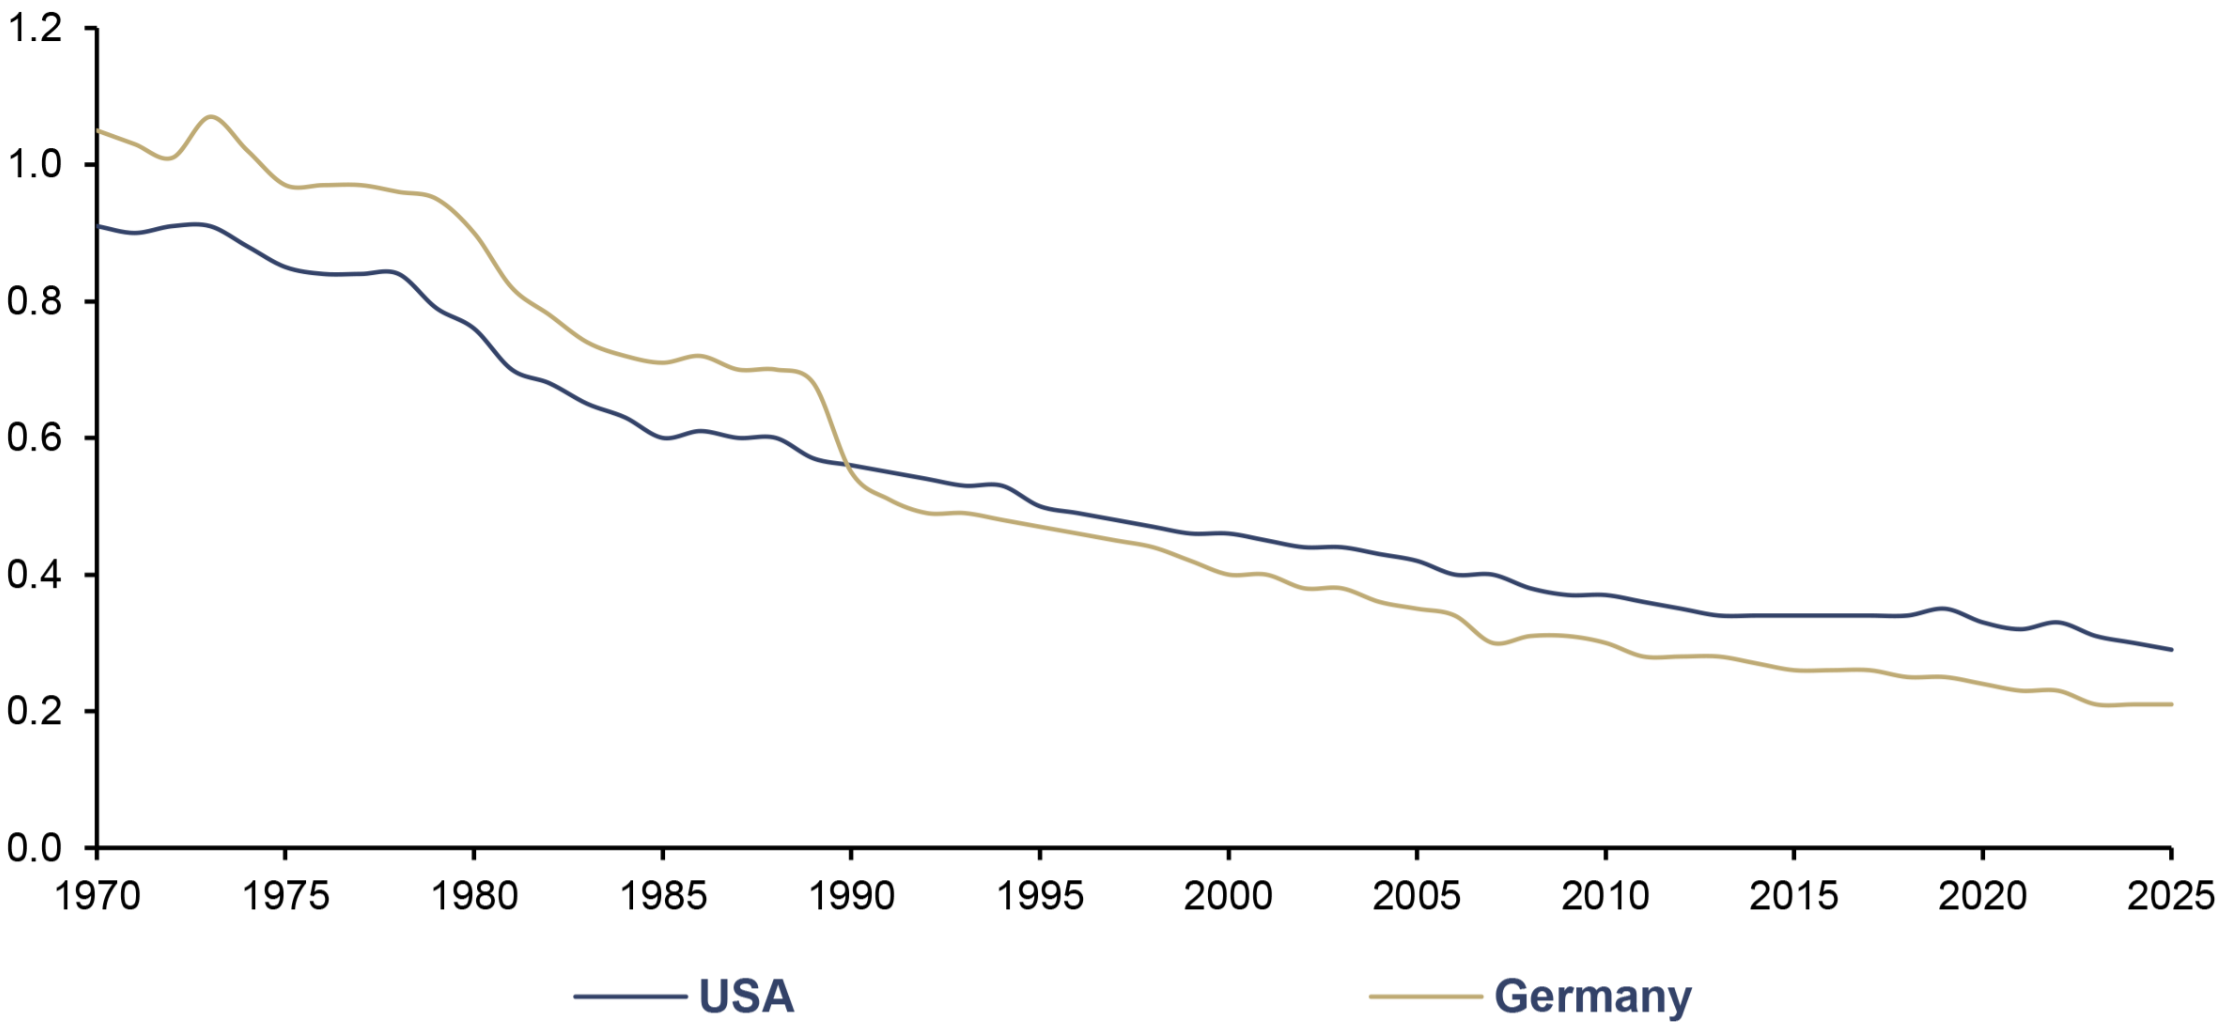
Oil intensity has declined significantly in recent decades. Oil intensity is the amount of crude oil consumed per unit of real gross domestic product (GDP). In 1973, at the time of the first oil crisis, 0.91 barrels of oil were required in the US to generate USD 1,000 in GDP. By 2025, this figure had dropped to just 0.31 barrels. Germany was even able to reduce its energy intensity by 80%, a development also attributable to the special effect of reunification.
Energy Intensity*, 1970–2025
Source: AAGEB, BEA, BP, Destatis, EIA, Eurostat, World Bank, LSEG, Incrementum AG
*Barrels per USD 1,000 of Real GDP
However, one factor significantly distorts the statistics. Since 1970, the share of the comparatively energy-extensive service sector in the US has grown by nearly 30%, from 60.2% to 76.7%, and in Germany by almost two-thirds, from just over 45% in 1970 (FRG) to nearly 75%. However, the service sector also includes the public welfare system. If a wife cares for her husband at home or parents raise their children themselves, this is not included in the gross domestic product. If the same woman cares for a neighbor in a nursing home or looks after the neighbor’s children as a kindergarten teacher and is paid for it, this increases the gross domestic product. However, energy consumption for this service has hardly increased as a result, whereas the gross domestic product has. This shift of previously unpaid activities within one’s own household into the formal sector – which is mostly funded by tax revenues – gives the impression of greater energy independence.
The cumulative loss of purchasing power is significant
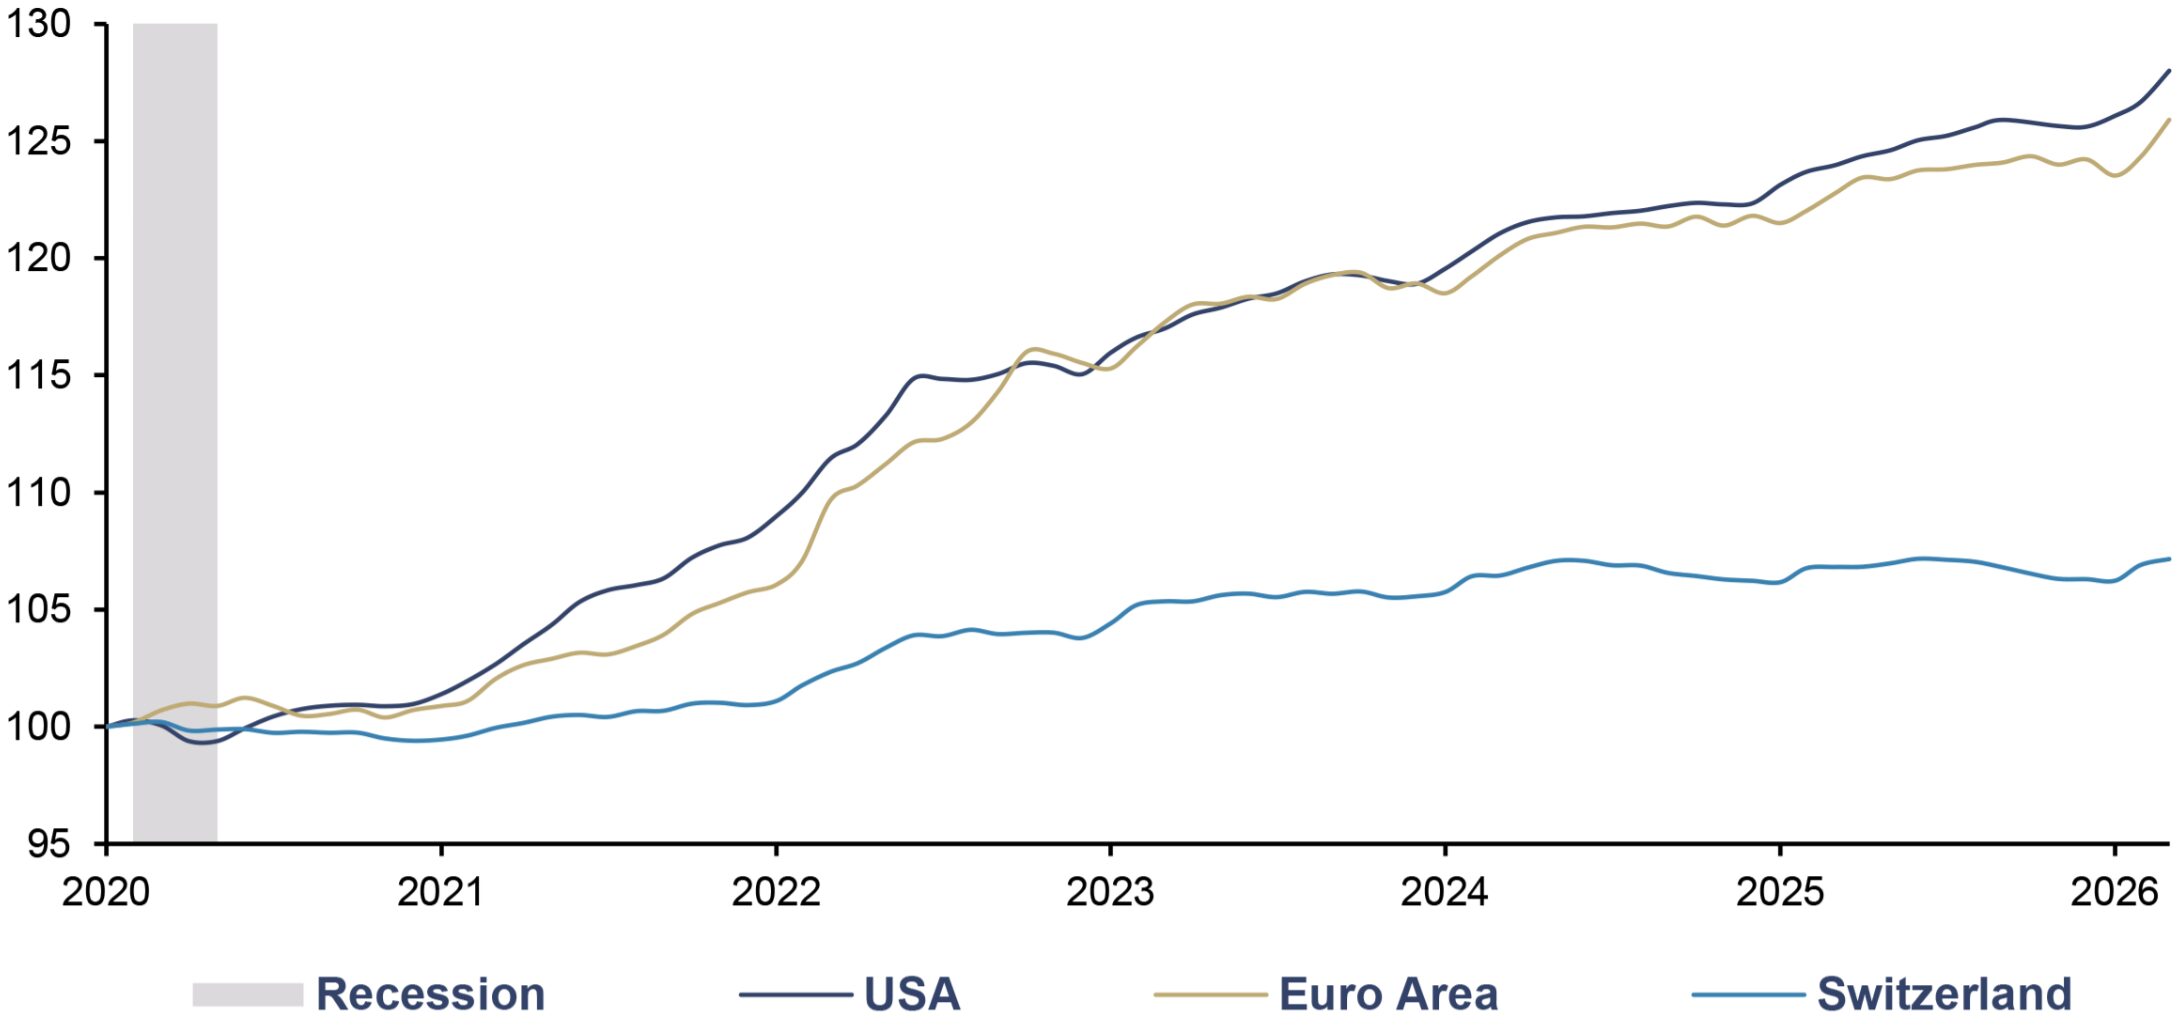
The current inflation shock comes on top of a significant decline in purchasing power in recent years. After all, a falling inflation rate does not mean that prices are falling, only that they are rising more slowly.
Various Headline Inflation Indices, 100 = 01/2020, 01/2020–03/2026
Source: LSEG, Incrementum AG
In this regard, the US outperforms the eurozone as a whole as well as most individual countries. This is due to the lower inflation rates in the eurozone since the fall of 2023. The euro’s significant appreciation in 2025 – by more than 13% – provided additional relief to consumers, particularly with regard to energy prices, in addition to the normalization of energy prices.
This significant loss of purchasing power is also one of the reasons for the loss of political trust. After all, this psychological nominal price effect persists, even though nominal wages have, in the vast majority of cases, at least offset the loss of purchasing power caused by sharply rising consumer prices, bringing inflation-adjusted real wages back to their previous levels.
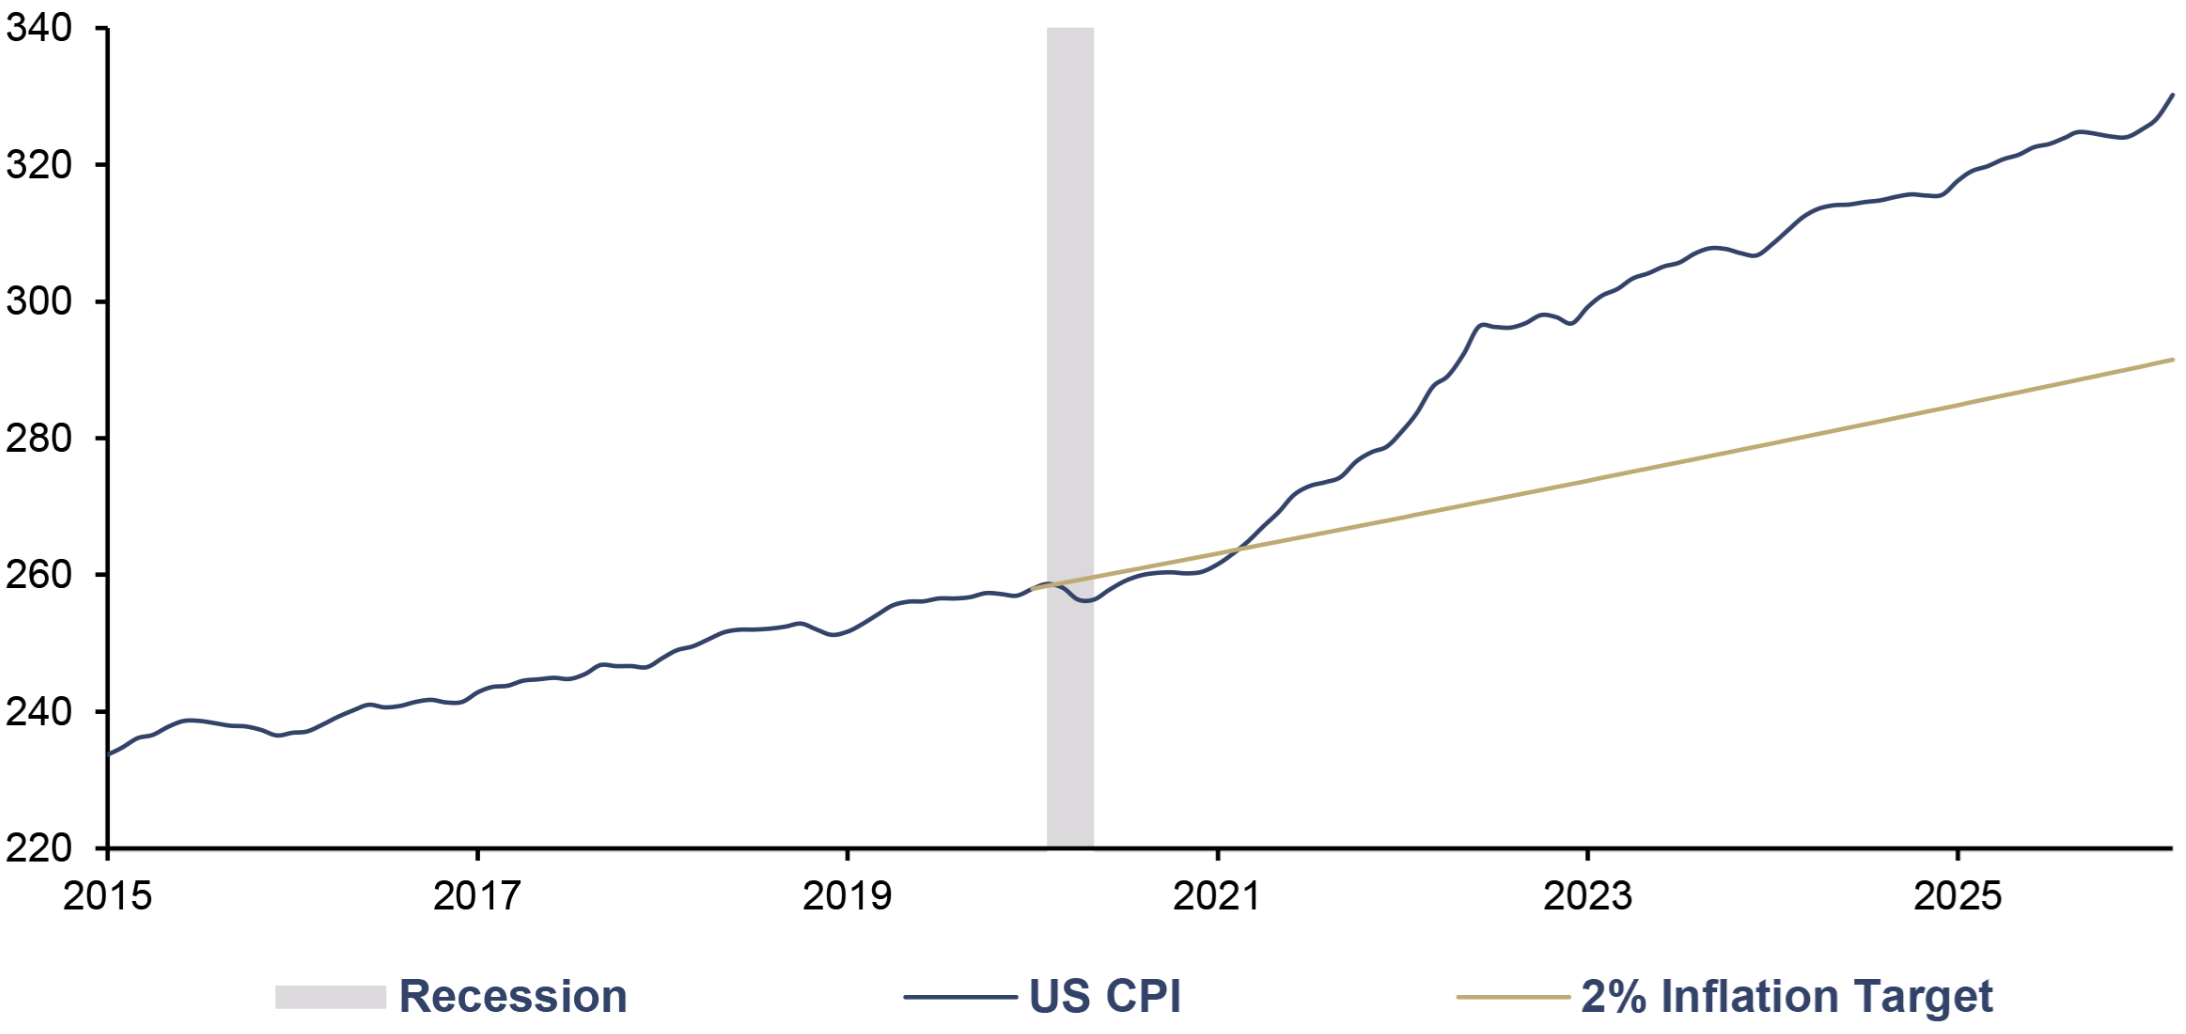
For the US, the following chart shows how far the actual price level has deviated from the price trend that citizens had expected based on the inflation target communicated by the Federal Reserve.
US CPI, yoy, and 2% Inflation Target, 01/2015–03/2026
Source: LSEG, Incrementum AG
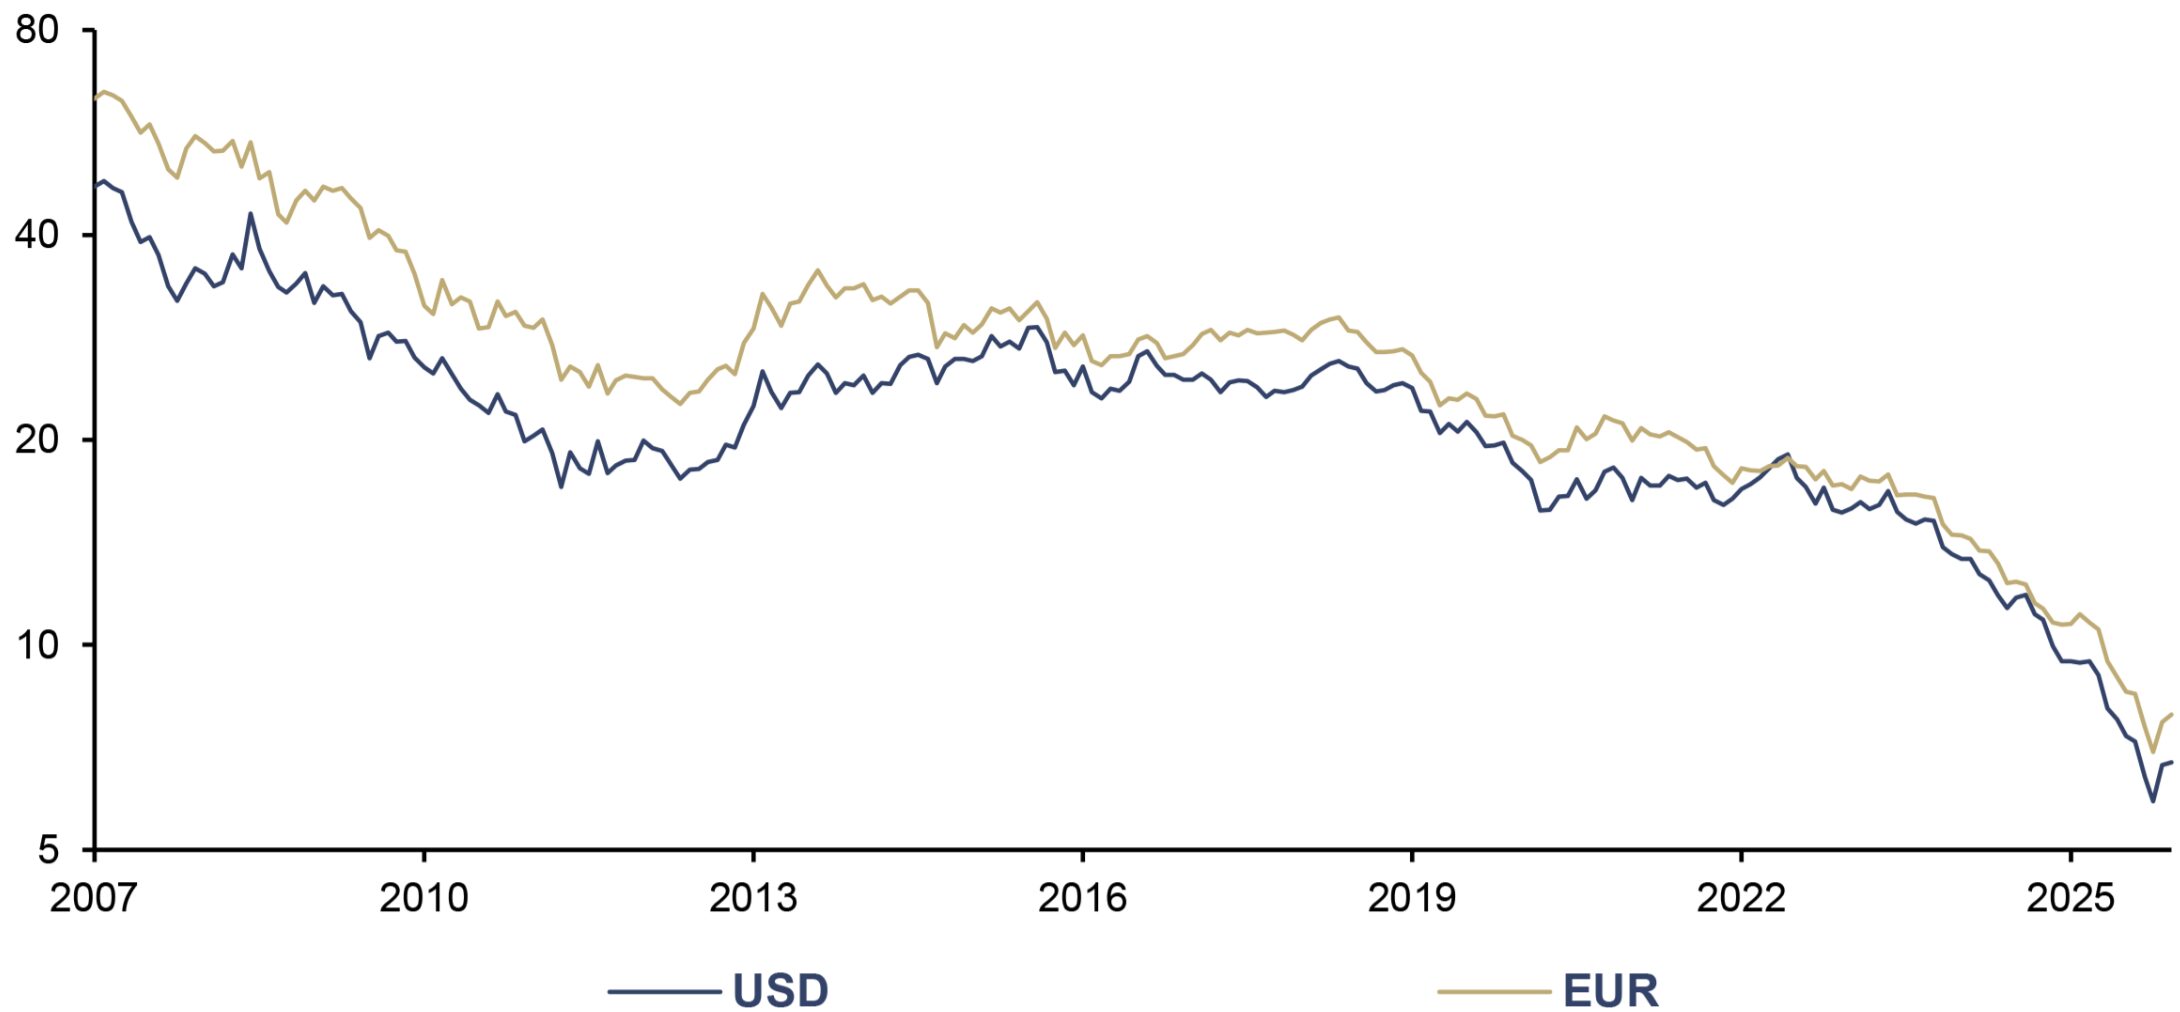
The loss of purchasing power of fiat currencies becomes even more apparent over a longer period. Since May 2007, when the first In Gold We Trust report was published, the CPI has risen by nearly 60% and the HICP by around 48%. The loss of purchasing power is even greater when considering the gold purchasing power of the US dollar or the euro – that is, how many milligrams of gold 1 US dollar or 1 euro buys.
1 USD and 1 EUR (log), in mg Gold, 05/2007–04/2026
Source: LSEG, Incrementum AG
Deep Dive US
The hottest topic over the past 12 months was actually the debate over US tariffs and their impact on the US inflation rate. With the sharp rise in energy prices in the early days of the Iran war, this issue has completely faded into the background.
Kevin Warsh’s announcement of a regime change
During his Senate confirmation hearing for the position of Chairman of the Federal Reserve’s Board of Governors, Kevin Warsh reiterated his call for “a regime change” at the Federal Reserve. Ultimately, Kevin Warsh believes that persistently high inflation is the result of government excesses in the form of sustained high government spending and an inflated central bank balance sheet. This argument bears a clear resemblance to the Fiscal Theory of the Price Level (FTPL) developed by John H. Cochrane, only with monetarist undertones.
A key economic component of Warsh’s plan for a fundamental change in monetary policy mechanics is a productivity boost in the real economy, which is to be triggered by the emerging AI boom. The resulting dampening effect on (consumer) prices is intended to give the Federal Reserve the opportunity to lower interest rates. At the same time, Warsh wants to further and significantly reduce the Federal Reserve’s balance sheet. While the ECB has already managed to reduce its balance sheet by nearly 30%, the Federal Reserve has only reduced its balance sheet by around 25%.
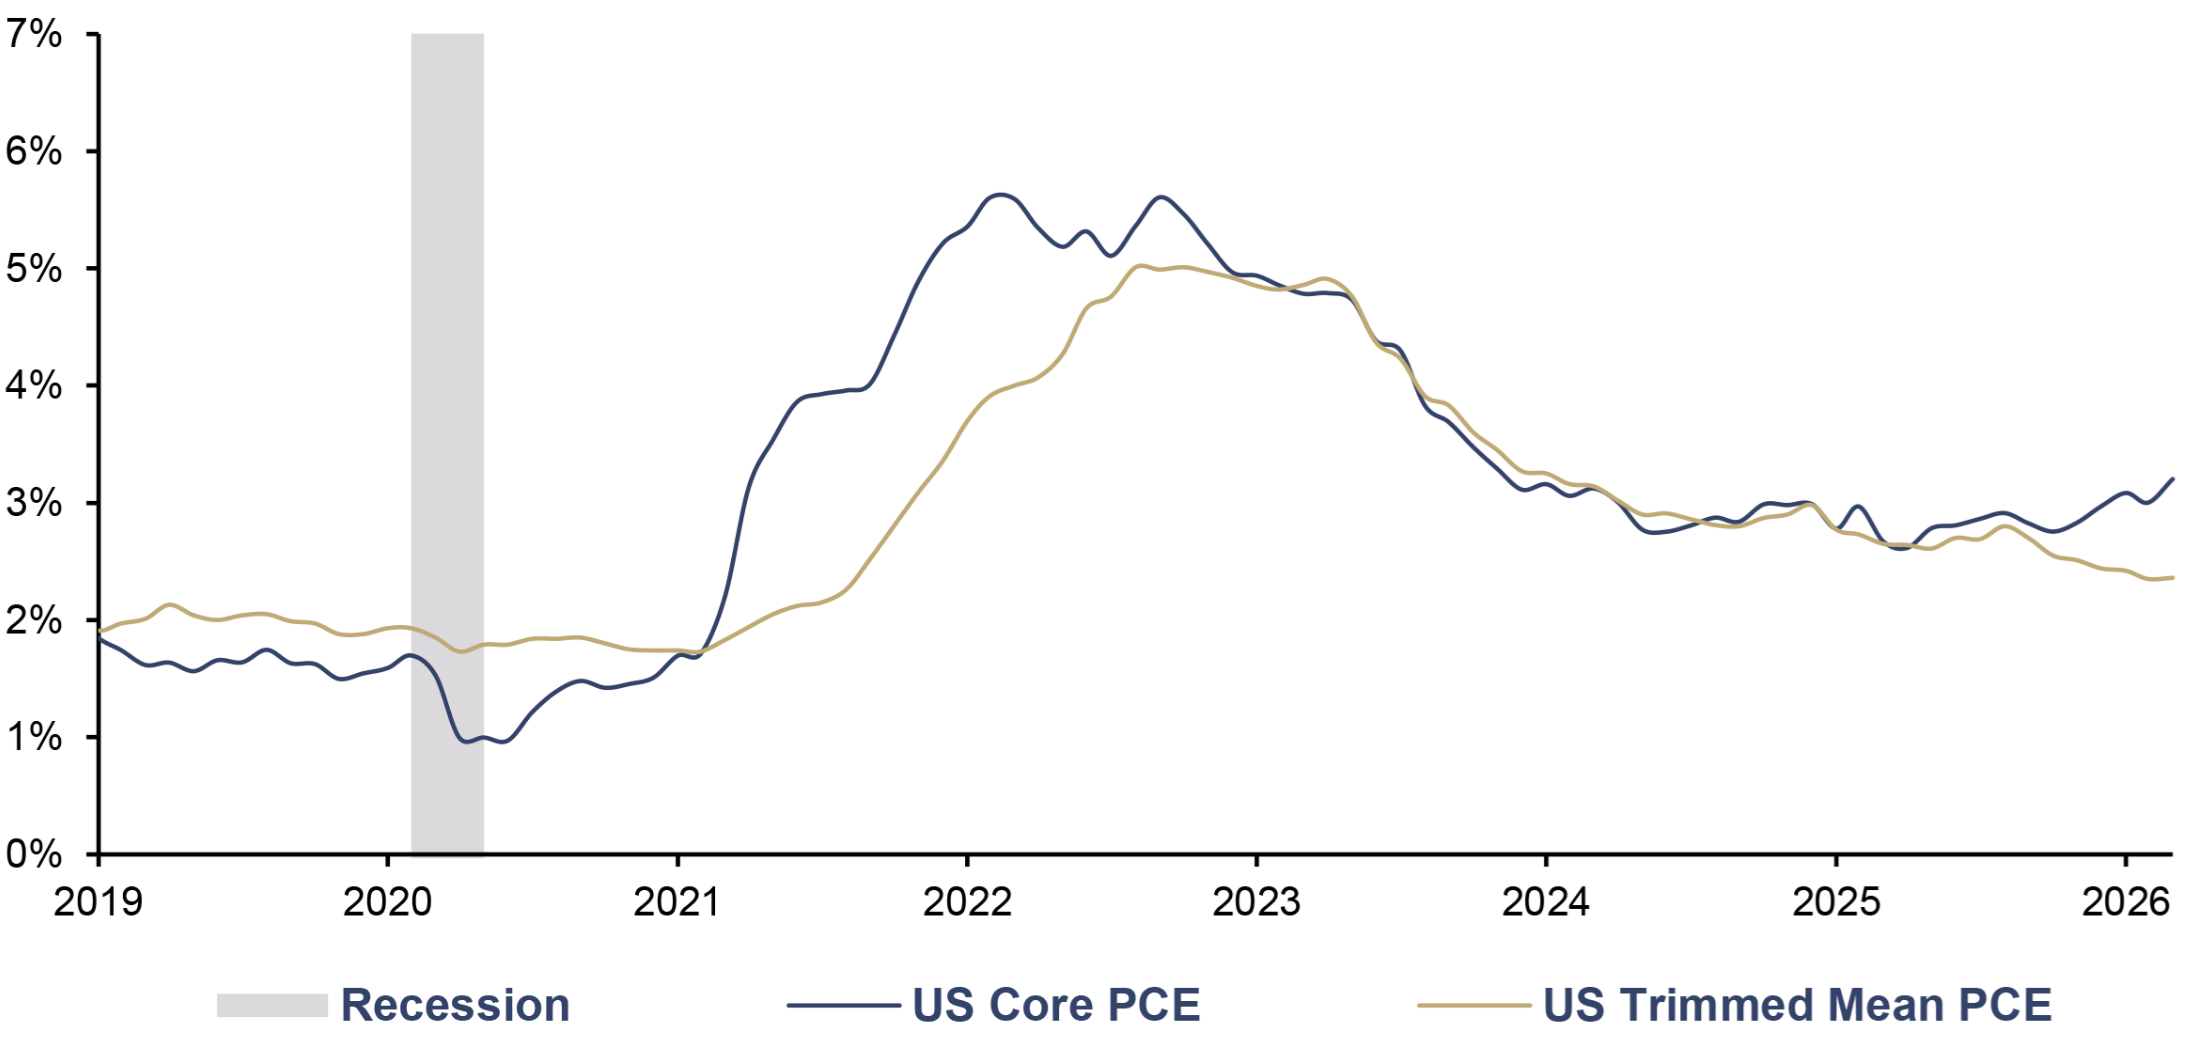
In his Senate hearing, Warsh drew attention with a new detail. First, he described the previously favored (core) PCE index as a “rough swag”. As an alternative, better inflation measure, he cited the trimmed mean PCE inflation rate from the Federal Reserve Bank of Dallas. In this method, all individual PCE components are sorted in ascending order. The extreme ends of the distribution are then removed (“trimmed”), using an asymmetric approach: 24% of the weight is removed at the lower end, but 31% at the upper end. This asymmetric approach is justified by the fact that, in an environment of generally lower inflation rates, sharp price increases in individual PCE components are less frequent but more pronounced. This is intended to better reflect the underlying inflation trend.
A welcome – and timely – side effect: At 2.3%, the inflationary pressure in February for the trimmed mean was significantly lower than for overall PCE inflation at 2.8%, which would make an interest rate cut, so strongly and repeatedly called for by Trump, easier to justify.
US Core PCE and US Trimmed Mean PCE, yoy, 01/2019–03/2026
Source: Federal Reserve St. Louis, LSEG, Incrementum AG
Warsh also emphasized during the hearing that the Federal Reserve’s independence is “essential.” However, an analysis by the FT shows that Warsh has been particularly hawkish in his speeches and writings since 2006 under Democratic presidents, especially during his tenure as a member of the Board of Governors from 2006 to 2011 – a position he resigned from in protest against another round of QE. Under Republican presidents, his statements were mostly significantly more dovish.
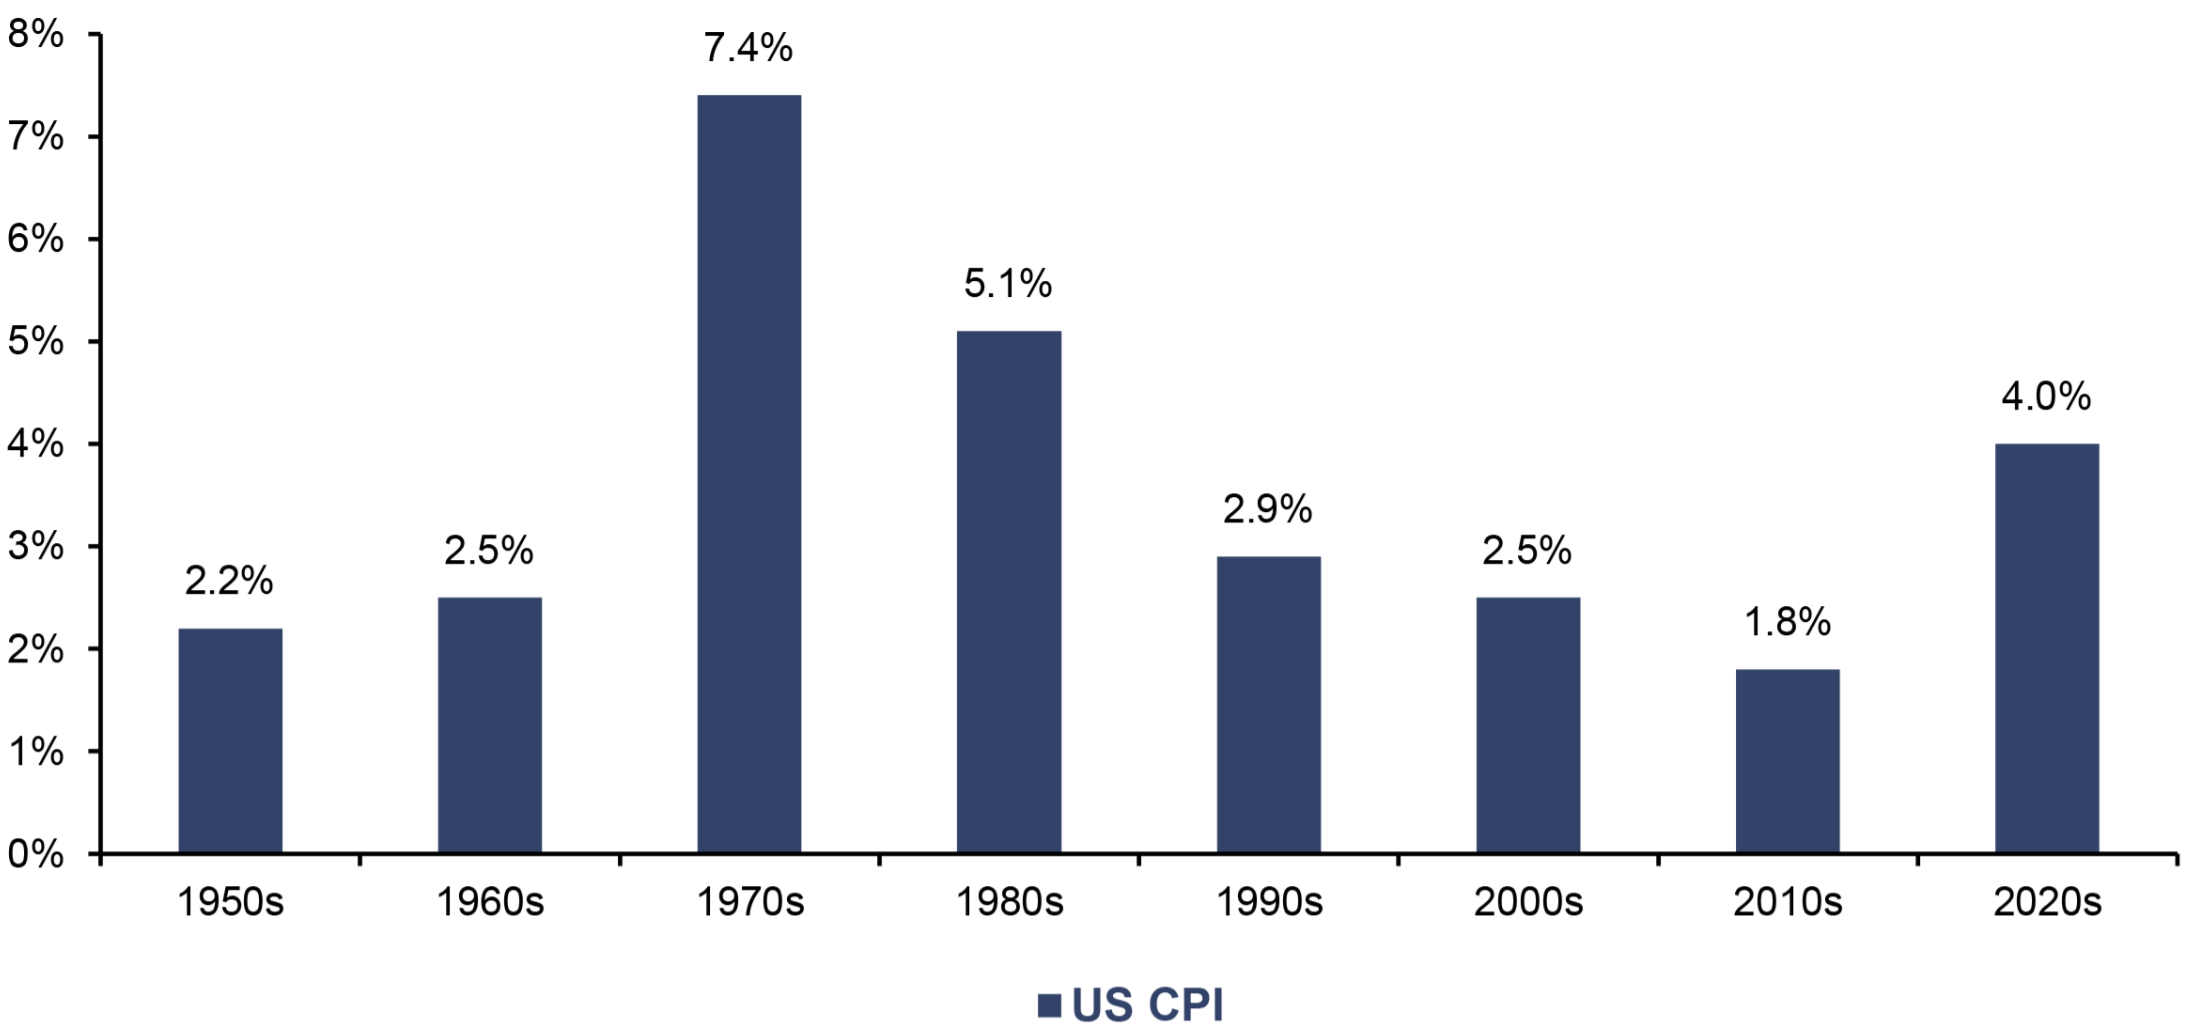
In any case, even Kevin Warsh is unlikely to succeed – except perhaps through a statistical quirk – in ensuring that the 2020s will secure a spot on the podium in the low-inflation rankings of the decades since 1950. The gap to the fourth-ranked decade, the 1990s, is already considerable at 1.1 percentage points. For this to happen, the average inflation rate for the remainder of the decade would have to remain consistently below 2%. Should the war in Iran result in significant and persistent disruptions, the 1980s – currently in second place – might even be overtaken.
US CPI Decade Average, yoy, 01/1950–03/2026
Source: Ritholtz, LSEG, Incrementum
Monetary inflation factors
As of November 2025, the Federal Reserve ended its QT. In total, bonds worth USD 2.4trn were sold. The balance sheet total shrank from just under USD 9trn in April 2022 to slightly over USD 6.5trn. By comparison, the ECB reduced its balance sheet by 30%, although the sharp rise in gold reserves – revalued on a quarterly basis – expanded the balance sheet. The assets accumulated under the various QE programs were reduced by 50% to EUR 3.6trn, QE bonds by just under 30%, and QE loans to commercial banks under the long-term refinancing operations (LTROs) by virtually the entire amount.
At the December 2025 FOMC meeting, the Federal Reserve announced that it would allow its balance sheet to grow by purchasing approximately USD 40bn in Treasury securities per month until the tax deadline on April 15; thereafter, these reserve management purchases (RMPs) are to be “significantly reduced.” As a result, the Federal Reserve’s balance sheet total rose again, reaching USD 6.7trn. The Federal Reserve is also replacing its mortgage-backed securities (MBS) with T-bills. By replacing MBS with T-bills, the Federal Reserve is swapping long-term securities for short-term securities, making its balance sheet more interest-rate sensitive.
Easing of capital rules has an inflationary effect
In our two-tier monetary system, central banks control the money supply in the narrow sense – cash and central bank reserves, as well as, possibly soon, digital central bank money. Building on this, commercial banks provide economic actors with the vast majority of medium of exchange through balance-sheet-expanding and credit-based creation of demand deposits. In this respect, commercial bank lending has a significant impact on the money supply in circulation. Currently, the money supply multiplier stands at just over 4 in the US and just under 4 in the euro area, whereas it was more than twice as high before the global financial crisis. The numerous rounds of QE have inflated central bank balance sheets.
US M2/M0 Ratio, 01/1970–03/2026

Source: LSEG, Incrementum AG
In this respect, changes in capital regulations affect commercial banks’ lending practices, and thus the amount of credit or money circulating in an economy, thereby strengthening or weakening inflationary pressure. Easing credit standards tends to lead to an expansion of the money supply and thus to higher inflationary pressure, especially if central banks do not simultaneously pursue a tightening policy.
And this is precisely the lever that is currently being adjusted in the US. New regulations for systemically important banks have been in effect since early April. These are intended to reduce existing misincentives for large banks to seek out assets with comparatively low risk – such as the explicitly mentioned US Treasuries. In other words: Demand for US Treasuries is to be stimulated, thereby pushing yields down – marginally. In March, Michelle W. Bowman, Federal Reserve Vice Chair for Supervision, announced that further reform proposals for banking regulation would soon be presented. These proposals are intended to enable commercial banks to be “better positioned to support economic growth,” which means nothing other than making it easier to grant loans.
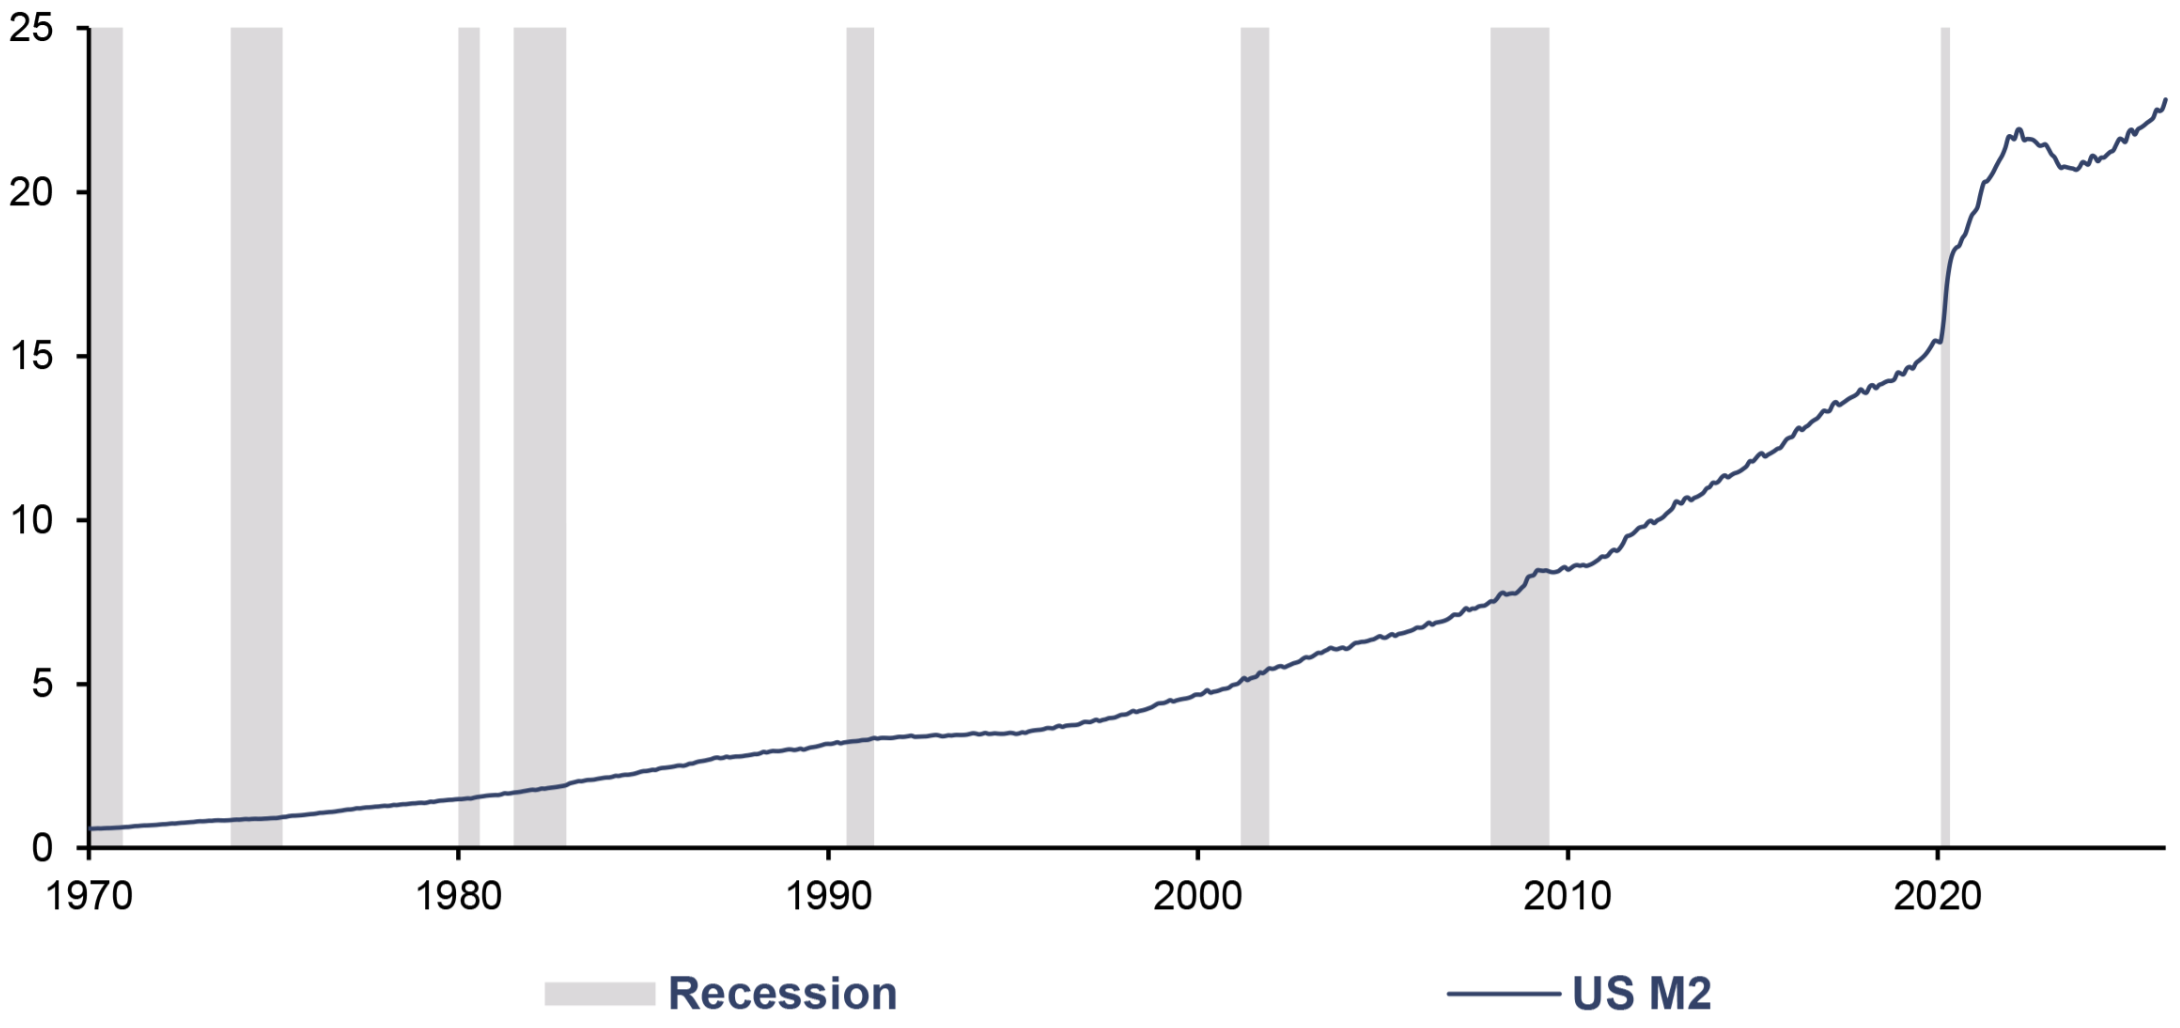
Following the sharp fluctuations during the Covid pandemic, the broad money supply aggregate M2 in the US is already back at the lower end of the 5–10% range – where money supply growth has fluctuated in noncrisis periods since 1996 – with a growth rate of just under 5%. On average, M2 grew by 6.3% per year over these 30 years.
Only in 2017 and 2018 did broad money growth fall below this range, when, under Janet Yellen and during Jerome Powell’s first year in office, interest rates were raised in a total of seven small increments to 2.25–2.5%. At the press conference following the interest rate decision on December 19, 2018, the new chairman – who had been in office for less than a year – made his famous “autopilot” remark, which he corrected a few weeks later – the infamous “Powell pivot.”
US M2, in USD trn, 01/1970–03/2026
Source: LSEG, Incrementum AG
Inflation expectations
Investors now have access to a wide range of metrics that reflect short-, medium-, and long-term inflation expectations. These can be divided into market-based and survey-based inflation expectations, although the predictive power of all indicators is limited.
Market-based inflation expectations
5-year, 5-year-inflation expectations
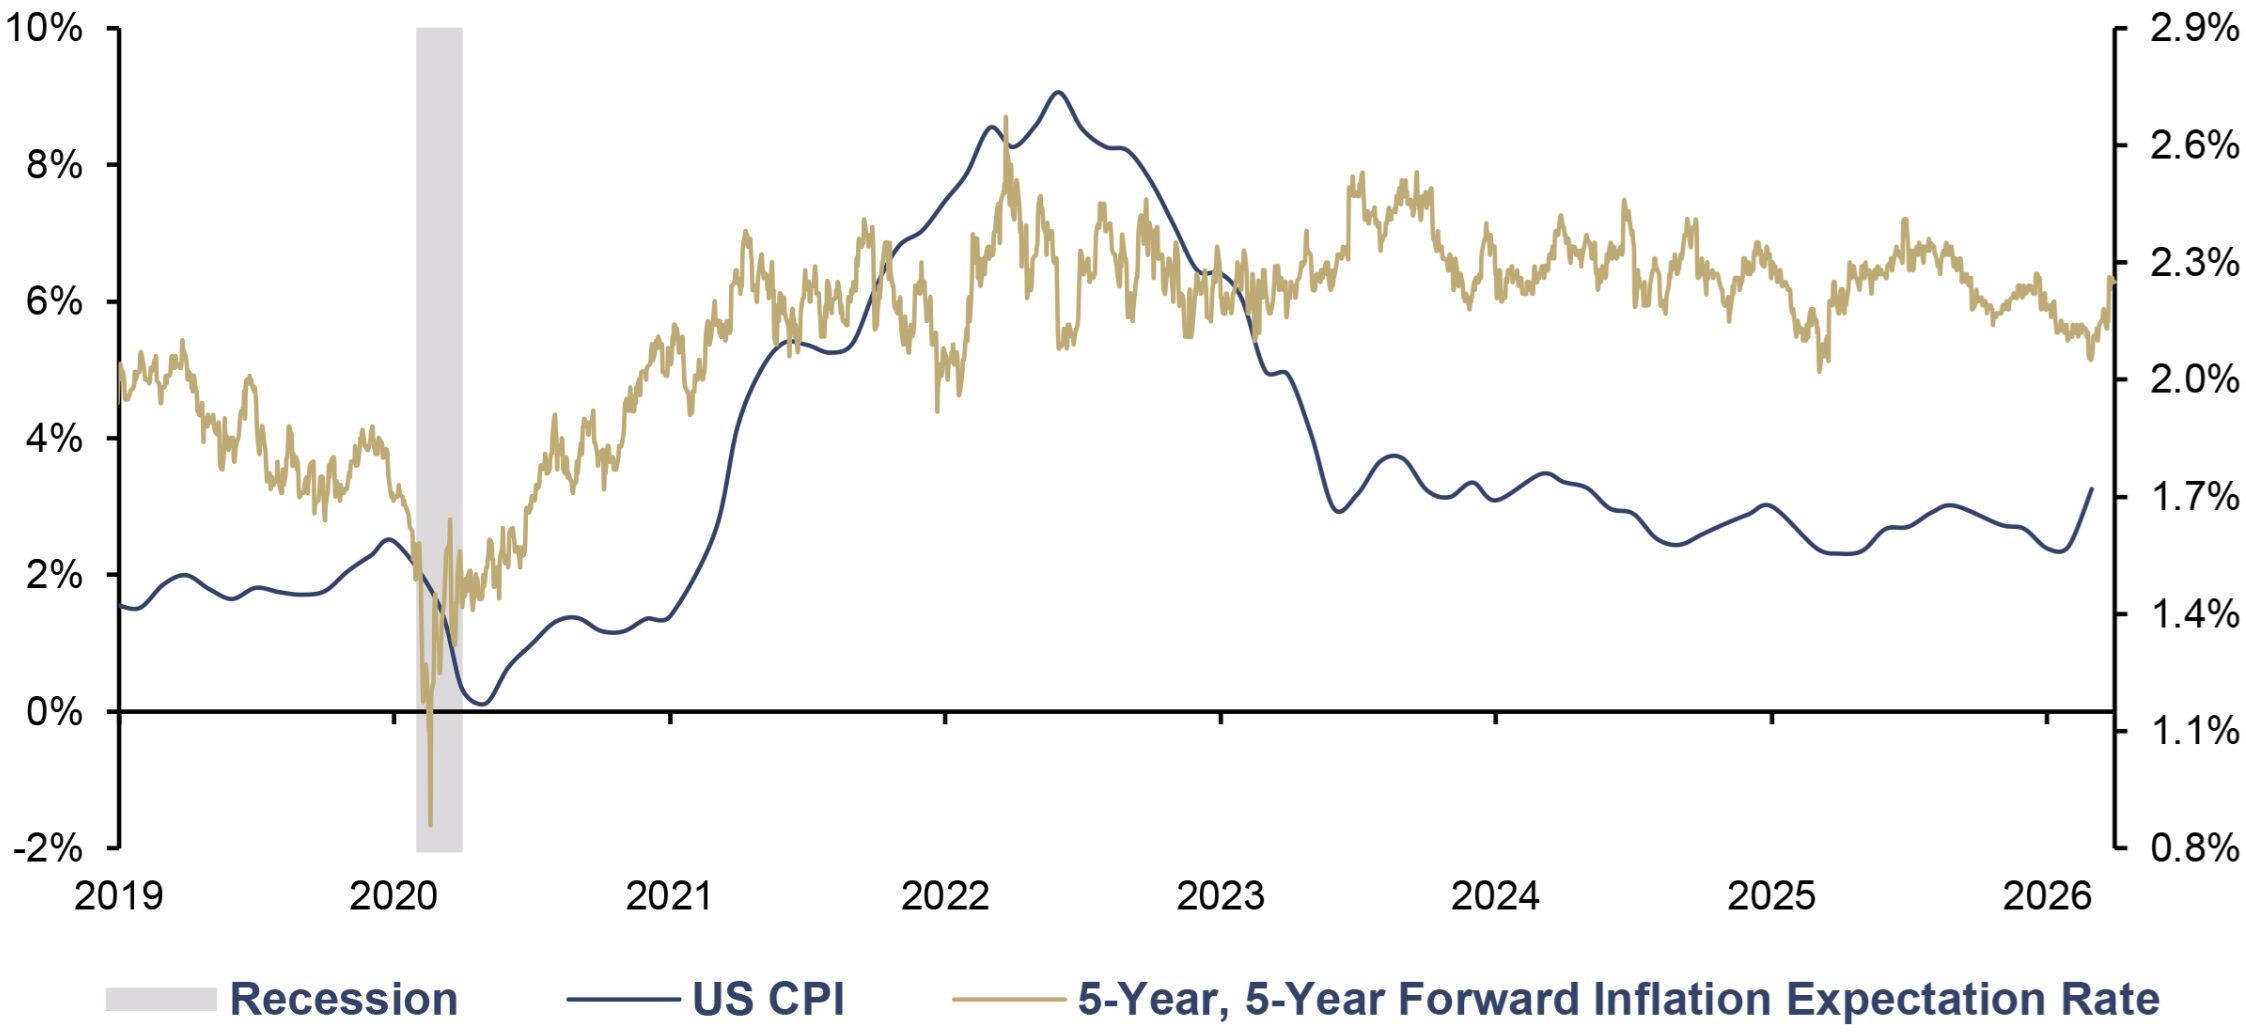
Since the peak in April 2022, long-term inflation expectations have been on a downward trend, which even accelerated slightly in the days leading up to the outbreak of the Iran war and only came to an abrupt end just before reaching the 2.0% mark. In the first weeks of the Iran war, the 5y5y inflation expectation climbed to above 2.25%. All in all, however, the data should be interpreted to mean that market participants have a high degree of confidence in the Federal Reserve—and in US economic policy.
US CPI (lhs), and 5-Year, 5-Year Forward Inflation Expectation Rate (rhs), yoy, 01/2019–04/2026
Source: Federal Reserve St. Louis, LSEG, Incrementum AG
Breakeven rate
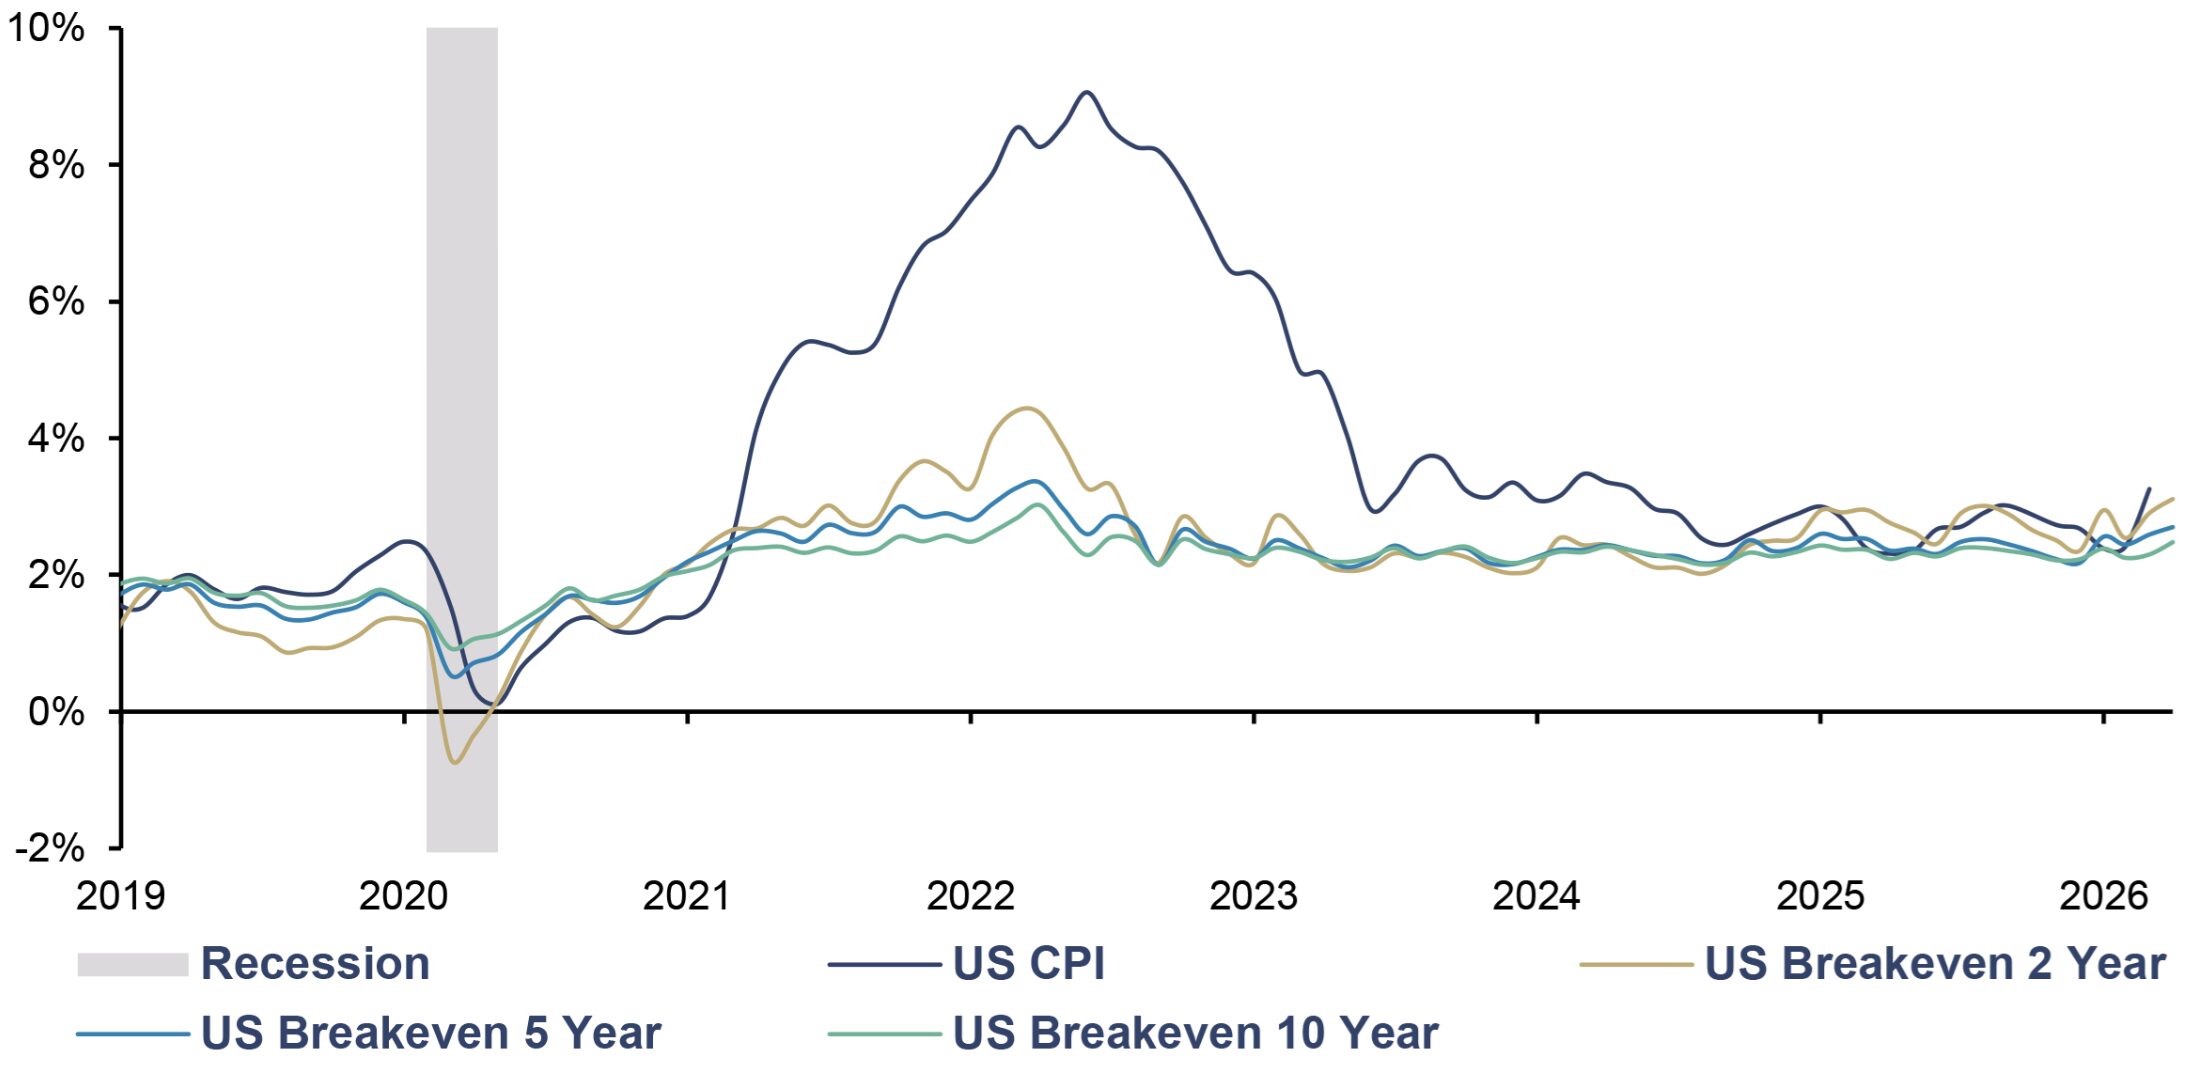
The break-even inflation rate indicates the inflation rate required for the purchase of an inflation-linked bond to yield at least the same real interest rate as the purchase of a conventional bond. It is striking that the 5-year break-even rate already recorded a marked upward surge of just over 30 basis points in the first weeks of 2026. The outbreak of the Iran war led to a second upward surge, and after a brief slowdown in the second half of March, a third surge followed, bringing the 5-year breakeven rate to 2.70% – more than 50 basis points higher than at the end of 2025.
The 2-year breakeven rate, at 3.11%, has already risen by nearly 80 basis points since the start of the year, and by nearly 60 basis points since the outbreak of the war in Iran. However, this is only 10 basis points above the level at the end of August 2025. The 10-year breakeven rate is, naturally, reacting much more cautiously. Since the start of the year, it has risen by 23 basis points to 2.48%, and thus only marginally more since the start of the year. This significantly higher level compared to the second half of the 2010s confirms the generally higher inflation expectations, slightly above the Federal Reserve’s inflation target.
US CPI, yoy, and Various US Breakeven Rates, 01/2019–04/2026
Source: LSEG, Incrementum AG
Are the markets massively underestimating the risk of inflation?
Perhaps the most intriguing question is not whether inflation will return, but why the markets remain so convinced that it will not. Long-term inflation swap rates and the 5y5y forward rate both signal the same thing: near-total confidence in a return to price stability. No one in the bond market seems to seriously believe that inflation rates could remain structurally above target – neither due to fiscal dominance, nor due to second-round effects in energy, nor due to administratively induced inflation from Brussels.
It is precisely this composure that gives us pause. History offers few examples in which inflation, after an initial outbreak, disappeared permanently and quietly – the 1970s saw two waves, and the second was the higher one. The fact that market participants currently rule out a repeat scenario is less a testament to their foresight than to the power of anchored expectations: What was once declared “temporary” remains so in the minds of many, even the second time around.
The price of gold seems to see things differently. Either the yellow metal senses what the markets have not yet priced in – or the swap curves are right, and gold is chasing an inflation that never comes. Our assessment is clear: The swap curve underestimates the probability of a structural inflation regime, and gold is doing what it has always done historically – it perceives monetary reality earlier than the futures markets.
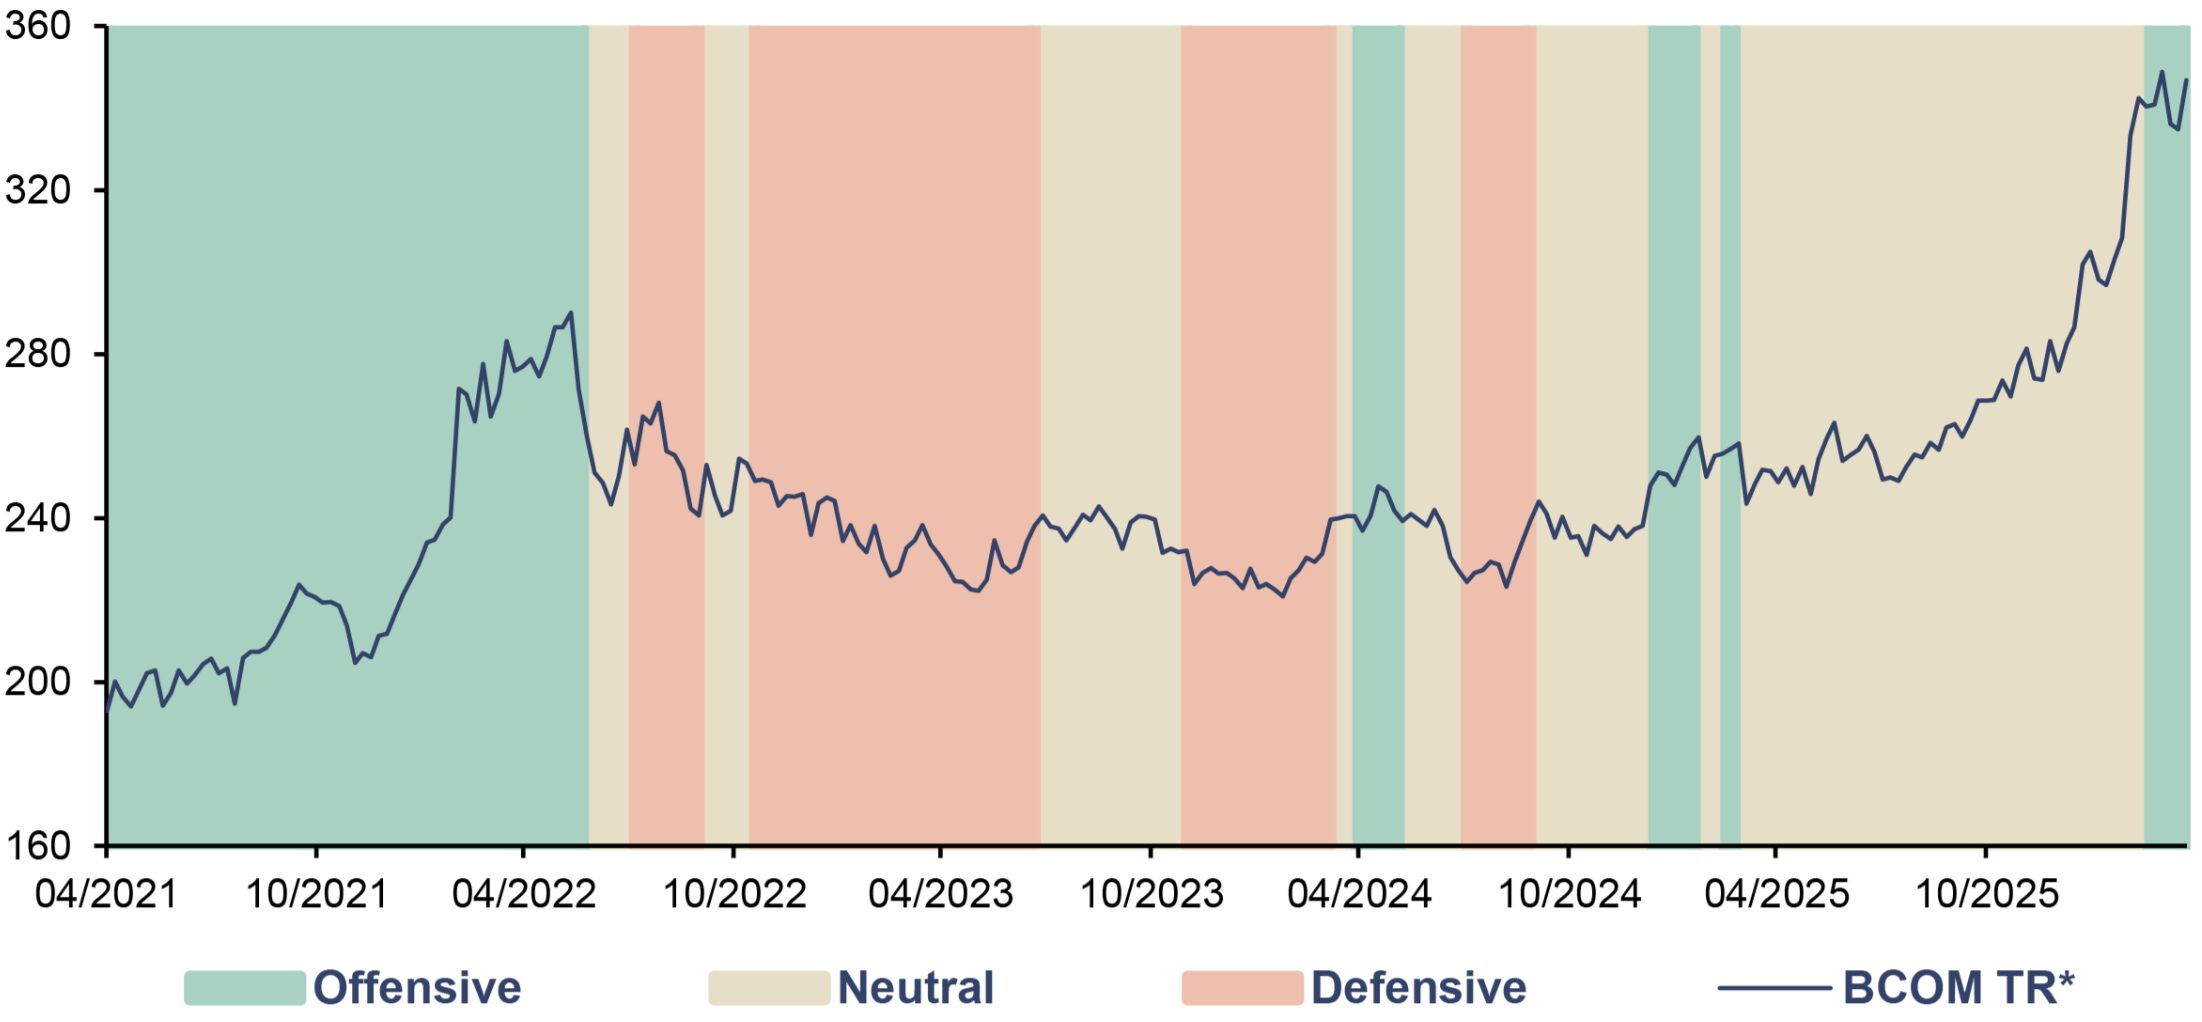
Incrementum Inflation Signal
The Incrementum Inflation Signal has recently jumped from neutral to offensive. This marks the first offensive signal reading in around a year.
BCOM TR*, and Incrementum Inflation Signal, 04/2021–04/2026
Source: LSEG, Incrementum AG
*Bloomberg Commodity Total Return Index
It is noteworthy that the signal remained neutral for an extended period even though the Bloomberg Commodity Index had posted visible gains in recent months. The reason was the lack of market breadth: On a year-on-year basis, the rise in the index was driven essentially by precious metals, while many other commodity segments showed hardly any meaningful upward momentum. Excluding precious metals, the broad commodity market had moved largely sideways until the Iran war.
This picture has changed markedly of late. As geopolitical tensions surrounding Iran have intensified, energy commodities such as oil and gas in particular have risen sharply in price. At the same time, there are growing signs that various agricultural commodities, including wheat, have also formed a bottom. Restricted supply chains and heightened uncertainty on the supply side are exerting additional upward pressure on prices.
With the shift into offensive territory now having occurred, the indications are increasing that inflationary tendencies are once again gaining relevance. Against this background, commodities appear increasingly attractive from a diversification perspective. In an environment of geopolitical tensions, fragile supply chains and rising price momentum once again, active commodity investing can make an important contribution to portfolio stabilization.
Survey-based inflation expectations
Inflation expectations, University of Michigan
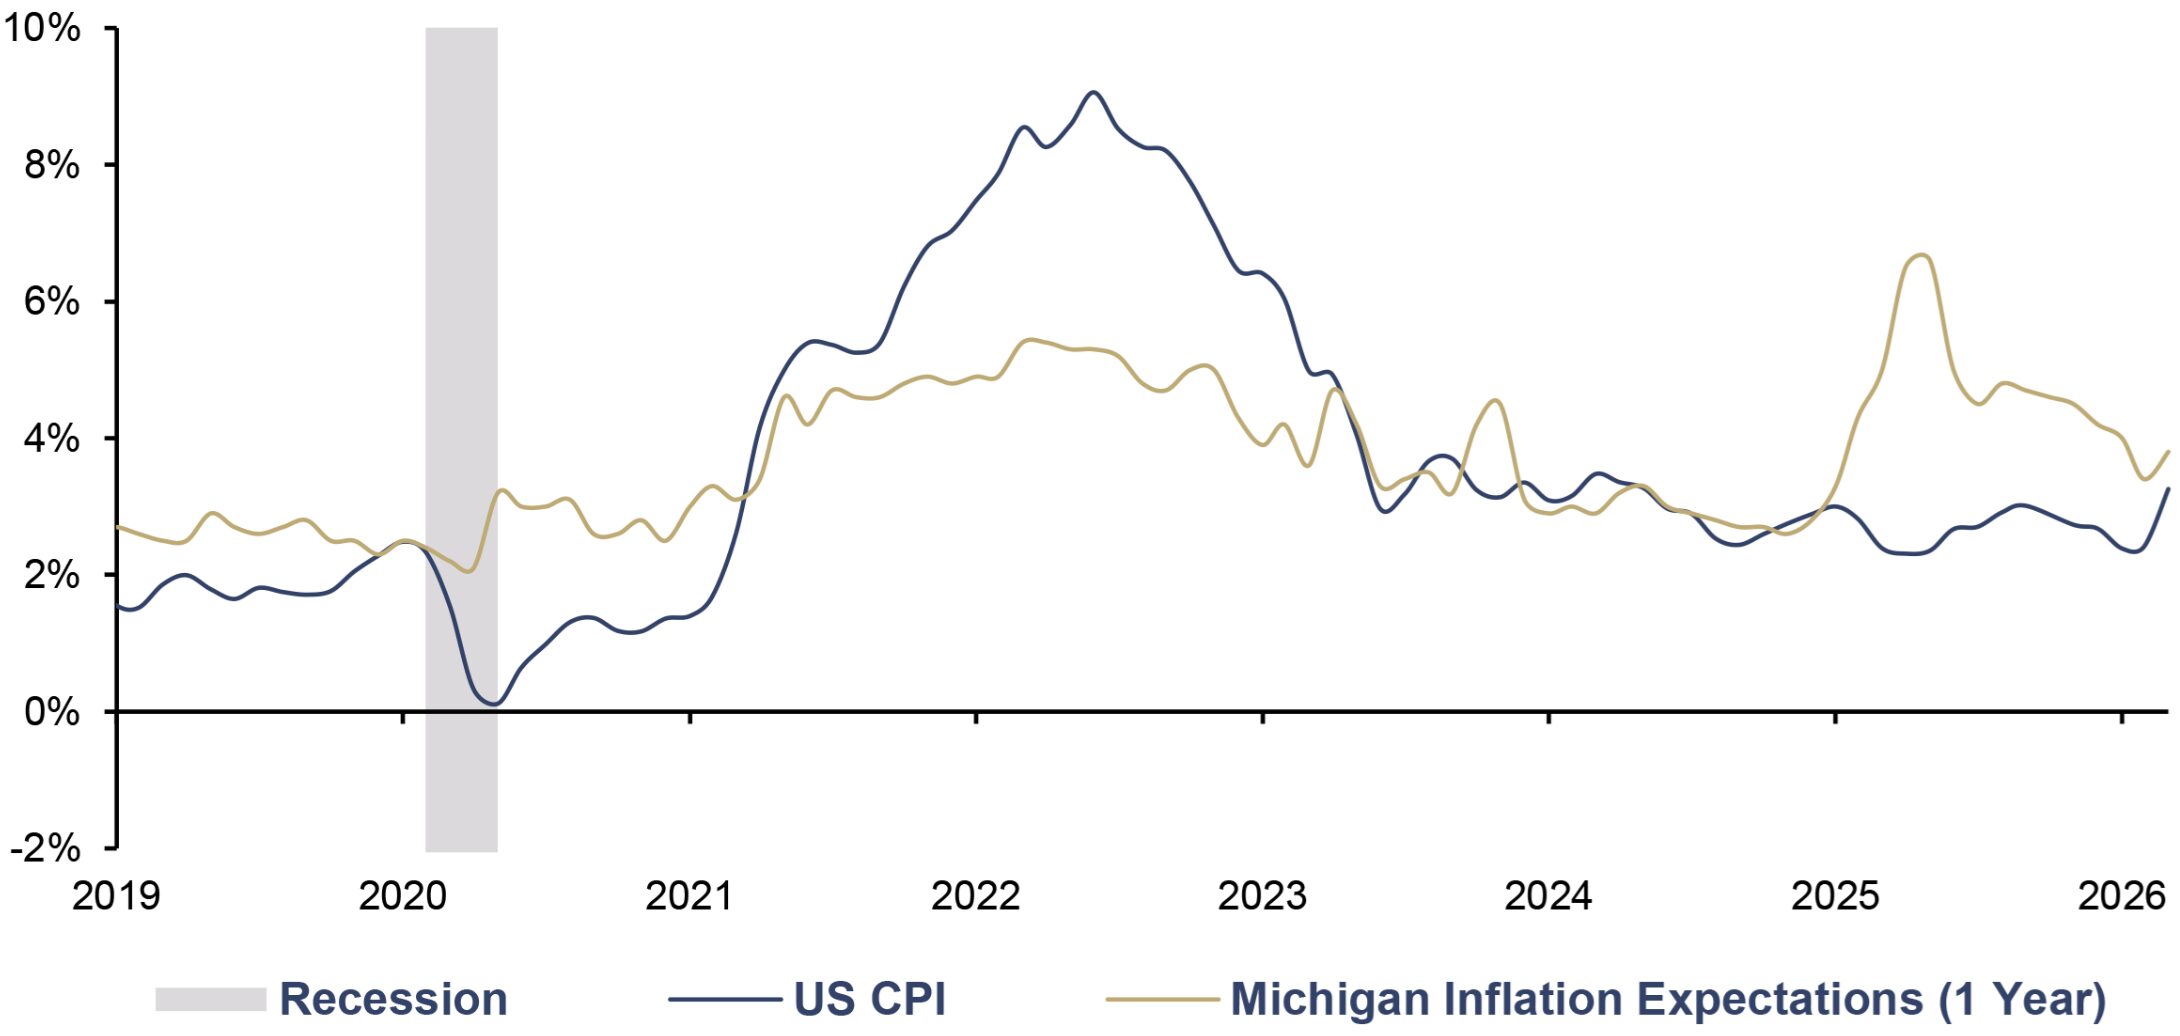
With Donald Trump’s election victory, short-term inflation expectations shot up sharply. They peaked at 6.6% in May 2025. However, the results varied greatly depending on party preference. While Republicans expected inflation to decline, Democrats feared it would skyrocket. After that, the trend was steadily downward, even though the proportion of consumers attributing their poor financial situation to high prices fluctuated at a high level around 40% and has risen noticeably since the fall of 2025. The outbreak of the Iran War has significantly pushed up short-term inflation expectations (median) from 3.4% to 4.7%. However, survey-based inflation expectations are generally also not a good predictor of inflation trends.
US CPI and Michigan Inflation Expectations (1 Year), yoy, 01/2019–03/2026
Source: LSEG, Incrementum AG
Deep Dive Euro Area
In February, rumors circulated that Christine Lagarde would step down before the end of her term. Her term expires regularly at the end of October 2027 and cannot be extended. However, the rumors did not prove true. But the political wrangling over Christine Lagarde’s succession will begin by fall at the latest. According to Article 283 TFEU, the right to propose a candidate lies with the governments of the eurozone countries—in practice, Germany and France – even though Spain quickly positioned itself when rumors of Lagarde’s early departure first surfaced. Since Germany continues to hold the presidency of the Commission with Ursula von der Leyen, France is likely to take the lead in the decision-making process regarding Lagarde’s successor. The proposed candidate must undergo a nonbinding hearing before the European Parliament and the Governing Council of the ECB. The appointment is made by a decision of the European Council by qualified majority. The eight-year term of office is scheduled to begin on November 1, 2027.
Meanwhile, Christine Lagarde continues to push forward with her pet project, the digital euro, even though she will no longer be ECB President by the time of its planned launch in 2029. In addition to the digital euro intended for consumers, the ECB is also working on a concept for a tokenized financial system known as Appia. The concept is scheduled to be published in 2028, and it will serve as the basis for implementing the next steps toward the introduction of tokenized central bank money. Both initiatives are designed to strengthen the EU’s strategic autonomy and thus primarily serve a political objective.
Administrative and bureaucratic inflation factors
While the US under President Trump withdrew from the Paris Climate Agreement as well as from the energy transition, the EU has only slightly scaled back its fight against climate change.
In early November 2025, it was decided to postpone the introduction of the second phase of the EU Emissions Trading System (ETS-2) until 2028. No significant changes were made to the climate targets of reducing CO2 emission by 90% by 2040, and by 100% by 2050. The first phase, EU ETS 1, was introduced in 2005. It covers large energy facilities and energy-intensive industries, as well as aviation and shipping companies. These sectors are responsible for around 40% of CO2 emissions. Free allowances for companies with particularly high CO2 emissions have so far mitigated the rise in costs. In the wake of the looming energy crisis resulting from the war in Iran, initial calls emerged to temporarily suspend the ETS entirely, as proposed by Italian Prime Minister Giorgia Meloni.
In 2028, this auctioning process will be expanded to the road transport and buildings sectors (EU-ETS 2). Gasoline and diesel, as well as natural gas and heating oil, will then almost certainly become significantly more expensive. In an overview study, the highly respected and non-partisan Research and Documentation Services of the German Bundestag list various analyses that estimate the future CO2 price. The range is wide, extending from EUR 50 to EUR 400 per ton. A large portion of the estimates lies well above the current price of CO2 . This applies both to the market price – which has fallen significantly since mid-January to around EUR 75 as of mid-April – and to the price set by the German federal government for sectors not yet covered by emissions trading.
With a CO2 price of EUR 200 per ton, the costs for a four-person household, for example, would rise by around EUR 1,000 per year. The surcharge for diesel and gasoline would roughly quadruple compared to current levels. In absolute terms, that amounts to at least 50 cents per liter.
However, on January 1, 2026, another price driver came into effect: the Carbon Border Adjustment Mechanism (CBAM). It is another building block in Brussels’ fight against CO₂ emissions and a textbook example of the intervention spiral, whereby significant and sustained administrative interference in the price mechanism leads to ever-increasing interventions. On the one hand, the CBAM is intended to prevent foreign companies from offering their products at lower prices due to rising costs for CO₂ emissions in the EU. On the other hand, it is also intended to make the cost-driven migration of companies from the EU to other EU countries less attractive. A reference price was recently set for the first time, at EUR 75.36 per certificate for imports in Q1/2026. However, the certificates do not have to be purchased until 2027.
But perhaps the motivation behind CBAM isn’t as noble as it seems at first glance. After all, the EU is the biggest beneficiary of CBAM, receiving 75% of these green tariffs – which are euphemistically called “compensation payments” – and thereby increasing its own resources. A full 25% goes to the nation-states. To put it bluntly – and admittedly in very exaggerated terms: The EU accuses Trump’s tariff policy of doing exactly what it is essentially doing itself – but, of course, under the guise of noble motives. The fact that the implementation of CBAM has also been designed to be extremely bureaucratic should come as no surprise to anyone. Announcements of debureaucratization coming from the mouths of bureaucrats are, as a rule, exactly that: lip service.
Back to ETS-2: The ECB’s reaction to the postponement of the introduction of ETS-2 was quite remarkable. Top ECB officials noted that this delay in expanding emissions trading to the transport and buildings sectors could lower the inflation rate in 2027 by 0.2 percentage points, from the 1.9% forecast at the time to 1.7%. This would put the eurozone at risk of missing its 2.0% inflation target in 2027.
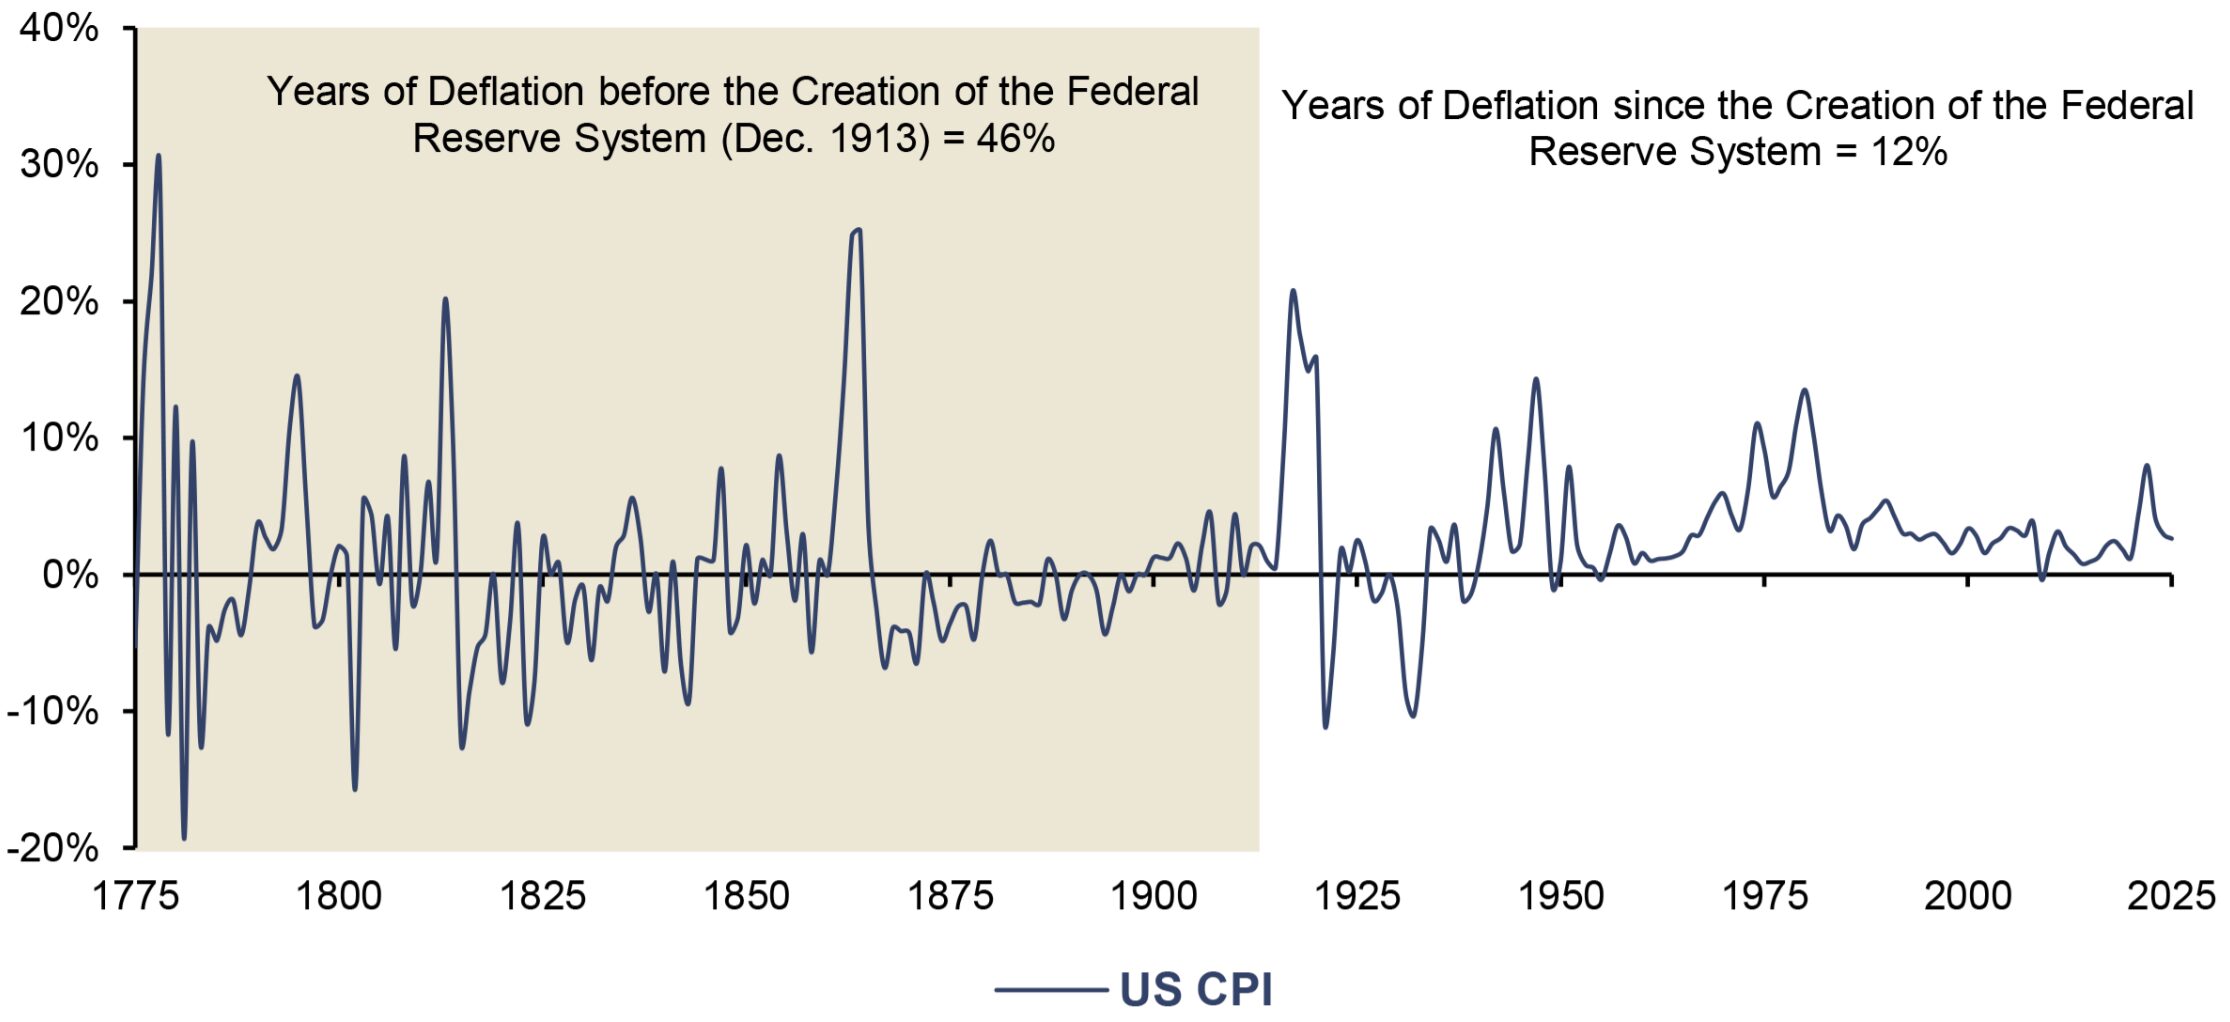
The fact that the ECB is in all seriousness presenting a possible 0.3 percentage point miss of its target as a problem – following a three-year inflation surge that drove the HICP up by 18% – shows how far it has drifted from the reality of citizens’ lives. And a low inflation rate still means that prices are continuing to rise, albeit at a slower pace. Yet even more than inflation, central bankers – erroneously – fear price deflation.[2]
A new study, “The costs of deflations: a historical perspective,” fundamentally challenges this very fear of price deflation. However, asset price deflation, particularly in the real estate market, would have caused far more damage – not least because it would have plunged the banking sector into considerable difficulties. The most important task of (monetary) policy would therefore be to prevent the formation of financial bubbles. In close alignment with the business cycle theory of the Austrian School of Economics, the credit-induced boom is identified as the actual problem, while the correction is seen as the inevitable adjustment of excessive credit and debt expansion.
A historical comparison shows that the asymmetrical relationship between inflation and deflation is not a given of nature but rather a phenomenon of the fiat money era: The authors analyzed 3,687 phases of price inflation and price deflation during the period 1870–2013. The ratio between periods of price inflation and price deflation was highly revealing:
- Classic gold standard (1870–1913): 1.25:1
- Interwar period (1920–1938): 1.18:1
- Postwar period (1947–2013): 18.4:1
There could hardly be clearer evidence that the fiat era is structurally inflationary – and that central banks’ obsession with the risk of price deflation stems more from historically inherited trauma than from empirically grounded concern.
US CPI, yoy, 1775–2025
Source: Nick Laird, LSEG, Incrementum AG
Conclusion
The past 20 years have been more than turbulent economically. They began with the global financial crisis of 2007–08, which led to a sharp but short-lived recession. This was followed by the first rounds of QE, which at the time broke with convention – a monetary policy described as “extraordinary” that has since become the norm, i.e., “ordinary.” QT is not a departure from QE but merely its winding down – a process that is still ongoing. The Covid-19 pandemic led to another round of QE, followed by the long-anticipated wave of inflation, which was exacerbated by the outbreak of the war in Ukraine and the accompanying high uncertainty in the energy markets. The leading central banks failed miserably in combating it, partly because the wave of inflation was completely underestimated for a long time.
We had warned of the looming wave of inflation early on. Zero and low interest rate policies were bound – sooner or later – to result in (sharply) rising prices.[3] The important conceptual distinction between inflation—the rise in the unbacked money supply – and price inflation – the rise in the general price level—is helpful here,[4] even if this conceptual separation of cause – inflation – and effect – price inflation – is hardly applicable in everyday life.
In 2018, when the In Gold We Trust report was given a title for the first time, we named it “Gold and the Turning of the Monetary Tides.” In November 2020, we published the inflation special “The Boy Who Cried Wolf: An Inflationary Decade Ahead?” and warned early on of the looming, inescapable inflation crisis. In the In Gold We Trust report 2021, we identified a title-deserving “Monetary Climate Change” and thus the steadily increasing fiscal dominance that is transforming central banks from – already poor – guardians of price stability into state financiers, even if this is, of course, not openly communicated. In the In Gold We Trust report 2024, “The New Gold Playbook”, we detailed the consequences of this solidifying new normal, including the two closely related theses that structurally higher inflation rates and the “anything but bonds” investment principle are here to stay.
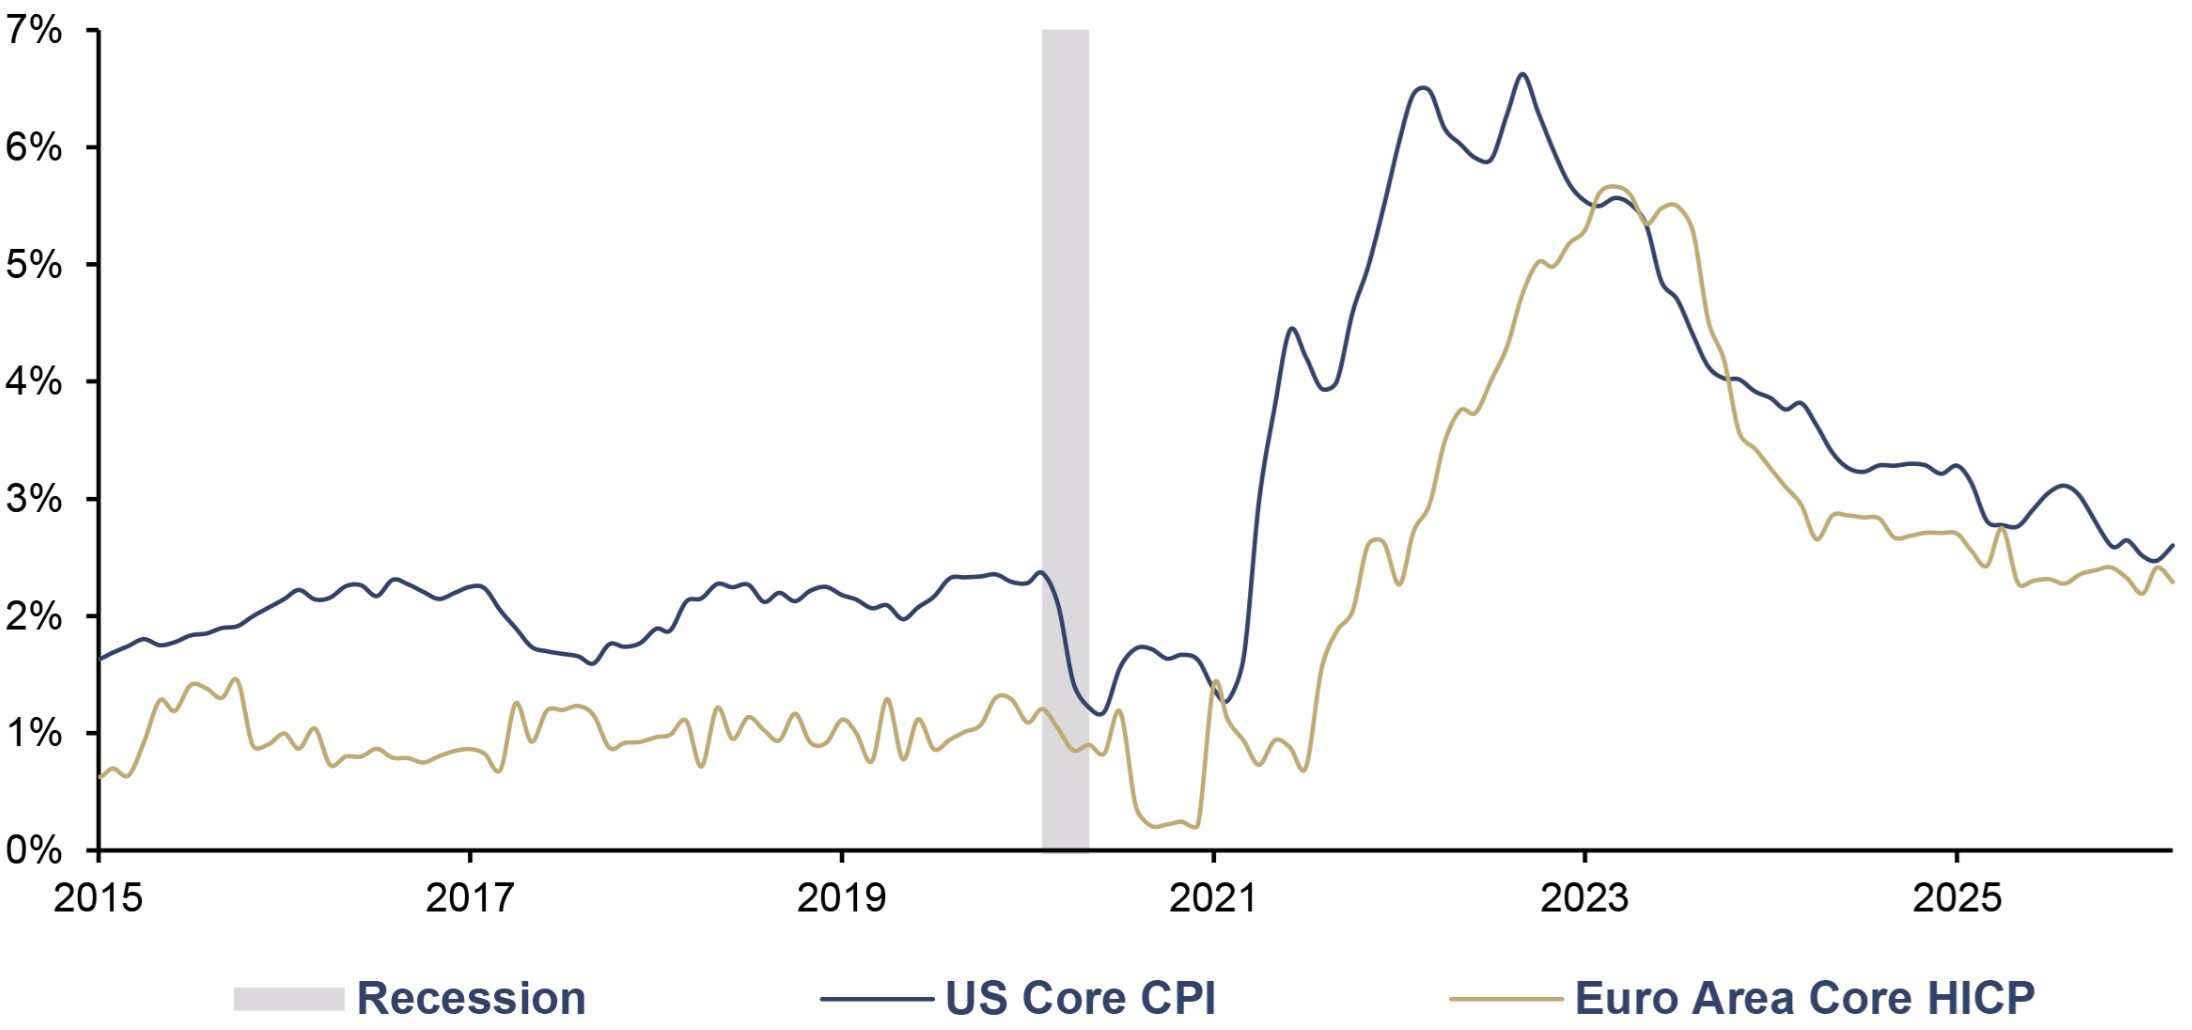
Apart from temporary one-off effects such as exchange rate fluctuations or the current energy price shock with its base effects in both directions, we expect the inflation rate to remain at an elevated level, particularly in the US. The combination of high budget deficits and continued solid growth figures, as well as political pressure on the Federal Reserve to keep interest rates relatively low, provides the rationale for our assessment. The structurally higher level of inflation is particularly evident in core inflation rates.
US Core CPI and Euro Area Core HICP, yoy, 01/2015–03/2026
Source: LSEG, Incrementum AG
The fact that energy and food prices are excluded from the calculation of core inflation – and will therefore cause the (core) inflation rate to remain well below the overall inflation rate in the coming quarters – is of little comfort to consumers. It is therefore to be expected that the already wide gap between central bankers, statisticians, and economists on one hand, and the general public on the other, will widen further when the former group uses core inflation to argue that inflation isn’t so bad after all.
The moral consequences of inflation
One dimension of (high) inflationary periods that remains largely overlooked in public debate is the negative impact of inflation on morale and trust in institutions. One author who has examined this aspect in depth is Lord Brian Griffiths. In his book Inflation Is About More Than Money: Economics, Politics and the Social Fabric, he argues that inflation is essentially an act of deception, since a banknote represents a “promise to pay” a specific value. If this value is eroded by inflation, this promise is broken, which, from a moral standpoint, amounts to theft. He thus opposes the monetary nominalist view, according to which 100 monetary units would always be 100 monetary units, regardless of their purchasing power.
Therefore, Griffiths rejects the notion that inflation is merely a systemic flaw and defines it as a “moral disease” that fuels “social disorder” because it undermines decency and honesty in society. It punishes thrift and rewards debt, which causes economic harm in the long run. Moreover, it hits the poor and those whose wealth consists of wages and savings rather than tangible assets the hardest, which is particularly reprehensible. Furthermore, periods of inflation gradually erode confidence in the financial system, capitalism, and democratic government.
In the tradition of the Austrian School of Economics, Guido Hülsmann argues similarly, for example in his essay “Cultural Consequences of Monetary Interventions” or in his book “Die Krise der Inflationskultur” (“The Crisis of Inflation Culture”). In his novella “Unordnung und frühes Leid” (“Disorder and Early Sorrow”), Thomas Mann explored the hyperinflation following World War I and how it fueled political and social extremism and a kind of hyperreality.[5]
Even though prices are constantly changing and thus the purchasing power of money is never constant, excessive fluctuations in purchasing power cause the price structure to lose its anchor. Yet it is not only the economy in particular that loses its anchor in times of sharply rising inflation rates but society in general as well. Or as Lenin put it: “The best way to destroy the capitalist system is to debauch the currency.”
Among the moral consequences of rising inflation is the scapegoat-hunting that is particularly popular among politicians. For this keeps alive the myth that politicians and central banks are innocent of inflationary waves. Entrepreneurs are popular scapegoats. After all, entrepreneurs represent a minority of the population, and alienating this voter group is therefore not an electoral tactical problem for many parties.
Yet this populist blame game – the claim that excessive corporate profits were the main driver of the 2021–2023 inflation surge – turned out to be a myth during the most recent inflation surge as well. At least, that is the conclusion reached by Christopher Conlon’s study, “Did profits cause inflation?” ECB President Christine Lagarde, too, had joined the populist campaign against entrepreneurs during the inflation surge, which she had completely underestimated.
The anti-business witch hunt in the energy sector has taken – and continues to take – particularly absurd turns. Many energy suppliers in Europe are state-owned. The higher profits flowed into state budgets that had been severely strained by the fiscal excesses of the Covid pandemic, while the same politicians accused the energy suppliers of making excessive profits at the expense of citizens – even though they themselves sat on the supervisory boards of these companies and, as a rule, even held the majority on these boards. However, one economic factor – which is itself attributable to inflation – does have a definite impact on nominal profits. Sharp price increases have a positive effect on nominal profits insofar as the depreciation of capital goods is based on the old price level. The new, higher price level is reflected in corporate profits only when repairs or replacement investments must be made.
In conclusion, it can be summarized that the looming energy (supply) crisis comes at an inopportune time. Following the disastrous misjudgment during the inflationary surge just a few years ago, central banks are just as discredited in the public eye as the established political parties – the remaining established political parties, that is, since in the leading industrial nations on both sides of the Atlantic, so-called established parties now dominate the political landscape only in the US, Spain, and Germany.
Dwindling trust, fueled by another sharp surge in inflation, could prove to be the final nail in the coffin for these parties. In the US, the first-past-the-post system has, at least so far, prevented the rise of new parties – yet as the MAGA movement has demonstrated, even an existing but hollowed-out party shell can be reoccupied. A look at the UK or France, however, shows that even in a political system with a first-past-the-post system, parties that once supported the state can vanish from the scene.
[1] See also “Stagflation 2.0,” In Gold We Trust report 2022
[2] See “Inflation vs. Deflation – The Big Showdown?,” In Gold We Trust report 2018; “Excursion: Monetary Tectonics – Inflation versus Deflation,” In Gold We Trust report 2013
[3] See also Stöferle, Ronald, Taghizadegan, Rahim and Hochreiter, Gregor: The Zero Interest Trap, 2019
[4] See “Inflation ≠ rising prices: confusing terminology with grave consequences,” In Gold We Trust report 2012
[5] See also Paul A. Cantor: “Hyperinflation and Hyperreality: Thomas Mann in Light of Austrian Economics,” Review of Austrian Economics, Vol. 7, No. 1, 1994, pp. 3–29