

Status Quo of Debt
“The day will c ome when citizens will have to face the fact that they must pay off the debts the government runs up and declares to be for the “good of the people.”
Ludwig Erhard
- Since 2007, the year of the first In Gold We Trust report and on the eve of the global financial crisis, global government debt has grown by more than 50% to 96.8% of GDP.
- The current polycrisis – aging populations, military buildup, the green transition, and geopolitical instability – places a significant strain on public finances.
- Even primary balances are deep in the red in most industrialized nations. Ironically, much-maligned Italy is the only notable exception, as Germany is now also taking on debt on a historic scale.
- The US deficit of 5.8% (2025) corresponds almost exactly to the average for the In Gold We Trust report era (2007–2026). However, the deficit remains far higher than the long-term average of 3.8% for the years 1975–2025.
- Both historically and currently, government bonds are proving to be a “fair-weather asset,” particularly because the current significant increase in deficit spending – like earlier ones – is being financed through higher deficits, aka the “guns and butter” principle.
- In light of the structural deficits, citizens face the threat of higher taxes, service cuts, and stricter fiscal austerity measures.
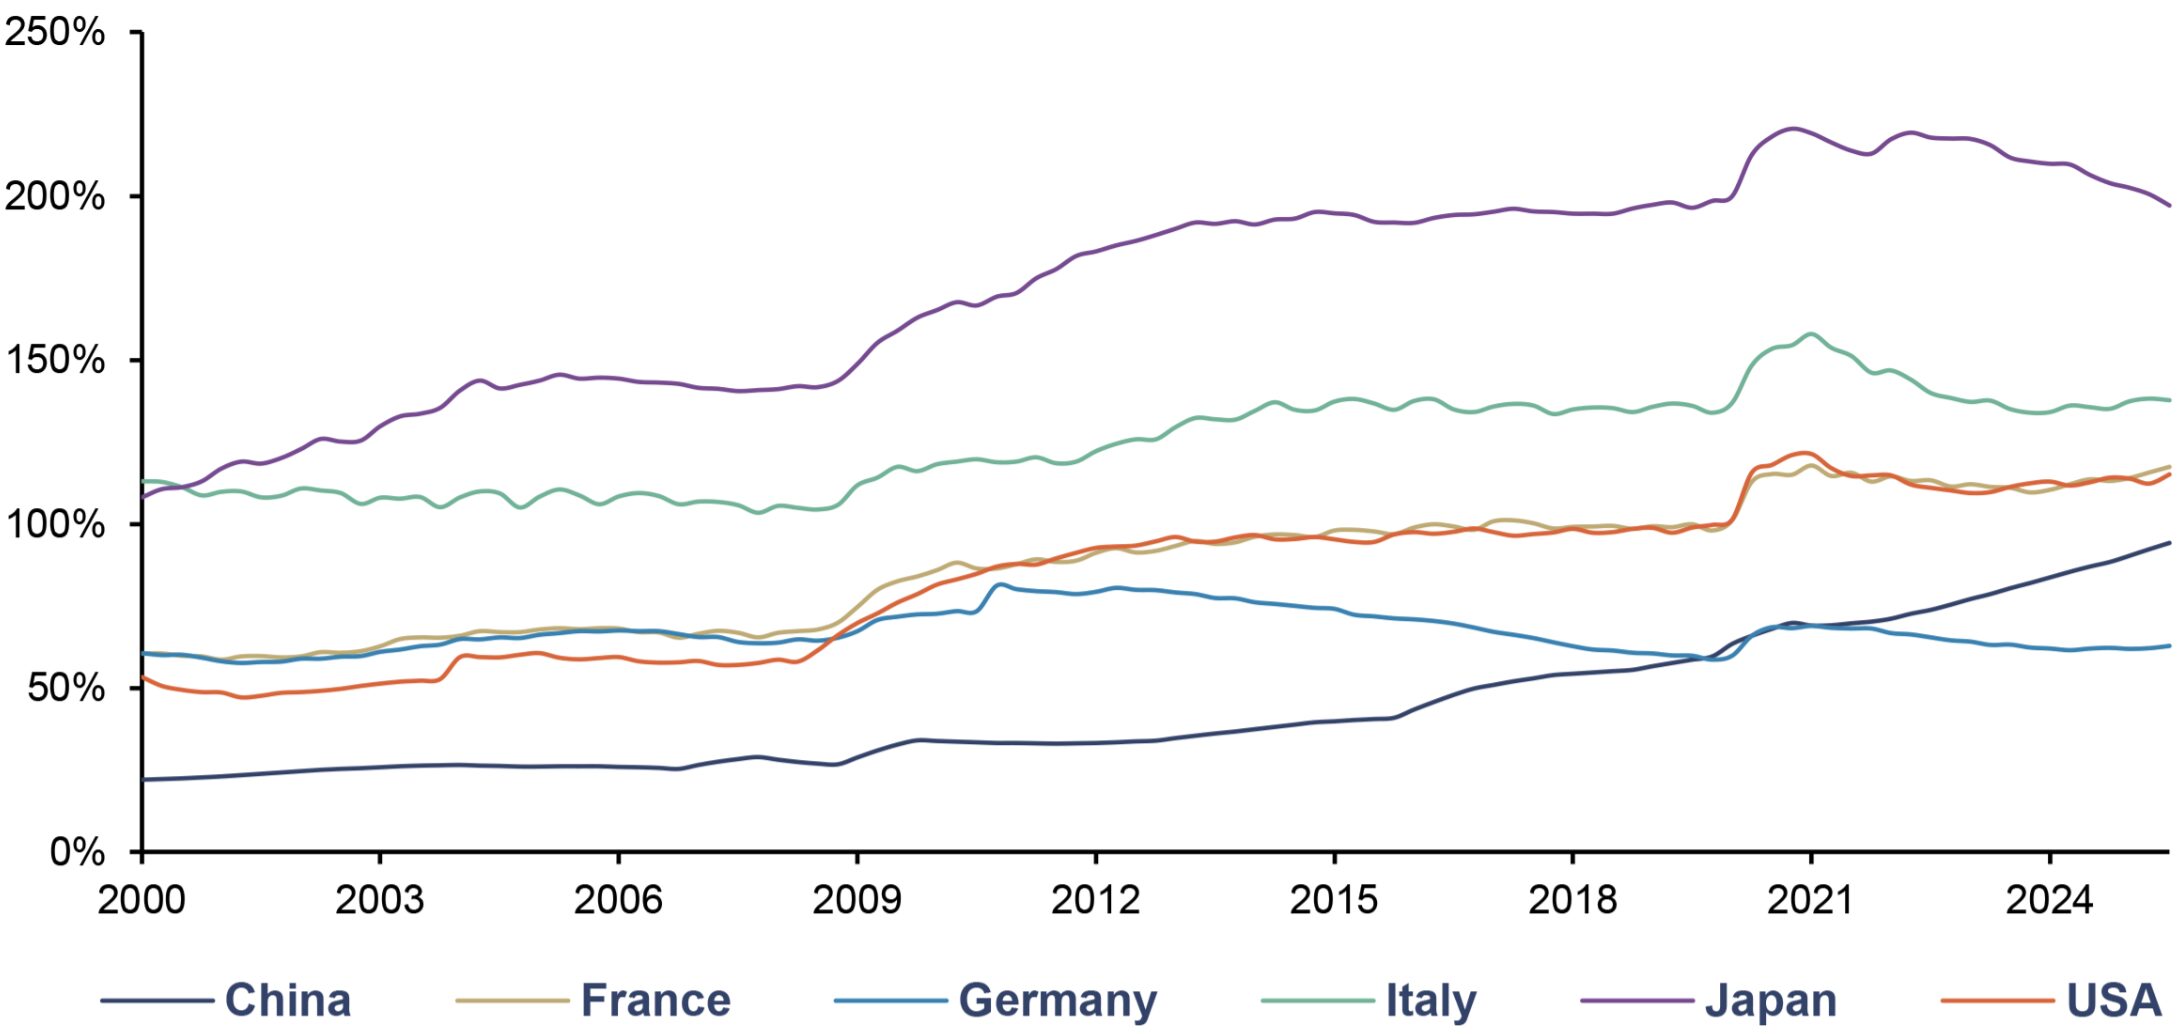
How times have changed. In 2007, the year of the first In Gold We Trust report, Germany, France, and the US were virtually neck and neck in terms of public debt, each with a ratio between 60 and 65%; Italy’s ratio was just slightly above 100%; while Japan’s was still well below 200%. However, the global financial crisis that struck shortly thereafter would severely shake up public finances.
Public Debt, as a % of GDP, Q1/2000–Q3/2025
Source: BIS, Incrementum AG
Now, two decades later, the fiscal position of many countries – especially advanced economies – is in danger of finally falling apart. Despite the consolidation phases following the 2007–08 global financial crisis and the Covid-19 pandemic, the longterm upward trend continues unabated.
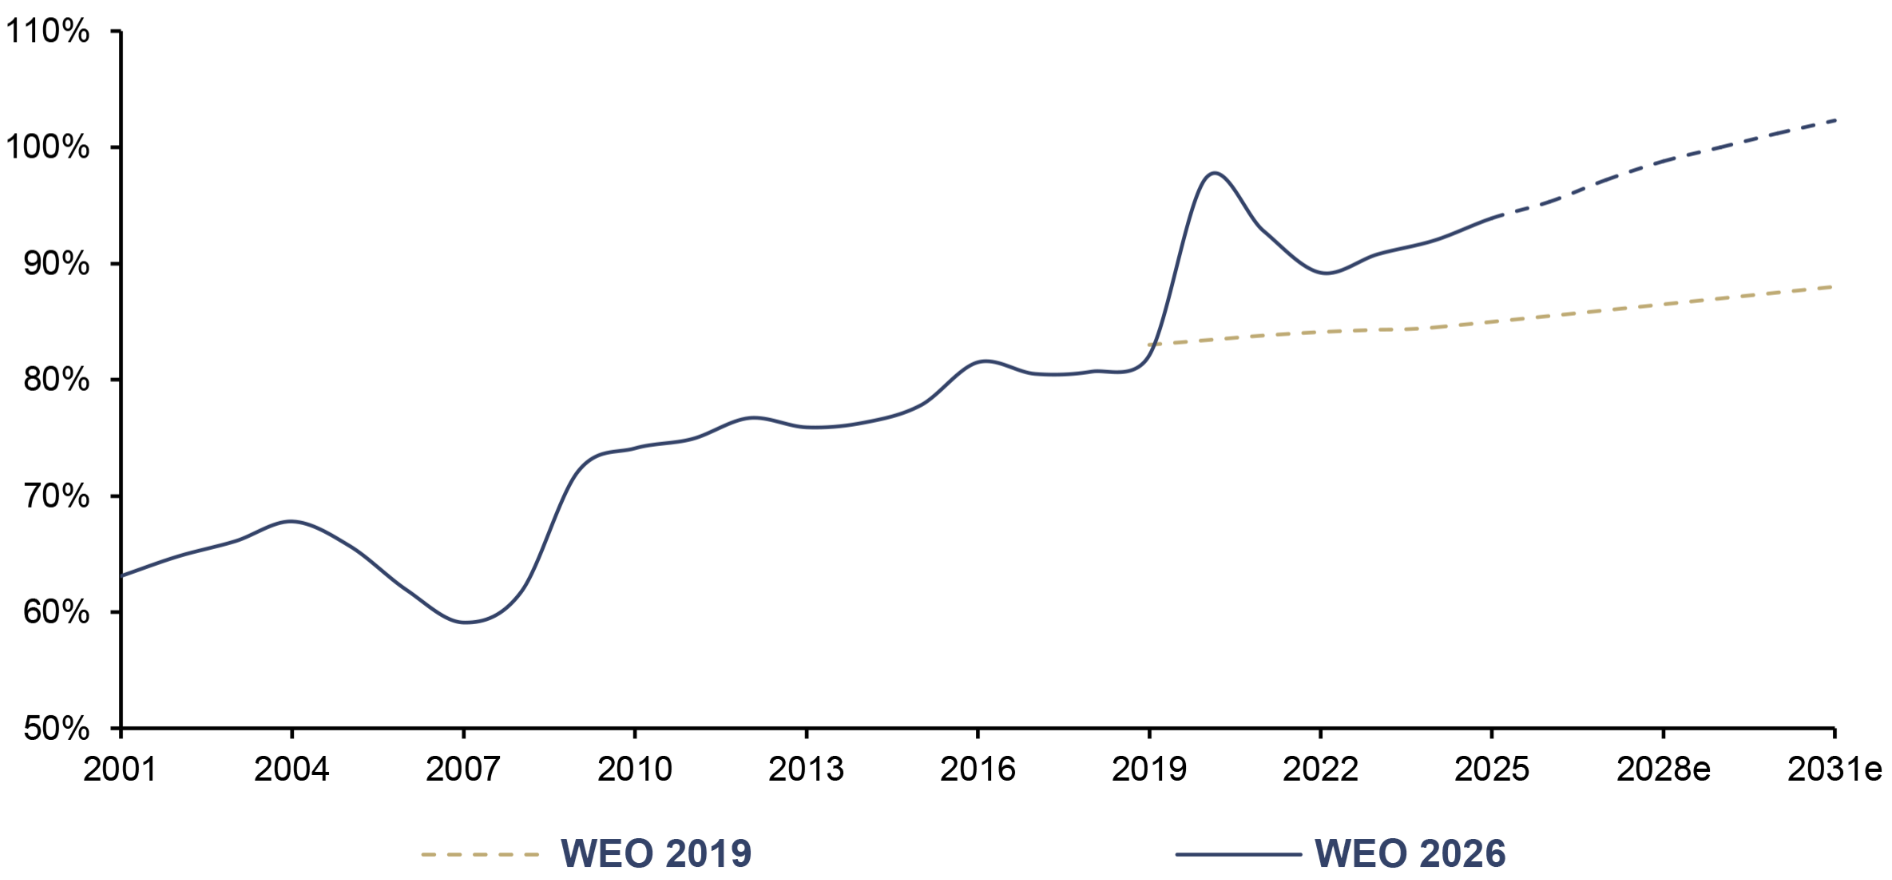
For 2026, the IMF expects a global public debt-to-GDP ratio of 96.8%. In 2007, the year of the first In Gold We Trust report and on the eve of the global financial crisis, it was merely 60.9%. That is an increase of more than 50%. In absolute terms, the trend is naturally even more dramatic. In just two decades, government debt swelled from slightly more than USD 35trn to nearly USD 120trn, an increase of almost 3.5 times. Nominal global GDP grew by slightly more than 110% over the same period, from USD 58.3trn to an estimated USD 123.6trn.
This debt dynamic is largely attributable to the current polycrisis. At the same time, the budget is under pressure from a multitude of developments, each of which, taken individually, already poses a major challenge to public finances: the energy transition, in the EU accompanied by a simultaneous shift away from Russian energy supplies; military rearmament; an aging population; migration flows and the resulting funding needs for integration and border protection; and higher interest rates on government debt.
A striking break in the trend of government debt was the Covid-19 pandemic, with its multitude of economic, political, and social upheavals. Not only was government debt pushed to a new level, but the rate of increase in government debt has also accelerated since then.
Global Public Debt, as a % of GDP, 2000–2031e
Source: IMF, Incrementum AG
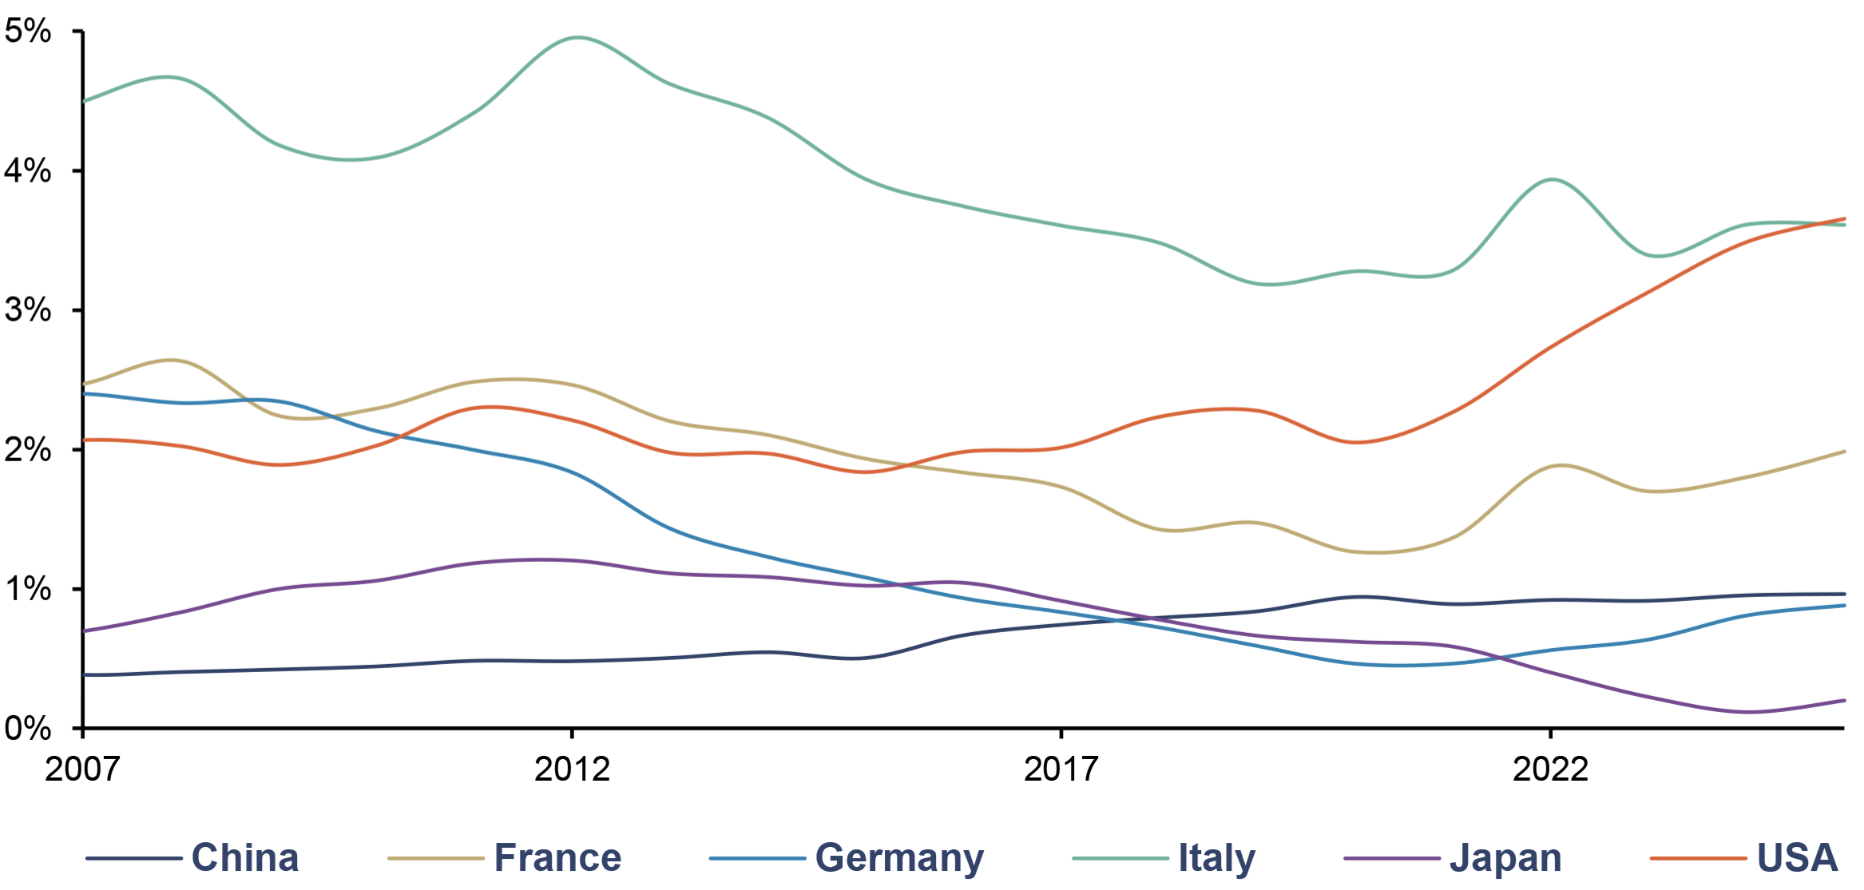
Admittedly, the public debate may attach too much importance to the government debtto-GDP ratio. The study “Why Care about Debt-to-GDP?” rightly points this out. As an alternative to the government debt-to-GDP ratio, the interest-to-GDP ratio is proposed, which reflects the actual ongoing burden of government debt on the national budget. After all, higher interest rates on a lower debt level can place a greater burden on the budget than lower interest rates on a higher debt level.
The following chart tracks the evolution of the interest rate ratio, also starting in 2007. The effects of the ultra-low interest rate policy – which temporarily provided significant relief to governments and ushered in a golden age for finance ministers – are clearly visible, as is the end of that era. In a long-term comparison, the interest rate ratio remains relatively low for many countries, as the average interest rate on government debt does not yet fully reflect the rise in yields over the past few years. As of the end of 2025, the average remaining maturity of marketable US government debt is just under 6 years.
Interest Expenditure, as a % of GDP, 2007–2025
Source: IMF, Incrementum AG
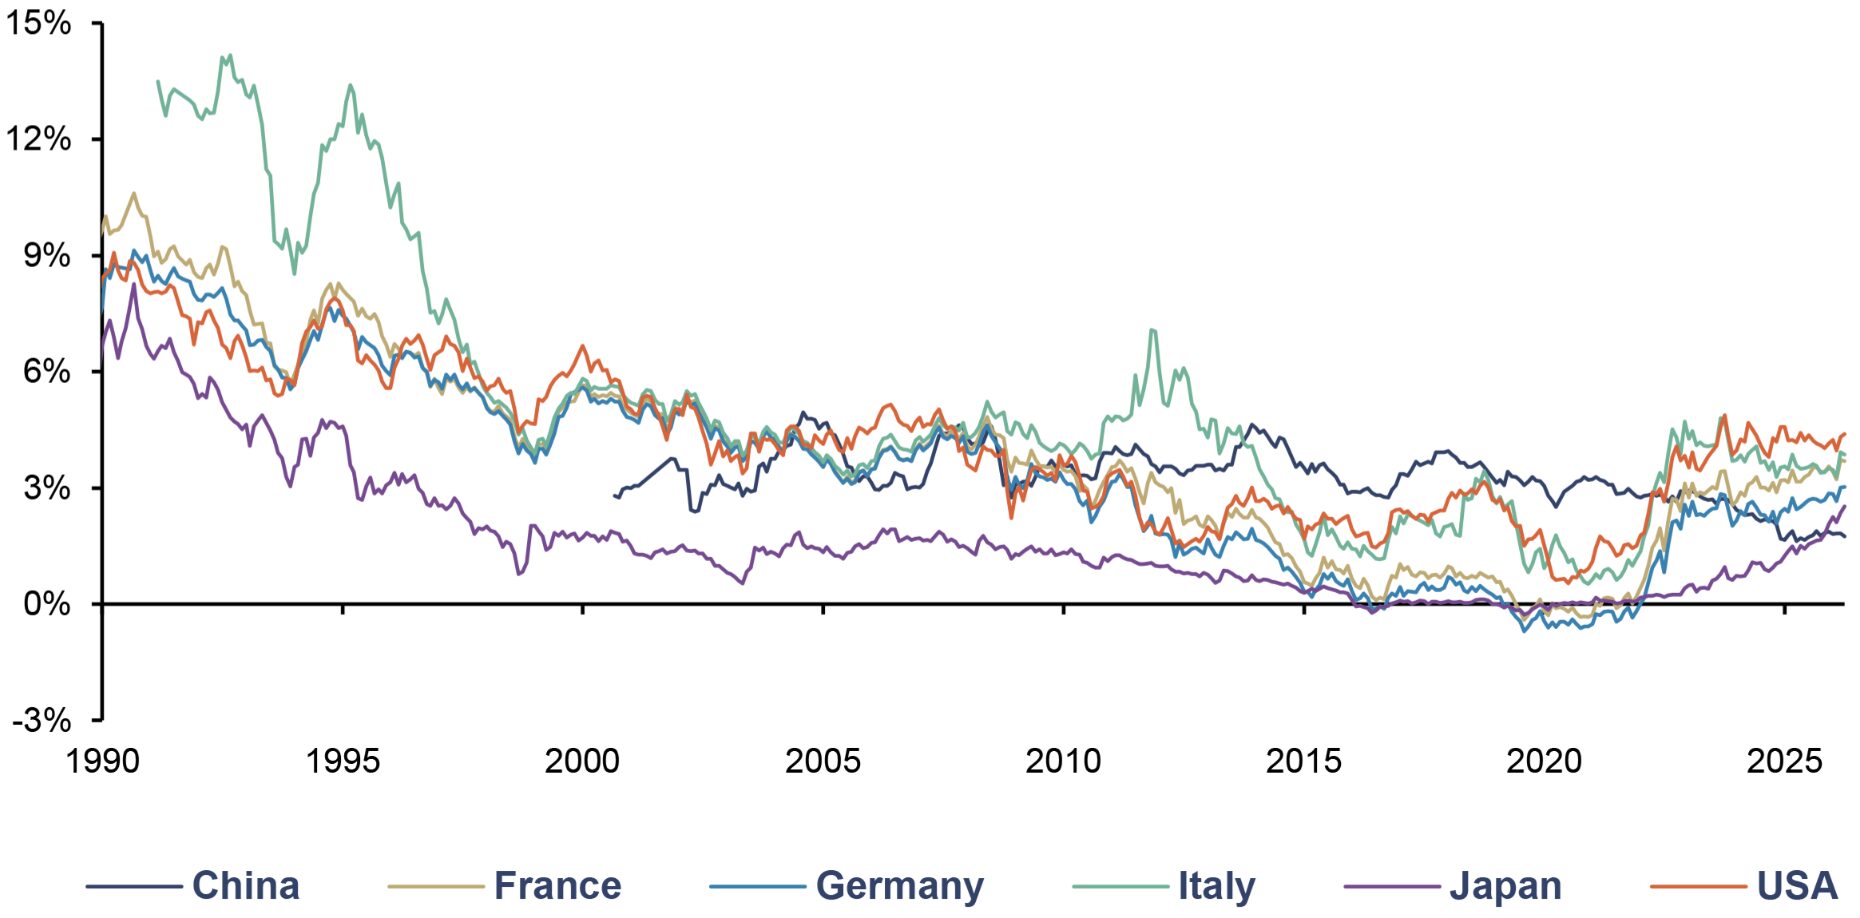
Both indicators – the debt-to-GDP ratio and the interest rate ratio – point to the same conclusion: The notion that leading industrialized nations are immune to debt crises is definitively a thing of the past. This is also signaled by bond yields that are climbing slowly but steadily, even though they remain far below previous peaks in a long-term comparison. In the fall of 2025, French government bonds recorded a positive spread against Italian bonds for the first time, a phase that lasted until mid-January and ended abruptly when French Prime Minister Sébastien Lecornu survived a vote of no confidence and pushed through the 2026 budget using Article 49.3 of the French Constitution, against opposition resistance and without a majority of his own.
10 Year Government Bond Yield, 01/1990–04/2026
Source: LSEG, Incrementum AG
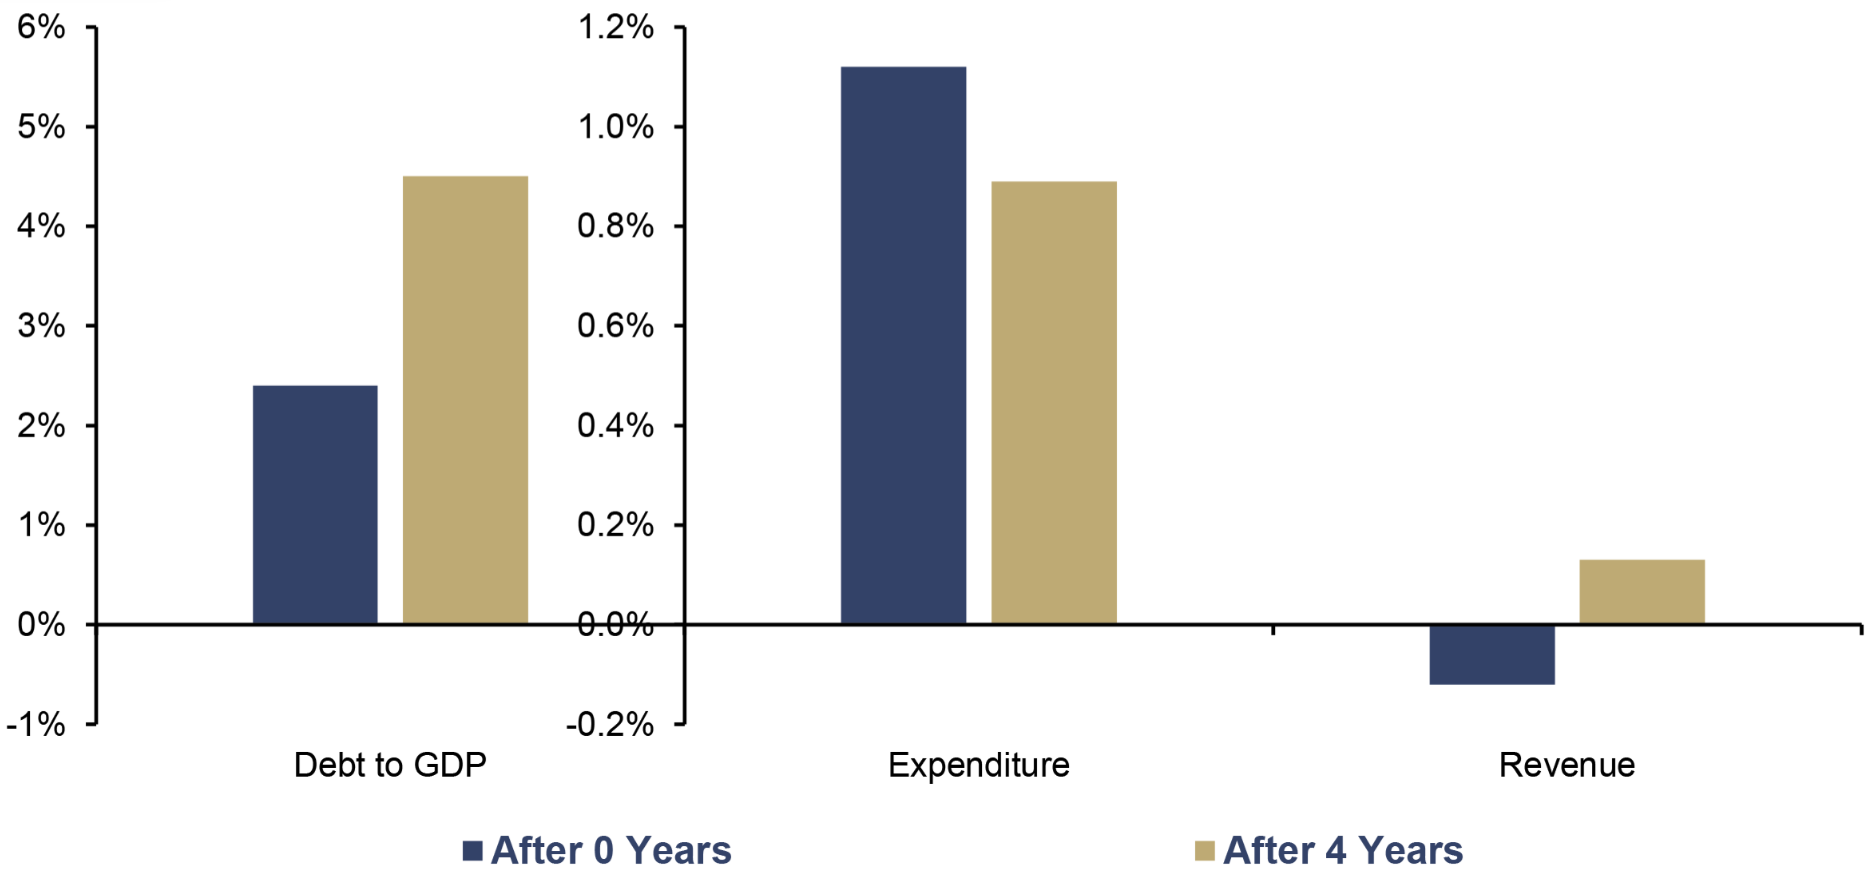
Another factor weighing on public finances is the rise in geopolitical tensions and geopolitical fragmentation. In the In Gold We Trust report 2019, “Gold in the Age of Eroding Trust,” we analyzed the importance of trust for human interaction in general and economic cooperation in particular. Trust is arguably the most underestimated economic resource in everyday life. Where trust among business partners or legal certainty is lacking, significant additional costs arise. Simulation calculations from a study by Fernandez-Villaverde and Song show that an increase in geopolitical fragmentation raises government debt.[1]
Response to a 1 STD Increase in the Geopolitical Fragmentation Index, as a % of GDP
Source: IMF, Incrementum AG
“Guns or Butter?” – “Guns and Butter!”
“Whatever it takes”; with these words, borrowed from Mario Draghi, Chancellor Friedrich Merz underscored just a few days after winning the federal election in March 2025 the seriousness with which he now intended to tackle Germany’s rearmament. During the election campaign, Merz had still vigorously defended the debt brake. A few weeks later, not only was the EUR 500bn “Special Fund for Infrastructure and Climate Neutrality” approved, but it was also decided that defense spending exceeding 1% of GDP would no longer be subject to the national debt brake.
Chancellor Merz faced the well-known problem that increasing defense spending without expanding the budget deficit would inevitably require significant cuts in other areas of spending. Merz thus acted in line with the findings of the study “Guns and Butter: The Fiscal Consequences of Rearmament and War.” Historically, according to the study, which analyzed budget data from 20 industrialized nations for the period 1870–2022, governments in industrialized nations preferred higher budget deficits in the short term – i.e., “guns and butter” – to finance rearmament. In the long term, this resulted in a toxic mix of higher taxes and a public spending ratio that remained elevated.
The authors do not answer the question of why governments prefer the “guns and butter” option over “guns or butter.” Yet the answer is obvious: because choosing the first option can, at least in the short term, create the impression that rearmament and social spending are not in competition with one another. By expanding the budget deficit, voters are led to believe in a “both-and” scenario, thereby securing the loyalty of key voter groups – at least in the short term – even as the “either-or” reality looms relentlessly in the background, eventually manifesting itself, with a slight time lag, in the form of rising inflation.
The calculations of The Bank for International Settlements (BIS), presented by Secretary General Pablo Hernandez de Cos (who has been in office since July 1, 2025) in a lecture titled “Fiscal threats in a changing global financial system,” also show where this “bothand” approach is likely to lead. In the baseline scenario, with primary deficits remaining at the historically high level of 2024, public debt in industrialized nations would rise only slightly to around 110%, while in emerging economies it would rise significantly to just under 100%.
Without fiscal consolidation, population aging alone would cause debt-to-GDP ratios to climb to around 170% (advanced economies) and 160% (emerging economies) by 2050. If additional spending on the energy transition and military buildup amounting to 2% of GDP is factored in, an additional 50 percentage points are added to the figures for both groups of countries.
As recent IMF calculations show, wars also incur significant economic costs. In war-torn countries, economic output falls by about 3% at the outset; within five years, the average decline is around 7%. The economic losses caused by conflicts generally exceed those associated with financial crises or severe natural disasters. The economic consequences remain evident even a decade later.
The idea that government debt can be easily inflated away is a myth
However, it is a widespread and persistent misconception that higher inflation rates can, in and of themselves, reduce government debt. As we highlighted in the chapter “The Status Quo of Debt Dynamics” in the In Gold We Trust report 2022, “Stagflation 2.0,” inflating away government debt is only possible if a wave of inflation suddenly sweeps over a country. Bondholders alone foot the bill if they fail to anticipate a wave of inflation.
The study “Are Government Bonds Safe in Times of War and Pandemic?” confirms this fact. In times of war, as a result of unexpected waves of inflation and financial repression, it is bondholders[2] who must shoulder the lion’s share of a war’s financing costs, with the authors treating the Covid-19 pandemic as a war due to the spending tsunami it triggered. In peacetime, however, government bonds were indeed the safe asset. To put it bluntly: Government bonds are a fair-weather asset.
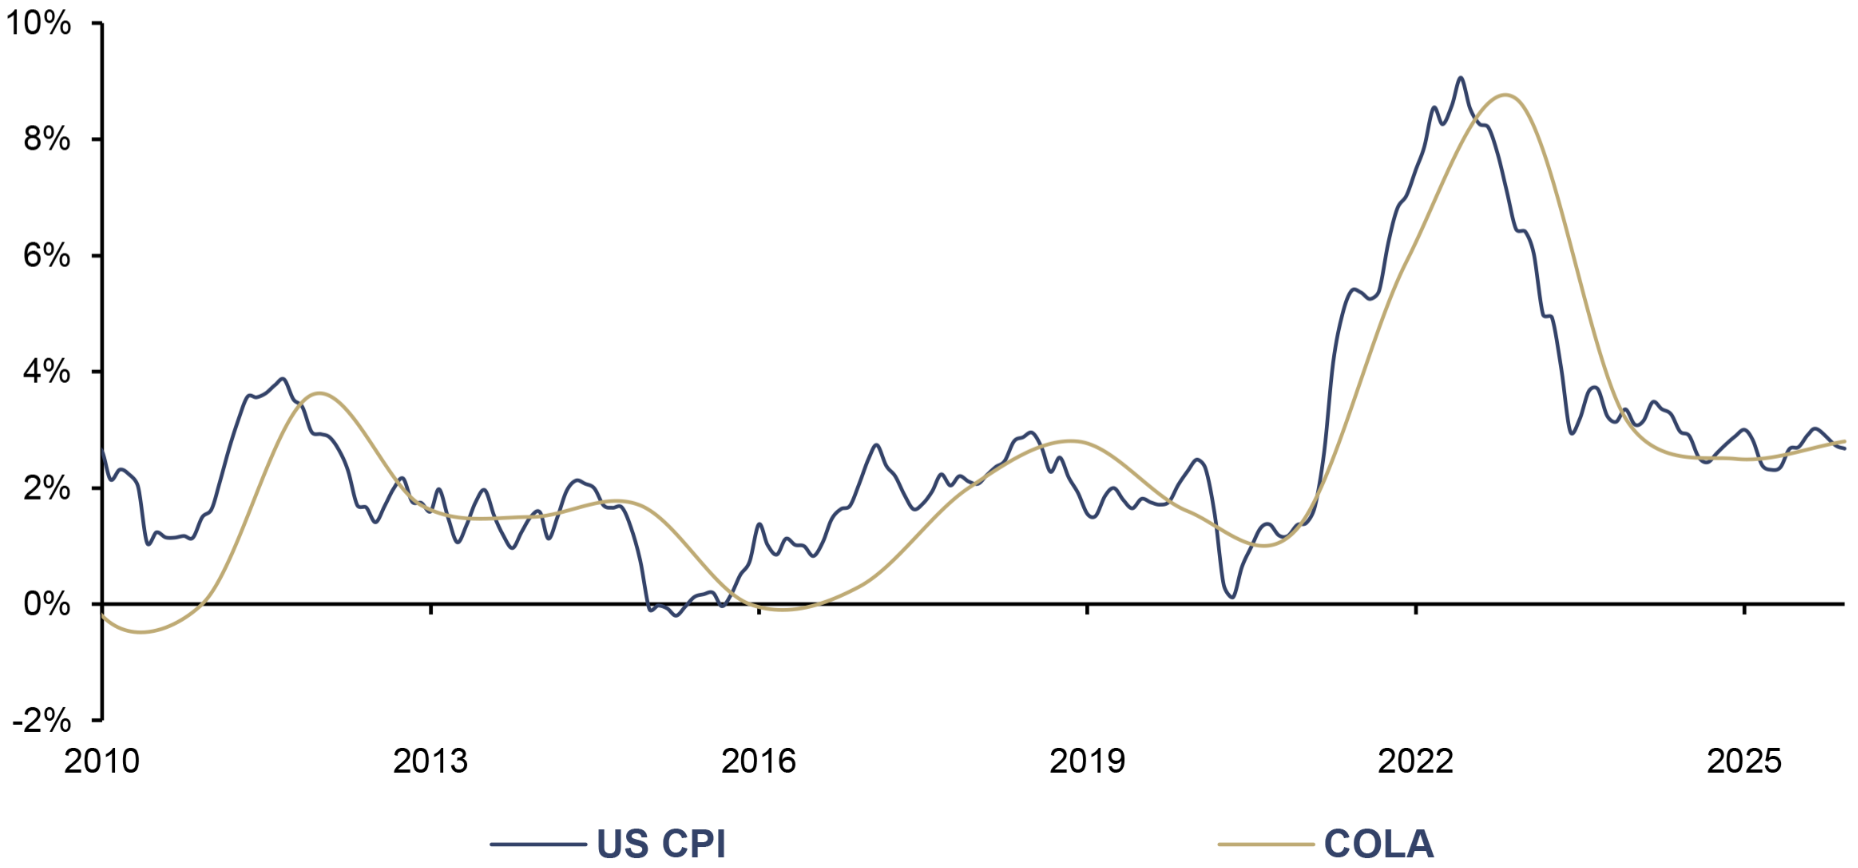
Similarly, transfer recipients only experience a significant loss of purchasing power and provide real relief to the budget if transfer payments are not indexed or are rapidly increased as a result of political pressure. In the US, the automatic adjustment of Social Security expenditures – known by the acronym COLA for “cost-of-living adjustment” – has been enshrined in law since 1975.
However, this automatic mechanism designed to counteract a loss of purchasing power for social benefits has a time lag that weakens its protective effect. The nominal adjustment of social transfers occurs retroactively. Consequently, recipients are not compensated for the loss of purchasing power that occurs until social benefits are raised to the nominally higher level.
US CPI, yoy, and COLA (Cost-Of-Living Adjustments), 01/2010–12/2025
Source: Federal Reserve St. Louis, Social Security Administration, Incrementum AG
The creativity of finance ministers correlates with the precarious state of public finances
Finance ministers are often rather austere figures. Yet at times they fairly burst with creativity – for example, when it comes to inventing new taxes and levies. They also enjoy coming up with the most creative neologisms to conceal or gloss over the poor state of public finances. In Germany, for instance, special budgets have always been called “special funds,” even though they are actually special debts. Particularly ingenious is the phrase revenue-side savings – a term that has been in common use in Austria for many years – which refers to, you guessed it, increases in taxes and fees.
In addition, the rhetorical trick of referring to every government expenditure as an “investment” is gaining traction. Thus, spending on the construction of a new playground becomes an “investment in social cohesion.” While this is not entirely incorrect linguistically – since the finance minister does indeed “clothe” every expenditure in a specific purpose (from the Latin investire for “to clothe”) – it does not correspond to the much narrower economic definition.
Austria has come up with yet another original idea – a statistical trick – to lower the national debt ratio. Finance Minister Markus Marterbauer urged the federal states to invest surplus liquid funds in federal treasury bonds, which are bonds with maturities ranging from one month to 10 years, purchased directly from the Republic of Austria. The simple reason: Government bonds held by other local authorities are consolidated in accordance with ESA 2010, Regulation (EC) No. 479/2009, and the “Manual on Government Deficit and Debt – Implementation of ESA 2010,” thereby reducing the national debt ratio.
In the US, this approach explains the difference between “public debt held by the public” and “total public debt,” or between marketable and nonmarketable US federal debt. The former accounts only for marketable US debt securities and stood at 99.4% at the end of fiscal year 2025. The latter includes nonmarketable US federal debt, specifically that held by the two US Social Security funds. At the end of 2025, this US federal debt was significantly higher at 122.3%.
Equally irrelevant from an economic standpoint is the legal and administrative maneuver of excluding certain expenditures from the calculation of the maximum allowable new debt. This allows EU member states, under the so-called “national escape clause” (Regulation (EU) 2024/1263, Art. 26) to spend up to 1.5% of GDP on additional defense expenditures for the years 2025–2028, without this amount being counted toward compliance with the requirements of the Stability and Growth Pact (“Maastricht criteria”). Economically, this distinction is irrelevant, for debt remains debt in economic terms, even if politicians, bureaucrats, and lawyers attach a different legal or political label to certain expenditures.
Deep Dive US
Trump’s budget miracle has not materialized (yet?)
The boldest optimists expected (short-term) miracles from Donald Trump’s second presidency and the now-defunct Department of Government Efficiency (DOGE), which was originally established with significant input from Elon Musk. We did not share this optimism in our analysis last year and referred to the “DOGE illusion”. Nevertheless, the number of federal employees has already been reduced by more than 10%.
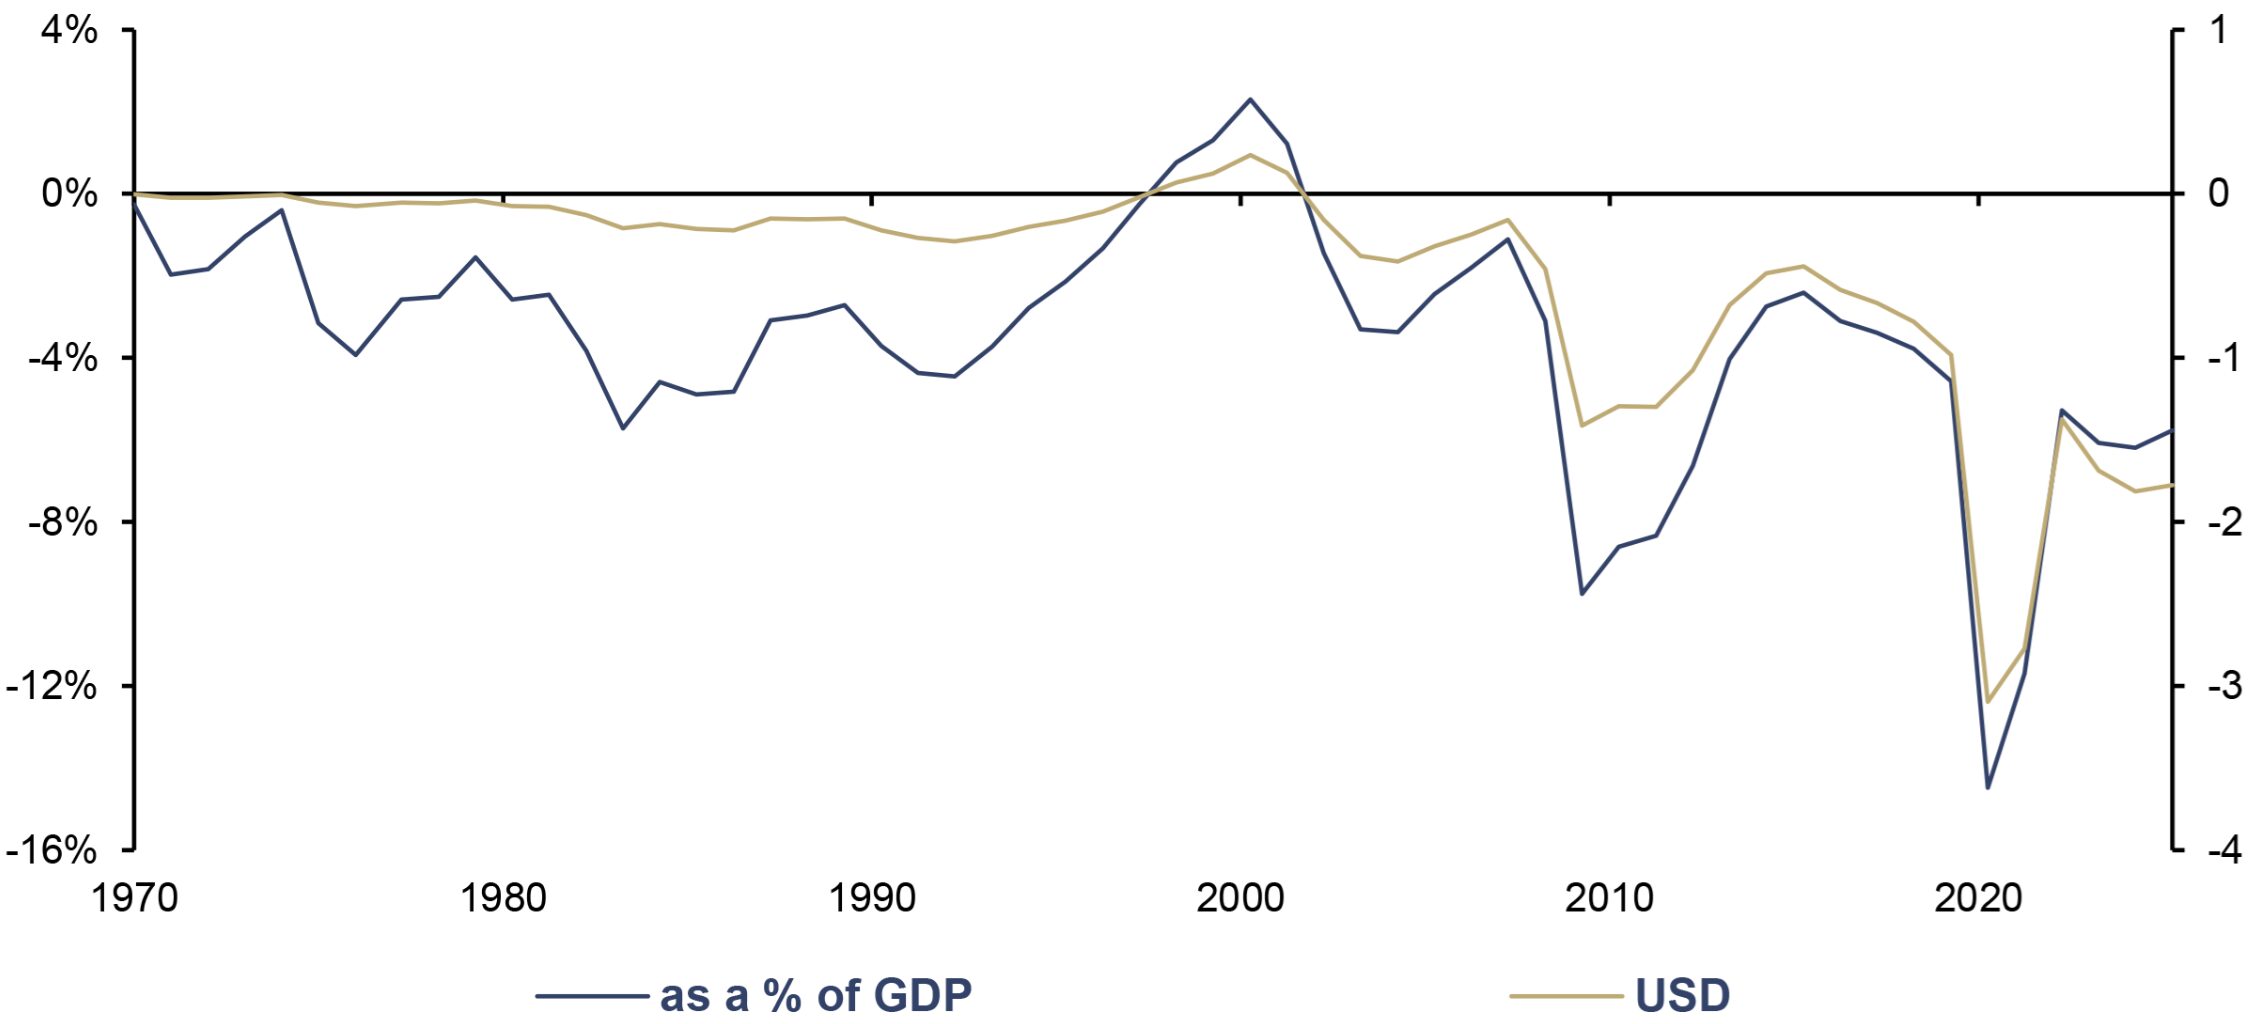
The final accounts for the first fiscal year of Donald Trump’s second term are now available. The deficit fell slightly again to USD 1.8trn, down from USD 1.9trn in fiscal year 2024. Fiscal year 2026, which runs through the end of September, is also expected to end with a deficit of less than USD 2trn. Given the surprisingly robust economic development in the US the budget deficit as a percentage of GDP is likely to continue to decline, after 6.6% in FY 2024 and 5.8% in FY 2025. Yet, the deficit is still miles away from the long-term average of 3.8% for the years 1975–2025. Last year’s deficit of 5.8% corresponds almost exactly to the average for the IGWT era 2007–2026.
US Budget Deficit, as a % of GDP (lhs), and in USD trn (rhs), 1970–2025
Source: Federal Reserve St. Louis, Incrementum AG
In the fall of 2024, the current and then-designated Treasury Secretary Scott Bessent had presented the 3-3-3 Plan. As economic policy goals of the Trump administration to revitalize the US economy, the plan aimed to raise real economic growth to 3%, reduce the deficit to 3%, and increase oil production by 3 million barrels per day. So far, the Trump administration has only come a small step closer to this highly ambitious deficit target.
In the first half of FY 2026 (October 2025–March 2026), the budget deficit fell by just over 10% compared with the same period last year. However, the deficit of USD 1.2trn remains the third-worst start to a fiscal year on record. As a share of GDP, the deficit for these six months is likely to have fallen from approximately 8.7% in the previous fiscal year to below 8.0% due to nominal economic growth.
Customs revenue provided some relief. In the first six months of the fiscal year, it rose by 283% yoy to USD 167bn. The Supreme Court’s decision on February 20 declared certain tariffs unconstitutional and ordered the payback of up to USD 182bn (plus interest). In response, Donald Trump not only announced new special tariffs but also imposed them immediately. At 10%, they are lower than the originally announced 15%.
Consequently, it remains unclear for the current fiscal year how high tariff revenues will actually be in the end. In the first half of FY 2026, they accounted for 6.7% of total revenues, compared to 1.8% in the previous year.
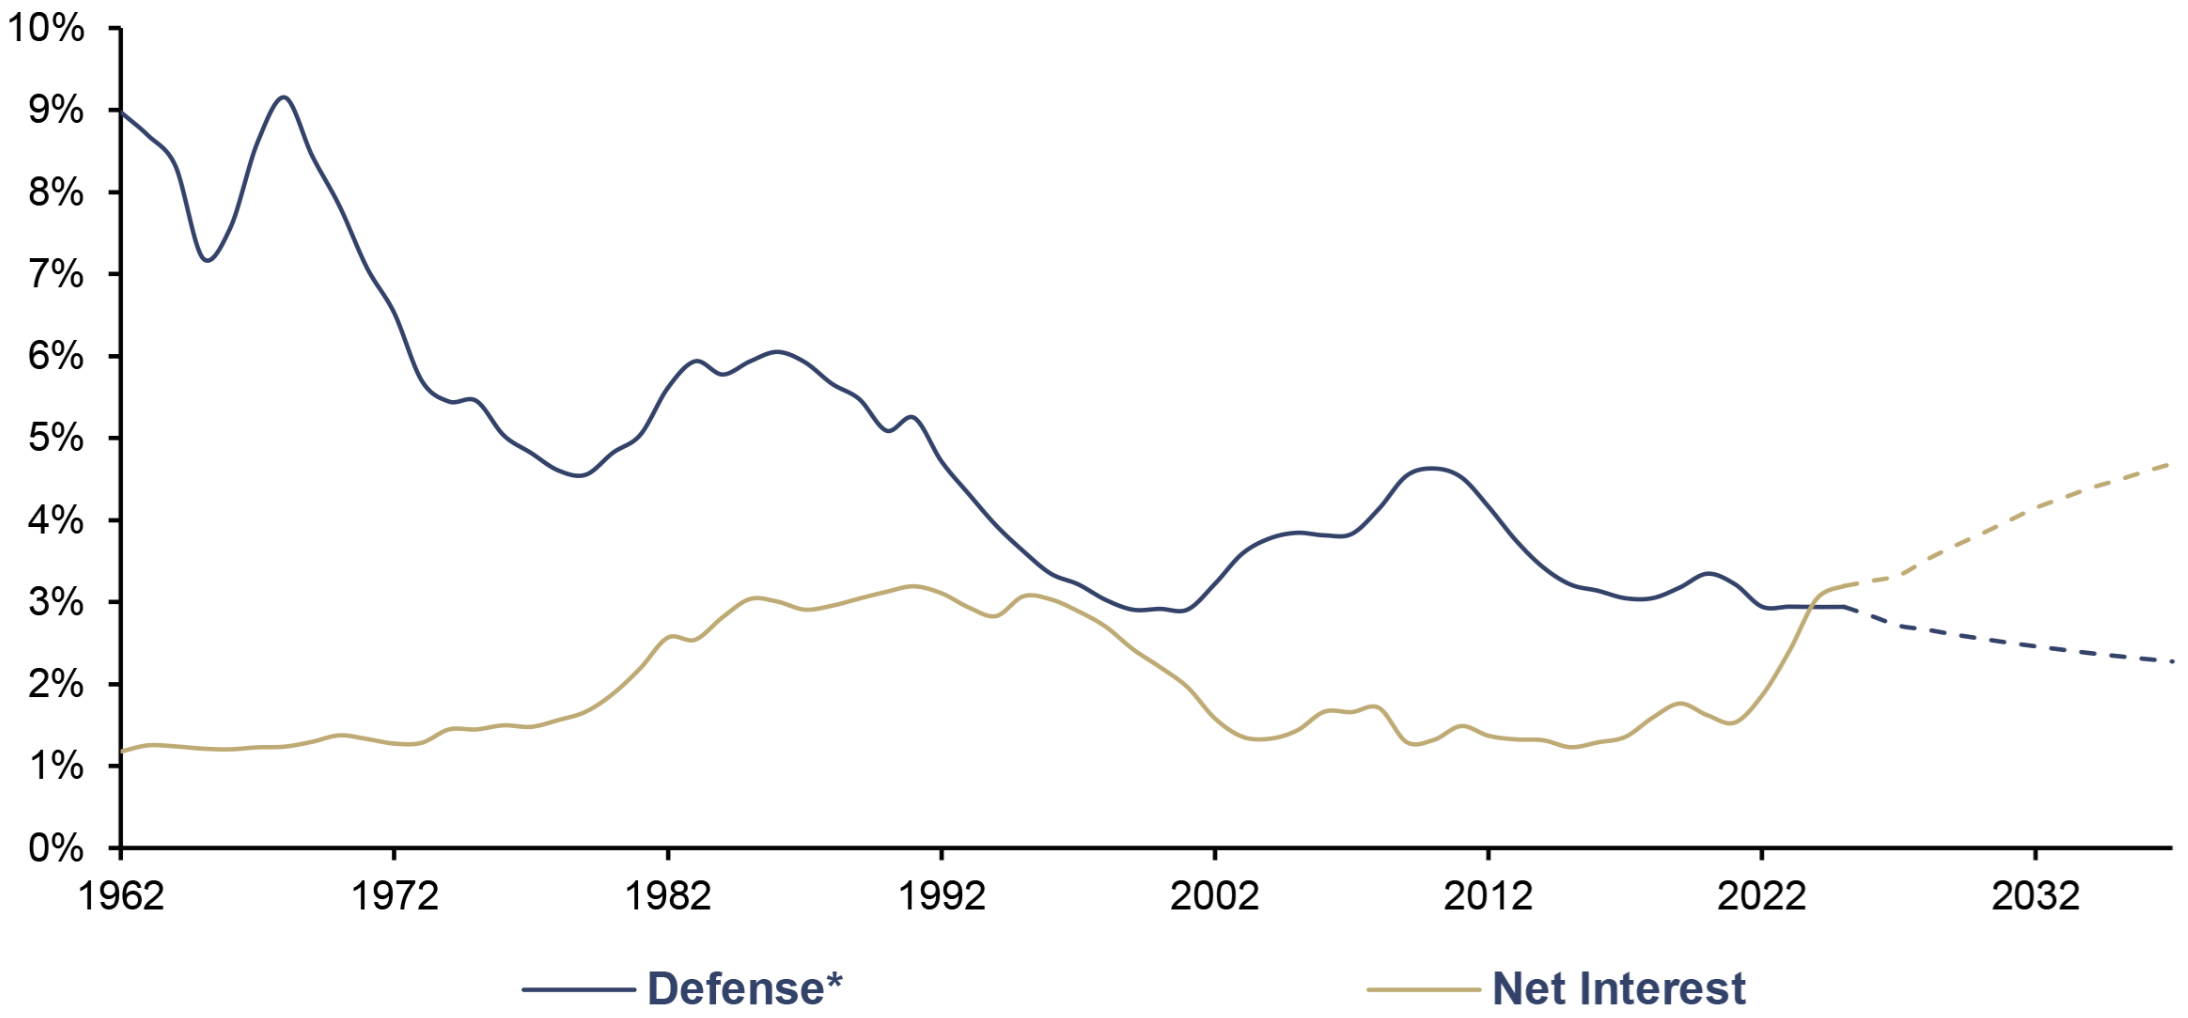
Both in the In Gold We Trust report 2024 and the In Gold We Trust report 2025, we have already explained that the US is now in breach of what is known as Ferguson’s Law.[3] This principle, named after the British historian Niall Ferguson, states that the hegemon risks losing its dominant position as soon as interest payments exceed defense spending. This has been the case in the US since FY2024. Trump’s repeated announcement of an increase in military spending by well over 50% to USD 1.5trn would be an attempt to avoid falling prey to Ferguson’s Law, not by balancing the budget but by increasing military spending. There are considerable doubts as to whether this strategy can succeed in the medium term, let alone the long term.
US Government Spending by Category, as a % of GDP, 1962–2056e
Source: CBO, Incrementum AG,
*Defense spending for 2026–2056 = 48% of discretionary spending (average of 2014–2024)
The announcement of a dividend of “at least” USD 2,000 per resident from Trump’s tariffs, excluding high-income earners, would put additional strain on the federal budget. This supposed dividend has been parried by repeated calls to repeal the tariffs before the midterm elections in November.
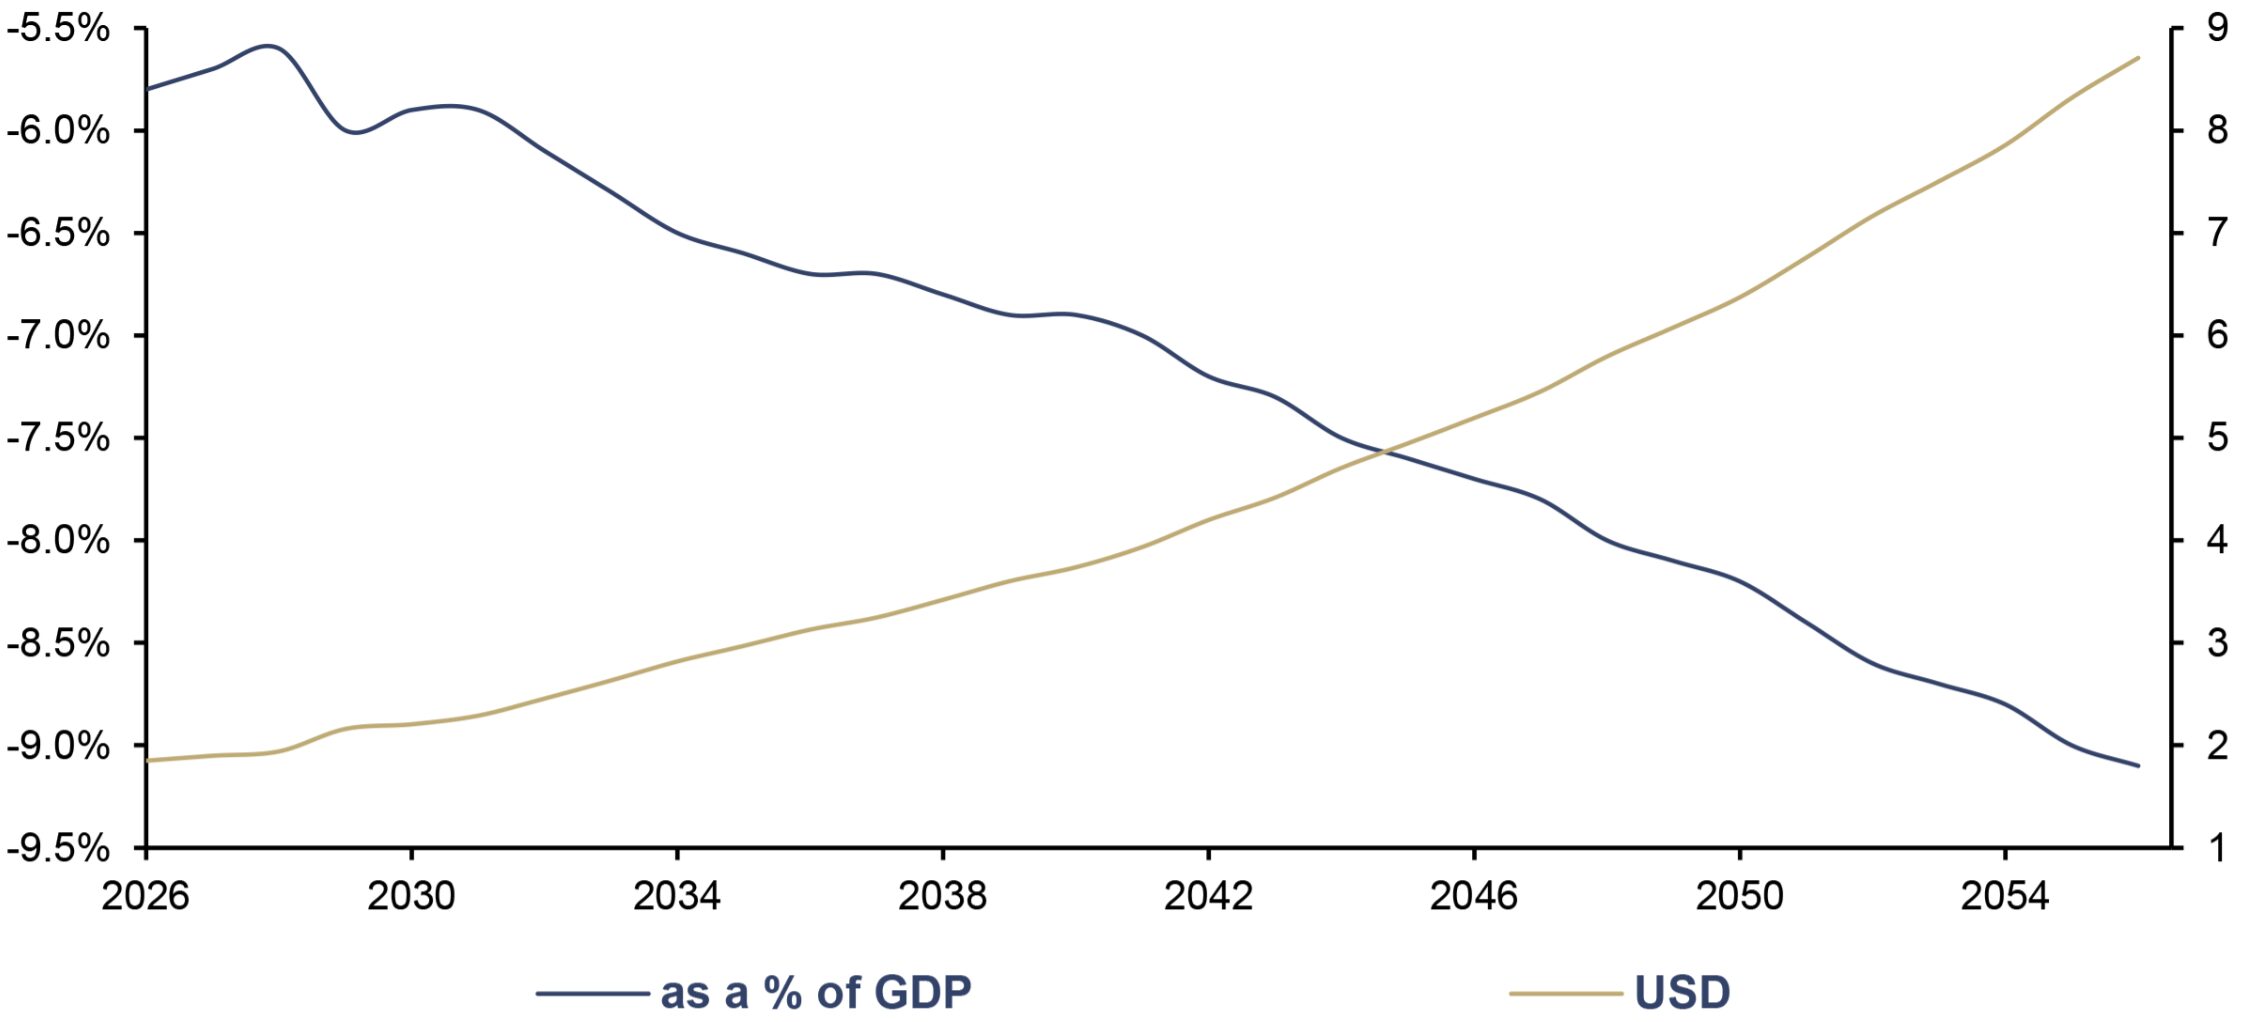
And the US budget outlook for the next 20 years is by no means rosy. The saying “Predictions are difficult, especially when they concern the future” (Niels Bohr) is naturally all the more true the longer the forecast period. This is even more true for areas where politics calls the shots; after all, legal regulations can be changed at virtually any time. Nevertheless, long-term calculations have their merits. They outline in broad strokes where the path would lead based on the current legal framework under certain assumptions, such as for real GDP growth, population trends, etc.
US Budget Deficit, as a % of GDP (lhs), and in USD trn (rhs), 2026e–2056e
Source: CBO, Incrementum AG
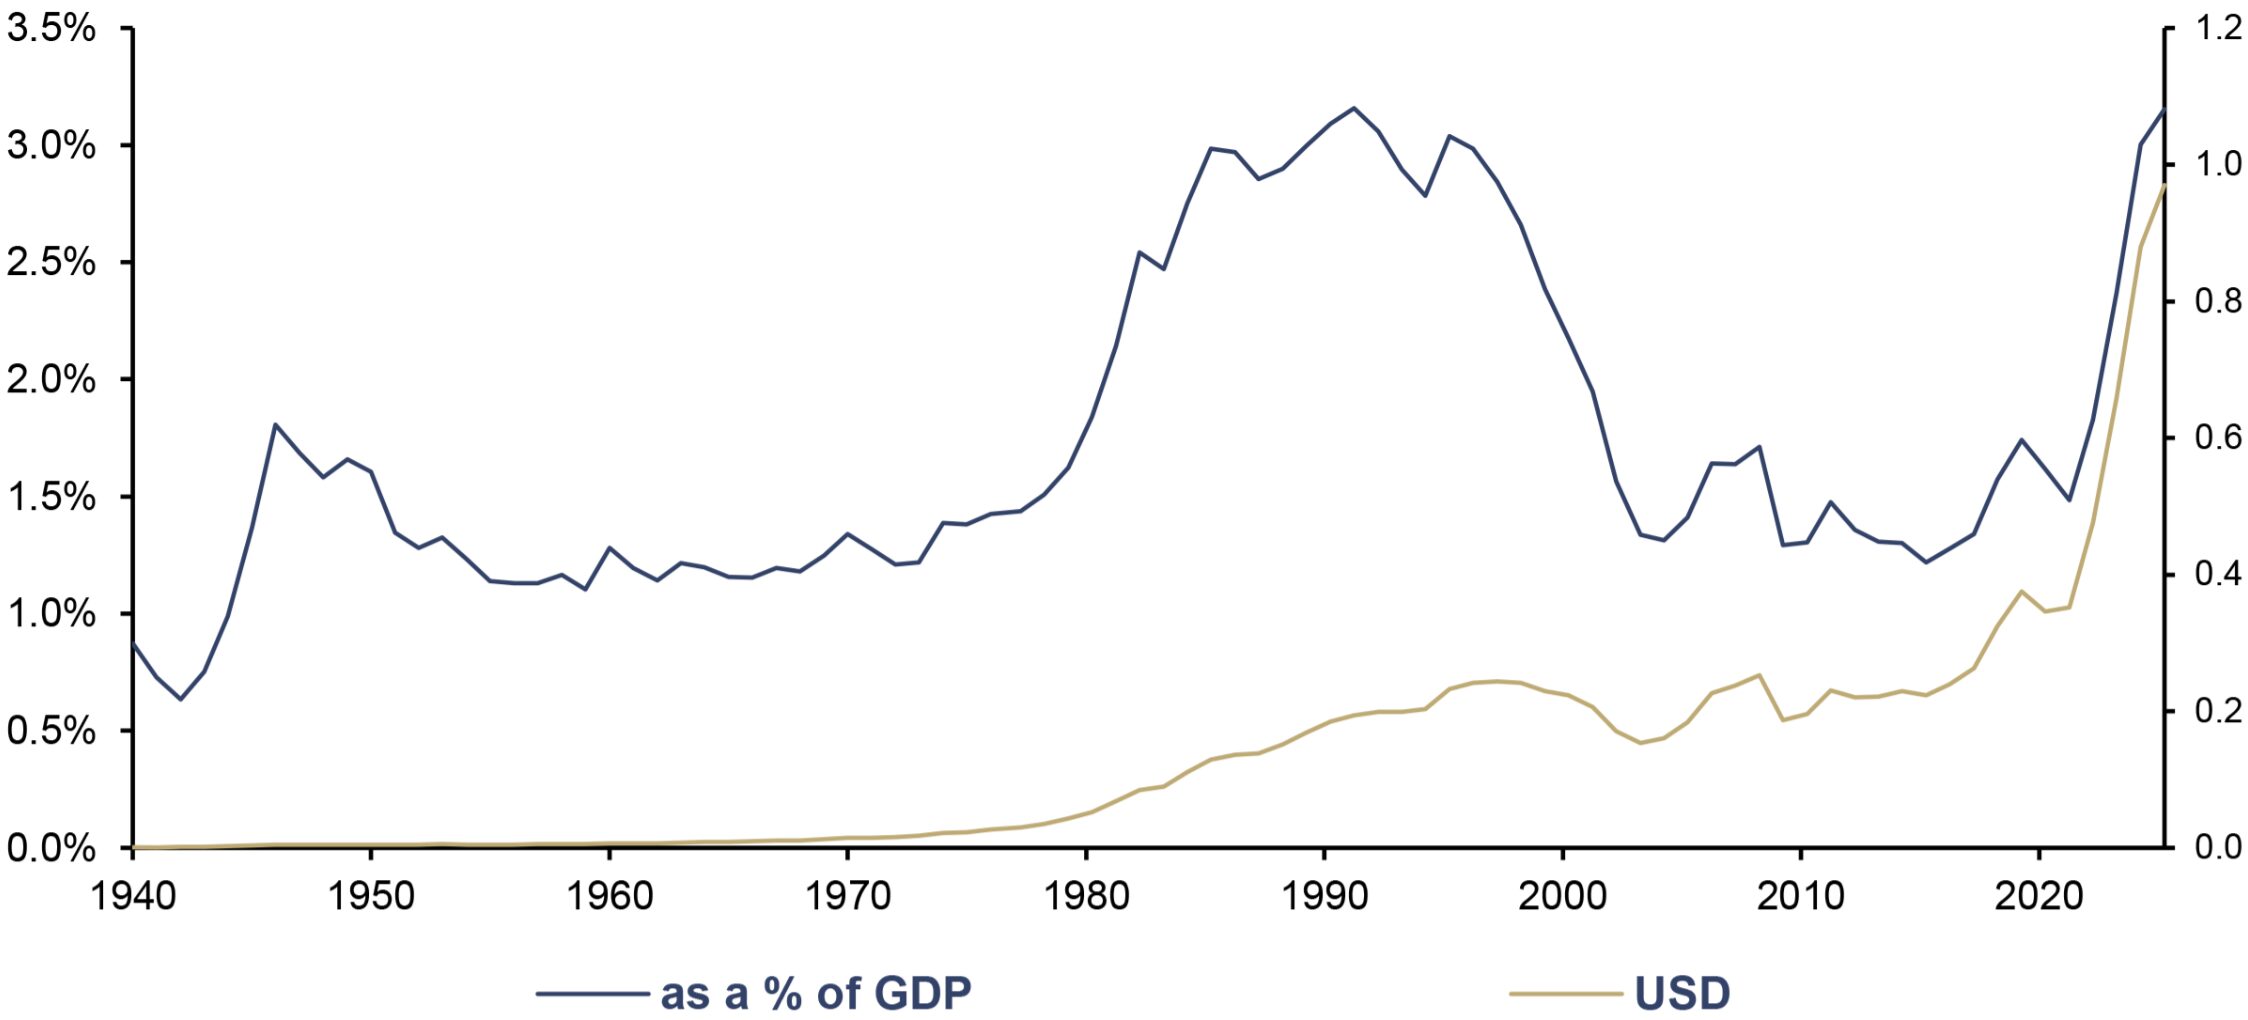
In absolute terms, nominal interest payments are already on track to double to USD 2trn per year by 2034. In the more meaningful relative analysis, an increase of just under 50% is projected by 2046 – from the current 3.2% of GDP to 4.7% in 20 years.
US Interest Expenditure, as a % of GDP (lhs), and in USD trn (rhs), 1940–2025
Source: Federal Reserve St. Louis, Incrementum AG
The clock is ticking: only 7 years left until the US Social Security fund (OASI) is depleted
However, another significant fiscal event falls within this 20-year period. According to current projections from the “2025 OASDI Trustees Report,” one of the two US Social Security trust funds (OA SDI), the “Federal Old-Age and Survivors Insurance Trust Fund” (OASI), will be depleted as early as 2033. As of the end of 2024, it still held assets of USD 2.5trn. Starting in 2033, the benefit level currently mandated by law would therefore have to be reduced to 77%. This benefit level could be covered by current revenues. Alternatively, the Social Security contribution rate of 10.6% payable for OASI would have to be significantly increased.
The situation looks much better for the second, significantly smaller fund, the “Federal Disability Insurance Trust Fund” (DI). Under the medium-range projection, its current assets of USD 183.2bn are expected to grow to USD 703.8bn by the end of the projection period in 2034.
The US debt situation is even more alarming when considering the calculations in the US Treasury Department’s Statement of Long-Term Fiscal Projections. According to these calculations, unfunded Social Security liabilities now total USD 88.4trn over a 75year period. In 2021, this figure was only USD 71.0trn. If these obligations are added to the official US federal debt of USD 47.8trn, the federal government’s total liabilities now exceed USD 136.2trn – roughly five times the annual GDP.
The US total government debt of nearly USD 50trn may come as a surprise. Most reports currently cite US debt at just over USD 39trn. However, this figure includes only federal debt. In international comparisons, it is standard practice to cite total government debt – that is, the debt of all levels of government (federal, state, local, and social security). In this respect, the public debt of the US is underestimated.
Based on the latest available figures as of the end of 2023, the public debt of the states and local governments amounts to USD 6.1trn. This would bring the total US debt as of the end of 2023 to approximately USD 40trn, or 148% of GDP. US Treasury bonds held by the US Social Security funds (OASDI) are included in this figure. In the meantime, federal debt alone has grown by more than an additional USD 5trn, or just under 3 percentage points. The US debt level is therefore likely already over 150%. This puts the US well ahead of Italy, whose national debt stands at around 137%.
Under Kevin Warsh, the new Chair of the Federal Reserve, will the Fed’s balance sheet become even more interest-ratesensitive?
The appointment of the new Federal Reserve Chair is, in and of itself, a topic for the chapter “Status Quo of Inflation Dynamics.” There, we will delve deeper into Kevin Warsh’s views relevant to monetary policy. However, the selection of Warsh certainly also has implications for debt trends, provided that the new chair – who has only been in office for a few days – can actually assert his views.
Warsh considers the Federal Reserve’s balance sheet total to be significantly too high and wants to reduce it further. From its all-time high in April 2022 of just under
USD 9trn, the balance sheet total was reduced by USD 2.5trn – or nearly 30% – by early December 2025. Since then, it has been on a slight upward trend again. The Federal Reserve had announced that it would purchase USD 40bn in T-bills monthly through its Reserve Management Purchases (RMP) program until Tax Day on April 15. From then on, the pace of purchases should be significantly reduced.
Kevin Warsh is an outspoken opponent of quantitative easing (QE), unless QE is used as an emergency measure. When another round of QE was decided in November 2010 under then-Chairman Ben Bernanke, Warsh resigned in protest at the end of March 2011 from the position he had assumed at the end of February 2006 following his nomination by President George W. Bush, even though he had originally approved QE2. In 2014, years after his departure, he characterized QE – unless used in times of emergency – as a “reverse Robin Hood” that increases social inequality by widening the wealth gap.
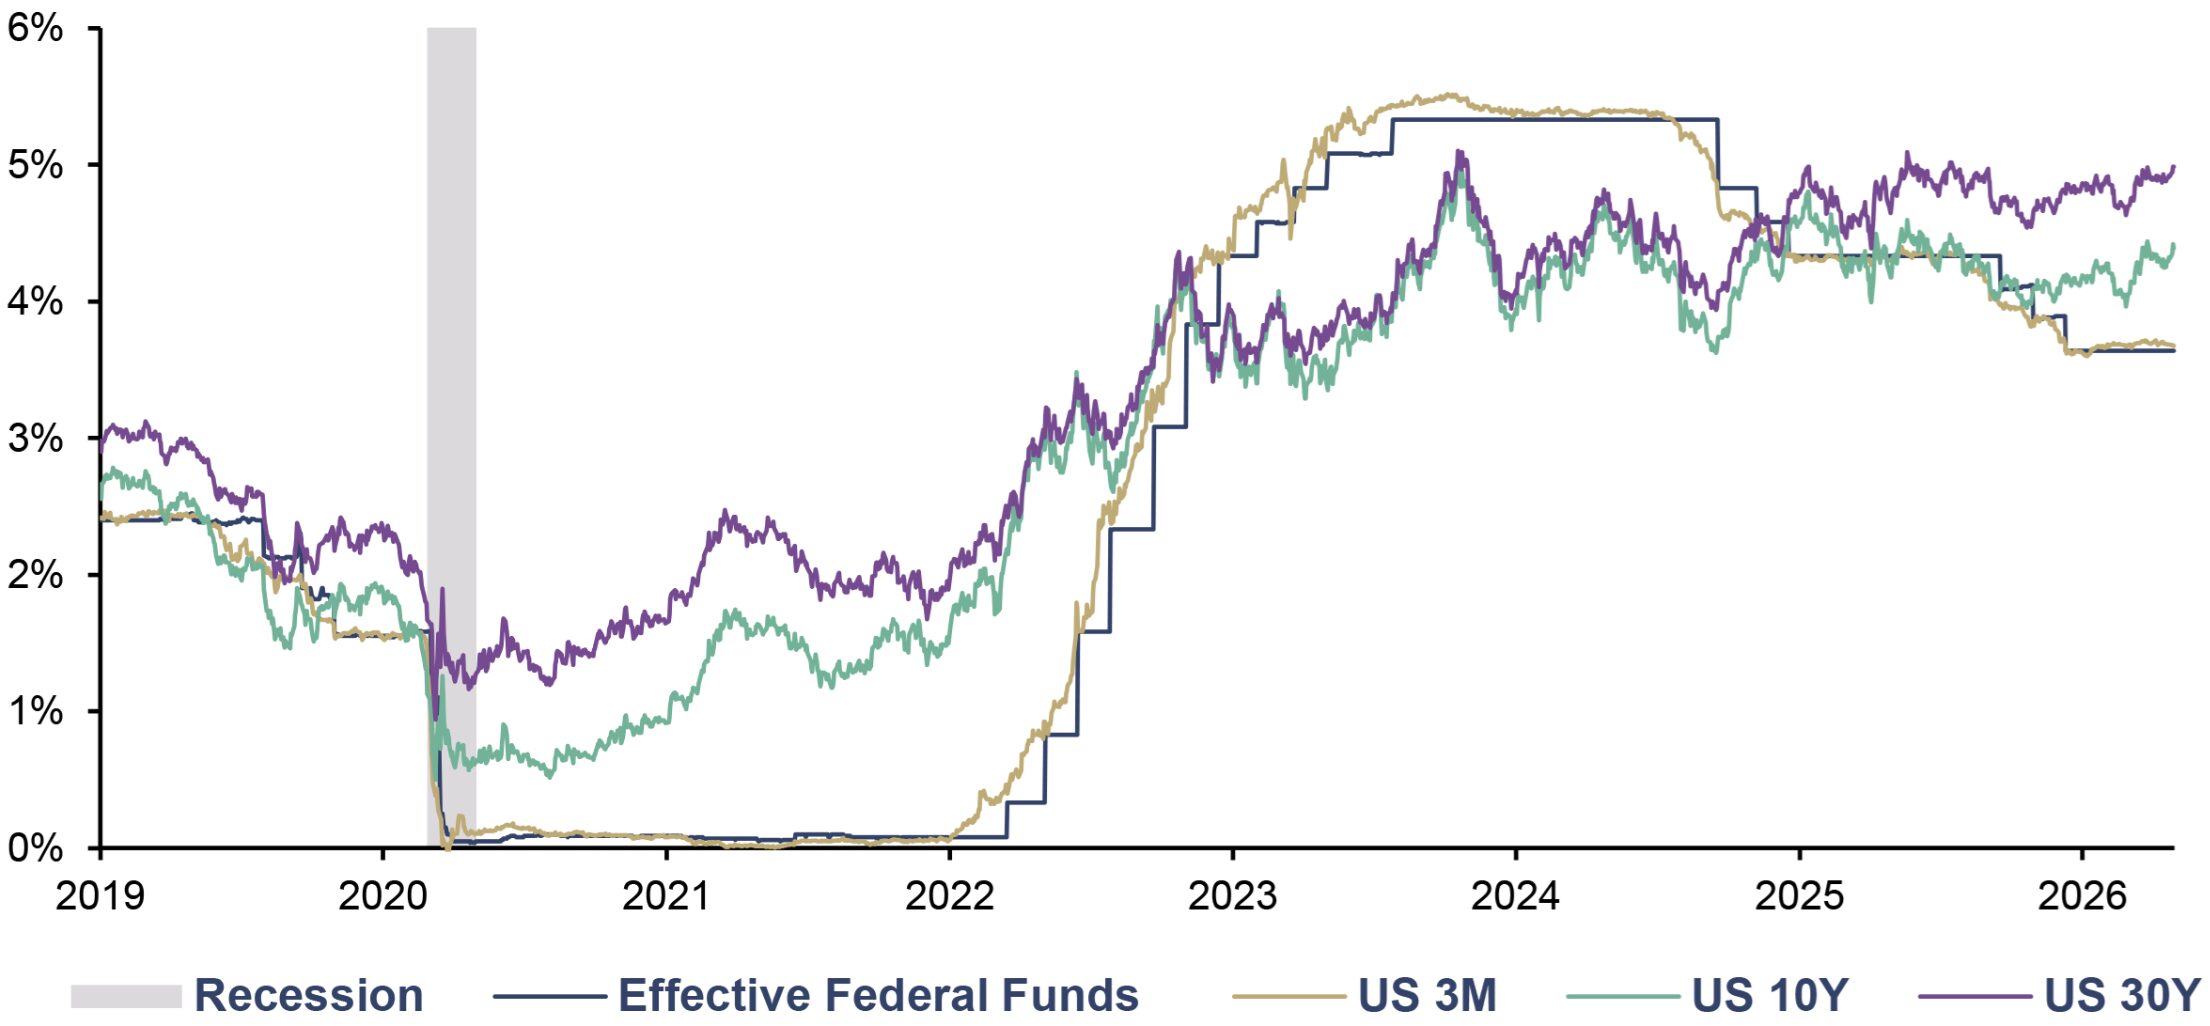
Warsh’s dual strategy – lower key interest rates and balance sheet reduction – would, as a result of falling demand for US Treasury bonds, make financing US government debt more expensive at the long end but cheaper at the short end. This would result in greater interest rate sensitivity of US debt, which, it is hoped, would lead to a reduction in financing costs.
Effective Federal Funds Rate and US Government Bond Yields, 01/2019–04/2026
Source: LSEG, Incrementum AG
At the same time, Warsh is banking on a productivity boom as a result of the hoped-for AI revolution. The productivity gains are expected to spur economic growth and thereby improve the US federal finances through higher tax revenues and lower social spending. The US federal budget is also expected to be relieved by the detection of fraud involving federal funds, thanks to the use of AI and software from Palantir. The resulting lower federal deficit is then expected to ease pressure on the long end of the yield curve as well – at least that is the plan.
Deep Dive Euro Area
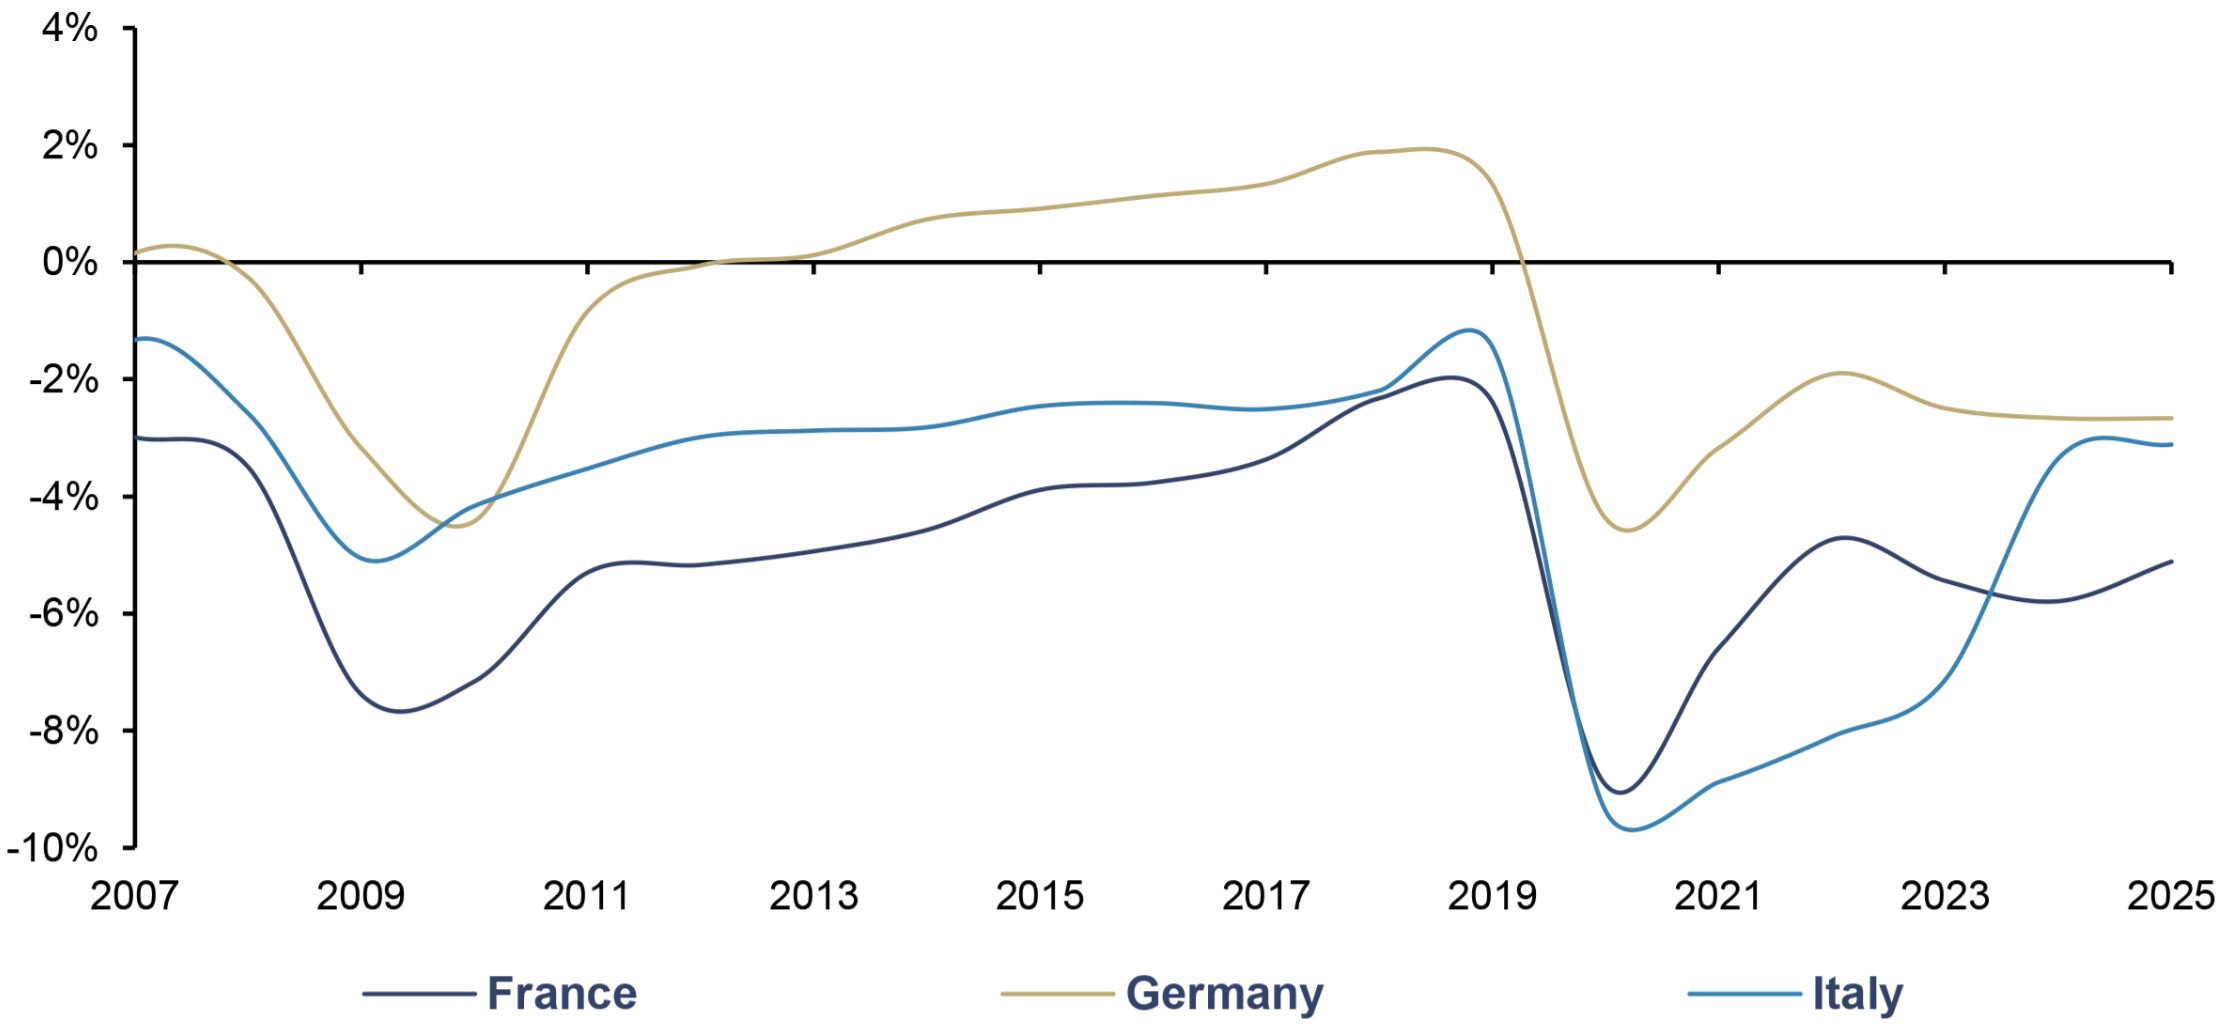
As clearly highlighted in the In Gold We Trust report 2025 “The Big Long,” Germany, under Chancellor Merz, has made a remarkable about-face, moving away from its role as a fiscal model. This shift is now slowly becoming apparent in traditional economic indicators as well.
Budget Balance, as a % of GDP, 2007–2025
Source: IMF, Incrementum AG
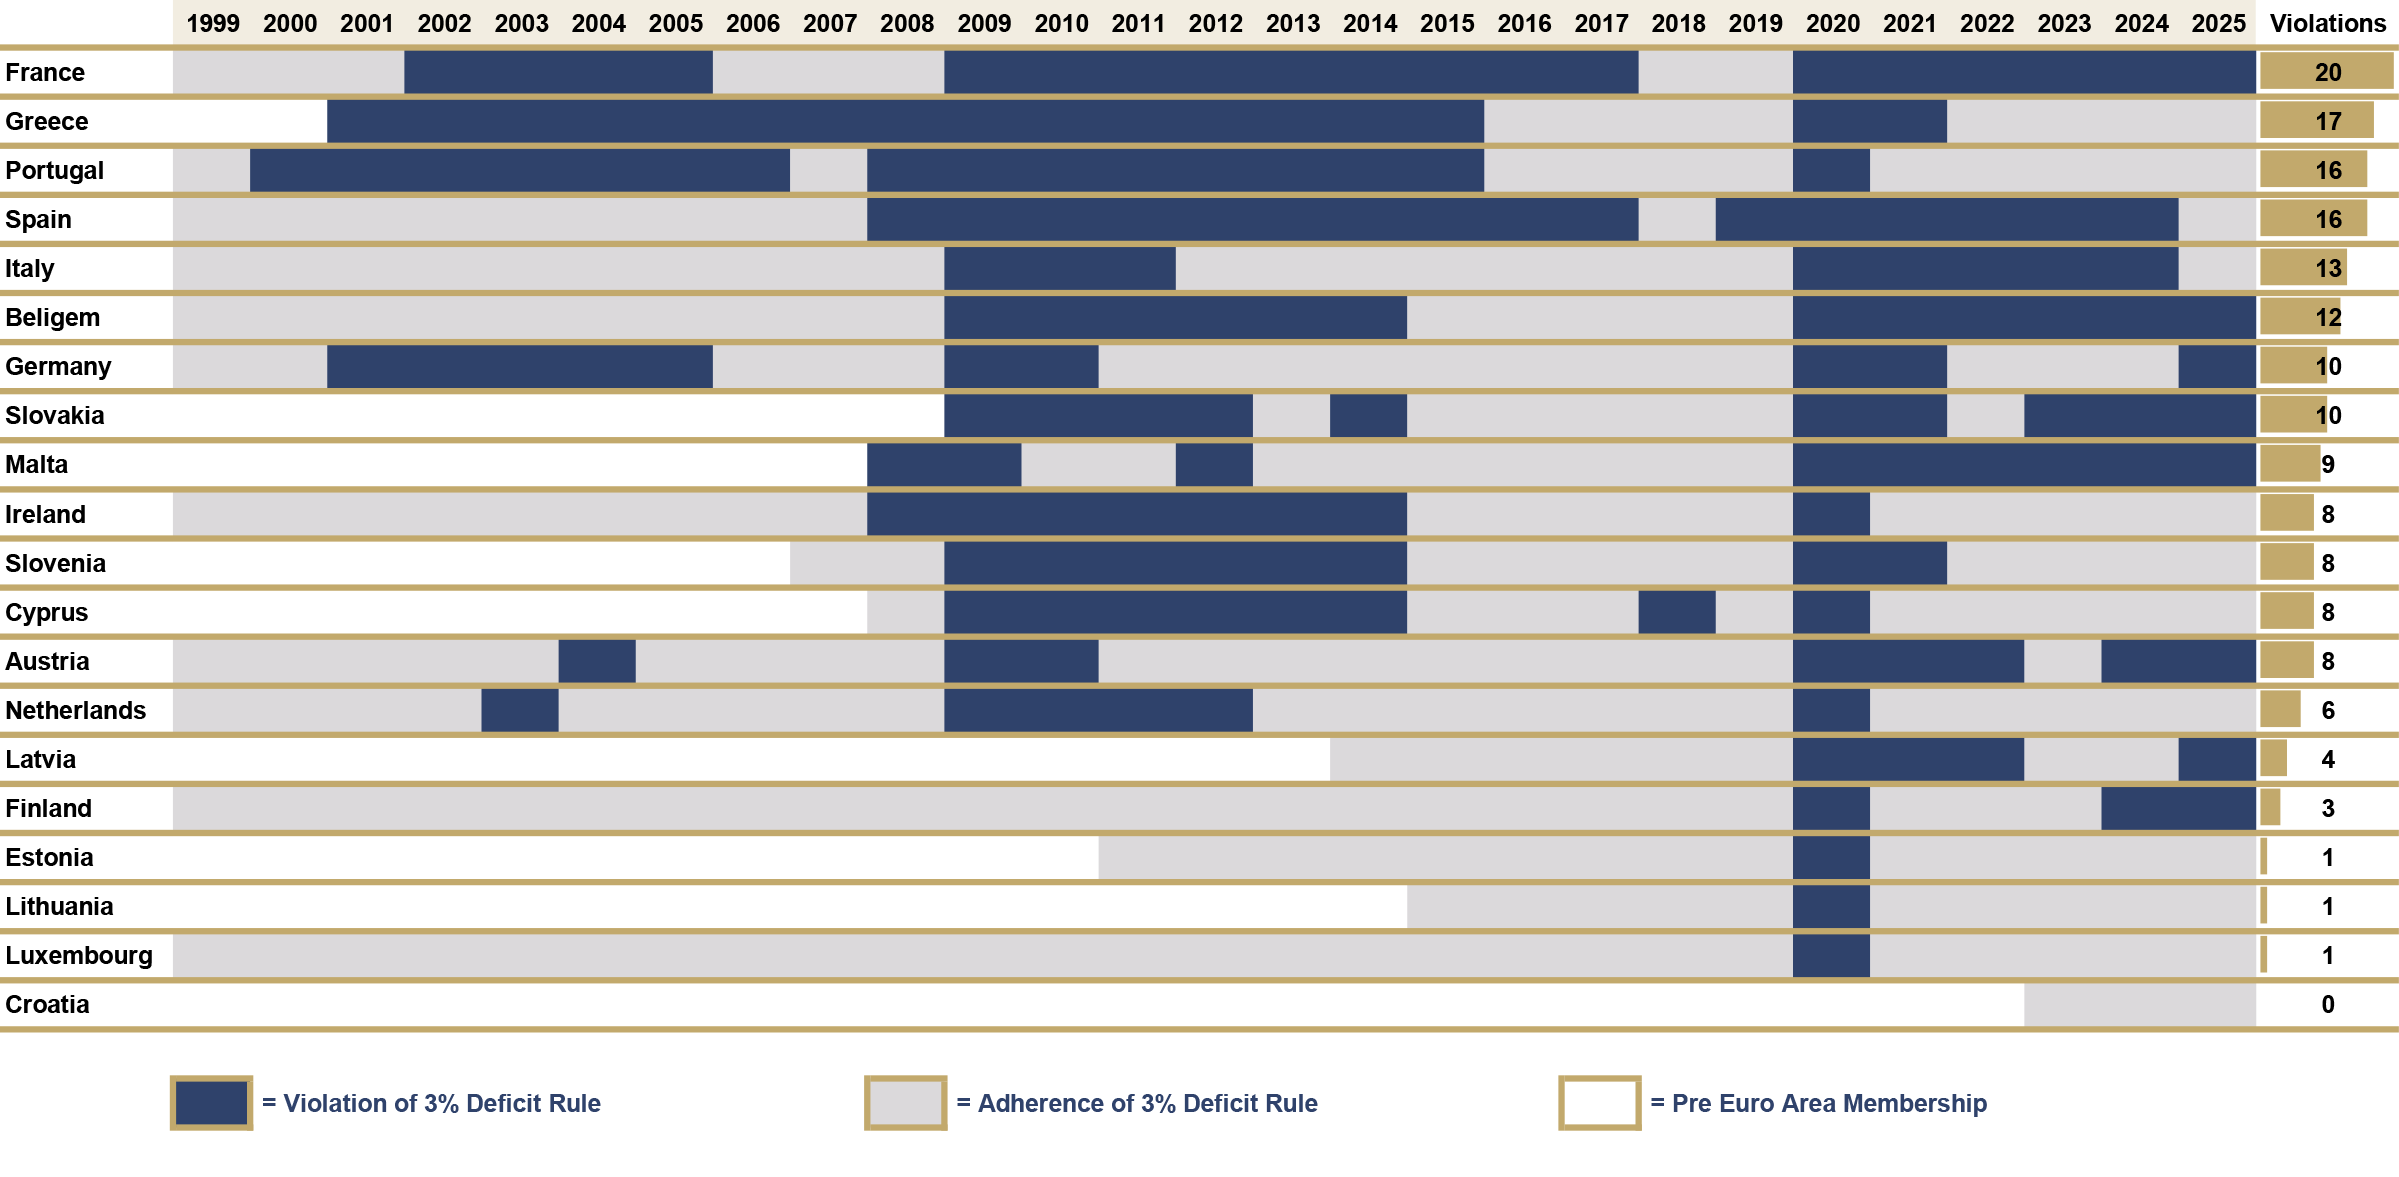
The German deficit in 2025 would have been even higher had spending not been slowed by bureaucratic bottlenecks in planning and approval. Instead of the originally planned expenditures of EUR 143bn or 3.2% of GDP, only EUR 110bn, or around 2.5% of GDP, could be spent. At 2.7%, the general government deficit was nevertheless considerable – especially by German standards. In 2019, Germany still recorded a surplus of 1.3%; in 2018, the surplus was even higher, at 1.9% of GDP. In the current year, the deficit is expected to be 4.8%, then 4.3% in 2027 and 3.8% of GDP in 2028. Even under the EU Commission’s approved exclusion of defense spending amounting to 1.5% of GDP, Germany is unlikely to meet the 3% Maastricht limit. That said, it must be honestly acknowledged that the Maastricht criteria are often viewed merely as recommendations rather than a binding set of rules.
Euro Area Countries in Violation of 3% Deficit Rule, 1999–2025
Source: Agenda Austria, European Commission, Incrementum AG
Germany’s “Club Med-ization”
The consequence of this excessive spending is a significant rise in German government debt, which is expected to increase to at least 80% of GDP by 2030. In 2019, at 59.4%, it was still below the Maastricht ceiling of 60%. By 2029, three expenditure items – social security systems, interest payments, and defense costs – are expected to consume the government’s entire revenue. All other expenditures will have to be financed by taking on new debt.
The verdict from the renowned Munich-based ifo Institute was scathing. It described the 2026 budget as a “sham” (“Mogelpackung”). One reason for this harsh criticism is the fact that the “Special Fund for Infrastructure and Climate Neutrality” is largely not being used for additional investments, as announced. Of the ten largest in vestment items, totaling EUR 24.4bn, planned for 2026, not even EUR 6bn actually flow toward investments. For example, EUR 7.6bn to social security funds is classified as investment expenditure, as are EUR 6.9bn for international aid, guarantees, and compensation.
An initial assessment in spring 2026 reaches an even more damning conclusion for 2025. The ifo Institute estimates that 95% of the EUR 24.3bn in funds allocated for investment in 2025 were misappropriated, e.g., to plug budget holes. The Institute for the German Economy (IW) calculates a misappropriation rate of 86%. However, due to the federal election in the spring, the 2025 budget was not passed until the fall of 2025.
The ESM study “Public investment in ageing societies: rethinking fiscal stimulus in structurally tight labor markets” highlights an important aspect. In labor markets that are tight due to aging, additional government investment intensifies competition for the already scarce resource of labor. Consequently, additional investments in an economy operating close to its capacity limit fuel inflation and crowd out private investment. Bottlenecks caused by a shortage of skilled workers – whether in the planning or implementation of projects – have the same effect. Without an expansion of the labor supply, the additional government spending thus simply leads to higher prices.
In this respect, thinking has often remained stuck in the 1970s, when employment programs were launched in the wake of the two oil crises. The then Austrian Chancellor Bruno Kreisky (SPÖ) coined a Keynesian bon mot in 1979 – one that is at least wellknown in Austria: “A few billion more in debt causes me fewer sleepless nights than a hundred thousand unemployed.” At that time, however, the public debt-to-GDP ratio stood at just 23.6%; a few years earlier it had been under 10%, and four years later it was already over 40%.
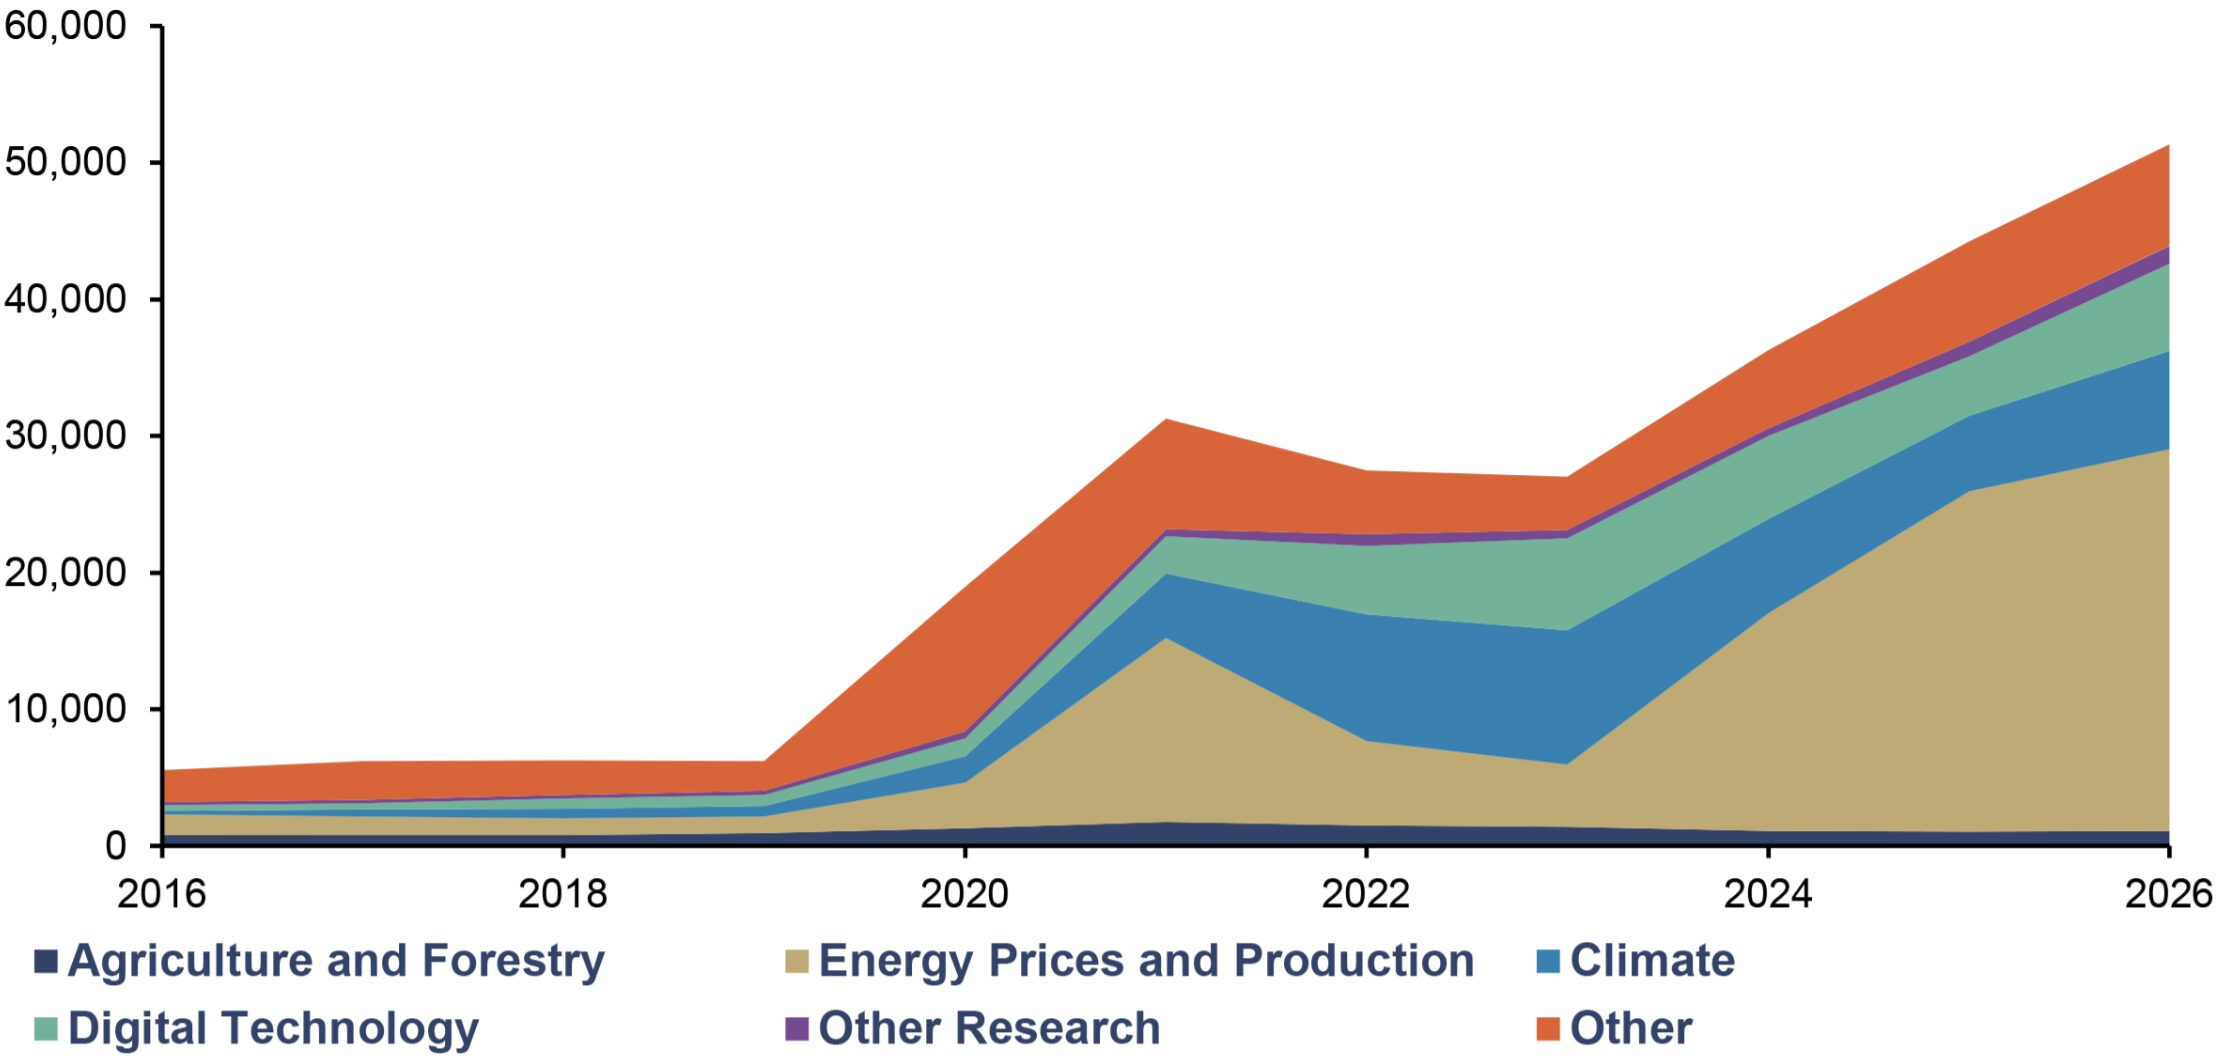
What is remarkable about the development in Germany is the fact that Germany is increasingly transforming into a state-subsidized economy. Within just a few years, subsidies to companies have increased fivefold, and a further significant rise of 10% is expected this year.
German Federal Corporate Subsidies, in EUR mn, 2016–2026
Source: Dezernat Zukunft, Incrementum AG
It is therefore not surprising that discussions took place in Germany this spring regarding an increase in the value-added tax by 2 or even 3 percentage points to 21% or 22%. The most recent increase, from 16 to 19%, went virtually unnoticed by the public amid the excitement of the 2006 World Cup on home soil. In that sense, it is a bad omen for German consumers that, just like in 2006, a World Cup is coming up this summer, albeit on North American turf.
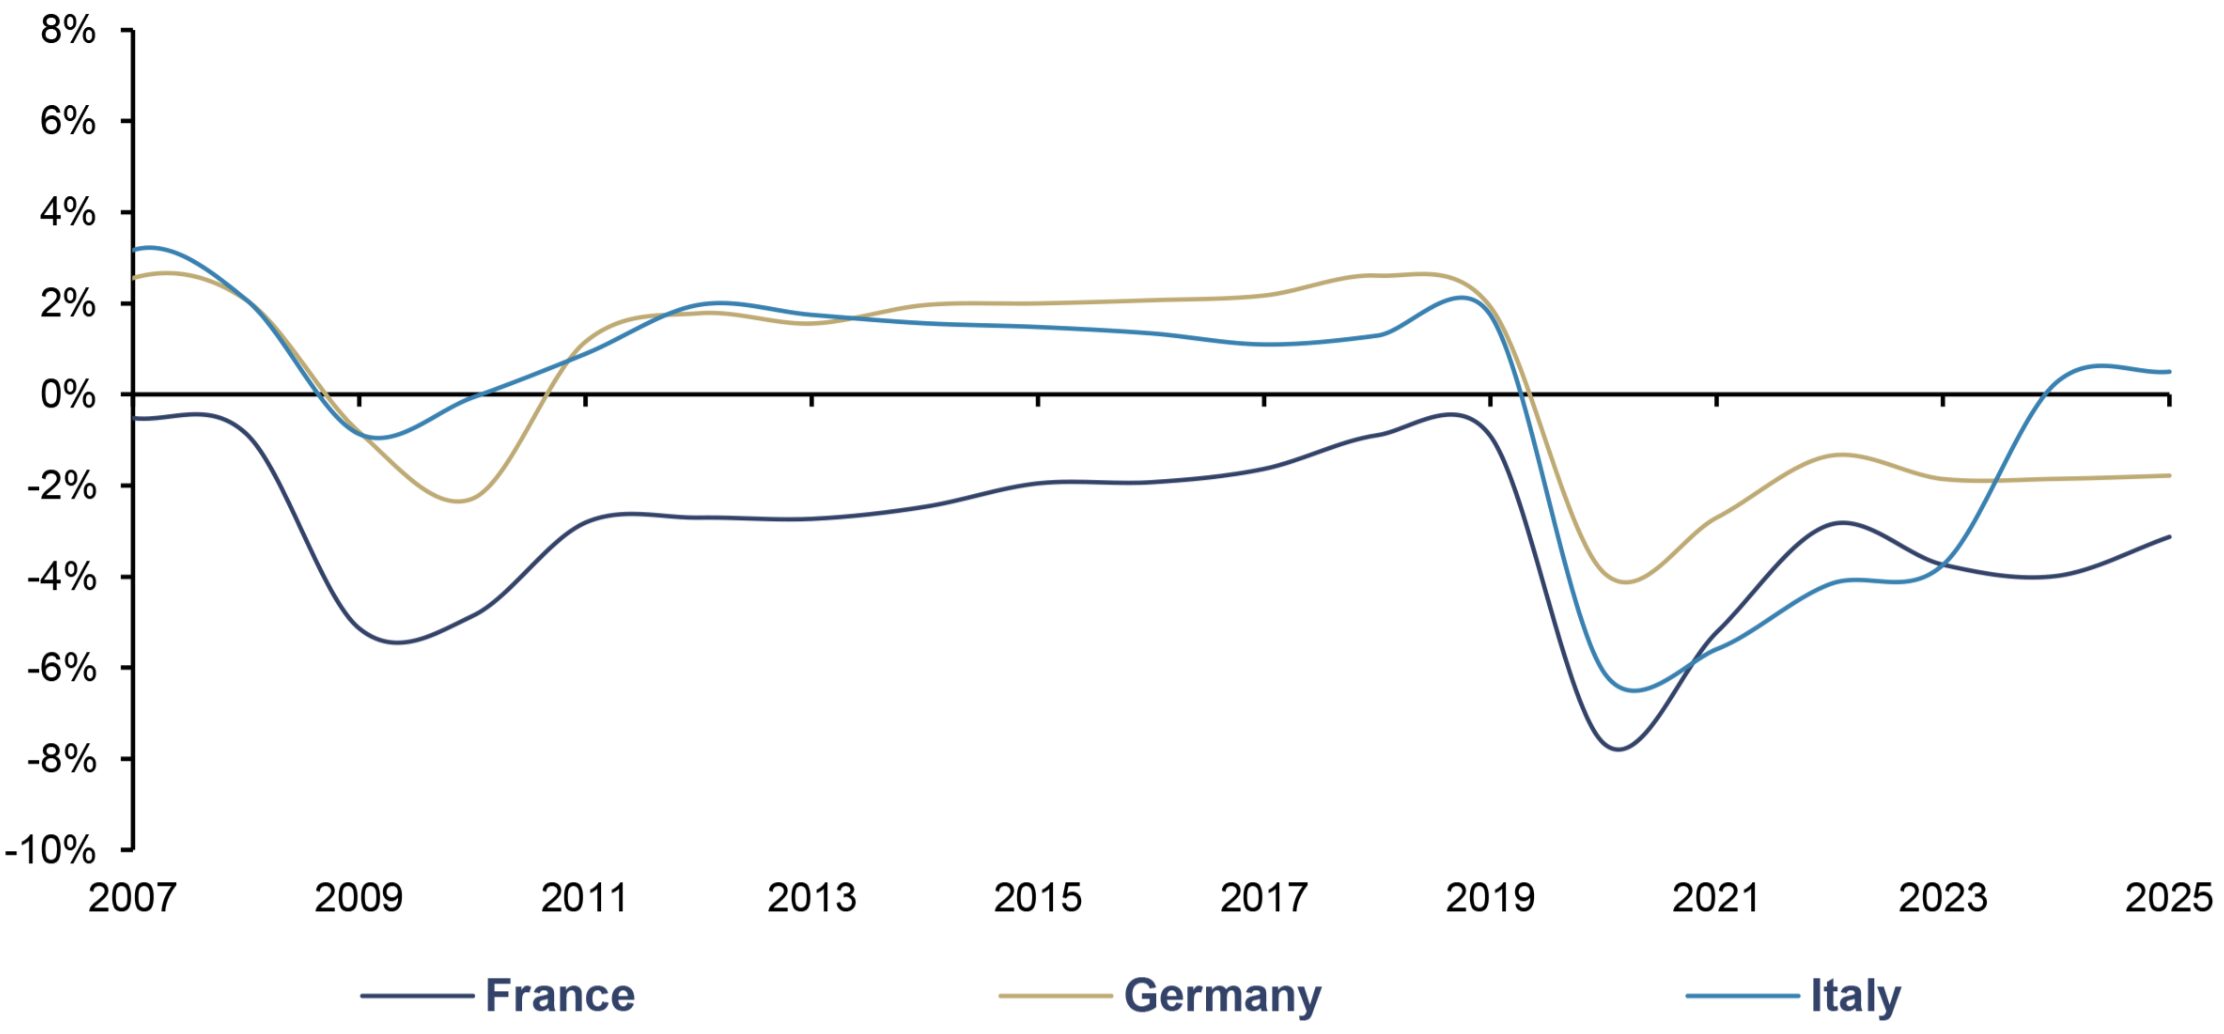
Germany’s massive surge in spending is also evident in its primary deficit, while Italy has been returning to a primary surplus on a quarterly basis since Q4/2024 and on an annual basis since 2025. In other words: Without the burden of old debt – the government debt-to-GDP ratio doubled to 120% between 1980 and 1994 – Italy’s fiscal position would be exemplary.
Primary Balance, as a % of GDP, 2007–2025
Source: IMF, Incrementum AG
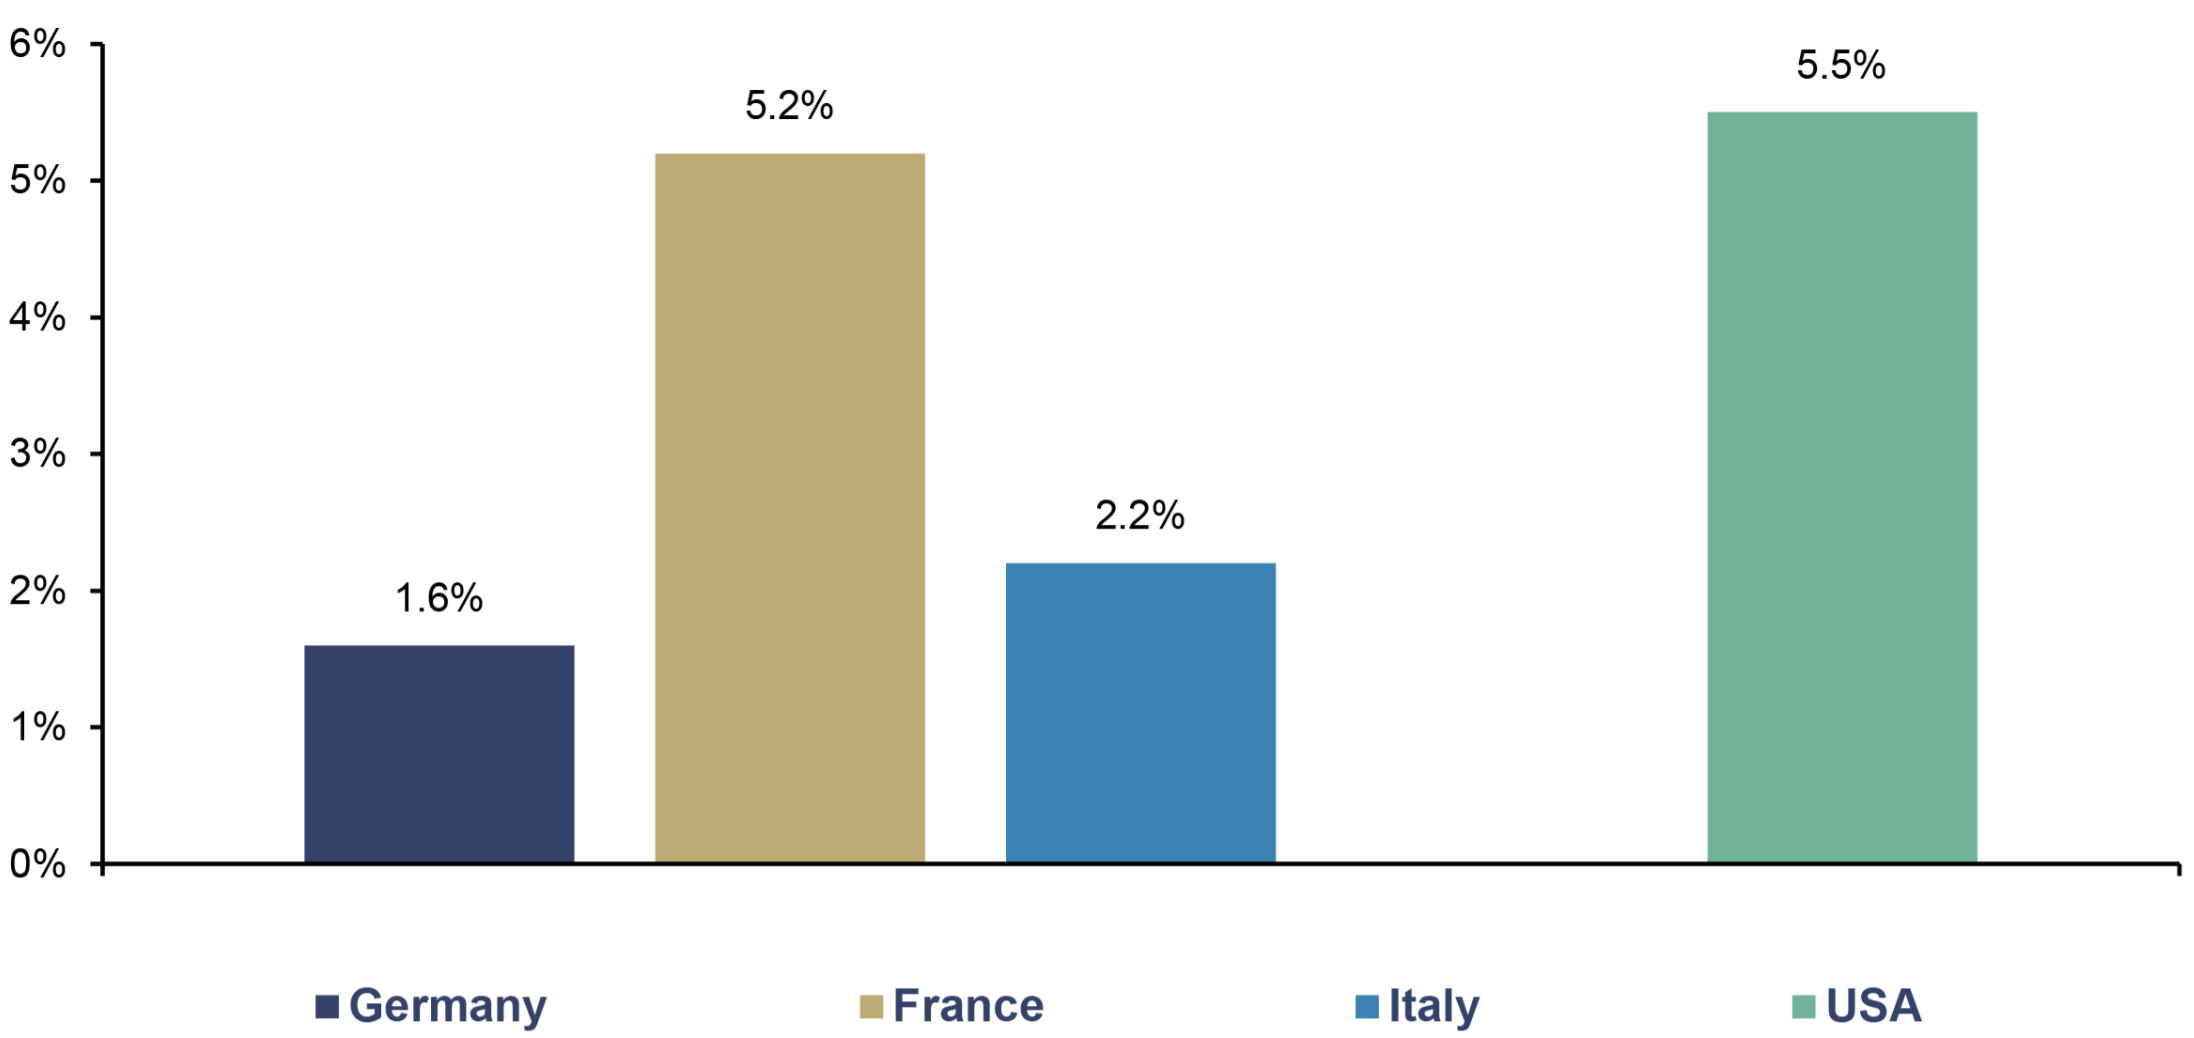
In its study “What will it take to stabilize debt in advanced countries?”, the Bruegel Institute calculated by how much the structural primary deficit must improve to stabilize the level of public debt. Even though Bruegel describes the absolute level of the necessary primary surplus as not “dramatically high,” the adjustment required for many countries is substantial, particularly given the challenging domestic, foreign policy, and economic conditions. Among the major economies, France needs to improve its structural deficit by more than 5 percentage points. The US also finds itself in this less-than-illustrious club.
Required Fiscal Adjustment, as a % of GDP, 2024
Source: Bruegel, Incrementum AG
NextGenEU – Rosy projections backfire quickly
Unsurprisingly, the costs of the EU’s NextGenEU Covid-19 recovery fund have been glossed over. Unsurprising, because shared EU debt is, above all, a political tool to enforce a political goal – the EU central state. Combined with the maxim “Whatever the cost,” which has been popular since the 2012 eurozone sovereign debt crisis, this creates a toxic cocktail. And how this debt is to be serviced remains unclear. The only certainty is that it must be repaid from 2028 through 2058. The amounts required for repayment and the accruing interest are staggering, partly because the NextGenEU decision was based on significantly lower interest rates. Starting in 2028, EUR 25bn–EUR 30bn will have to be spent annually for this purpose. That corresponds to around 20% of the annual EU budget.
Eurobonds – Never let a crisis go to waste
The proposal by Joachim Nagel, President of the Deutsche Bundesbank, for the strictly limited issuance of joint debt likely came as a surprise to many – and presumably just as many were irritated by it. Ultimately, it was withdrawn just as quickly as it was made.
Opposition to Eurobonds remains as resolute as it is persistent on many fronts, as they would represent a further step toward greater integration, aka “United States of Europe”. Advocates of a centralized United States of Europe, however, are calling for the introduction of Eurobonds precisely for this reason. These are also seen as indispensable for broader global acceptance of the euro. Whether this hope is justified is highly doubtful, however, given the freezing of Russian currency reserves and their use as collateral for a loan from EU member states to Ukraine. Blanchard et al., on the other hand, argue in their proposal from last year that financial markets are calling for another global, liquid, and secure financial instrument.
It is highly likely that any permanent introduction of Eurobonds would not reduce national borrowing but would instead further increase overall debt. This is because financing needs are increasingly spiraling out of control. The European Commission estimates that EU member states will require annual investments of EUR 1.2trn through 2030 to achieve the EU’s climate goals. Defense spending is rising significantly, the cost pressures of demographic change are steadily and irreversibly increasing in the medium term, and the costs of im migration also remain high.
Financial repression
A popular method for indirectly improving public finances is the various forms of financial repression. These include the legal obligation, particularly for institutional investors such as insurance companies and pension funds, to hold a certain percentage of their investment portfolio in supposedly safe government bonds. The regulatory preference for government bonds with the highest credit rating – which, unlike other asset classes, commercial banks are not required to back with capital – also boosts demand for government bonds and lowers bond yields below the level that would have prevailed without this regulatory preference.
Capital controls, an instrument of financial repression that has been frowned upon in the West since the definitive end of the gold standard and the introduction of the system of flexible exchange rates, could, however, come back into vogue if there are major and sustained capital outflows, e.g., as a result of prohibitive wealth or capital taxes. This would not only prevent capital flight but also, at least in the short term, safeguard the currency’s external value.
Gold in the crosshairs of the Treasury
Gold is now increasingly coming under the scrutiny of fiscal authorities. For the first time, Belgium will impose a 10% capital gains tax on realized profits from investments in gold starting January 1, 2026. However, this new regulation will not be applied retroactively; and the market value as of December 31, 2025, will serve as the tax basis, regardless of the date of purchase. In Austria, a case caused a media stir because a citizen who wanted to sell his gold was denied the sale because he could not prove when and where he had purchased the gold. This demand for proof of origin, which is not required by law, had no tax-related basis but was due to an overzealous application of the Anti-Money Laundering Directive.
In Italy, there were also heated discussions this spring regarding a proposed bill. Anyone who cannot provide proof of purchase when selling gold will be required to pay a 26% tax on the proceeds of the sale. The proposal, which was ultimately withdrawn, provided for a kind of amnesty rule. Privately owned gold could have been legally registered by paying a 12.5% tax. In the event of a subsequent sale, the tax would then be calculated based only on the difference between the current selling price and the price at the time of legalization.
These examples show that, even though many legislative proposals ultimately failed, the days of buying and selling gold with virtually no restrictions are over. Anecdotal evidence clearly points toward increasingly stringent government control over gold in particular and assets in general.
Fiscal inflation
The IMF has also joined this competition of dubious ideas – which mostly only combat the symptoms, and only in the short term, rather than solving the structural budget problems at their root – with a questionable proposal of its own. Thus, allowing “controlled inflation” for a certain period is advocated to enable gradual and sustainable budget consolidation. Such “fiscal inflation” would succeed provided that government bonds are not inflation-indexed. In the US, not even 10% of marketable US Treasury bonds are inflation-indexed; in Germany, the figure is just around 4%.
To put it bluntly, this means: The IMF welcomes a systematic devaluation of private and public pension plans backed by government bonds, as well as the expropriation of foreign creditors. There is no escaping a legally mandated investment in government bonds, e.g., in the second pension pillar. However, voluntarily exposing oneself to such a high risk of a real loss of purchasing power is likely to be more than just unwise, especially in light of this IMF recommendation.
Asset register
The specter of an asset registry continues to haunt the EU media. However, there is still no concrete legislative proposal regarding a general requirement to register assets. Regardless of how much substance should be attributed to the proposal for the possible introduction of such a registry, it reflects growing concern over a reversal of the burden of proof in tax matters: It is no longer the state that must prove that a certain amount of money was earned illegally or insufficiently taxed, but rather citizens must prove that the money with which they make major purchases was earned legally and taxed in accordance with the law. Albeit far-fetched, this reversal of the burden of proof is justified by invoking the fight against money laundering and terrorism, emotionally underpinned by the essentially totalitarian stance that anyone who has nothing to hide has nothing to fear.
This rationale also serves as an argument for the renewed restrictions on cash use in the EU starting in the summer of 2027. In just over a year, cash purchases worth more than EUR 10,000– except between private individuals – will be prohibited. The buyer’s identity must be recorded for purchases of EUR 3,000 or more. Currently, the limit stands at EUR 10,000. Member states are free to set stricter limits. For example, France and Spain set their national limits at just EUR 1,000 some time ago, while Italy set its limit at EUR 5,000. Ongoing currency devaluation brings with it an equally ongoing real reduction in the limit.
Conclusion
Our long-standing maxim, “Anything but bonds” is no longer a particularly bold statement in light of the structural developments of the past decades. And yet it represents a sharp departure from cherished habits[4] and from the mantra regurgitated by finance ministers and investment guides, according to which government bonds are safe because countries cannot go bankrupt. This is a deliberate distortion of historical reality. Countries do not even have to formally go bankrupt for bondholders to suffer (severe) losses.
The promise of receiving the full face value of a government bond at maturity offers little comfort. Many investors will have to painfully realize, at the latest on the day of payment, that while the nominalist view – according to which 100 monetary units are always 100 monetary units without any qualification – is indeed significant in terms of (financial) law, this equation does not hold true economically, especially in times of elevated inflation rates.
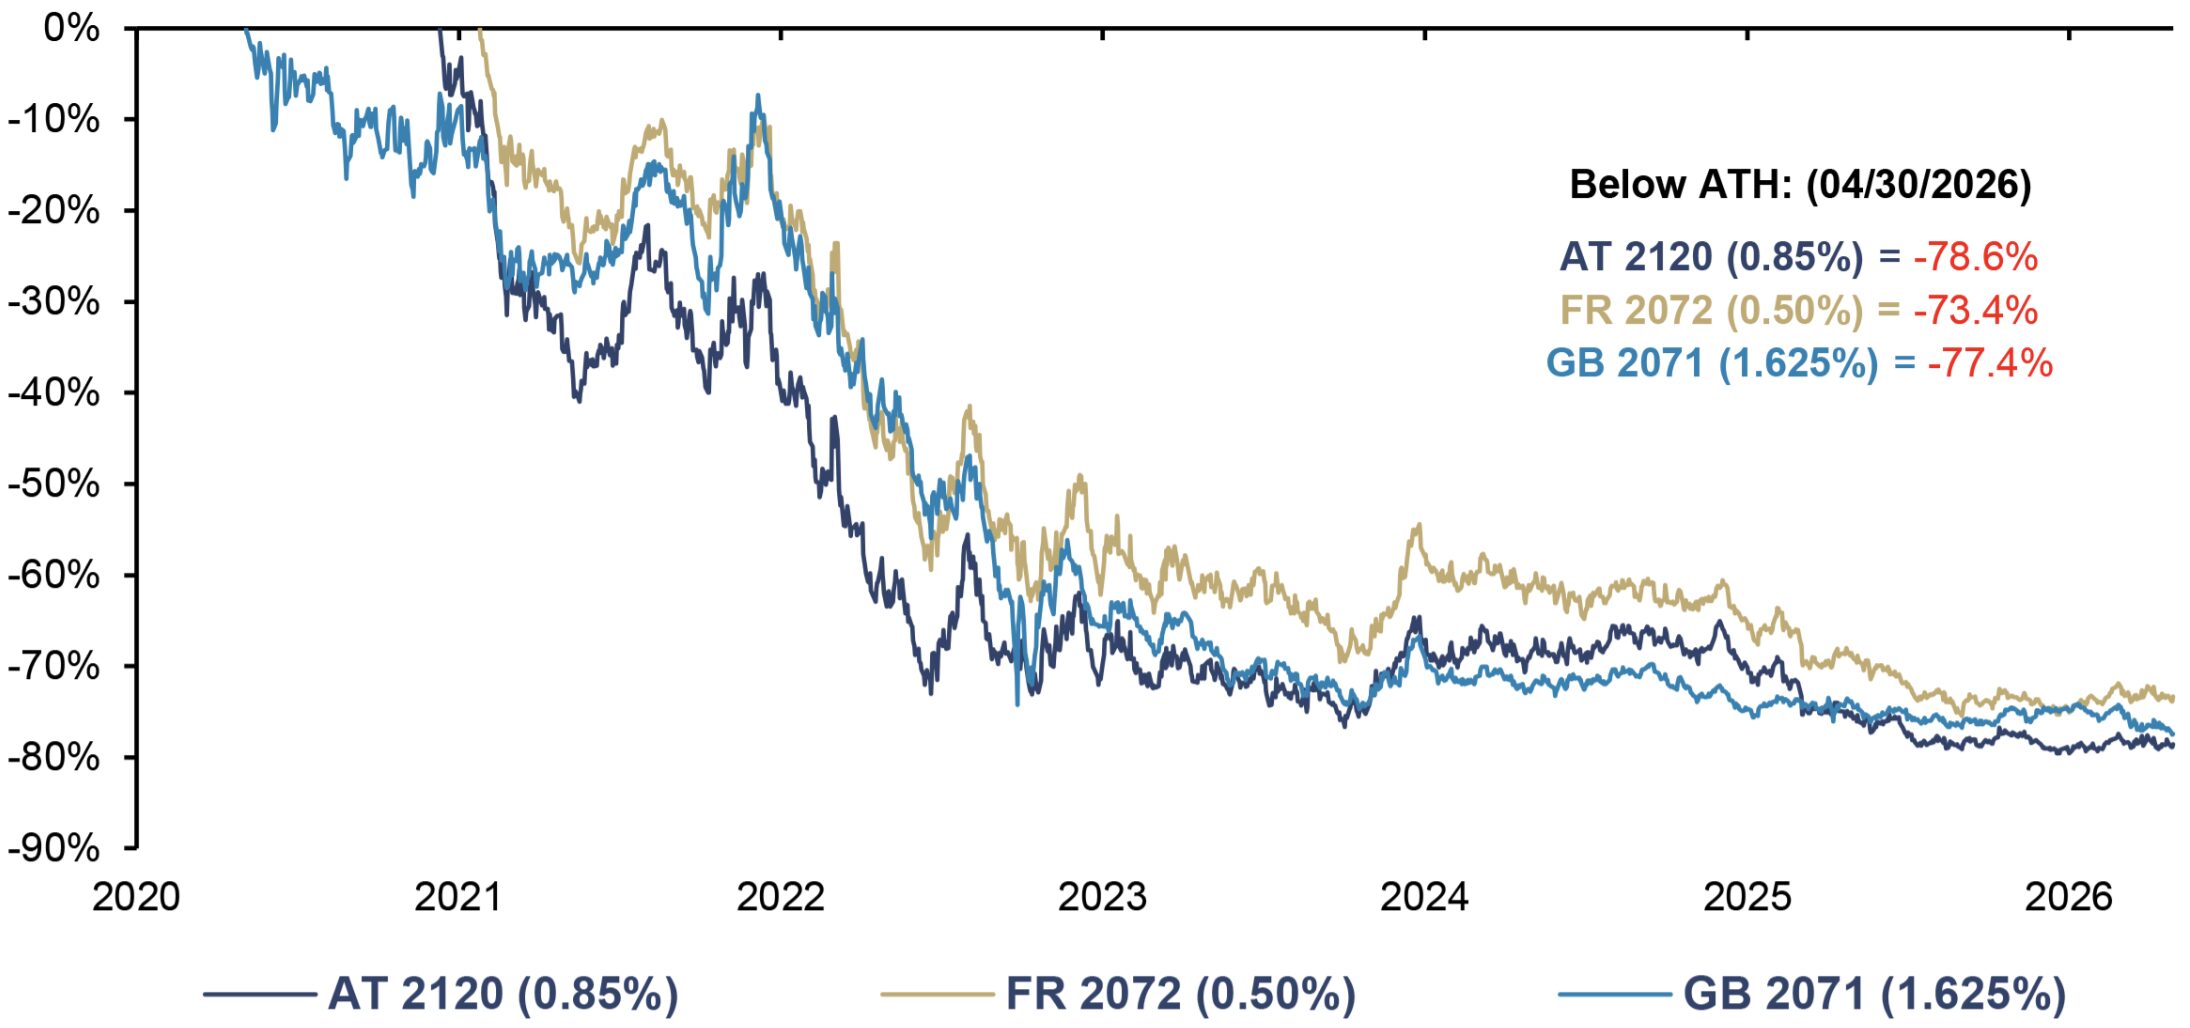
AT 2120 (0.85%), FR 2072 (0.50%) and GB 2071 (1.625%) Below All-Time High, 01/2020–04/2026
Source: LSEG, Incrementum AG
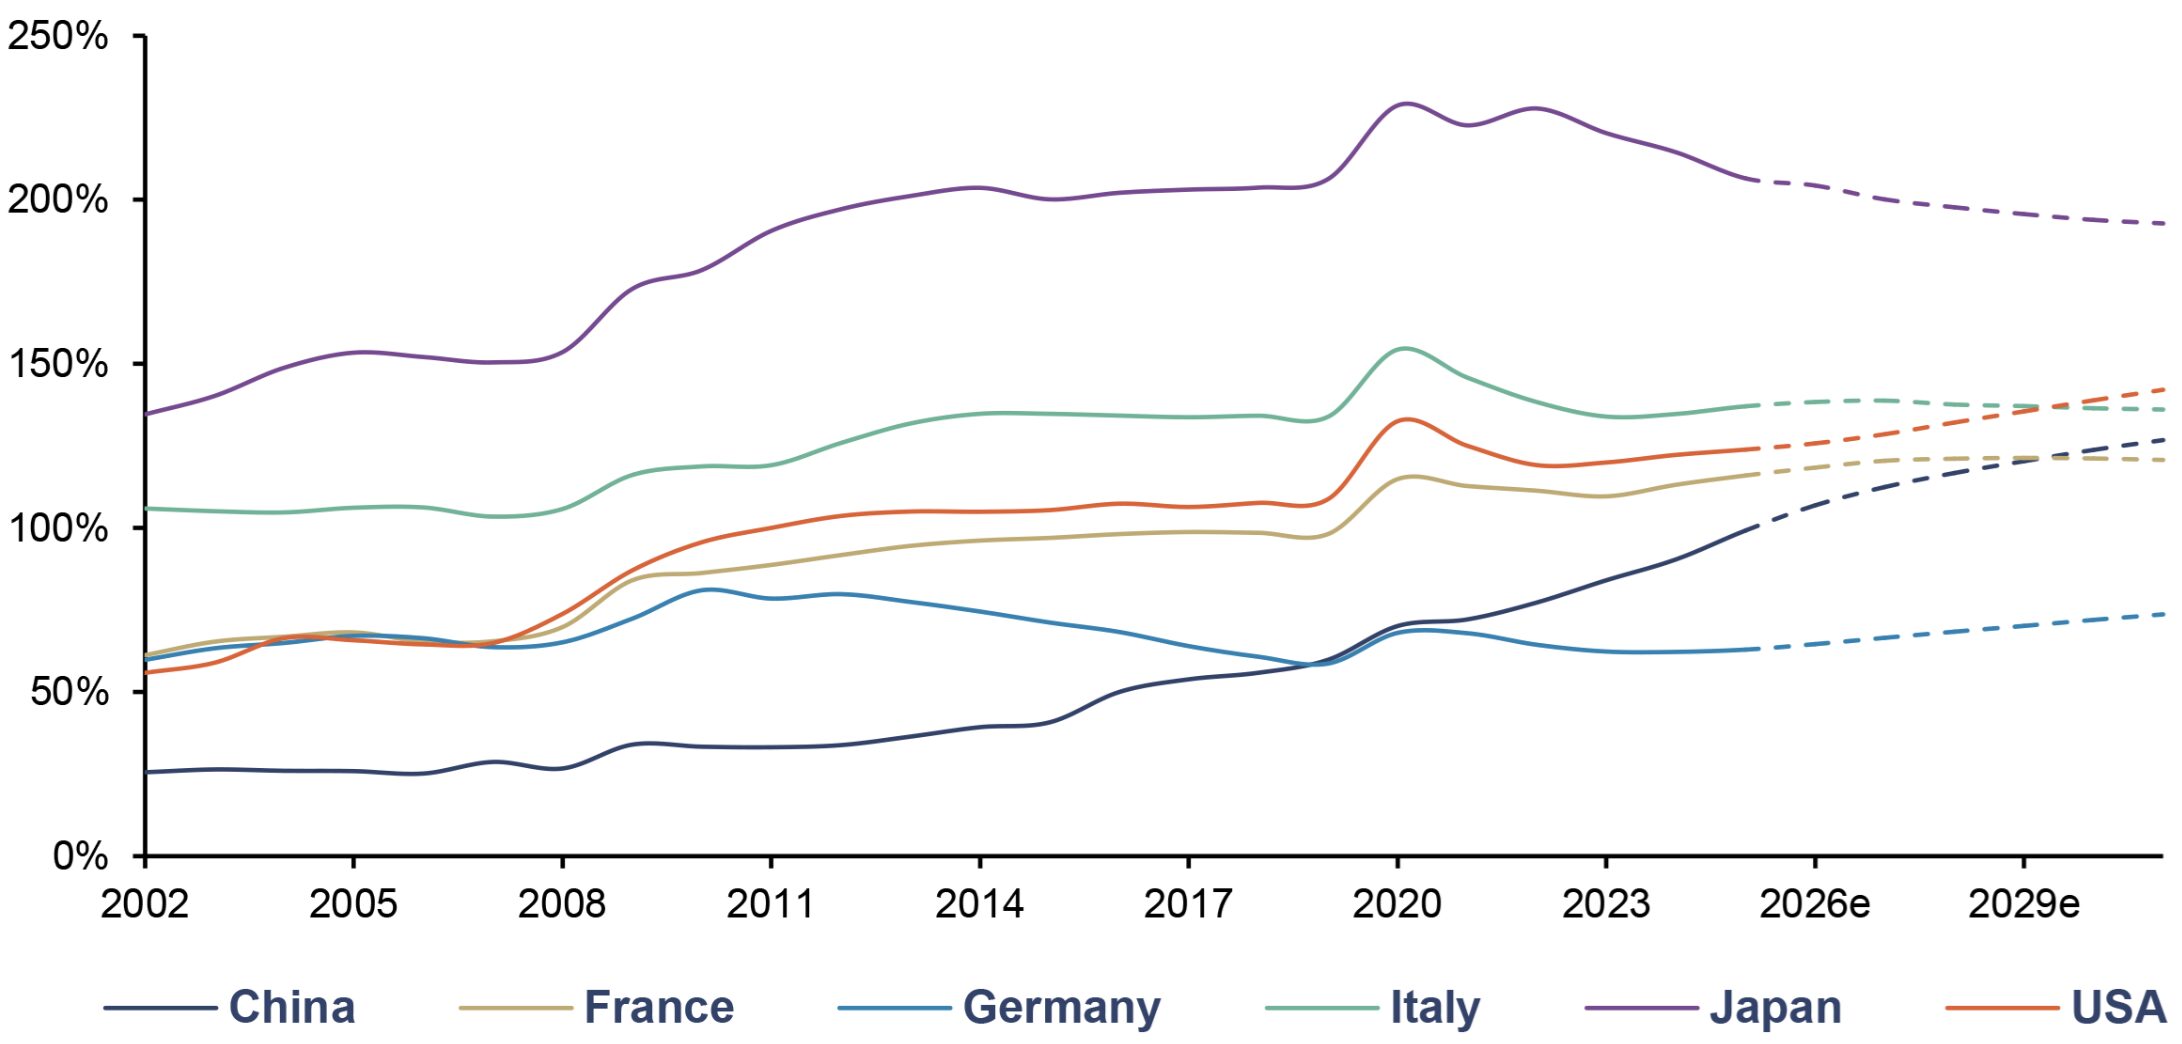
And the long-term outlook for government debt in the leading industrialized nations is bleak. Such long-term projections also bring to light those “invisible” debts that currently exist as legally enforceable claims against the social security system – whether against pay-as-you-go pension systems or the healthcare system – for which governments, unlike corporations, are not required to set aside reserves.
Government Debt Forecast, as a % of GDP, 2002–2031e
Source: IMF, Incrementum AG
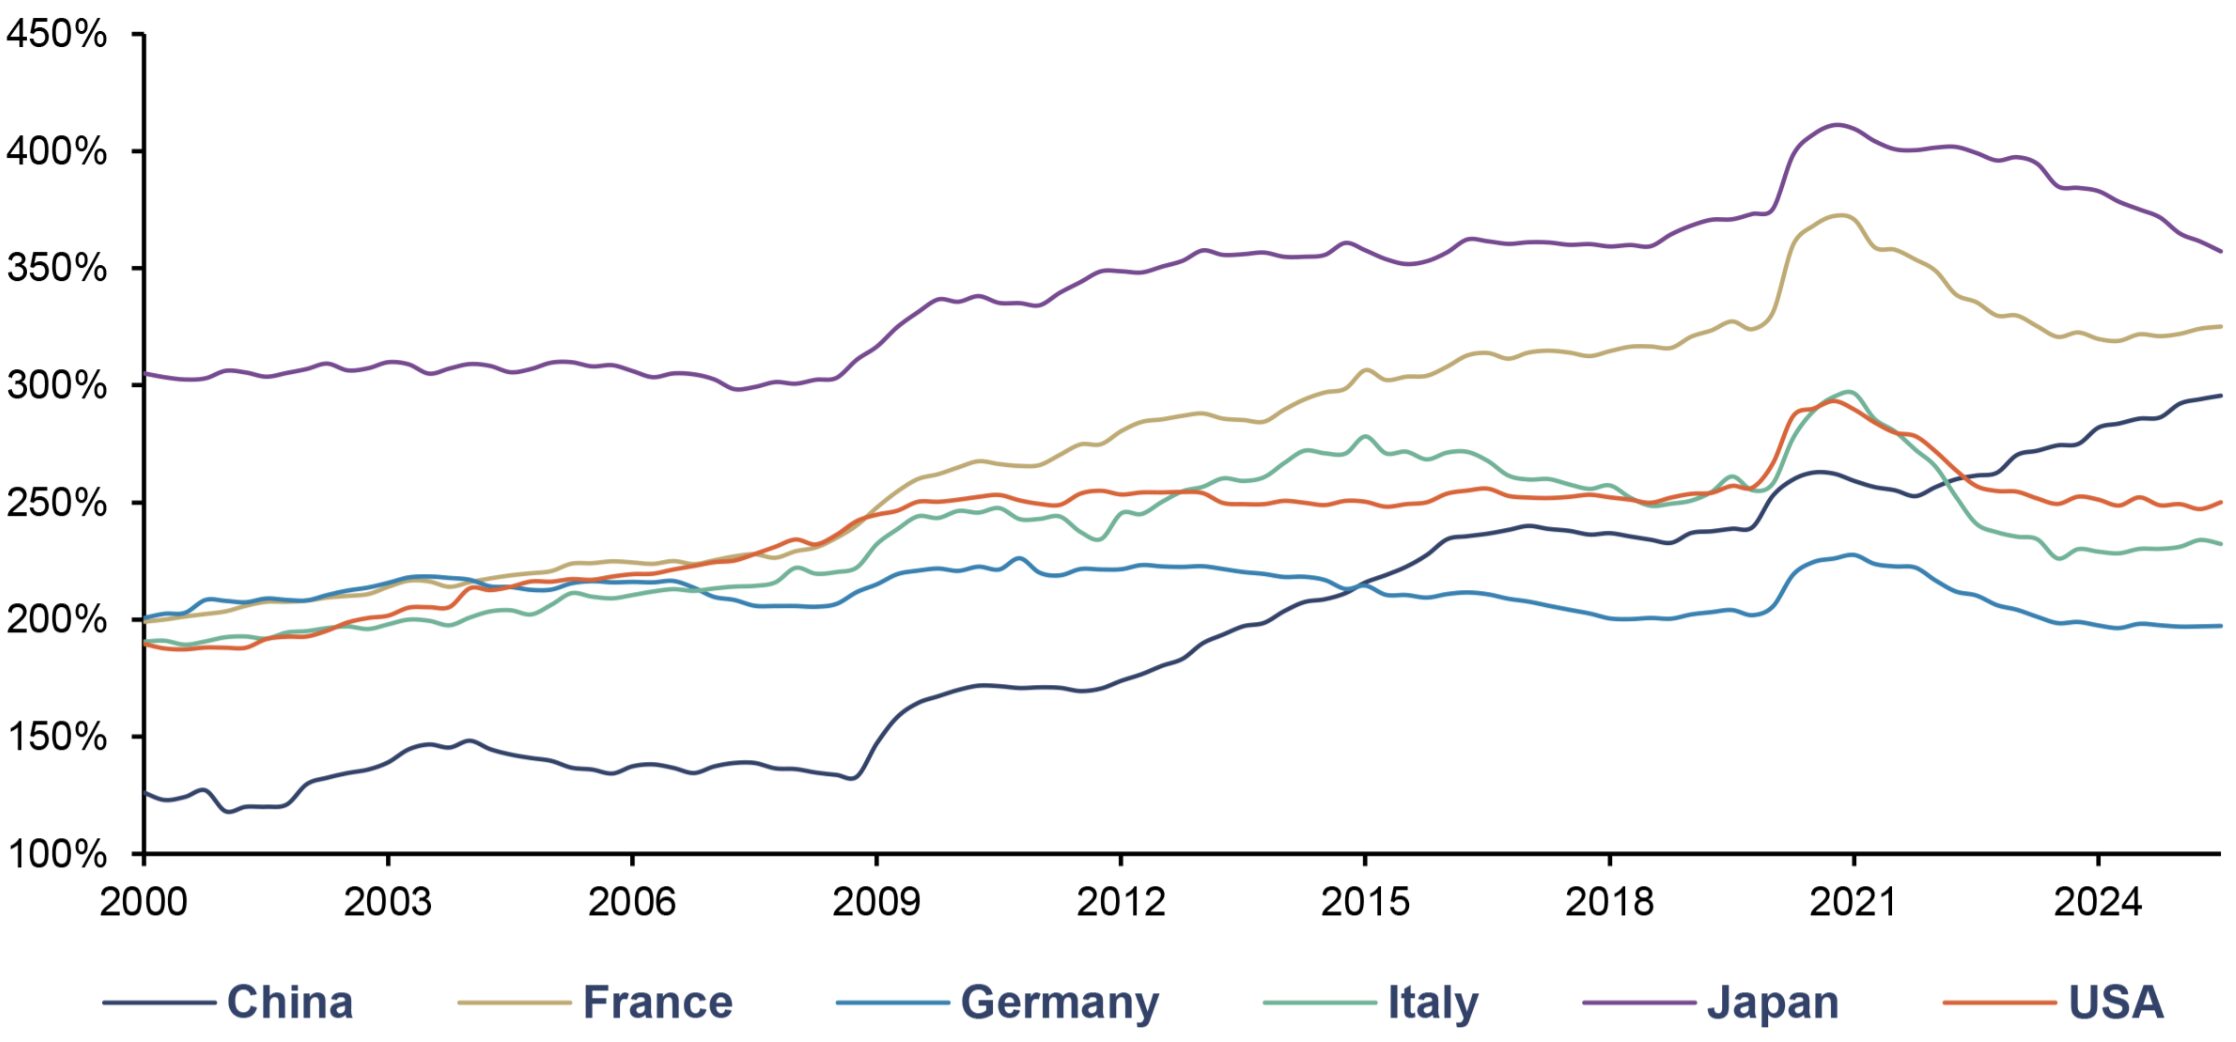
We have repeatedly pointed out that government debt represents only a portion of total societal debt. In addition to the government – federal, state, local, and social security – private households and corporations are also in debt, although their relative share of total societal debt as well as the respective sector-specific debt-to-GDP ratio vary significantly from country to country. This leads to (highly) divergent public debates and political dynamics in the event of interest rate changes and rising yields.
Total Debt*, as a % of GDP, Q1/2000–Q3/2025
Source: BIS, Incrementum AG
*Government, Non-financial Corporations and Households
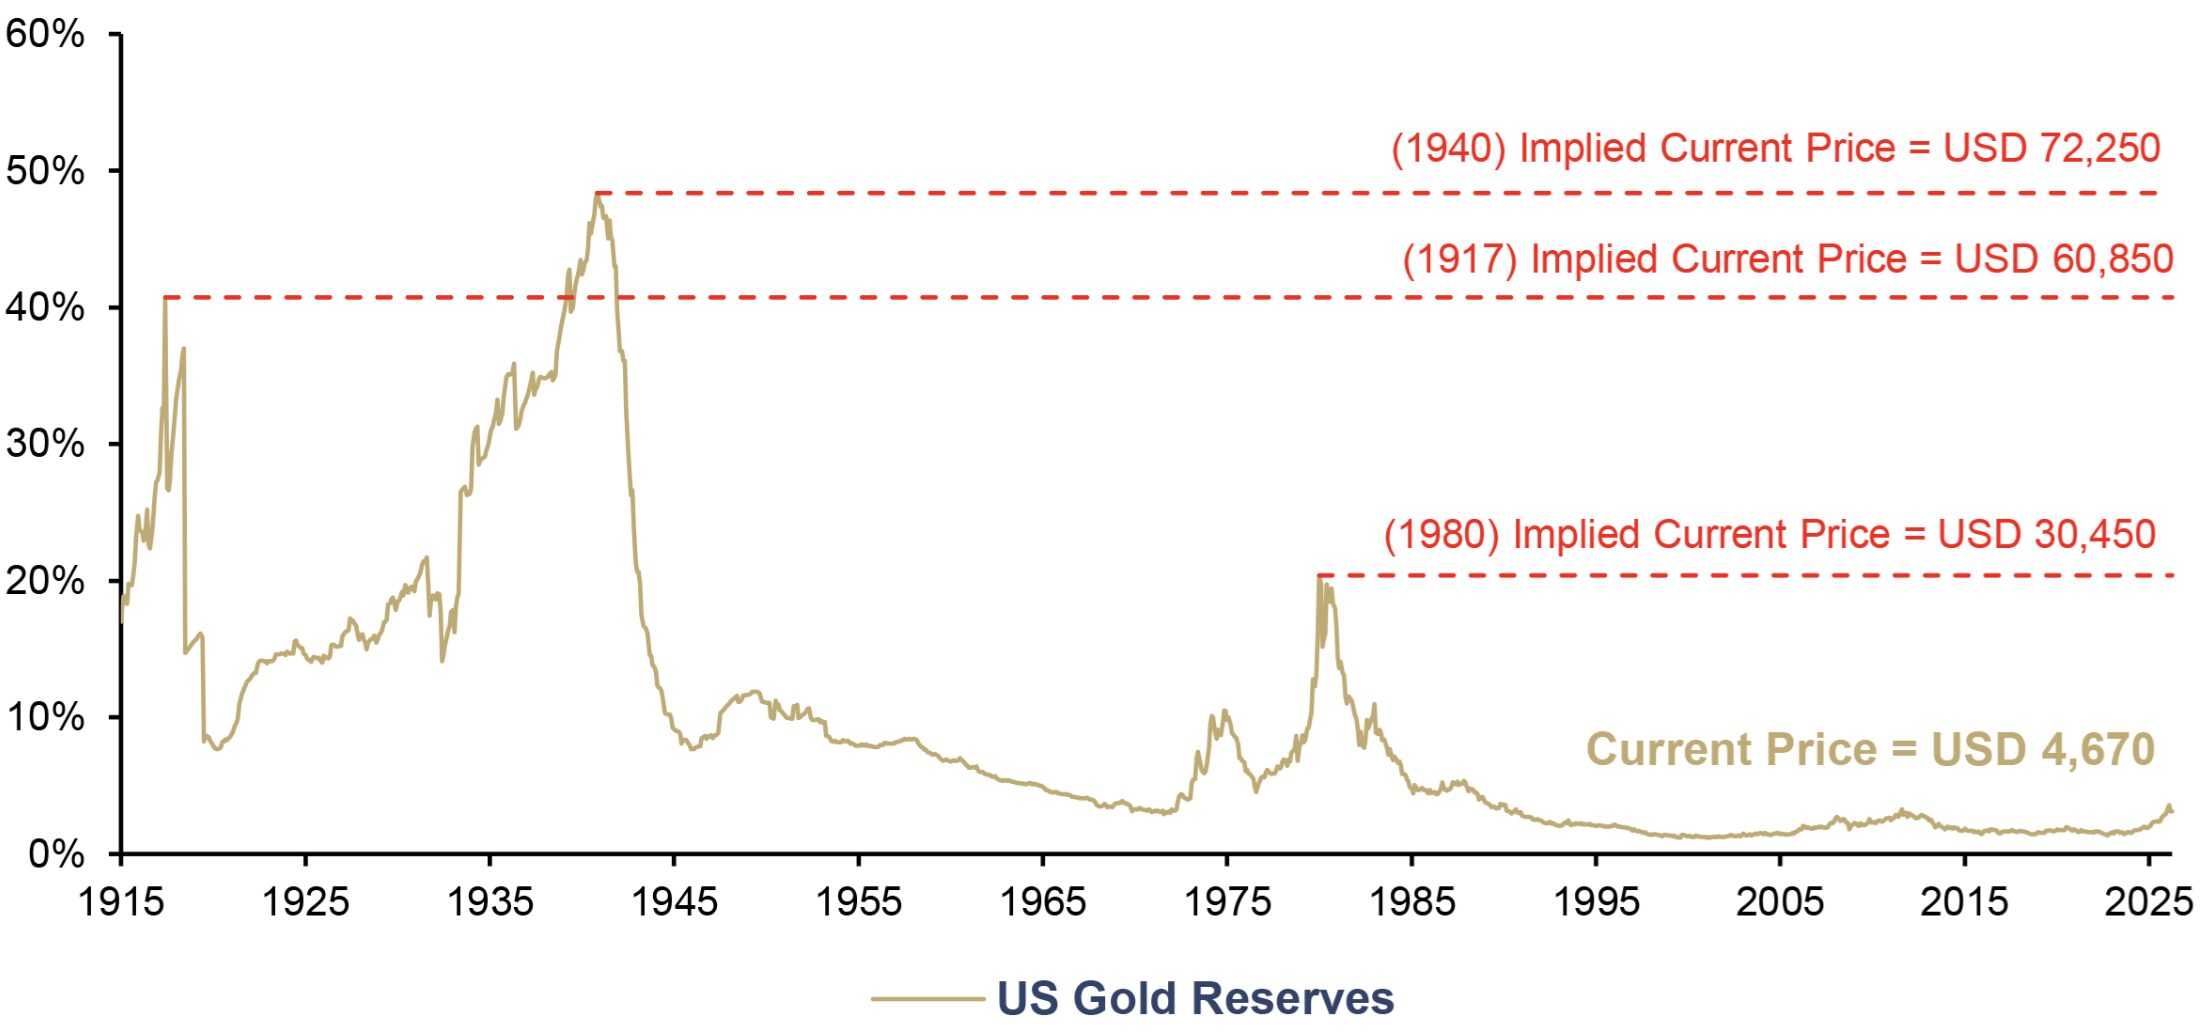
Finally, the following chart is extremely revealing, as it illustrates the gold backing of US federal debt. In the early 1940s, and thus immediately before the US entered World War II, US gold reserves covered 51% of US federal debt. By the end of 2025, this figure had fallen to just 3%, though it had fluctuated around this level since the mid1990s. If, by the end of 2025, 51% of US federal debt were covered by gold reserves – as it was in the early 1940s – the price of an ounce of gold would need to be valued at around USD 75,000. Even reaching the interim high of 18% in 1980 implies a nearly sixfold increase in the current gold price to around USD 26,000.
US Gold Reserves, as a % of US Public Debt, 01/1915–04/2026
Source: Nick Laird, LSEG, Incrementum AG
[1] See also: IMF: Fiscal Monitor, Chapter 1, April 2025
[2] For a more in-depth discussion, see the section “The Treasury-Fed Accord of March 3, 1951” in “The Status Quo of Gold,” In Gold We Trust report 2021
[3] See “Status Quo of Debt Dynamics,” In Gold We Trust report 2025; “Status Quo of Debt Dynamics,” In Gold We Trust report 2024
[4] See chapter “The Psychology Behind Gold’s Underallocation” in this In Gold We Trust report