Silver’s Inflation Conundrum
“You think you know that monetary policy is controlled by a central bank adjusting interest rates and/or the size of its bank balance sheets. You are wrong. The consequences of being wrong on this will be the greatest cause of wealth erosion in the modern age.”
Russell Napier
Key Takeaways
- Silver prices disappointed investors, who observed consumer price indices exploding higher. Is silver no longer a monetary metal that hedges against inflation? Rest assured, fellow investor, it is. But there were two impediments to price appreciation.
- Real rates stopped falling in August 2020. Silver’s inverse correlation to real rates first halted price appreciation, and then stagnation set in, as with real rates. Secondly, consumer price increases are not necessarily inflation.
- The problem was not the monetary metal but the lack of monetary inflation. The consumer price increases were primarily caused by supply shocks, i.e. shuttering and restricting business and making it uncertain, and demand surges, i.e. the ordering of goods in place of services that were less available due to Covid-induced government restrictions.
- The good news (for silver investors, at least) is that the balance of probabilities strongly favors an inflationary decade ahead.
Stagnant Real Rates Put a Lid on Silver’s Nominal Price
Silver prices are strongly correlated to real rates. When real rates stopped falling in early August 2020, silver prices peaked shortly thereafter. The table below shows, across different frequencies and time periods, that the monetary metal is strongly repelled by the real, inflation-adjusted price of money.
Silver (USD) is Negatively Correlated to Real Rates (US 10-year Treasury)
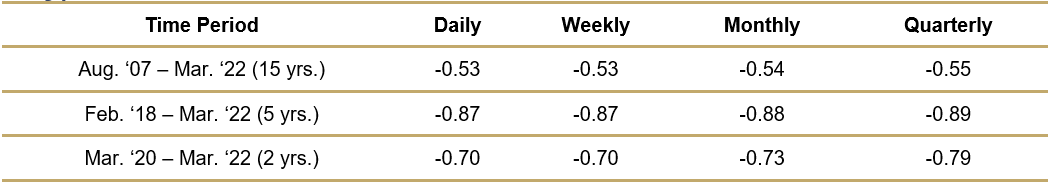
Source: Bloomberg, Incrementum AG
The August 2007 starting point was chosen because that is when the Global Financial Crisis began and changed the monetary system irrevocably – so far – from exponential growth to stagnation.[1] February 2018 was when the fourth bout (since 2007) of monetary deflation began. March 2020 was when the acute reaction to the pandemic and government actions set in.
Peaking in early November 2018, real rates stepped away from Globally Synchronized Growth[2] and began a steady 21-month downtrend. Real rates fell 2.25 percentage points, from 1.17% to -1.08%. That’s when silver prices rose. But from August 2020 to March 2022 they stagnated (min: -1.19%, avg: -0.89%, max: -0.42%). That’s when silver prices basically went nowhere.
During the first phase, silver’s inverse correlation raised the metal from a monthly average of USD 14.36 in November 2018 to an average of USD 27 by August 2020. And during the second phase, the phase when the CPI was registering multidecade high rates of acceleration? Silver stagnated (min: USD 21.54, avg: USD 24.99, max: USD 29.13). Silver ignored the CPI inferno because it is not a CPI metal, it is a monetary metal and we were not witnessing monetary inflation.
Silver (lhs), in USD, and Inflation-Indexed US 10-Year Treasury Bonds (rhs, inverted), in %, 01/2003-05/2022
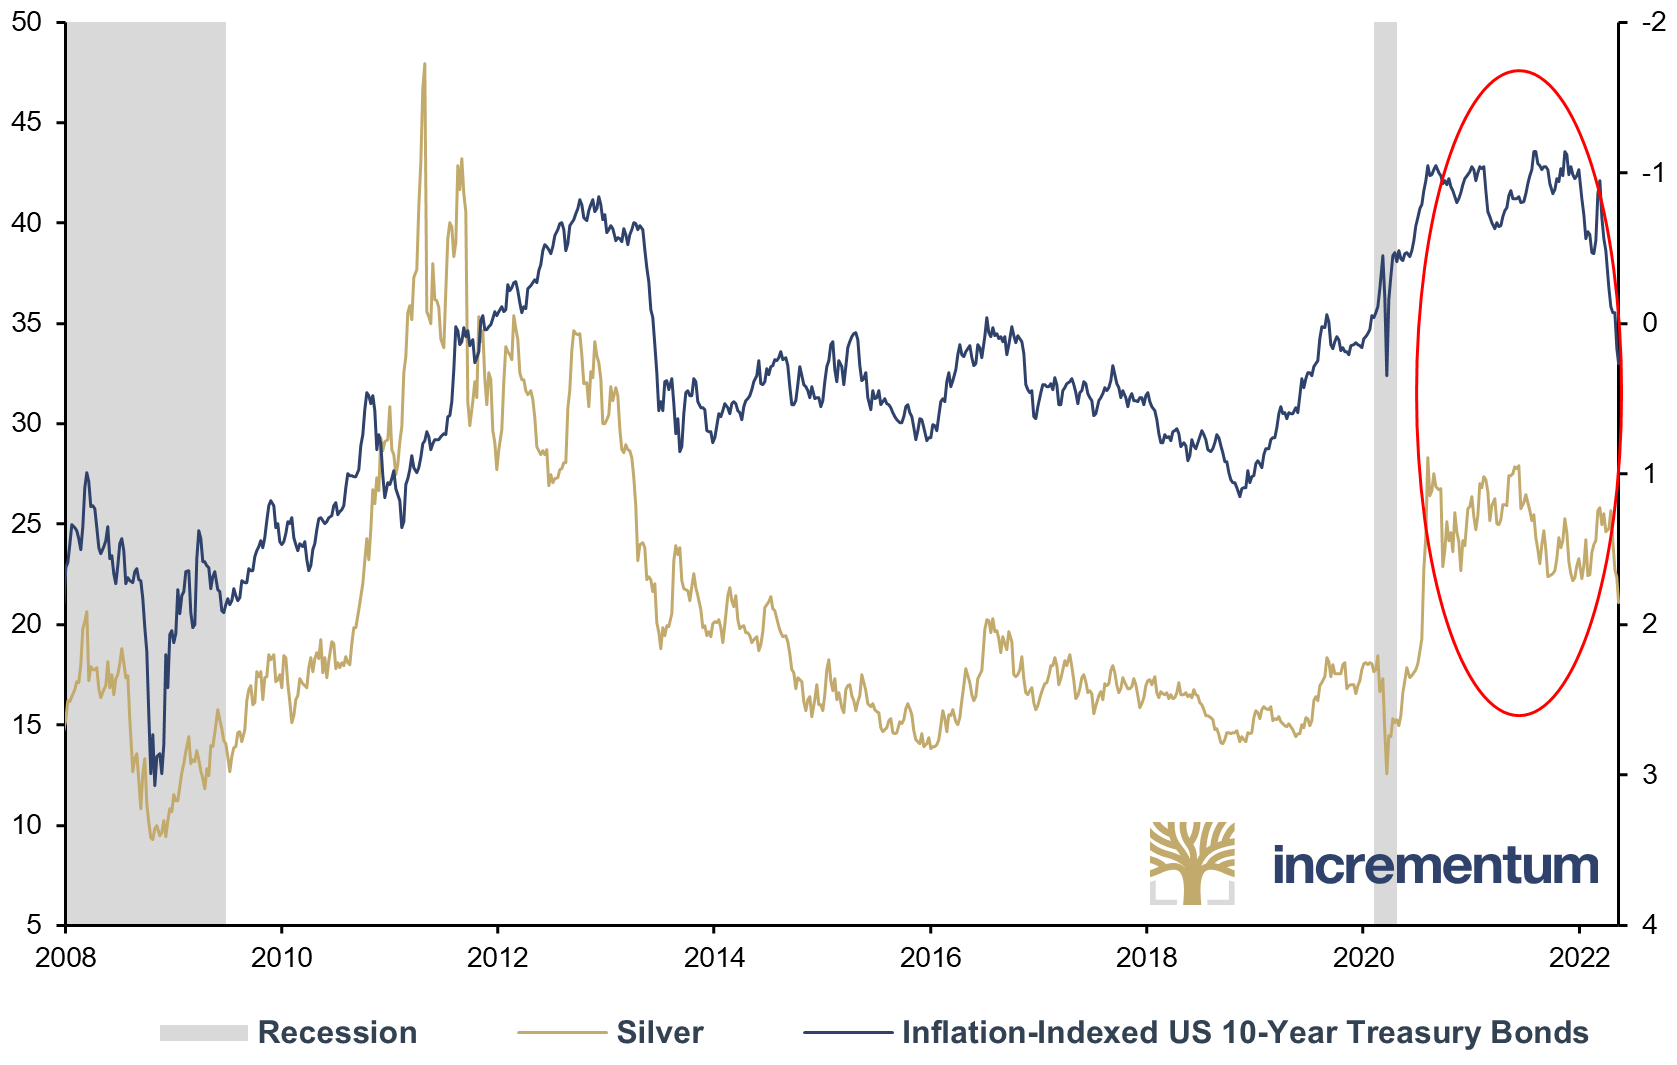
Source: Federal Reserve St. Louis, Reuters Eikon, Incrementum AG
Silver Outperforms Gold, at First
Both gold and silver stopped appreciating in US dollars when real rates stagnated in August 2020,[3] but the two metals have had very different experiences since that summer. From August 2020 through February 2021 silver outperformed gold. Why? Because markets expected monetary reflation and then economic recovery to be floated to victory on a wave of continuous wartime-like fiscal stimulus and politician-led control of the private banking system.
Silver and Gold, in USD, 100 = 31.07.2020, 08/2020-02/2021
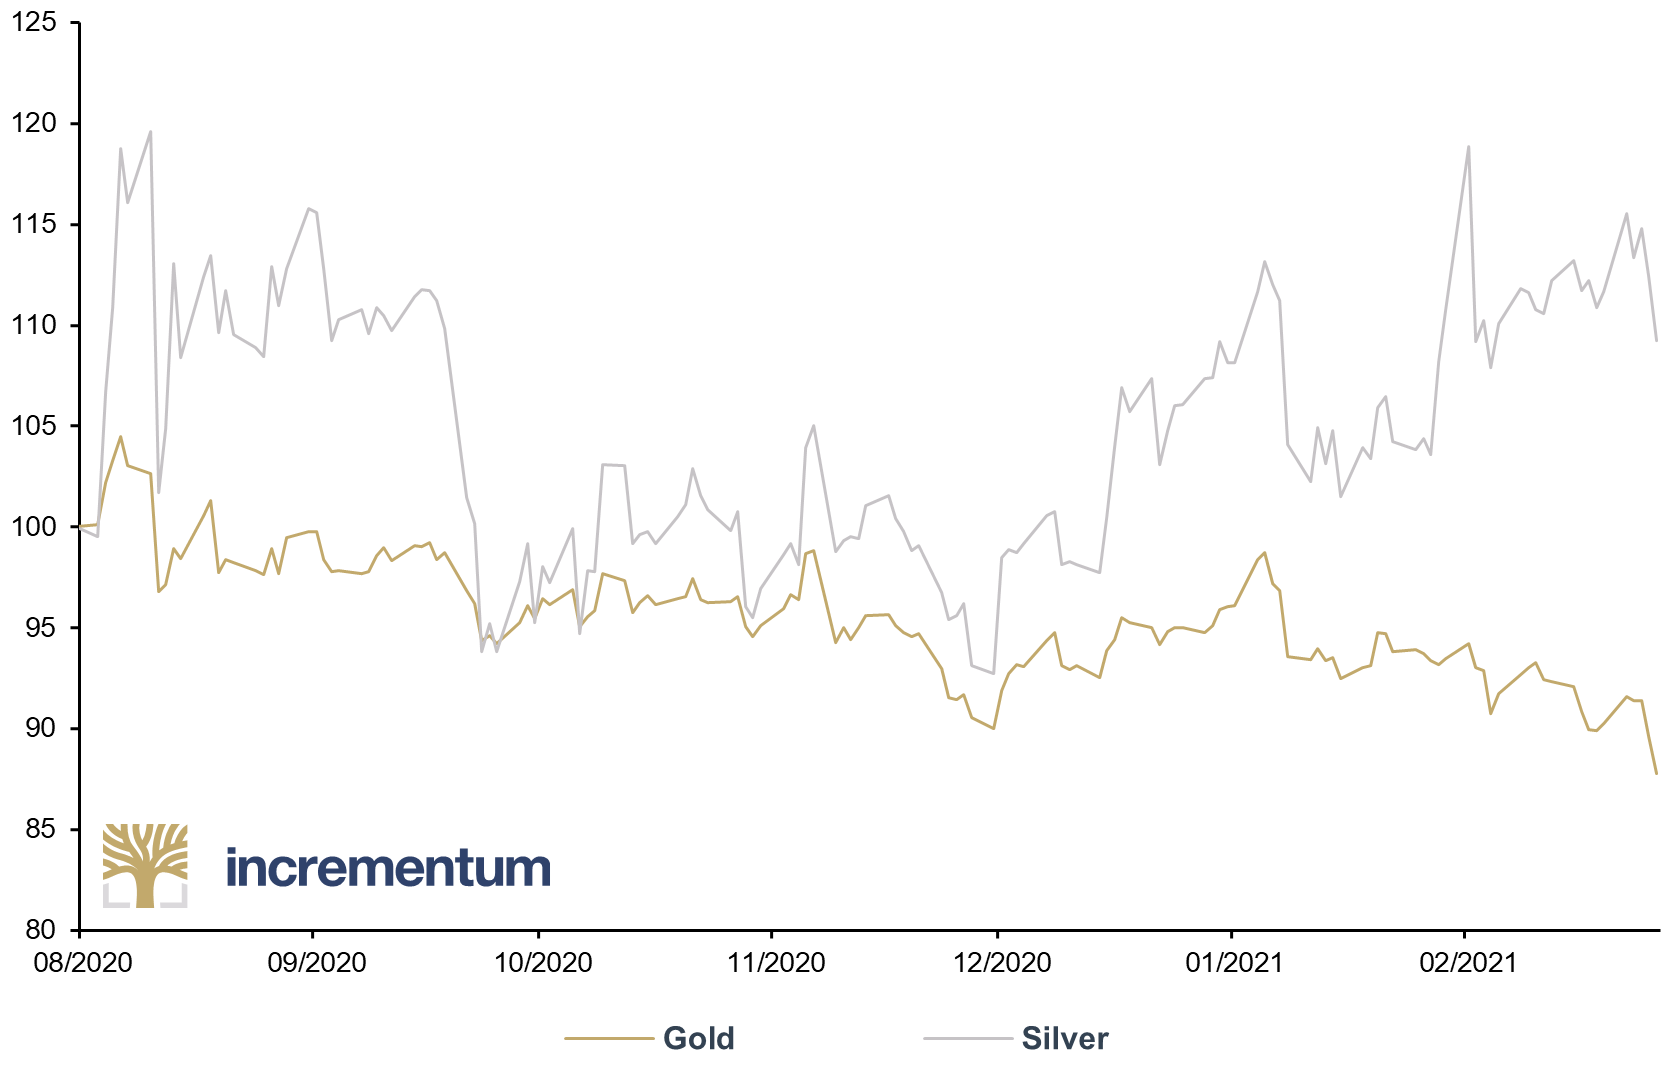
Source: Reuters Eikon, Incrementum AG
Stimulus checks! Furlough programs! Government-guaranteed bank loans! To name just a few of the programs: the UK’s Bounce Back Loan Schemes, the US’ Main Street Lending Programs, the French Prêt Garanti par L’état, the Canadian Highly Affected Sectors Credit Availability Program. All of this was to be done by politicians demonstrating that they could preserve the socioeconomic status of millions – of registered voters! No wonder silver’s higher beta to (monetary) inflation purred with satisfaction. There was a real chance that the feckless, hapless central banking policies of the past decade and a half would be abandoned.
But as more time passed it became clearer to markets that the politicians were not ready to take the world into a new socioeconomic order. Instead, elected representatives treated the economic circumstances of 2020 as a one-off, an exogenous factor to be overcome. That worldview allowed the politicos to go back to things the way they were, which they considered perfectly fine. Or, at least, more electorally safe than leading society into a new and uncertain future.
Universal Basic Income was not introduced. Modern Monetary Theory was not tried. The sovereign-bank-corporate nexus, as ECB executive board member Isabel Schnabel has called it, was not pursued. Instead, just more quantitative easing, which has failed to revive moribund economies or stoke monetary creation everywhere it has been tried for the past 20 years. There would be no monetary reflation floated to victory on a wave of provocative money expansion after all. Silver’s days of outperforming gold were numbered.
When Fedwire Snapped, Silver’s Run Ended
In late February 2021 the private banking system – the one that creates money/credit/collateral that the global economy and financial system run on – was given a terrible fright that it would not recover from: Fedwire went offline for several hours.[4]
What is Fedwire? It is a real-time gross settlement system used by banks, businesses and government for – as the Federal Reserve itself puts it – “mission-critical same-day transactions”. Mission critical. As per the Federal Reserve’s Treasury Market Practices Group:
“On Wednesday, February 24, 2021, the Federal Reserve experienced a disruption across financial services – including Fedwire® Funds, Fedwire® Securities, NSS, ACH, and Credit Risk – that lasted for approximately three hours, with service resuming at approximately 2:30 pm EST.”
What happened? We really don’t know! Or at least we haven’t been told; the authorities won’t divulge. What do the authorities know and/or want us to know? That it was not a cyberattack, as the TPMG Meeting Minutes of March 23, 2021 state: “Staff noted that the root cause behind the disruption was identified quickly by staff and was not linked to a cybersecurity incident.”
Even the IMF noted there was remarkably little information available (emphasis added):
“According to a statement from the Federal Reserve, it took steps to help ensure the resilience of the Fedwire and NSS applications, including recovery to the point of failure. No further details were provided. Fedwire resumed normal operations after the 3 to 4 hours outage.” [5]
The lack of forthrightness by the authorities and/or investigation by the financial press is a real shame, because a significant number of markets began to turn against successful reflation from that point forward. Below is a partial list of capital markets, currencies, commodities and balance sheet items that were affected:
- Treasury yield curve: Steepening since the pandemic, the curve began a yearlong (so far) retreat on February 25. The spreads started to flatten : 5yr vs. 30yr, 10yr vs. 30yr, 20yr vs. 30yr. The 2-yr vs. 10-yr spread began to flatten a few weeks later, in mid-March.
- Japanese government bonds: The 10-year yield peaked, then fell through the end of 2021.
- British gilts: The 10-year yield peaked, traded sideways, then fell through August 2021.
- Swap spreads: Both the 5- and 10-year maturity spreads stopped expanding (i.e. reflation, recovery) and began a multi-month contraction into a negative spread by June 2021. (Fixed to floating interest rate swap, spread to US Treasury rates of similar maturities.)
- Indian rupee: Strengthened against the US dollar from the depths of the Covid-19 crisis until February 24; weakened ever since.
- Australian dollar: Strengthened against the US dollar from the depths of the Covid-19 crisis until February 25; weakened ever since.
- New Zealand dollar: Strengthened against the US dollar from the depths of the Covid-19 crisis until February 24; weakened ever since.
- British pound: Strengthened against the US dollar from the depths of the Covid-19 crisis until February 24; then traded sideways, then weakened ever since.
- Reverse repurchase agreements: The Federal Reserve’s overnight Treasury security lending program experienced a sudden surge from nothing to USD 11bn, presaging a supernova explosion to USD 1.9trn by the end of 2021.
- Repo fails: Primary dealers reported a significant increase in failures to deliver and to receive US Treasury securities lasting several weeks.
- Securities lending: The Federal Reserve reported a marked increase in Treasury and federal agency debt securities lent overnight from February 24 to mid-April; securities lending would not come off a boil until July 2021.
- Copper: On an escape-velocity trajectory to outer space since the depths of the Covid-19 crisis, the metal’s flight path took a sudden hard right on February 24 and remained effectively unchanged through December 2021.
The skittish banking system reacted naturally: It flinched. Remember, it has been in a 15-year abusive relationship with a malfunctioning monetary order. It began to back away from monetary reflation and began to doubt economic recovery. So the system defaulted back to the status quo – anticipating the escalating probability of periods of monetary deflation. That environment is an unwelcome one for silver. Indeed, just two days after the Fedwire blackout, on February 26, the gold-silver ratio bottomed out.
Gold/Silver Ratio, 01/1970-05/2022
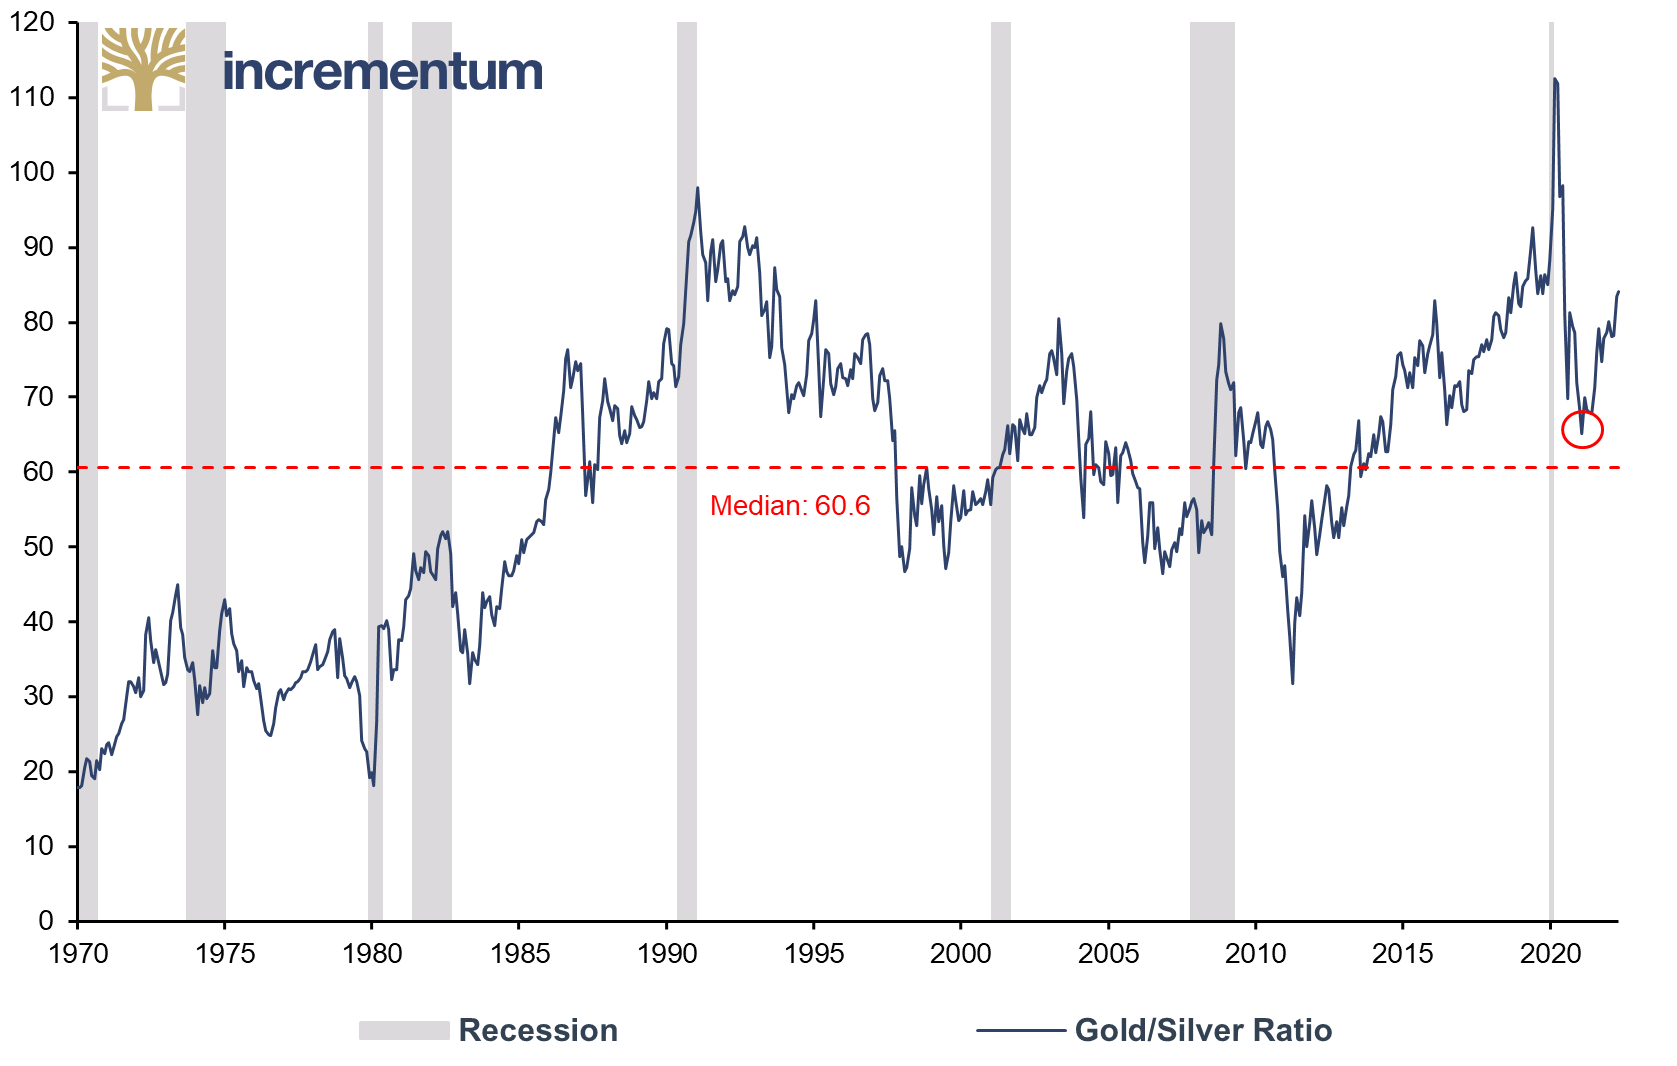
Source: Reuters Eikon, Incrementum AG
As has been explained in previous editions of the In Gold We Trust report,[6] a rising ratio signals deflationary monetary circumstances – the kind one observes during global depressions and great monetary scarcity. A falling ratio, i.e. silver gaining in relative value, signals the opposite, an expansion in monetary supply.
A rising ratio and the underperformance of silver makes complete sense from that perspective. The monetary conditions had flipped from reflation to retrenchment. The economy continued its recovery – such as it was – but monetary matters had now turned against silver. The monetary warnings have only escalated since then: The US dollar began its tightening appreciation in June 2021, the eurodollar futures curve inverted on December 1, 2021, and the US Treasury yield curve inverted, (2-year versus 10-year yield) on April 1, 2022.
Monetary Metal in a Monetary Deflationary Context
But how can we explain the rise in consumer price indices and not lay it at the feet of an expanding monetary base? Why didn’t silver rally, with all this inflation? Because it wasn’t monetary inflation, it was an increase in consumer prices. That increase was brought about by supply/demand imbalances and shocks, not by an expansion in money supply. How can we be sure?
- Because we have observed for two decades the Bank of Japan and Ministry of Finance pursuing an awe-inspiring expansion of base money and Godzilla-like deficit spending.
- Because we have observed for 15 years the Federal Reserve and Treasury Department super-sizing policies of quantitative easing and stimulus.
- Because we have observed seven years of the ECB and capitals of Europe raining bank reserves and raising public debt-to-GDP ratios to Brobdingnagian proportions.
In each and every case, consumer prices effectively did the opposite of what authorities wanted: They remained muted and/or fell. Not until supply chains were repeatedly electroshocked and economies randomly turned on and off like light switches did we witness consumer price rallies.
Was the increase in consumer prices due to the ‘money printer go brr’ thing that has not worked for a generation? Or is it more likely that it was the sledgehammer taken to a logistics plan designed for expanding globalization? A plan turned all the way up to 11 for maximum efficiency and minimum resiliency.
Optimism for the Future
Silver prices will rise in concert with persistent, pervasive monetary inflation. That is not what we have been witnessing, but surely it is not far away. Silver’s future is bright because the future is inflationary, as this is the most humane and politically feasible option for dealing with inequality and private/public debt burdens.
The next crisis is already upon us – Russia/Ukraine/NATO – and surely the far-reaching consequences will convince leaders that the old order – quantitative easing, globalization, WW2-era institutions – is to be abandoned and a new one – government-guaranteed bank loans, local supply, Universal Basic Income – to be fashioned. And even if it is not the present crisis in Eastern Europe, there are any number of other candidates queueing up in this our Fourth Turning[7] that will force politicians’ hands to fully embrace inflation.
To know when we’ve tacked the good ship towards a new inflationary horizon, keep an eye on politicians’ announcements in favor of:
- picking winners, e.g. on March 15, 2022 Australia’s Energy and Industry Minister announced a AUD 240mn investment in the rare earths metals industry,
- and losers, e.g. on March 19, 2022 Italy’s Mario Draghi announced windfall taxes on Italian energy companies;
- disabling markets, e.g. on March 17, 2022 Italy’s Ignazio Visco stated “Administered prices for a small period of time would not be a bad idea”;
- localizing industry, e.g. on March 16, 2022 the EU’s Valdis Dombrovskis announced tariffs against Indonesian and Indian steel;
- guaranteeing bank loans, e.g. on March 16, 2022 France’s Jean Castex expanded and prolonged the state guarantees of bank loans originally created to deal with the Covid-19 crisis.
Silver Supply Buoyed by Mexico and Peru
Let us now give you a brief overview of the most recent developments in supply and demand of silver. Overall supply, including both fundamental and speculative, grew 5.6% in 2021 to 1,025 million ounces (Moz). Analysts anticipate that tally will rise 4.3% in 2022 to 1,069 Moz. But the big picture takeaway is that total silver supply has remained effectively unchanged since 2010, averaging 1,037 Moz per year from 2010 through 2021. This stagnation extends out through to 2025, which the industry consensus has penciled in for 1,100 Moz – not materially different than 2010’s 1,079 Moz.
Total Silver Supply, in Moz, 2010-2025e
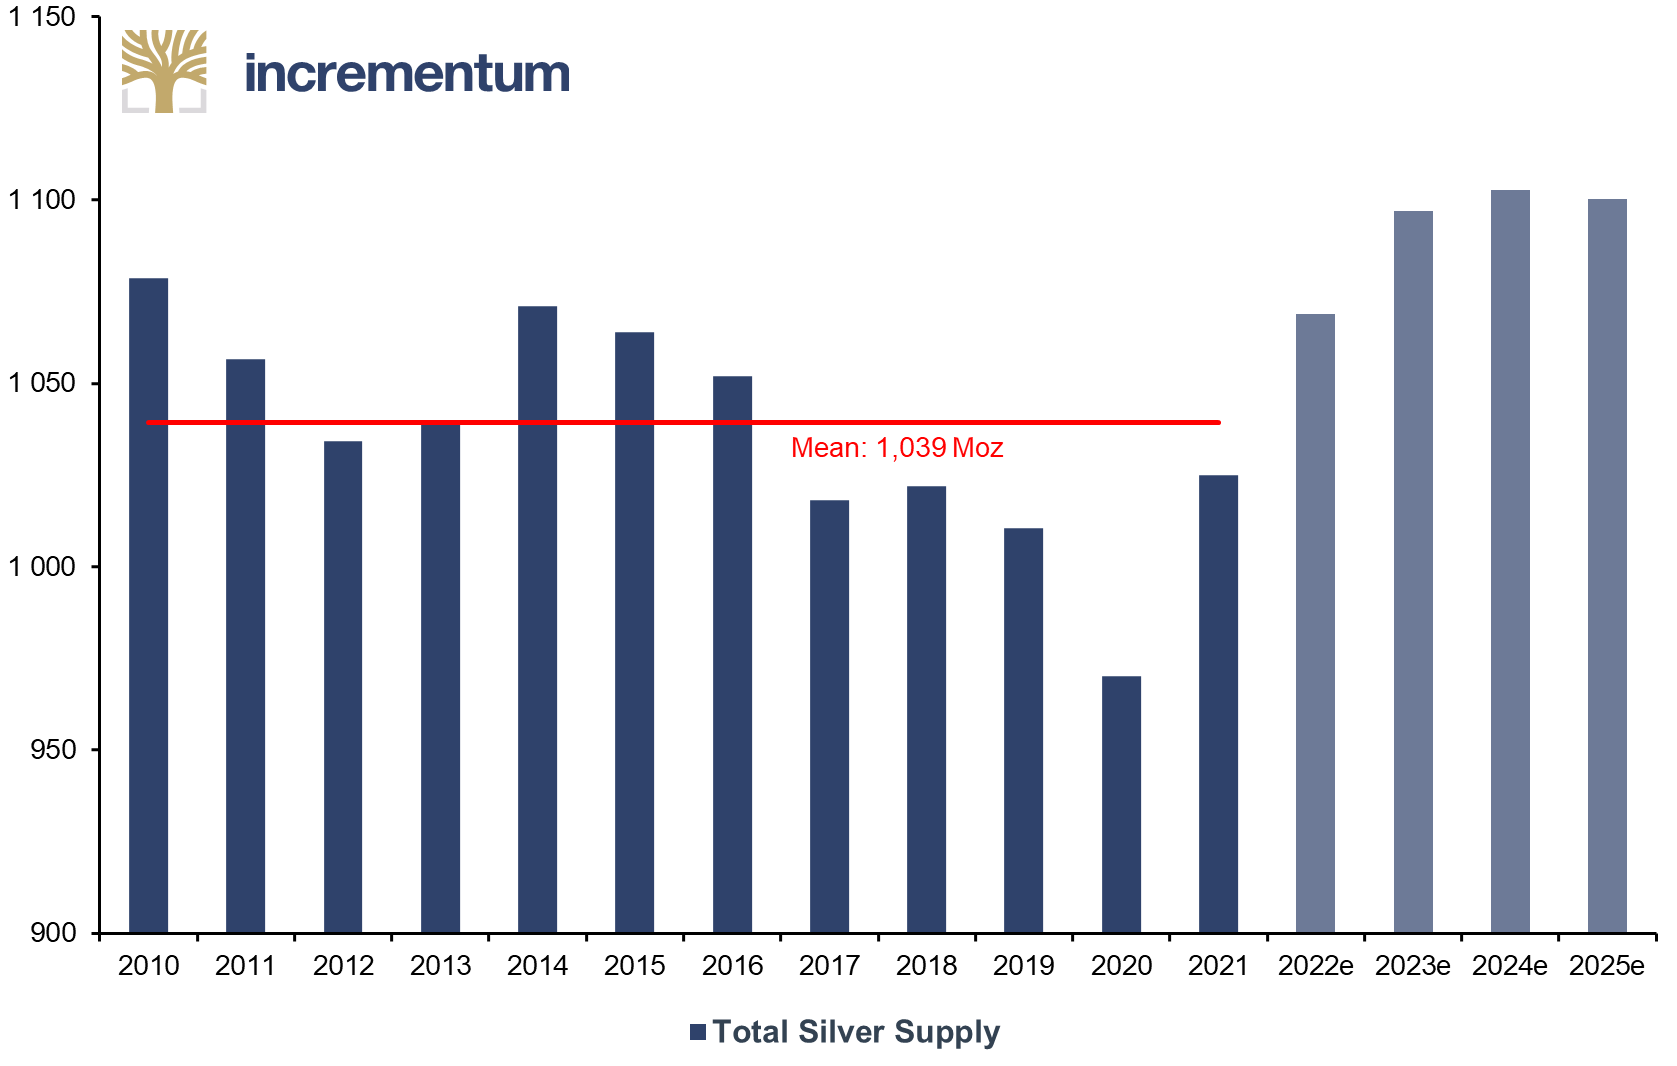
Source: Silver Institute, Incrementum AG
Mine supply clawed most of its 2020 losses back last year, rising to 827 Moz from 780; the 2019 total was 836 Moz. The consensus analysis forecast is that mine production will rise to a six-year high in 2022 of 879 Moz and then breach the 900 Moz barrier for the first time in recorded history the following year.
Mine Supply, in Moz, 2010-2025e
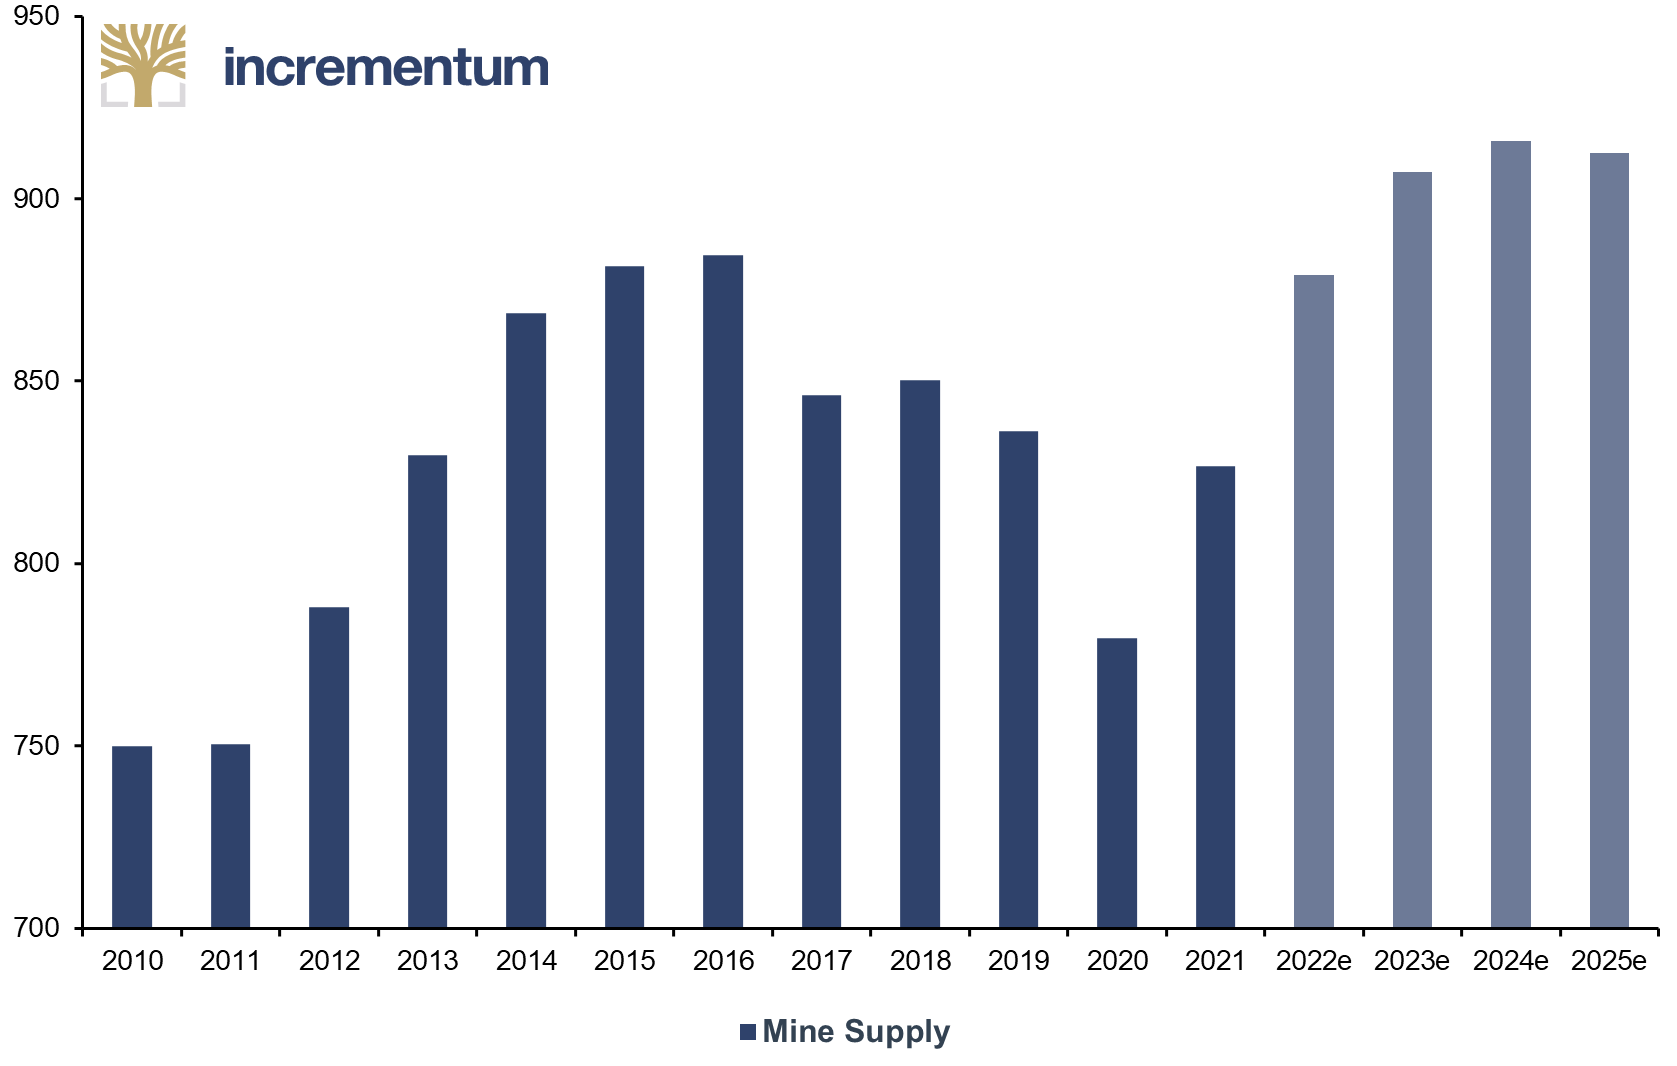
Source: Silver Institute, Incrementum AG
Analysts expect Mexico and Peru, the world’s top two producers, to account for just under one-third of global supply and increase production during 2021 by 10.6% and 7.5%, respectively. China is the only other country with a double-digit market share in global production; it is estimated to produce 2.2% more in 2022 than last year.
Mine Supply by Country, in Moz, 2010-2025e
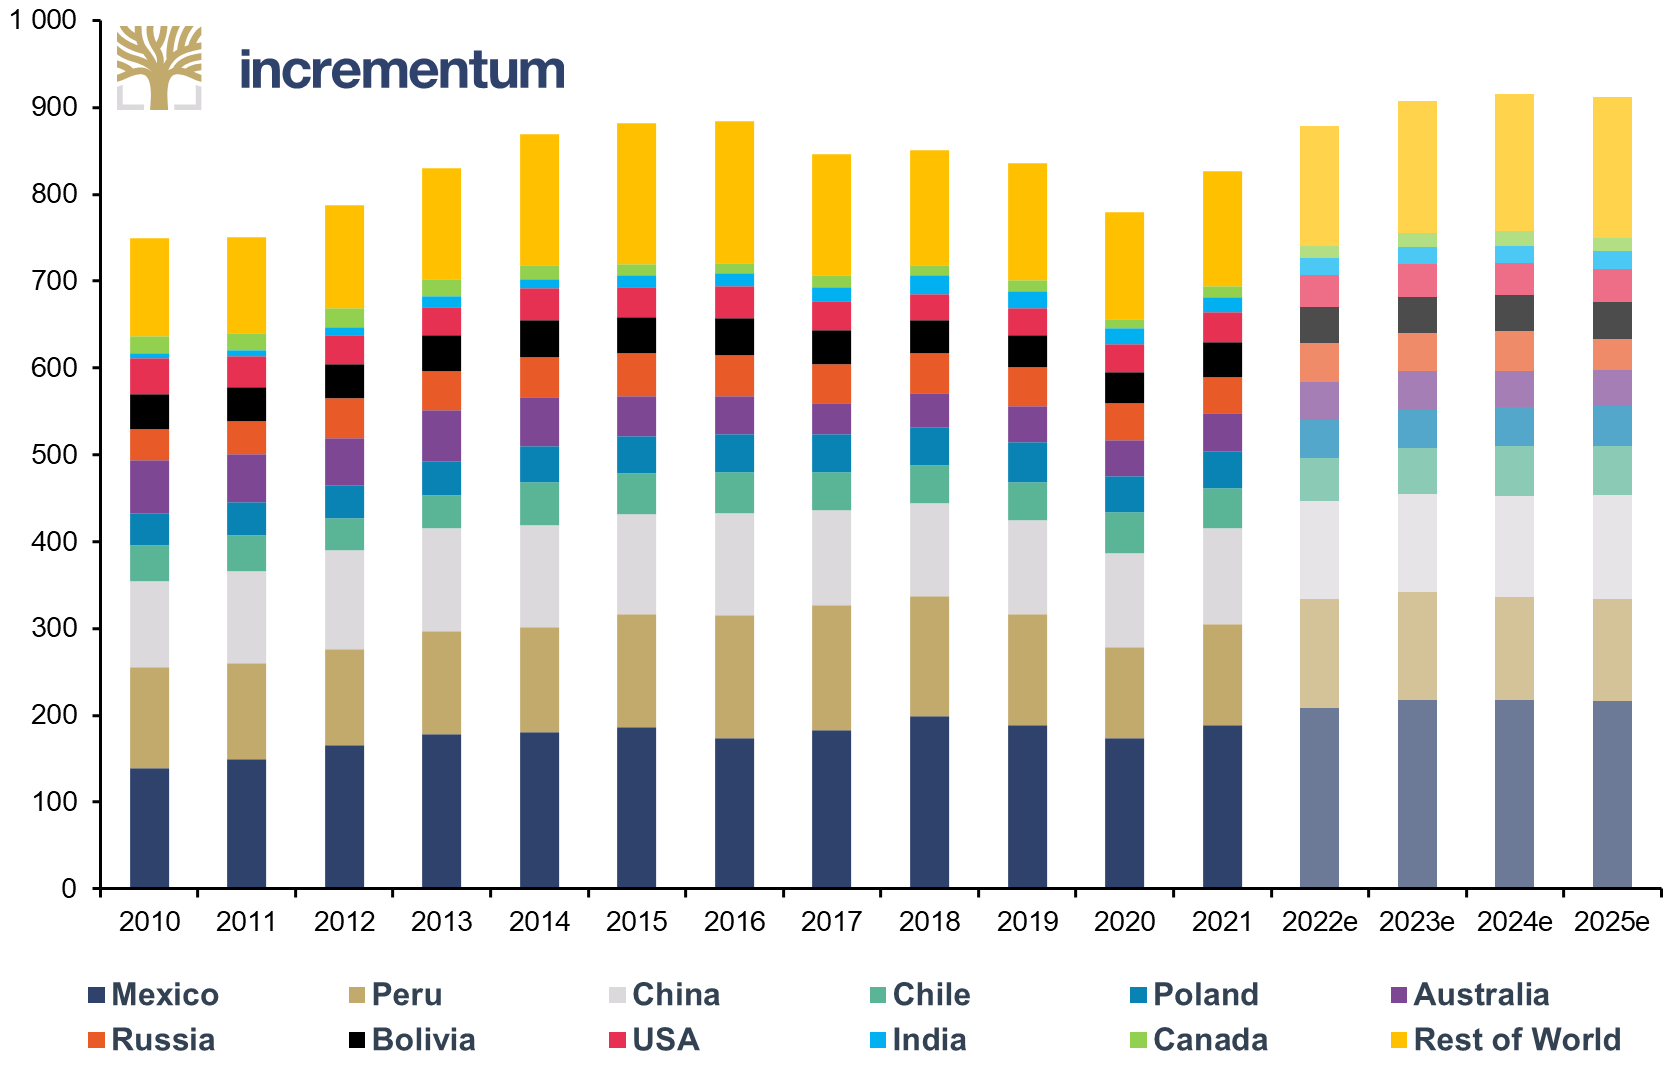
Source: Silver Institute, Incrementum AG
Secondary supply consists of industrial and photographic scrap along with the recycling of jewelry, coins and silverware; it accounts for just under one-fifth of total supply. Analysts forecast this category of supply to shrink year-over-year by 4.9% in 2022.
Speculative silver supply consists of exchange-traded products, commodity exchange inventories, precious metal dealer inventories, and/or mining company hedging and is forecast to be an immaterial 2 Moz in 2022. This is clearly encouraging because it tells us these financial market participants do not expect to be selling silver.
Silver Demand Forecasts Are Way Off
It seems more likely that industrial and ornamental demand will be somewhere between weak and meek in 2022 rather than match the zoom-to-boom consensus outlook. Despite peculiarly optimistic estimates about the global economy and consumer finances, analysts expect demand to outstrip supply in 2022 (and for every year thereafter, through to 2025). The coming year is set to use 1,204 Moz of silver, resulting in a 135 Moz annual deficit in supply relative to demand. Those ounces will have to come from above-ground stock, which is estimated to be around 3,200 Moz.
Above-Ground Stock (lhs), in Moz, and Market Balance (rhs), in Moz, 2010-2025e
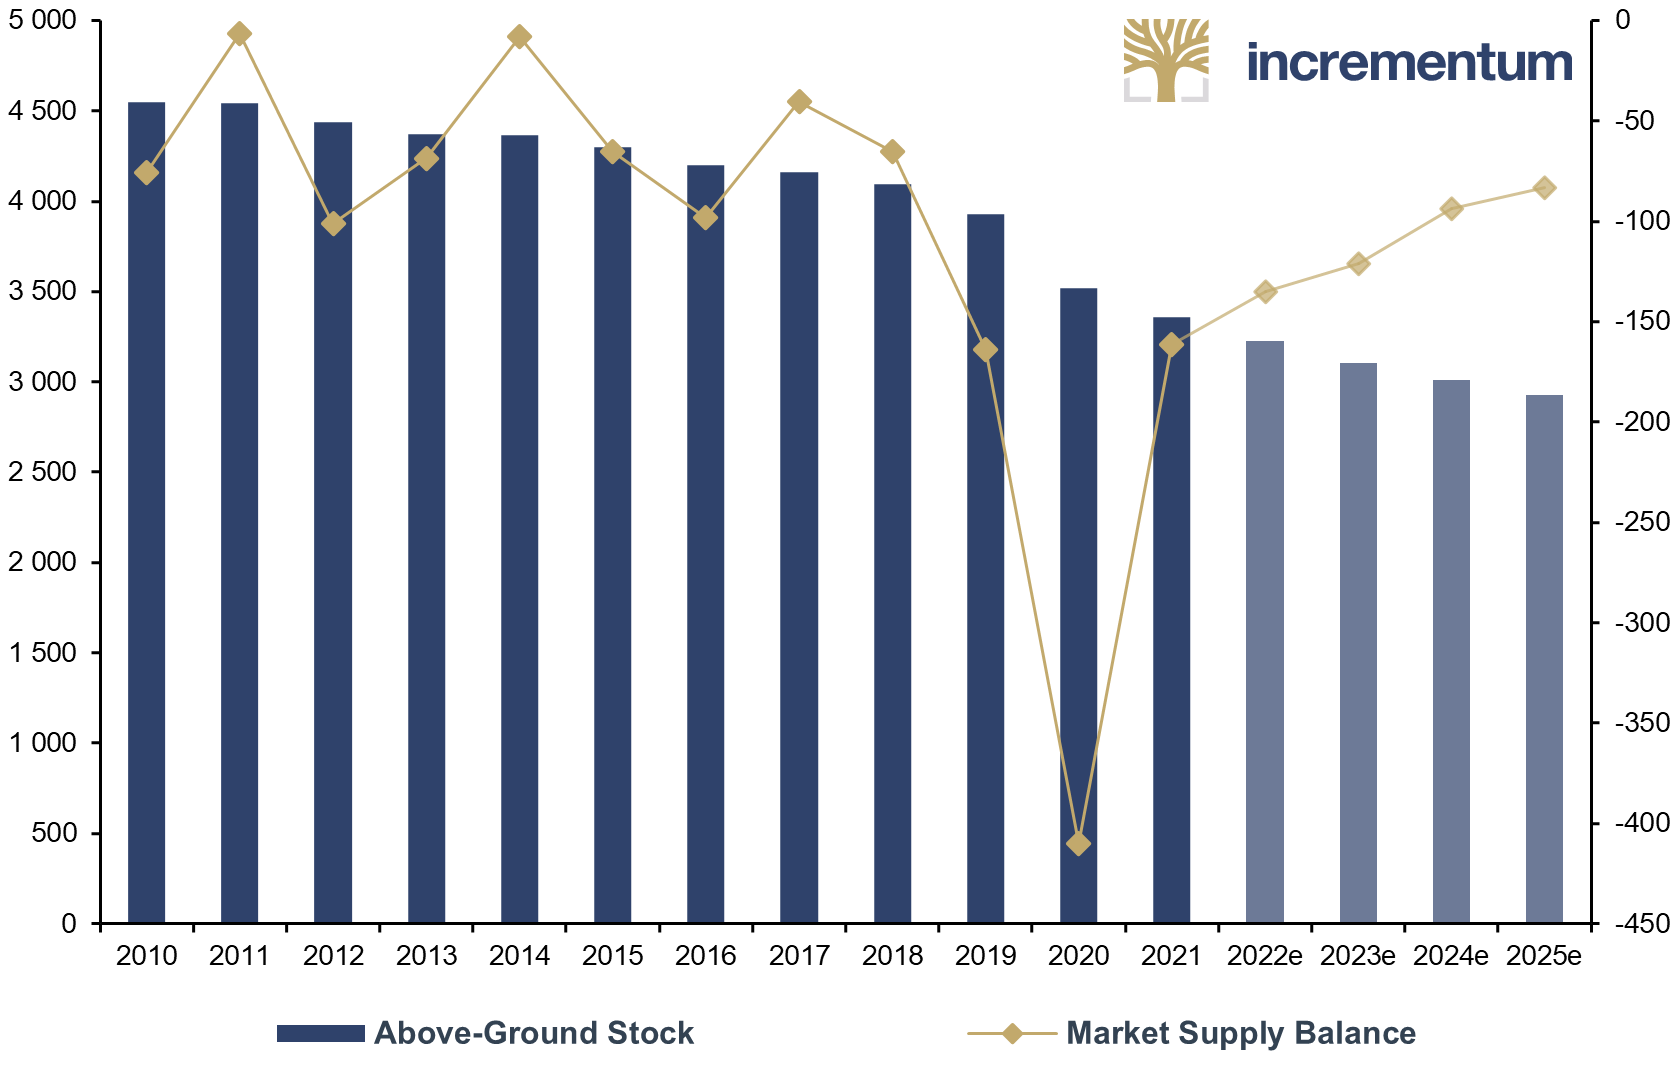
Source: Silver Institute, Incrementum AG
Approximately 55% of demand is for industrial purposes in categories such as “electrical, electronics, batteries”; “Brazing and Soldering Alloys”; and “Catalyst for Ethylene Oxide”. Industrial users include solar panel and vehicle manufacturers. Industrial demand grew 5.9% in 2021, and analysts expect another truly impressive year, estimating 5.0% growth for 2022. The automotive and 5G segments will accelerate growth rates in 2022 to 17.3% and 21.3%, respectively, according to the consensus outlook. For us, it is hard to understand why analysts are so optimistic when Europe is rationing energy, China is pursuing zero-Covid policies, emerging markets are confronting a food shortage, and the United States is predicted to fall into a recession.
Photographic demand is in a secular downtrend and will shrink by just under 7%. The analyst outlook is for ornamental demand to increase strongly in 2022. Silverware and jewelry are expected to increase 7.3% after already rising 12.0% in 2021. Ornamental demand is 24% of overall demand. These estimates are astonishing, because this category grows when consumers are experiencing rising levels of income and are optimistic about their economic future. It is not clear to us how analysts have come to the conclusion that such a cheery future lies directly ahead.
Financial demand consists of government and private purchases of silver coins, medals and bars; it takes 18% of the overall demand pie. The consensus forecast is that this category will only rise 3.0% in 2022. With consumer prices at such high levels, war in Europe, the global order in retreat, and markets like US Treasuries and eurodollar futures predicting more economic trouble directly ahead, it is – again – hard to understand why mainstream economists are so negative on financial demand. At least they are consistent: A booming economy leads to rising industrial and ornamental demand and falling financial demand. The only booms on the horizon your authors see are destructive explosions.
Speculative demand is the last category of silver demand and includes exchange-traded products, commodity exchange and precious metal dealer inventories, as well as mining company hedging. It is 9% of the global silver demand total. Here again rosy predictions for socioeconomic order and geopolitical fraternity have encouraged the consensus to predict a 21.5% decrease in demand.
Demand by Category, in Moz, 2010-2025e
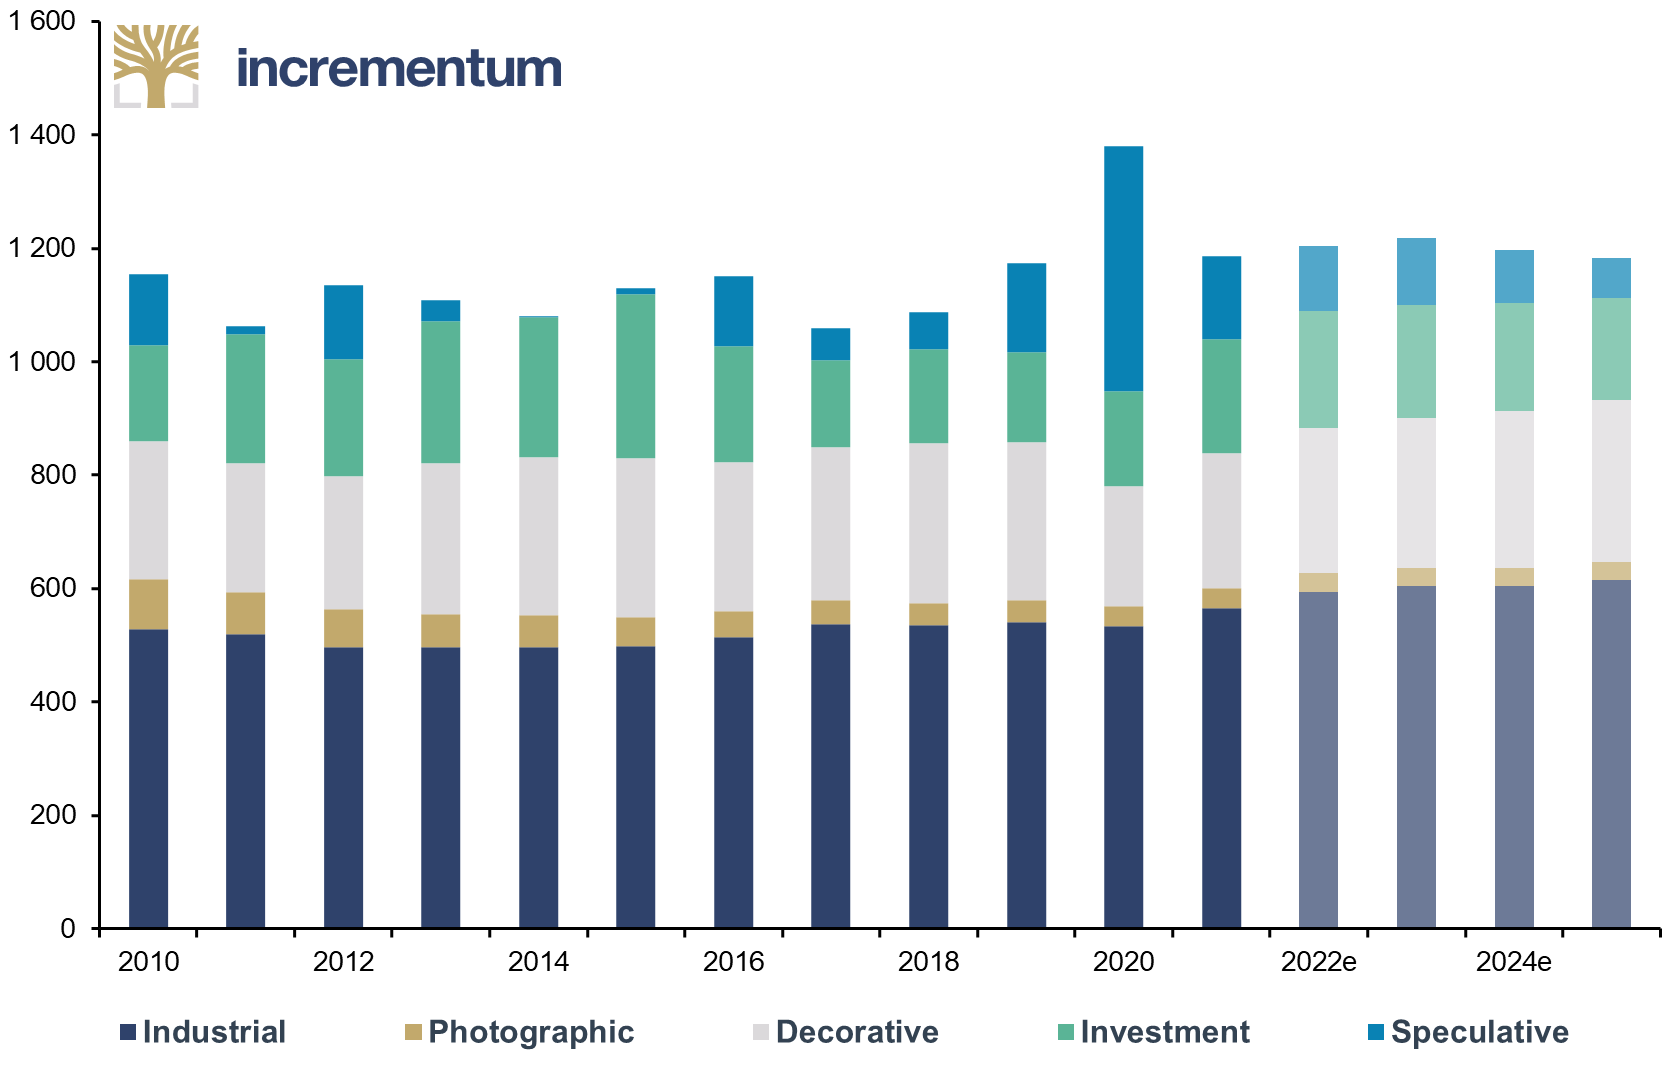
Source: Silver Institute, Incrementum AG
Conclusion
If past cycles are anything to go by, silver will be pulled along by gold throughout the 2020s as we experience geopolitical and socioeconomic upheaval. That means consumption by individuals (e.g. coins, bars), institutions (e.g. financial market inventories), and governments (reserves). Then silver will take over and be pushed forward by the hot winds of inflation for a decade or two as governments burn off private and public debt levels via financial repression. We are bullish on silver through to the 2040s, but after that you’re on your own.
Silver (Nominal), and Silver (Inflation Adjusted – April 2022), in USD 01/1971-04/2022
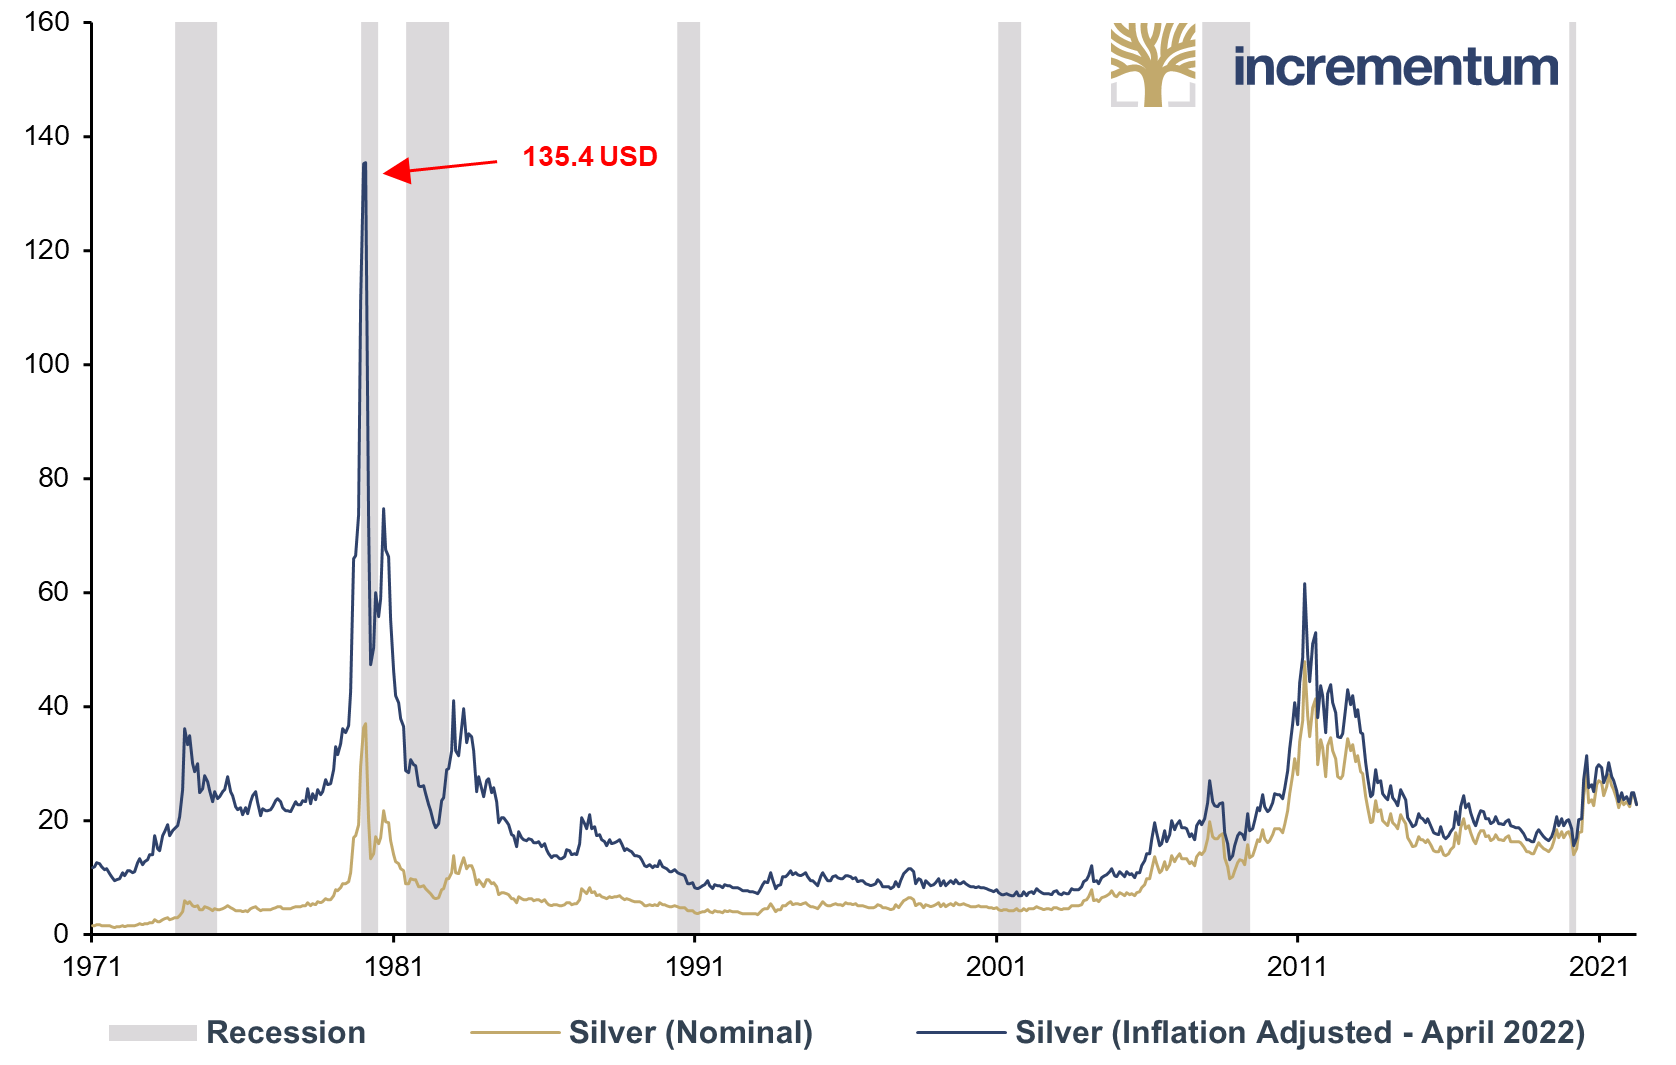
Source: Nick Laird, Reuters Eikon, Incrementum AG
[1] See “How Bankers Turned Money into ‘Σ 0 ∞ € ¥’,” In Gold We Trust report 2021
[2] The mainstream financial community’s name for the third attempted recovery from the Global Financial Crisis. The first two were called Green Shoots (2009-11) and Global Growth (2013-14). Each was brought to an ‘unexpected’ end by another “unexpected” bout of money/credit/collateral scarcity or shortage.
[3] Gold, denominated in US dollars, is typically even more strongly correlated (inversely) to real rates (US 10-year Treasury) than silver.
[4] See “How Bankers Turned Money into ‘Σ 0 ∞ € ¥’,” In Gold We Trust report 2021
[5] Khiaonarong, Tanai, Leinonen, Harry and Rizaldy, Ryan: “Operational Resilience in Digital Payments: Experiences and Issues,” IMF Working Paper, No. 2021/288, December 10, 2021, p. 34
[6] All previous In Gold We Trust reports can be found in our archive.
[7] See “From Decades Where Nothing Happens to Weeks Where Decades Happen,” In Gold We Trust report 2021