Searching for the Silver Bullet: An Analysis of Silver Price Catalysts
“It’s hard to find a better-looking chart, in my view, particularly with over 50 years of historical perspective. After a strong performance in 2024, I believe 2025 will be the year that silver will finally take out its highs from 1980.”
Tavi Costa
- With a 5th consecutive annual supply deficit of -117.6 Moz forecasted for 2025, the silver market will have been short a cumulative 800 Moz from 2021 to 2025 –- equivalent to an entire year’s worth of mine supply.
- Facilitated by the continued adoption of silver-laden TOPCON solar panels, silver offtake from photovoltaics reached an all-time high of 197.6 Moz in 2024, tipping total silver industrial demand to a record 680.5 Moz.
- The future of silver demand growth shines bright, with Samsung holding the keys to a silver-based solid state battery that promises to deliver double the energy density of leading LFP and NCM alternatives.
- As always, silver’s propensity to hitch a ride on the coattails of big brother gold will be the principal determinant of its outperformance. Bullishly, a simple reversion to the mean gold silver ratio since 1970 would derive USD 55 at a USD 3,300 gold price.
Expectations vs. Reality: A Lesson from Warren Buffett
Legendary value investor Warren Buffett purchased 129.7 Moz of physical silver between 1997 and 1998 at approximately USD 5 per ounce – equivalent to a staggering 25% of the annual silver mine supply. Buffett’s rationale for the purchase was grounded in the laws of fundamental analysis that guide commodities investors today. Namely, he believed that the “equilibrium between silver supply and demand was only likely to be established by a somewhat higher price”.
By 2006, Berkshire Hathaway had exited their silver position at USD 10, locking in a respectable double, or an average annualized return of 8.5% across the 8-9 years. Of course, the silver price went on to rise a further 400% between its humble 2006 price of USD 10 and its USD 50 peak in 2011. Had Buffett held on until this point, Berkshire would have clocked an outlandish 900% total return from dipping their toes in the silver market, equating to an average return of 18.5% per year.
Notwithstanding this, the same 94-year-old former richest man in the world also once said, “The secret to happiness is having low expectations”. Incidentally, Buffett’s salient wisdom wouldn’t go amiss with the long-suffering Manchester United fans, who hopelessly long for a return to the ecstasy of the 1999 treble win yet remain forlorn with the toothless, lackluster performances served up at Old Trafford each week in 2025.
More to the point, the silver stacker’s dilemma isn’t too dissimilar: Accustomed to the explosive bouts of jubilation from past bull markets in 2011 and 1980, many silver investors are left wanting for the superlative returns of the past. As such, they dream of the day when silver will skyrocket to USD 300 and remain forever disappointed by anything materially less – just as Manchester United fans pine for a return to the era of footballing domination under the great Sir Alex Ferguson.
In doing so, both parties may have become blind to the more recent successes they’ve experienced. In the case of Manchester United, the club has won 6 major trophies since 2013 – a level of silverware that most English football supporters would kill for. Suffice to say, silver’s highly respectable performance has largely gone under the radar, even though it outperformed gold over the past five years.
Gold and Silver, in USD, 100 = 04/30/2020, 05/2020–04/2025
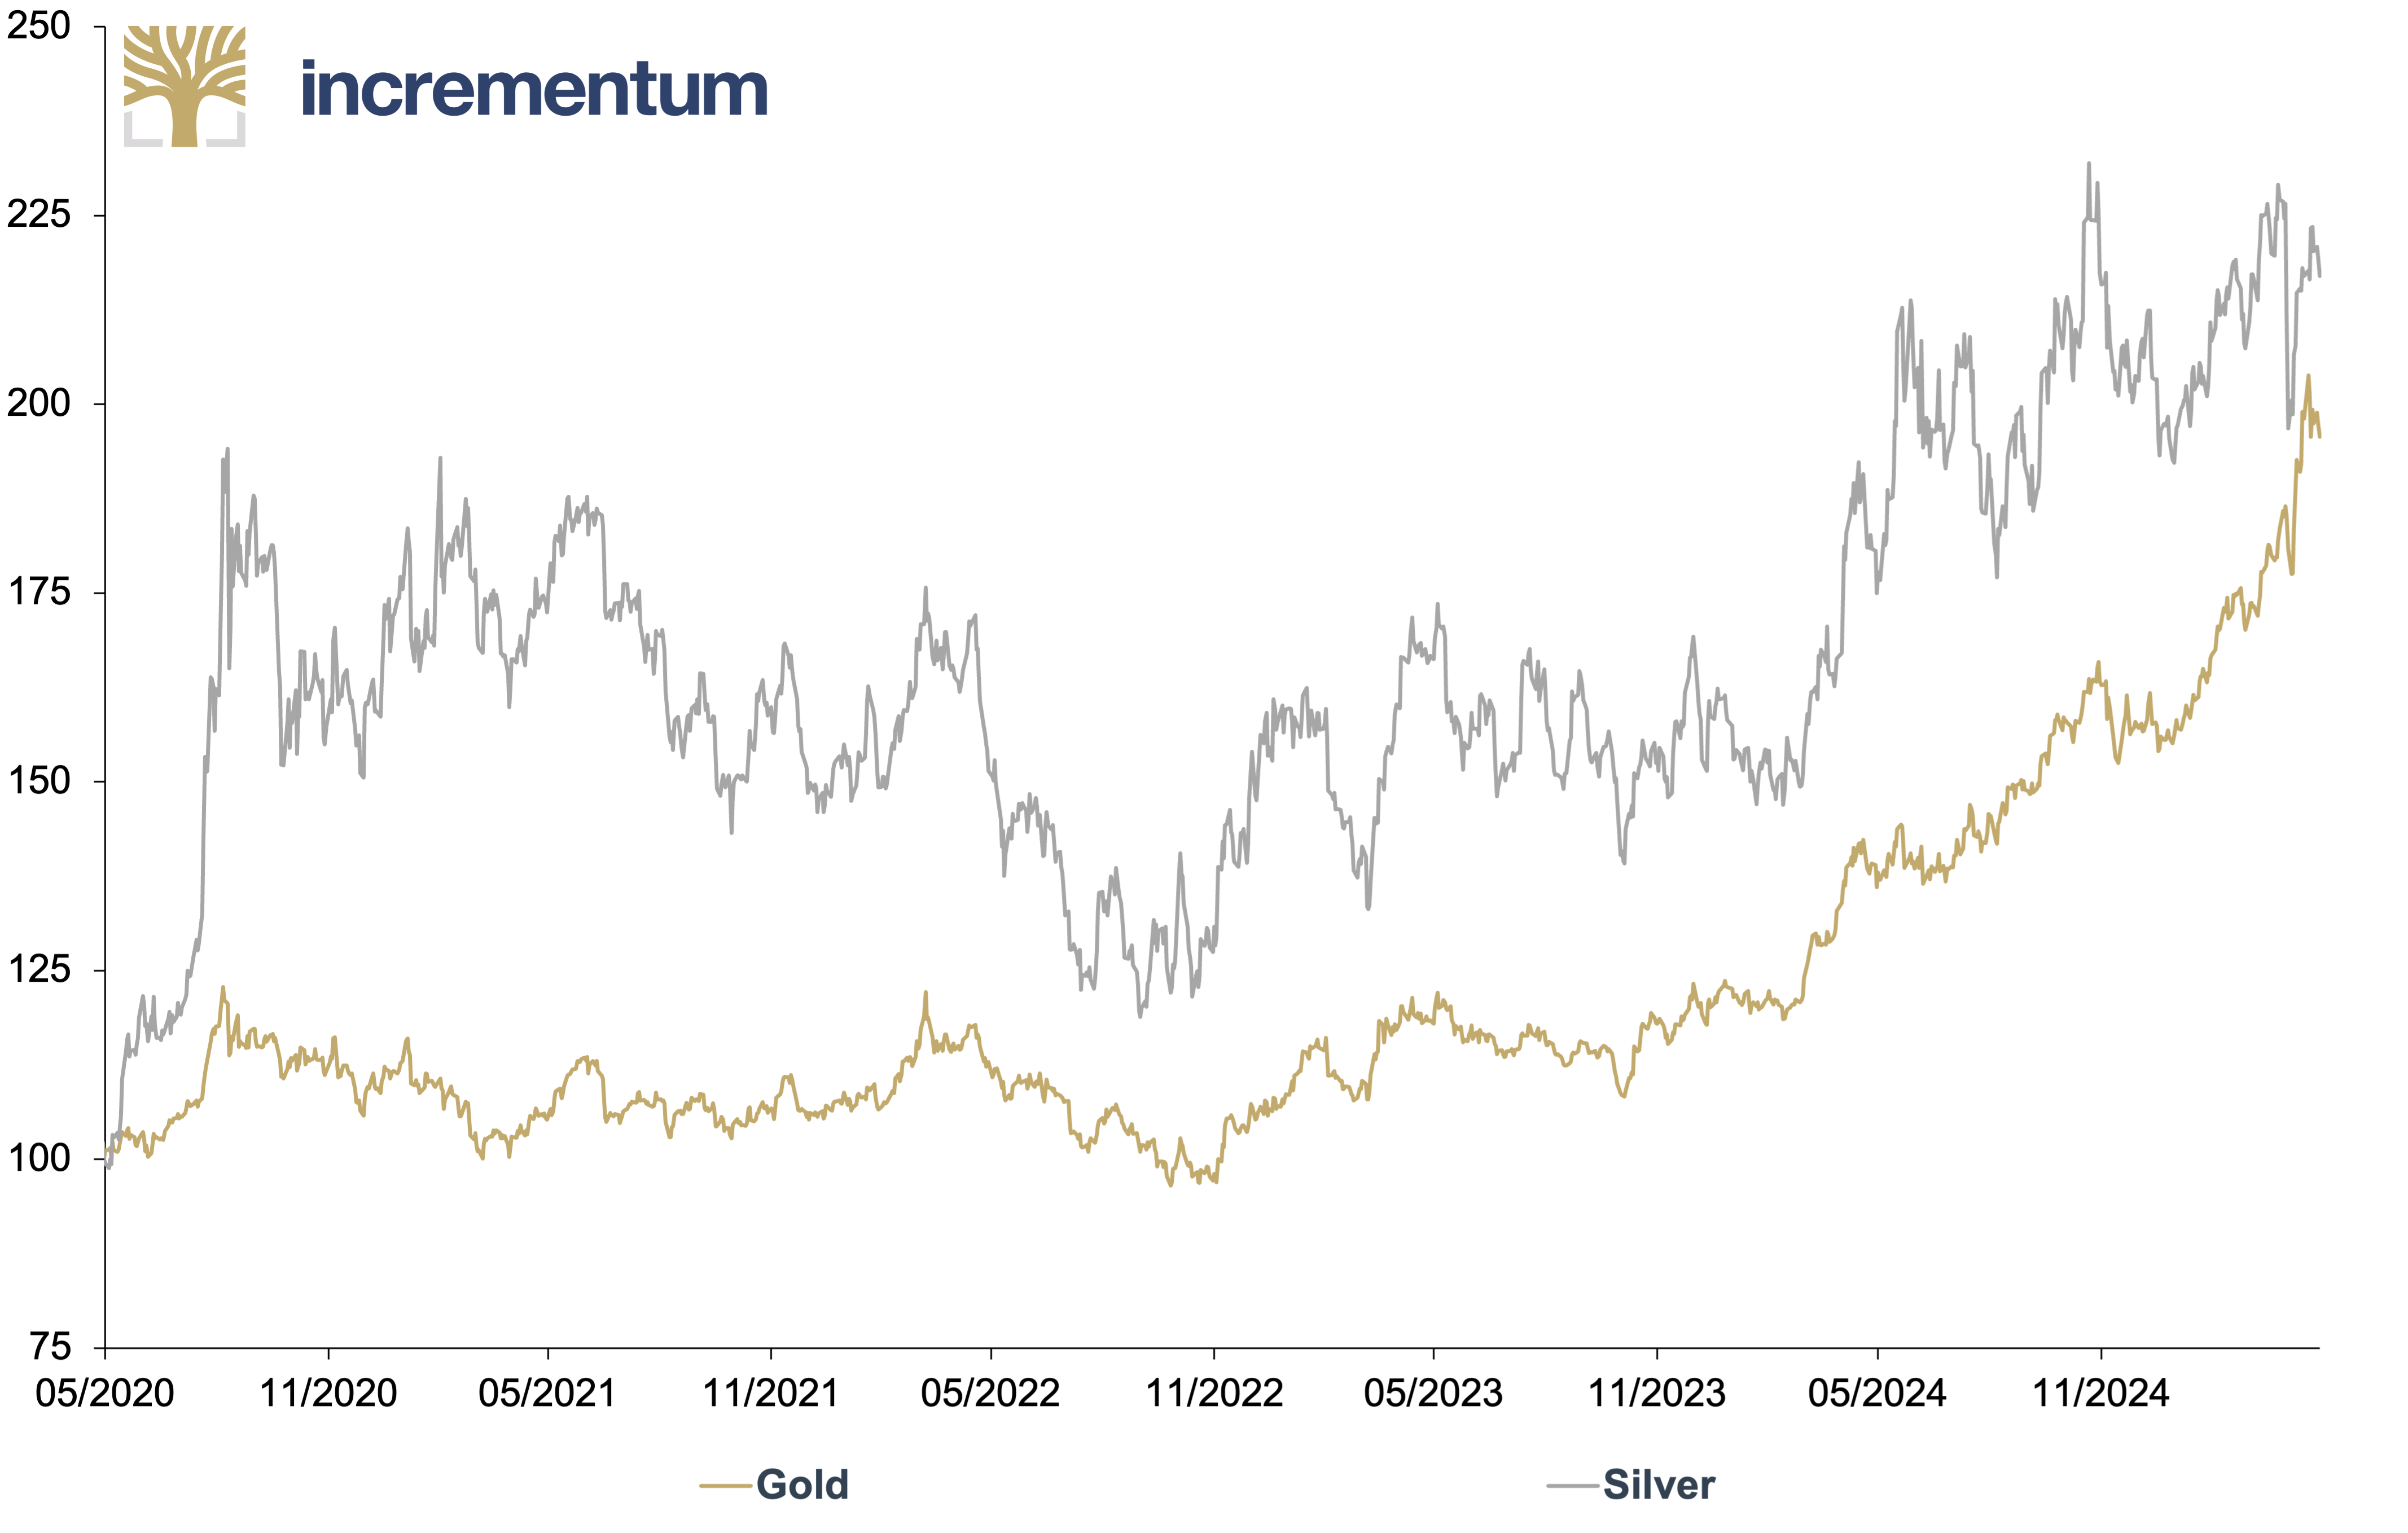
Source: LSEG, Incrementum AG
Despite these plaudits, silver remains historically undervalued relative to gold. This relative discount is best exemplified by the gold/silver ratio, which historically averaged as low as 2 during Ancient Egyptian times. Nowadays, of course, silver’s decoupling from the monetary system makes for a more sobering ratio of 100. This activation point was only breached two times in modern history, serving as a springboard for silver’s subsequent 4x outperformance of gold in 1991 and 2020.
Gold/Silver Ratio, 1900–2025
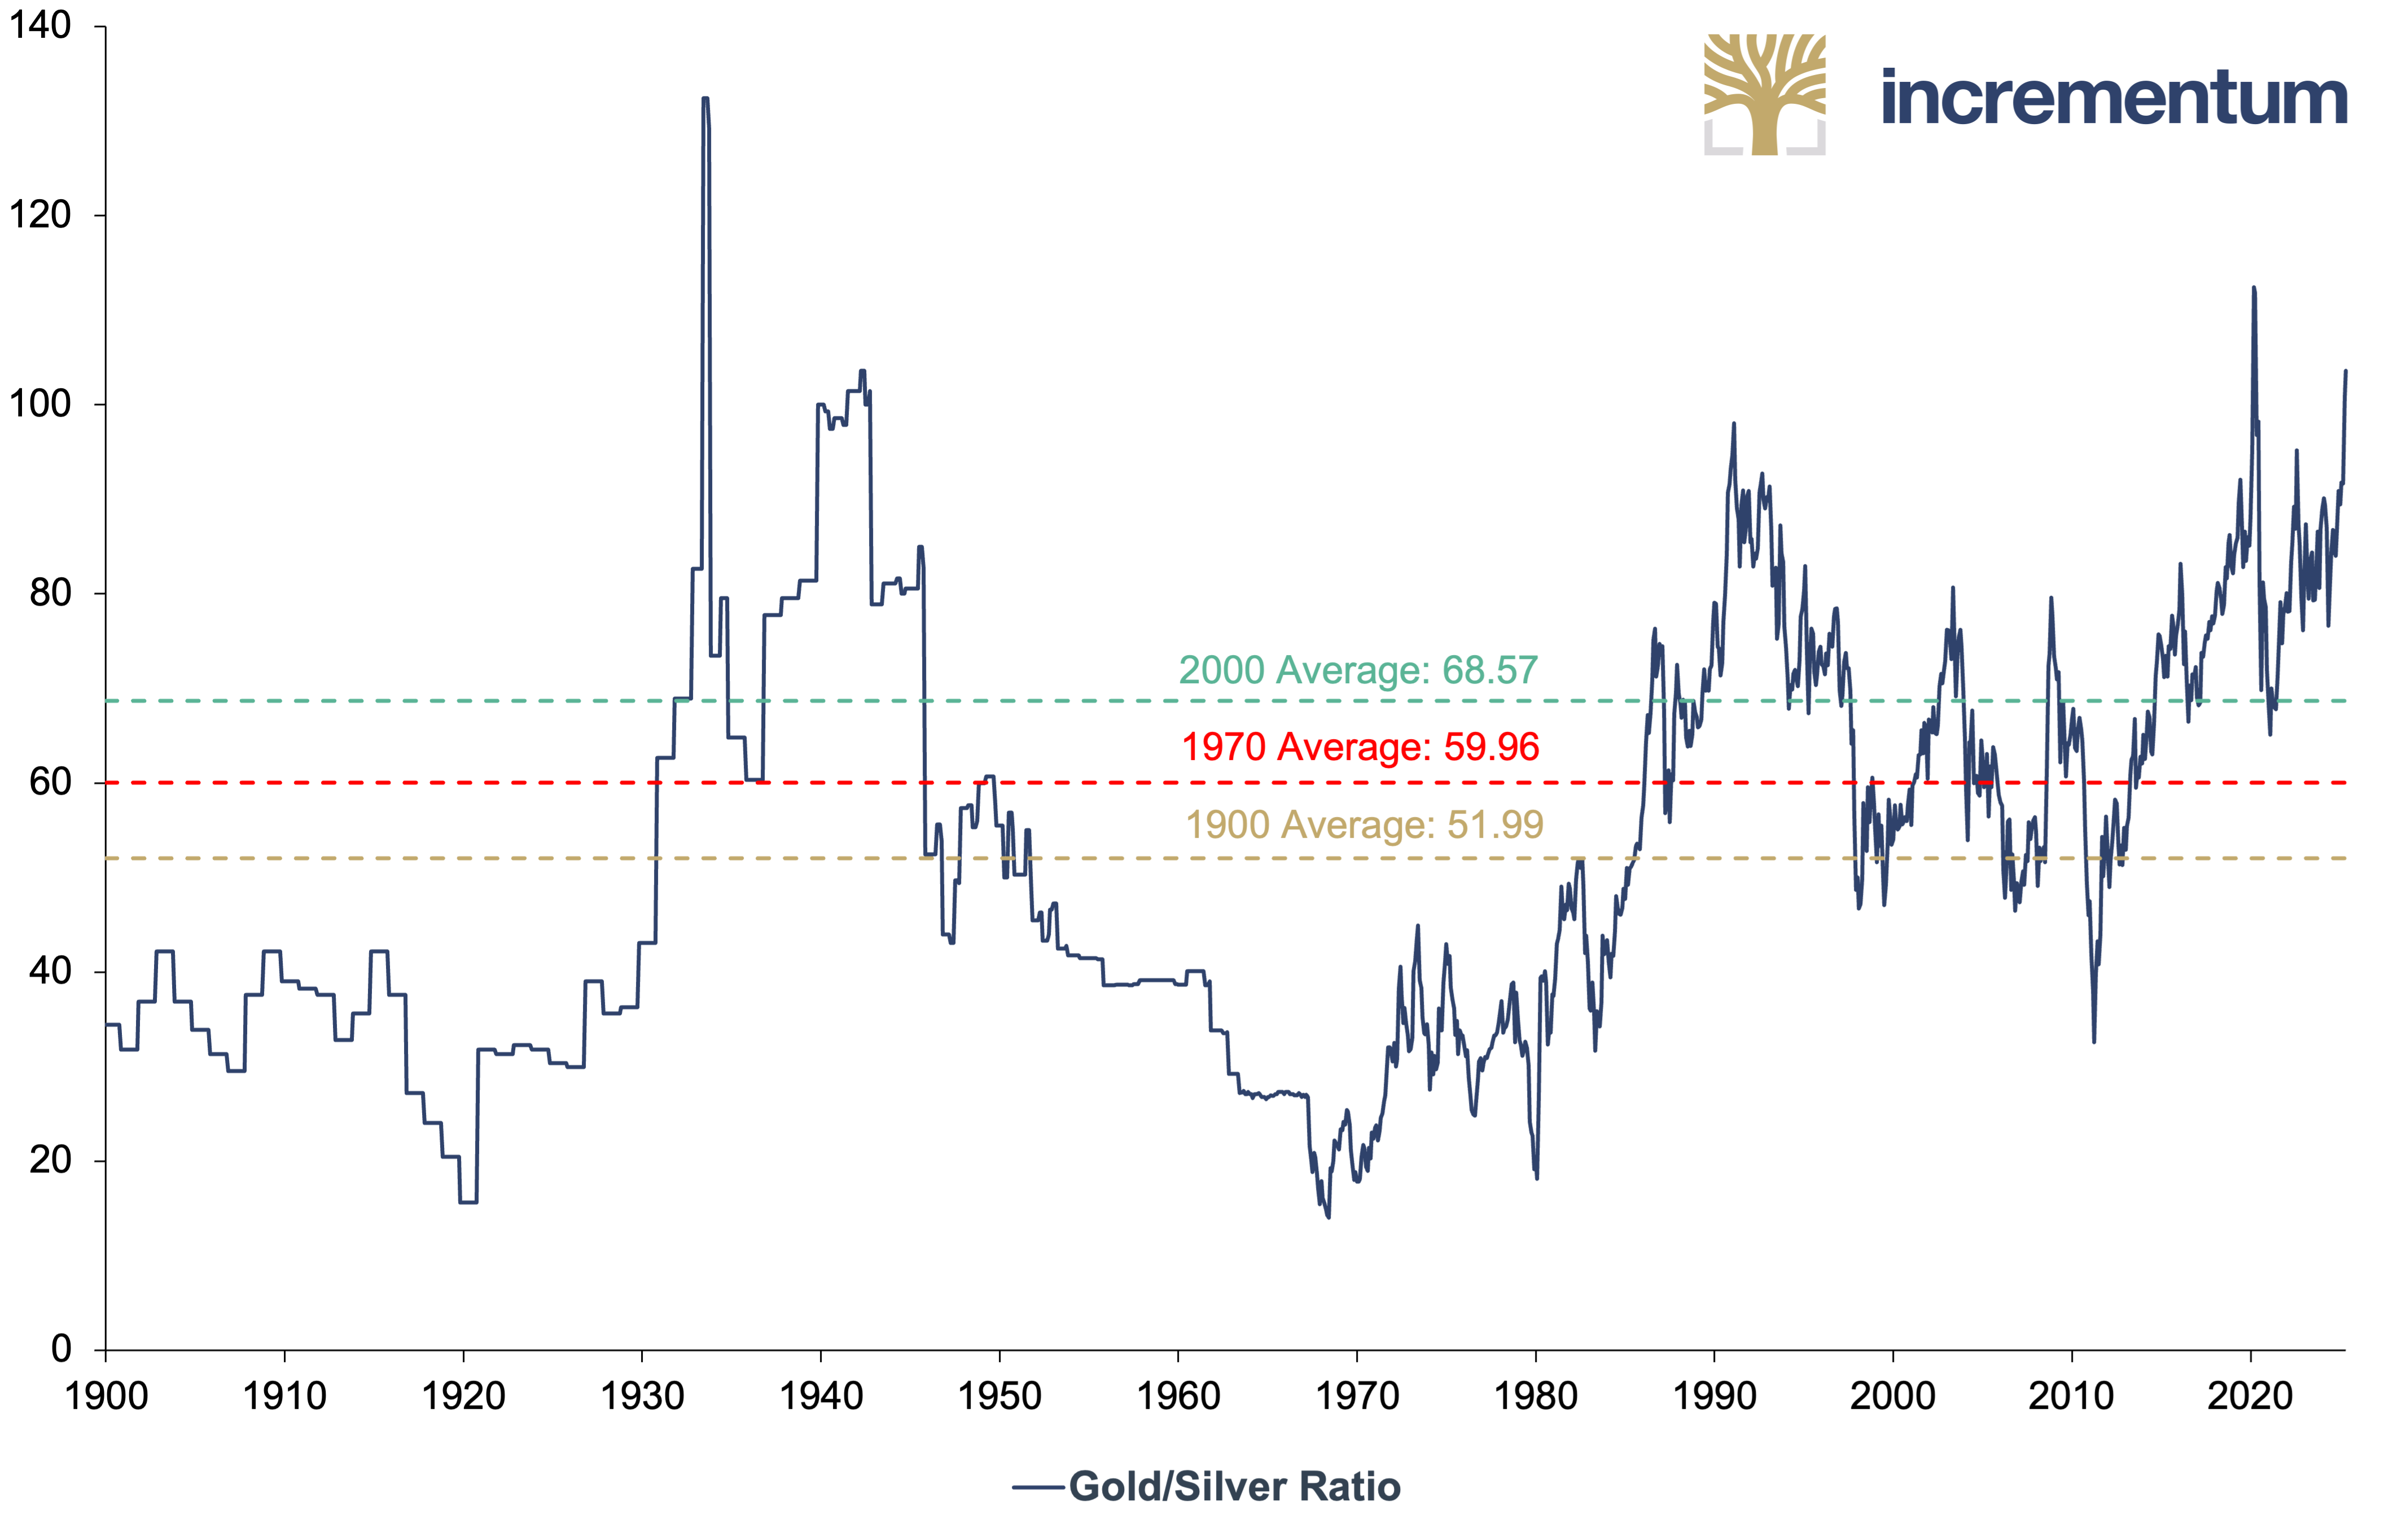
Source: Nick Laird, LSEG, Incrementum AG
Nonetheless, a reversion to the historical mean of the gold/silver ratio since 1970 would translate to a USD 55 silver price at a gold price of USD 3,300. More conservatively, a return to the average gold/silver ratio since 2000 would equate to a silver price of USD 48. Meanwhile, the average gold/silver ratio over the last 110 years would command a silver price of USD 63. Consequently, the silver price maintains a historical propensity to rise 48–95% from its current price of USD 32.50.
As for the probability that silver will revert to the mean, history shows it would be naïve to bet against the plucky white metal. This theory is supported by analysis from the In Gold We Trust report 2024, “The New Gold Playbook”, where we established that silver has gone on to outperform gold in 6 of the last seven bull markets based on its peaks and troughs.[1] This year, we observe that this so-called “silver slingshot effect” becomes more pronounced in the 12–18 months after gold’s breakout to all-time highs.
Silver after Gold Breakout to All-Time High (log, Start Price = 02/20/2024), in USD, 02/2024–04/2026
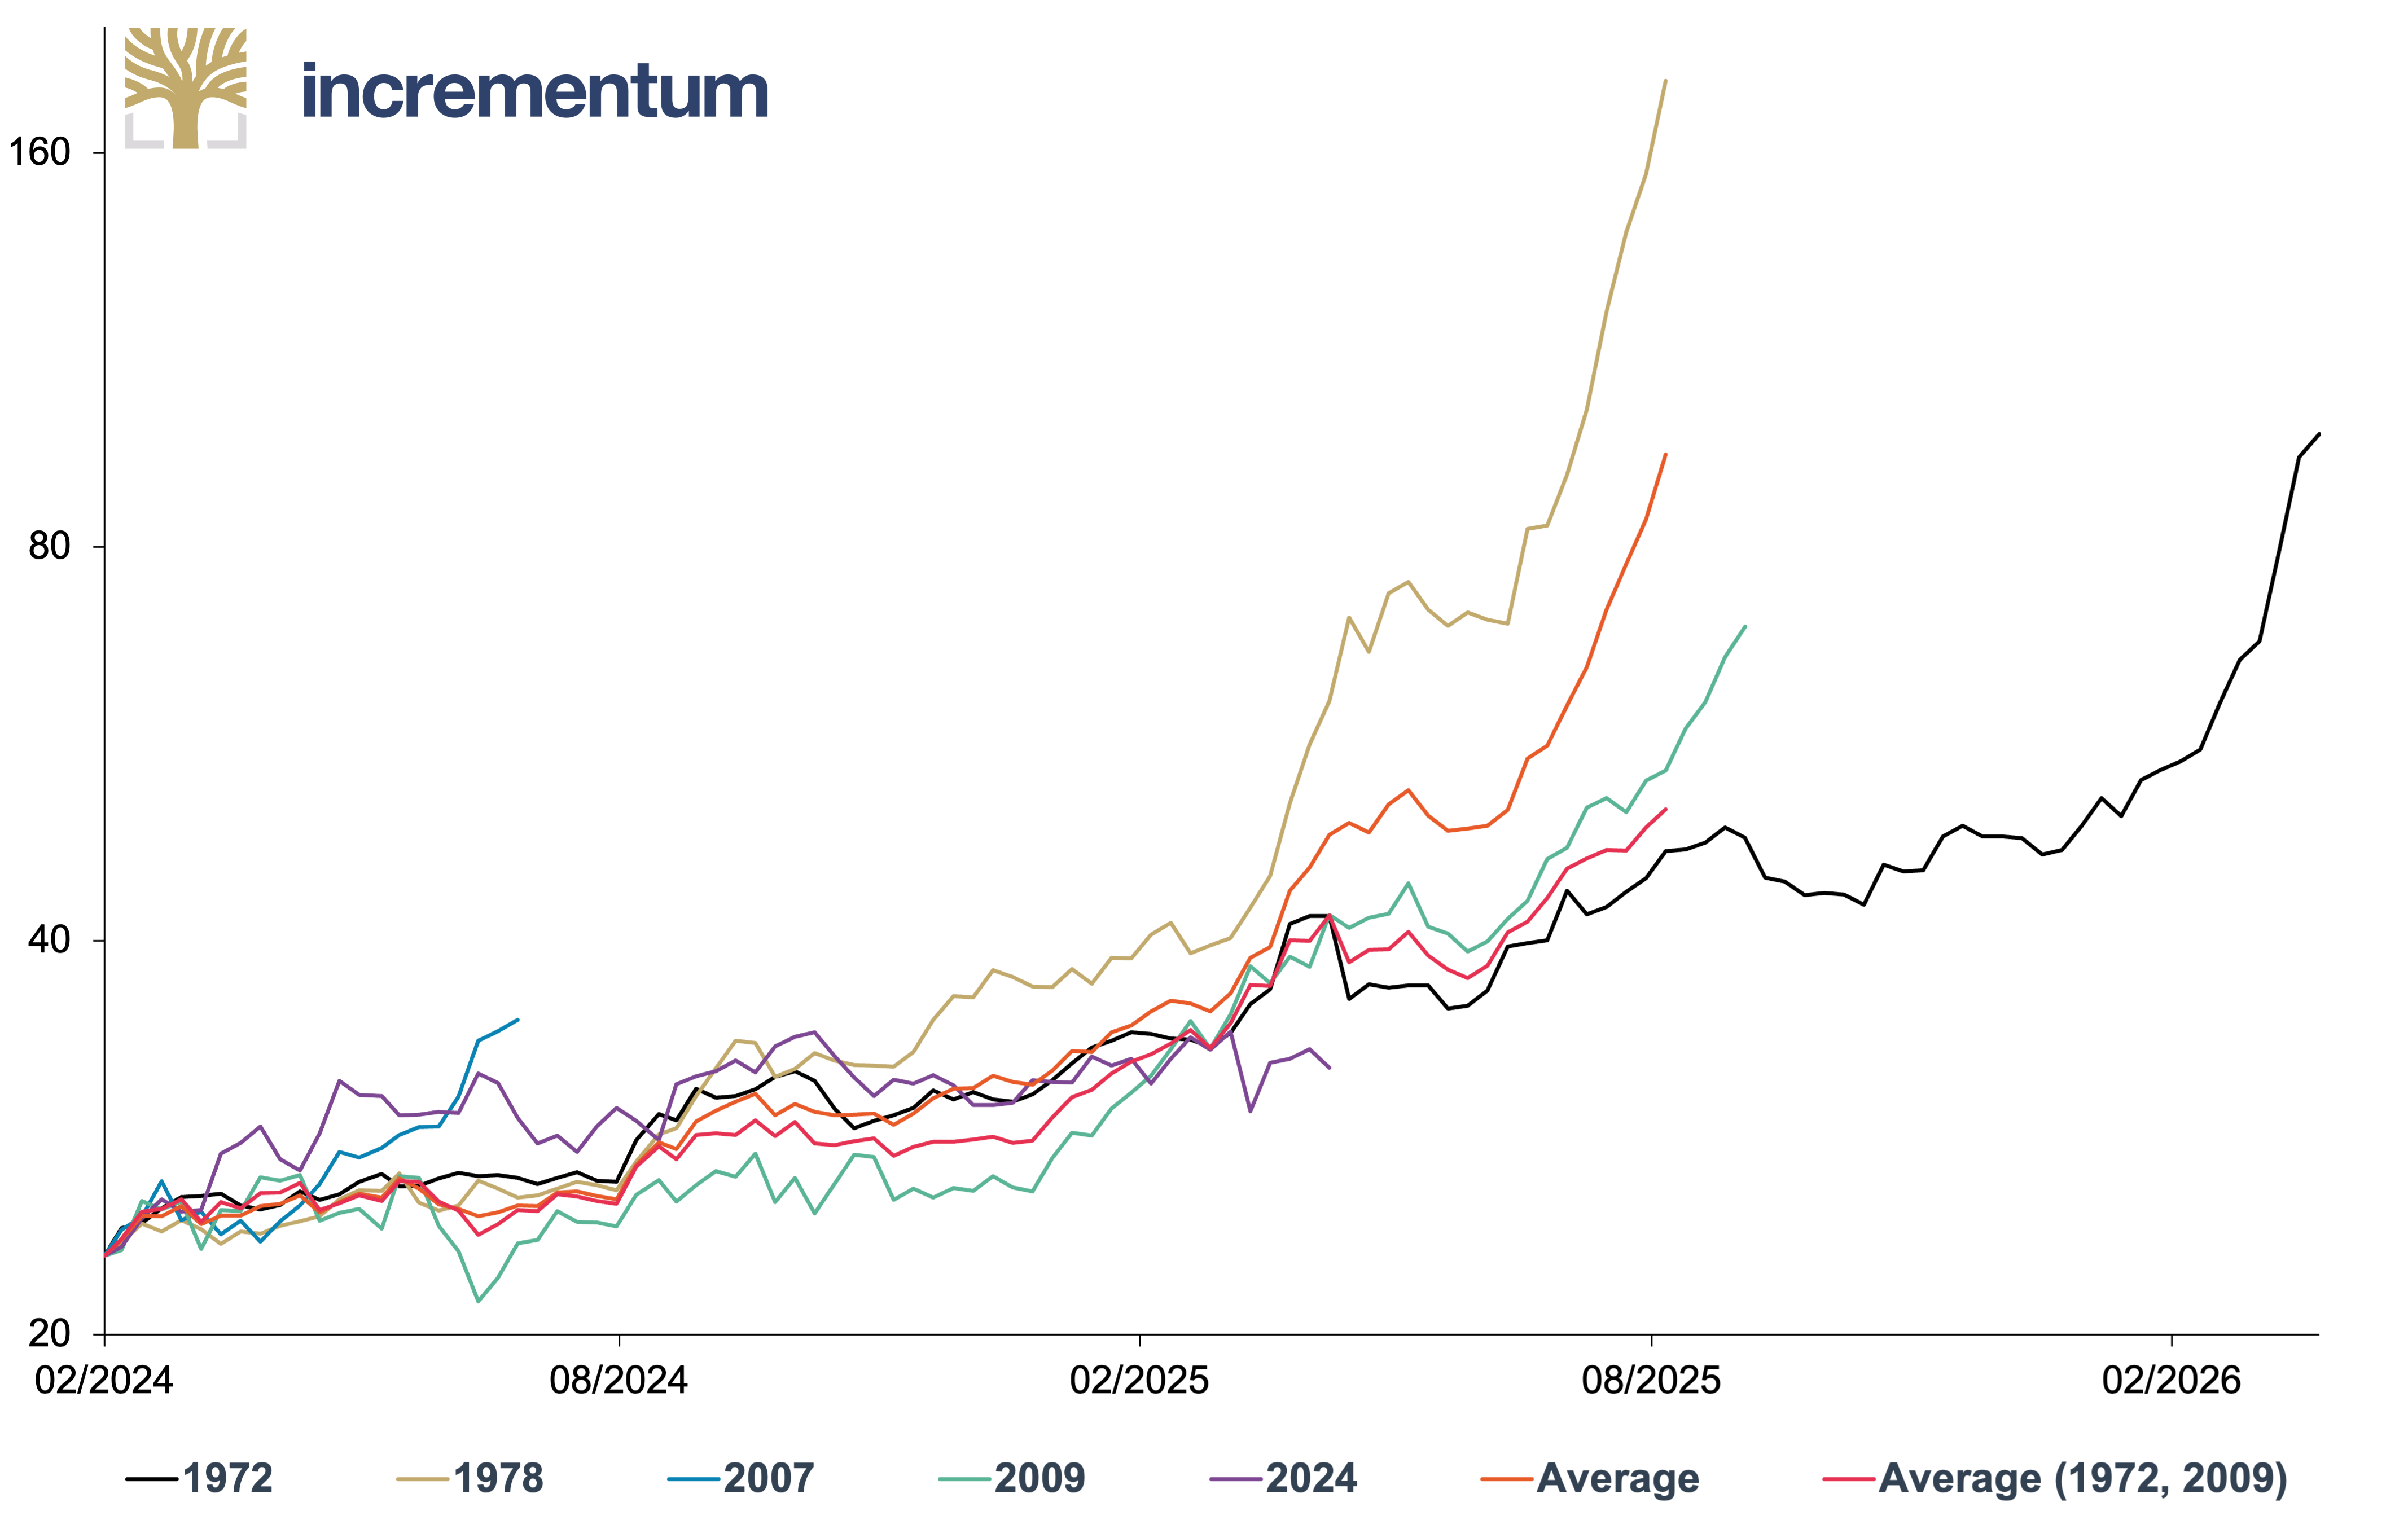
Source: TheDailyGold, LSEG, Incrementum AG
Notably, gold’s first official breakout from its 2020 high of USD 2068 came 18 months ago, in early December 2023. However, it’s important to point out that this breakout was not meaningfully sustained until 14 months ago, in March 2024 – the month during which the gold price truly drove past USD 2100 with conviction. As such, the above graphic serves as a valuable roadmap that points towards a materially higher silver price before July or at least before 2025 comes to a close.
And yet, the aforementioned metrics only suggest a historical tendency for the metal to push higher, thus failing to consider the broader market fundamentals. Naturally, this year’s silver chapter will explore the supply-demand catalysts that could drive the metal towards a recalibration with its 1980 highs while also considering the potential obstacles that may prevent this “mother of all cup and handle patterns” from being resolved.
Solar Demand: Growth Slowing, but Still Going Strong
The solar photovoltaic segment consumed a record 197.6 Moz in 2024, driving silver industrial demand to a record high of 680.5 Moz. Now comprising 29% of silver industrial demand, solar photovoltaics are the logical place to begin as we analyse potential silver price catalysts. Namely, a discrepancy between market participants’ expectations of solar demand growth and the reality that manifests could be instrumental in driving the silver price higher.
To this point, the IEA – a research organization that more frequently overestimates green energy’s potential – has consistently and severely underestimated real solar capacity growth since it began forecasting in 2009. Admittedly, the IEA could not have foreseen the astronomical 30% CAGR in solar installations from 2015 to 2024. However, the reality is that solar did defy expectations during this period. The question now is whether solar will be able to outperform once again.
Solar Capacity Additions, 2022–2025e
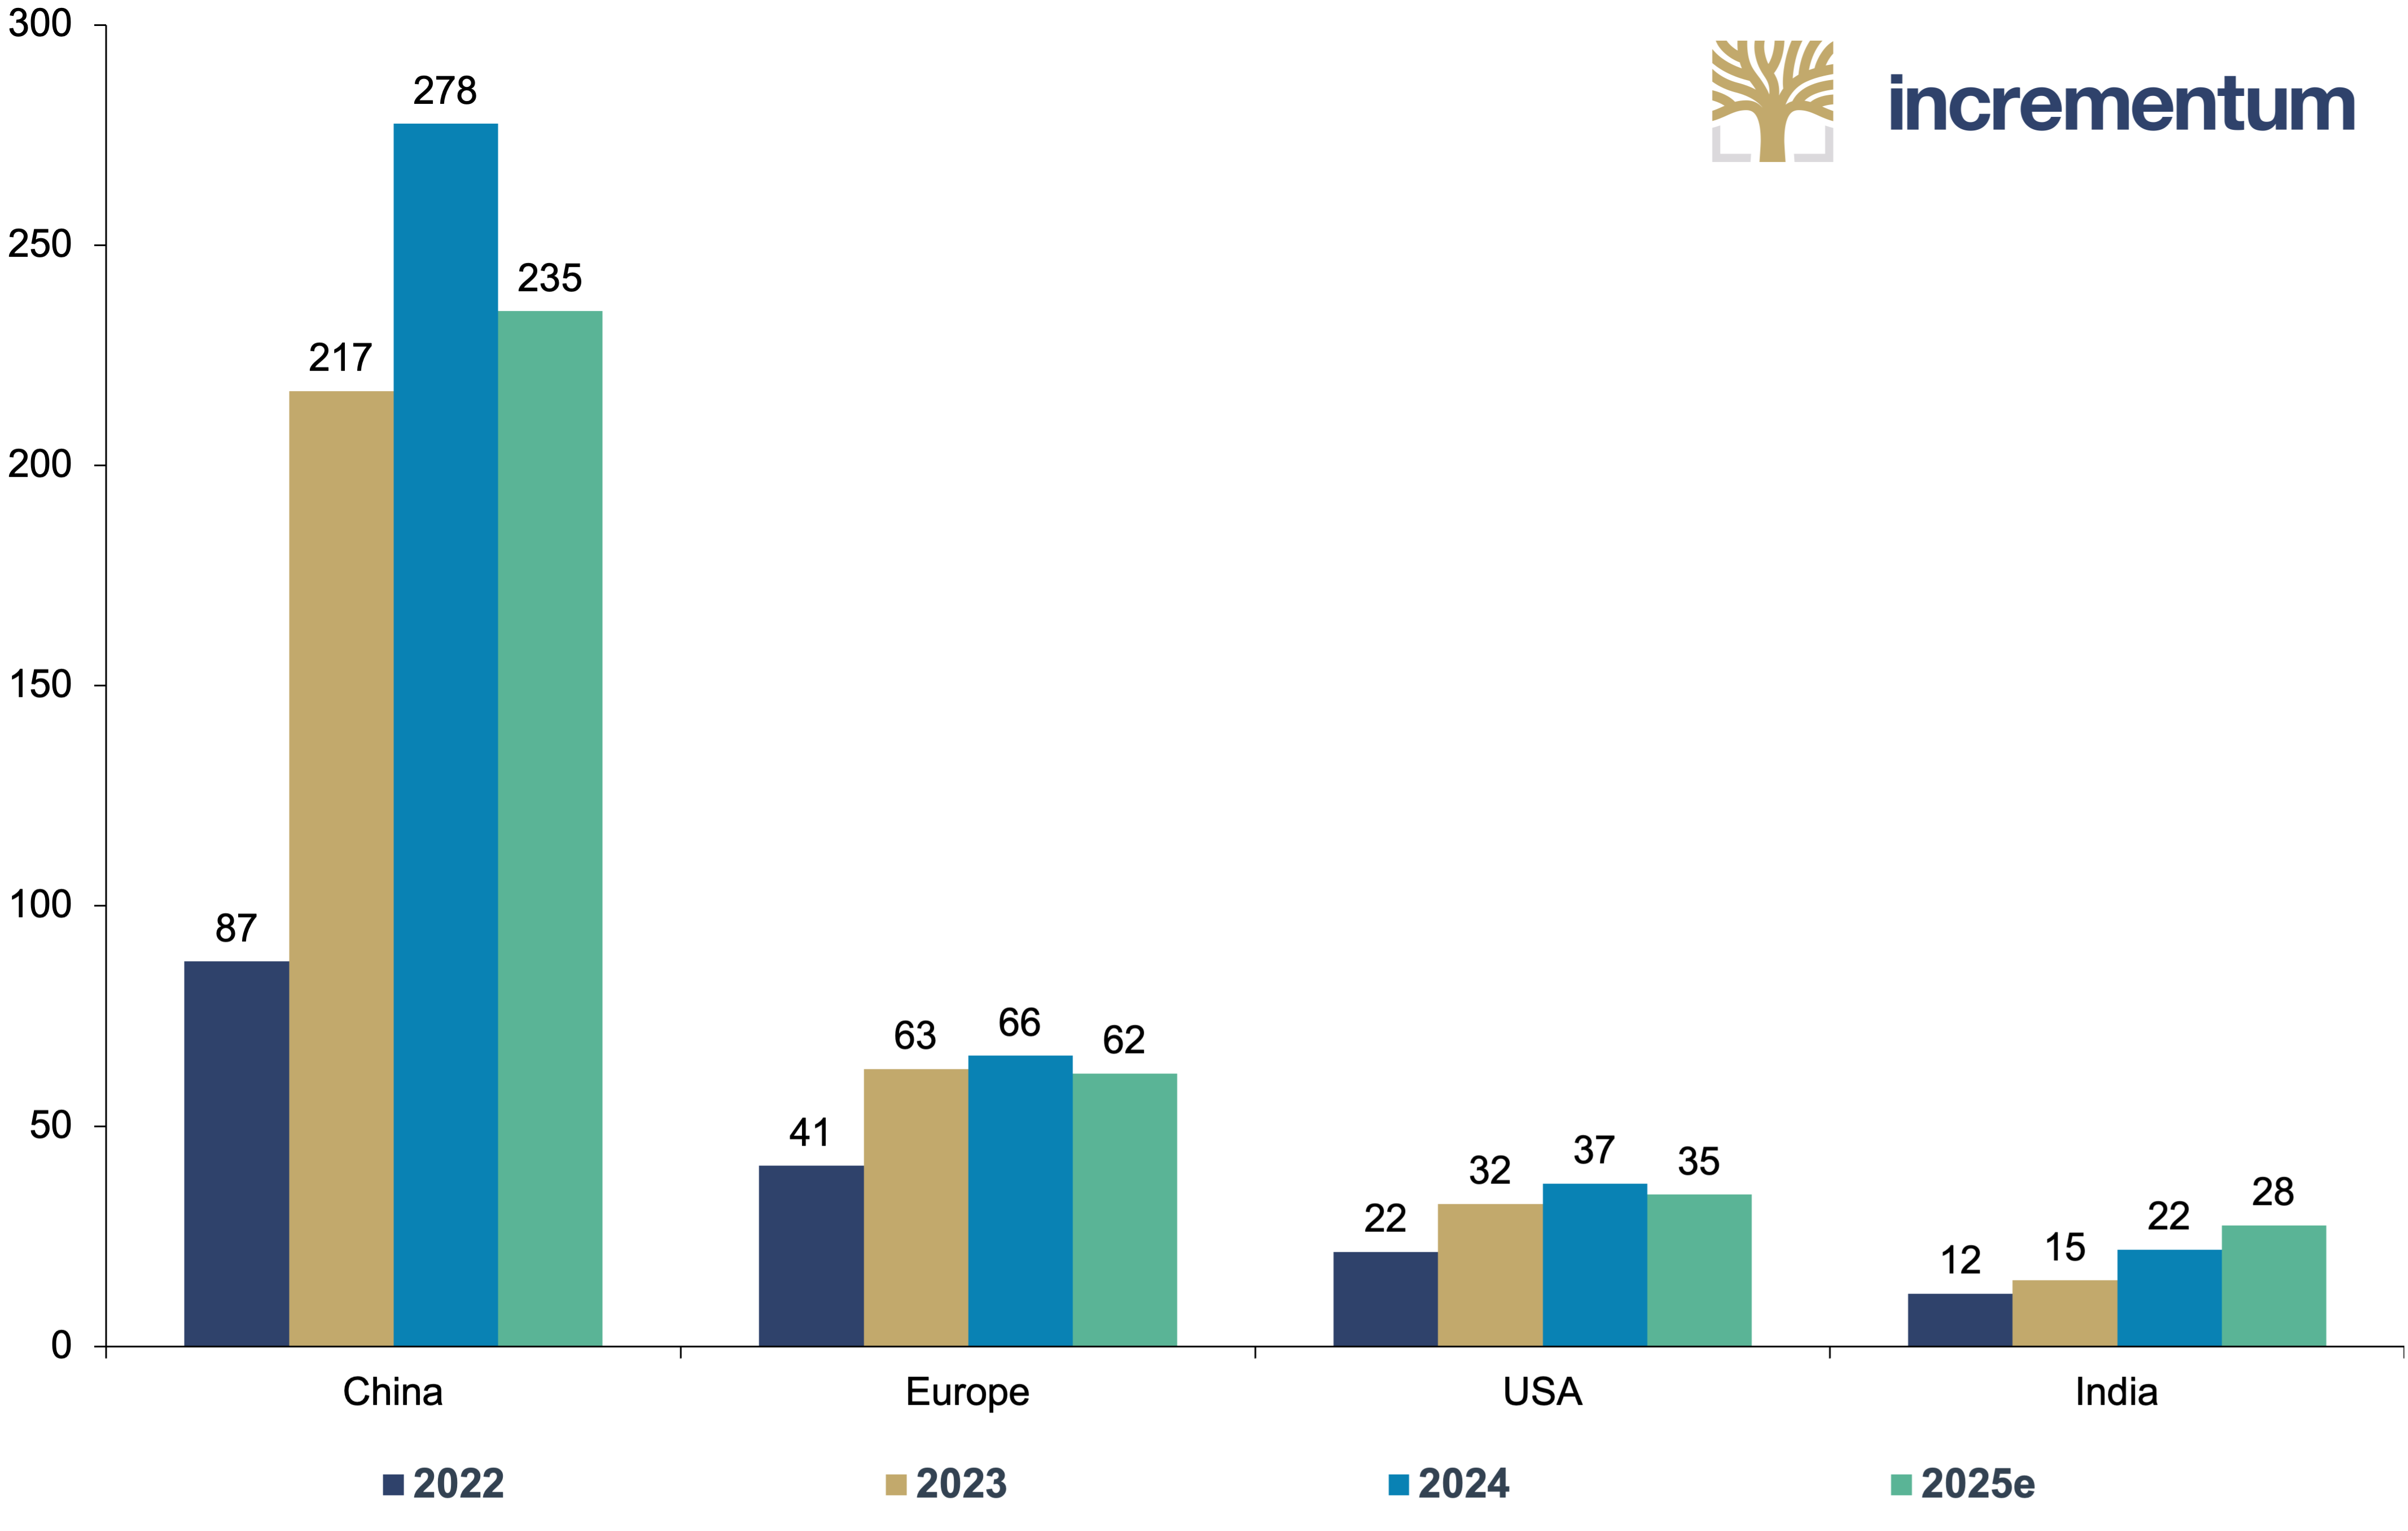
Source: China Photovoltaic Industry Association, Wood Mackenzie, EIA, Ember Energy, ICRA, JMK Research, CEEW-CEF, Incrementum AG
As we look at the projections for solar installations across the four major economies, the prospect of outperformance initially appears low. For one, China’s failure to revive domestic consumption in the face of a deflationary spiral could spell the beginning of the end for the country responsible for 46% of global solar capacity additions in 2024. In fact, the stagnating to marginal growth across Europe, India, and the US doesn’t bode well, either.
That said, it’s worth noting that this slowing growth is preceded by a record level of global new solar capacity additions in 2024, at 599 GW. Moreover, it’s not to say that global solar capacity has shrunk or is on the brink of entering decline. Instead, it simply signifies that growth is set to become less explosive in the future. According to Bloomberg NEF, this will be characterized by a 3.6% average annual growth rate for global solar capacity additions from 2025 through 2035.
Global Solar Capacity Additions, in GW, 2015–2035e
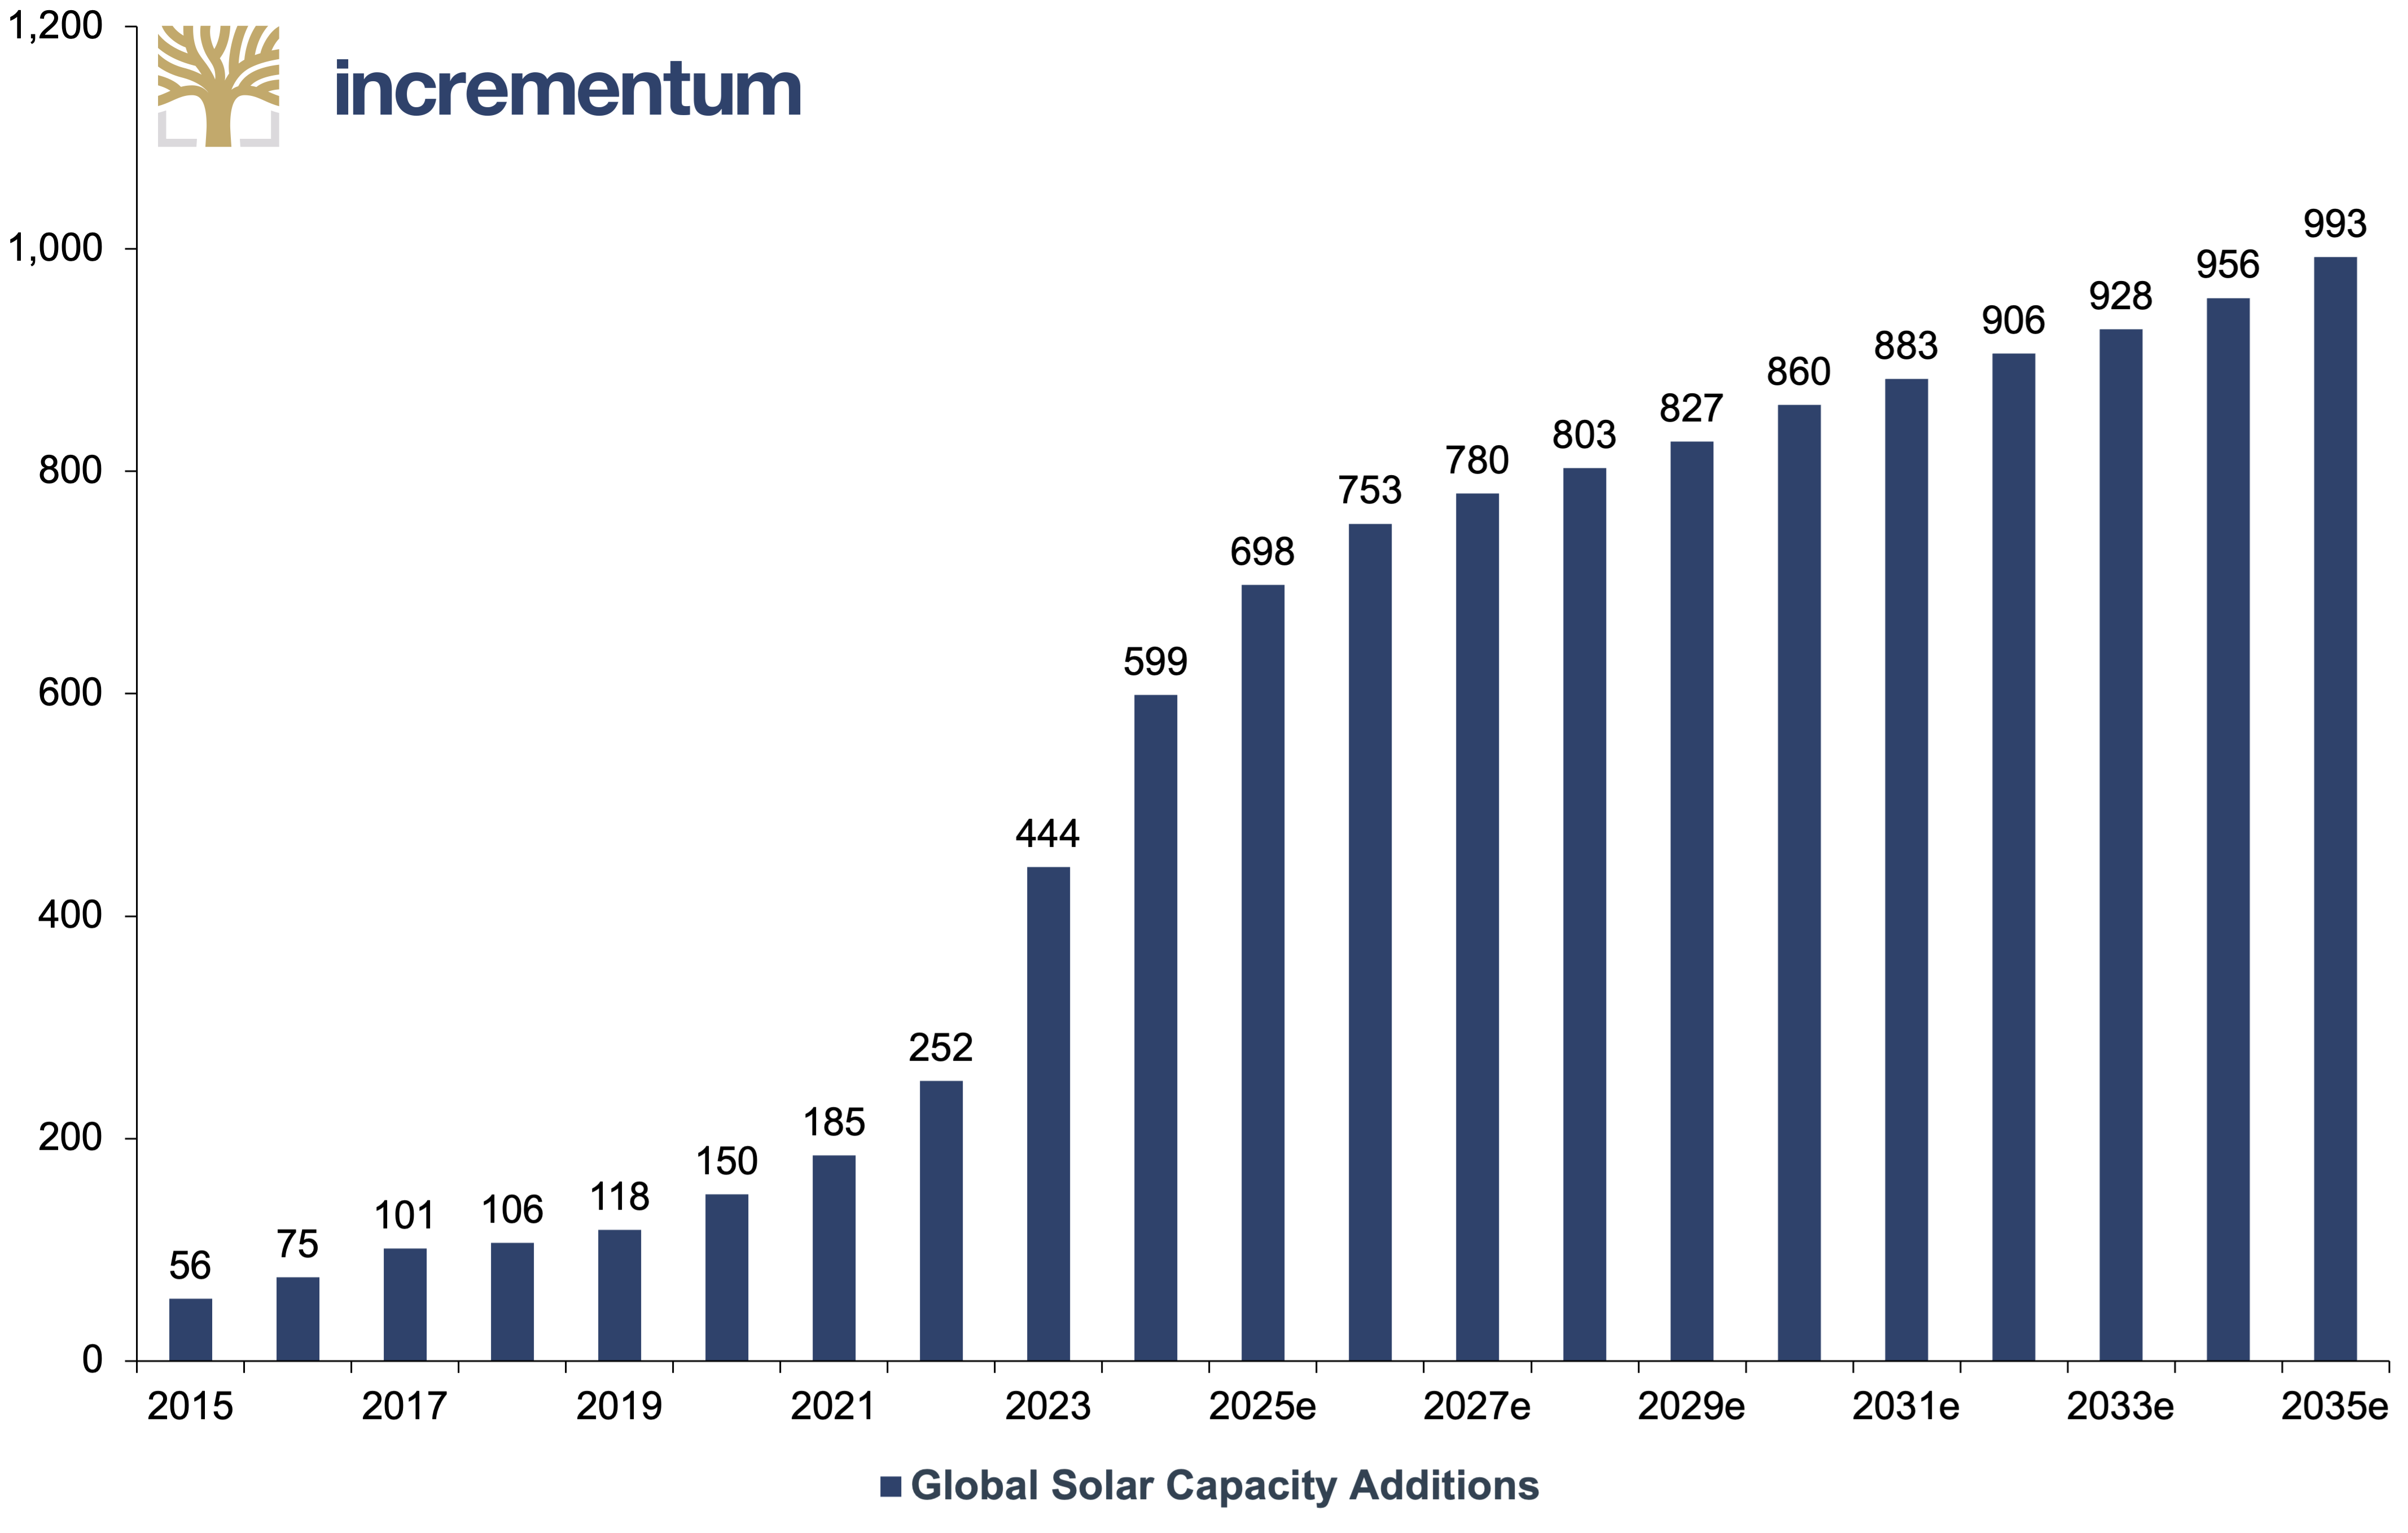
Source: BloombergNEF, Incrementum AG
Consequently, solar capacity additions are at least insulated from annual declines in the coming decade. And yet, when one considers the broader picture, it becomes clear that silver’s solar demand will not only survive the coming years but thrive. This revelation comes in light of record-low solar panel prices incentivizing emerging markets to transition away from old energy. Additionally, the rapidly increasing market share of TopCon solar panels stands to accelerate silver offtake.
Research from Bloomberg NEF shows that solar panel prices have fallen from 0.25 USD/W in 2022 to an all-time low of 0.10 USD/W as of February 2025. These highly economical prices continue to reduce the barriers to entry for solar, attracting even the most notorious of old-energy stalwarts. Namely, the Gulf States are gunning for solar to generate 52% of the region’s electricity by 2050 – an undertaking that will require over 400 GW of solar capacity additions.
Gulf States: Electricity Generation (lhs), in TWh, and Cumulative Solar Capacity (rhs), in GW, 2024–2050
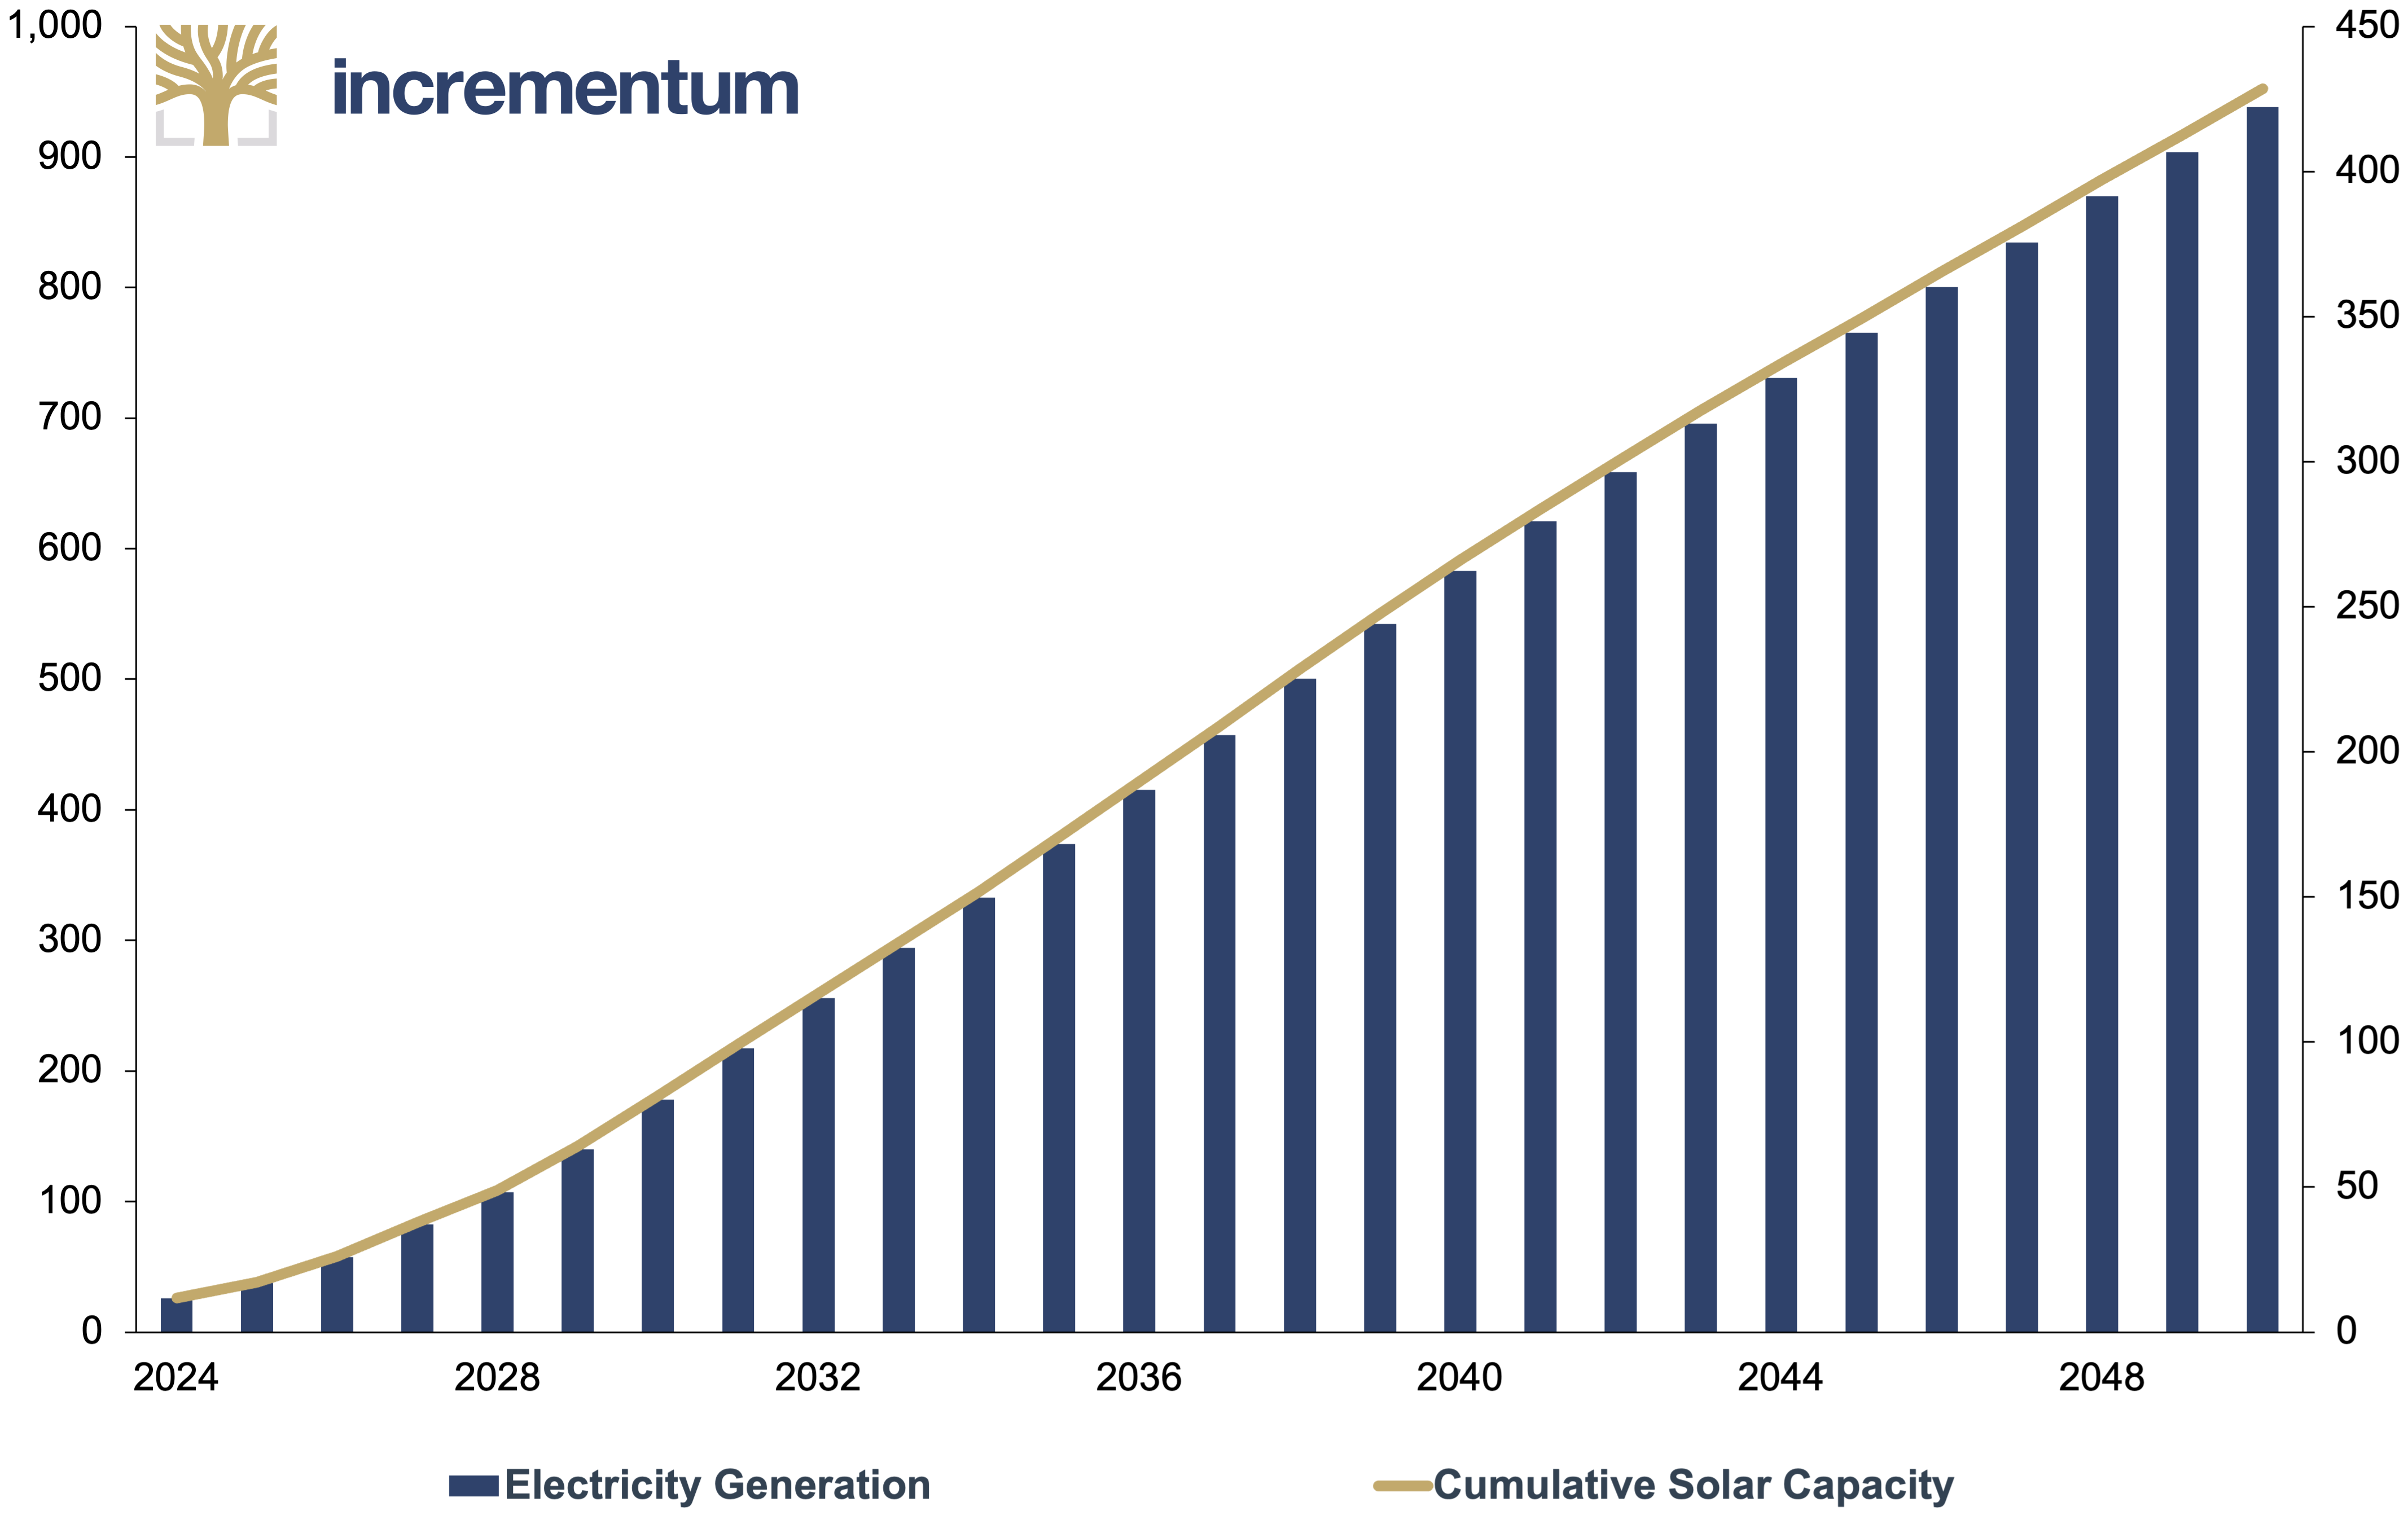
Source: Financial Times, Rystad Energy, Incrementum AG
As part of this solar shift, which is made more conducive by the region’s sweltering climate, the UAE is pledging to build a USD 6bn 5GW solar plant backed with more than 19GWh of battery storage. Citing the nascently low cost of solar as a main factor, the Financial Times reports that it would be the largest such project ever attempted – enough to power 1 million homes and even bigger than the solar park spanning 5x the size of Paris being constructed in India.
Our In Gold We Trust report 2024 “The New Gold Playbook” noted that TopCon solar panels require 20–40 mg more silver per panel than the previous generation, PERC.[2] Since then, TopCon’s silver content per panel has been revised upwards by 10–15 mg to 130–135 mg. At the same time, TopCon’s share of China’s PV market increased from 23% in 2023 to 60% by the end of 2024. This blistering rise is expected to produce a monopoly in 2029, as TopCon realises an 84% global market share.[3]
For context, according to Heraeus, a 60/40 split between TopCon and PERC based on the higher end of China’s 2025 solar capacity additions forecasts (255 GW) would translate to 171.8 Moz of silver demand.[4] Therefore, if TopCon’s market share climbs to 84% by 2029, and if global solar capacity additions reach Bloomberg NEF’s forecasts of 827 GW by the same year, then silver’s annual solar demand could reach 557.2 Moz in 4 years – more than double silver’s solar offtake in 2024.
Global PV Silver Demand, in Moz, 2014–2029e
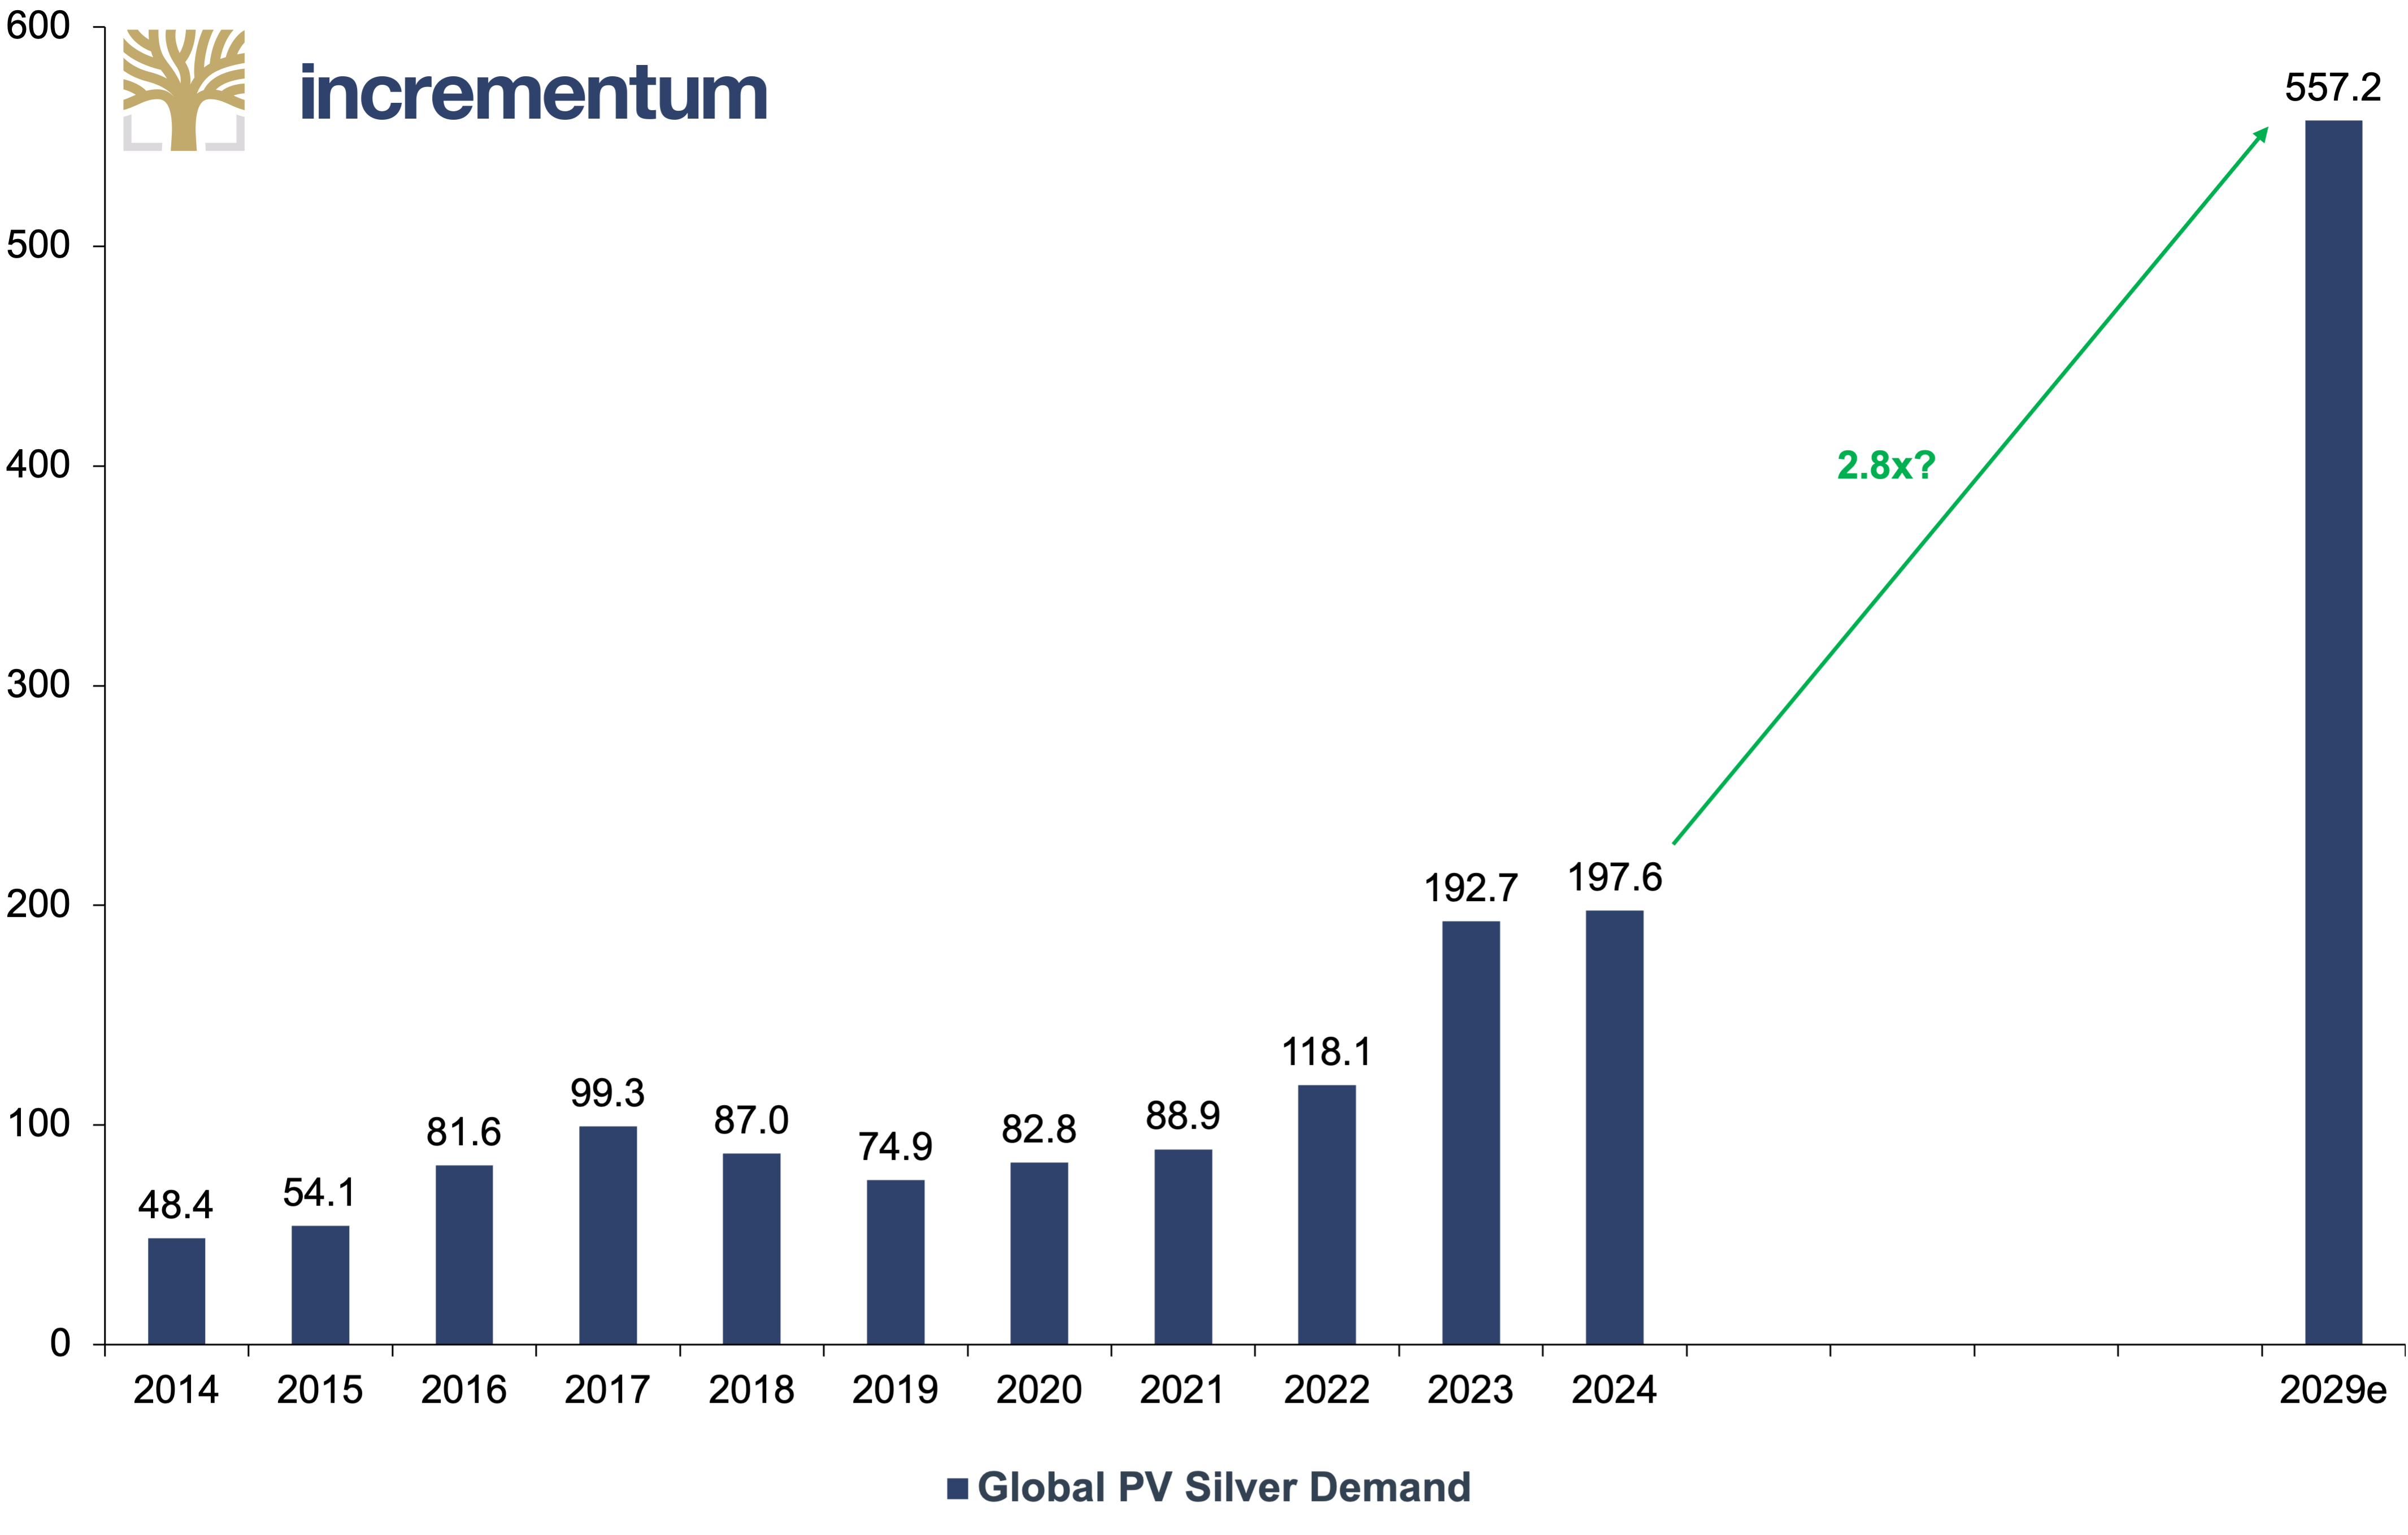
Source: The Silver Institute, Incrementum AG
On the other hand, BMO Capital Markets expect the solar sector will consume 246 Moz of silver in 2025, before peaking at 261 Moz next year. Therefore, whilst we note that solar demand has consistently been underestimated, there are scenarios in which the above extrapolations could become overestimates. For instance, silver prices could rise to the point where silver usage in solar panels becomes unaffordable or disincentivised. In these conditions, thrifting and substitution would increase, as industrial players seek to match or better the efficiency of silver-laden solar panels, opting for more economical alternatives such as copper.
Currently, the most viable non-silver solar panel alternative is a copper-based technology spearheaded by a joint venture between Australian start-up SunDrive Solar and China’s second largest solar panel manufacturer, Trina. Backed by former Australian Prime Minister Michael Turnbull and billionaire investor Mike Cannon-Brookes, SunDrive claims it could deliver an installed solar cost 20–30% cheaper than other high-efficiency cells, thanks to using copper over silver.
Despite this, commercially unproven copper tends to diffuse into silicon at elevated temperatures, degrading solar cell efficiency over the long term. Copper also oxidizes more quickly than silver, significantly reducing conductivity unless costly protective coatings are applied. Meanwhile, silver-based solar panels possess superior conductivity and corrosion resistance. Not least, silver-based panels are tried and trusted, with 25+ years of proven minimal performance degradation.
Consequently, silver’s solar demand may have an inherent protective moat against copper substitution. This is affirmed by the fact that Chinese solar firm Trina is also betting on new silver-based solar tech such as HJT. Certified at a world record 25.44% efficiency by Fraunhofer CalLab in January 2025 and containing 200–220 mg of silver per panel, HJT requires 1.5–2x the silver content of TopCon. For these reasons, we expect silver to remain the gold standard for solar until further notice.
Solid State Batteries: Silver’s Solar Successor?
In the unlikely case that silver’s solar demand falls in the coming years, emerging silver-based technologies are waiting in the wings to serve as long-term silver price catalysts. The most compelling innovations presently belong to silver demand’s automotive and power generation segments. Chiefly, Samsung’s novel solid state battery boasts vastly superior energy density to its leading lithium-ion battery peers and contains 10–20 times the silver content.
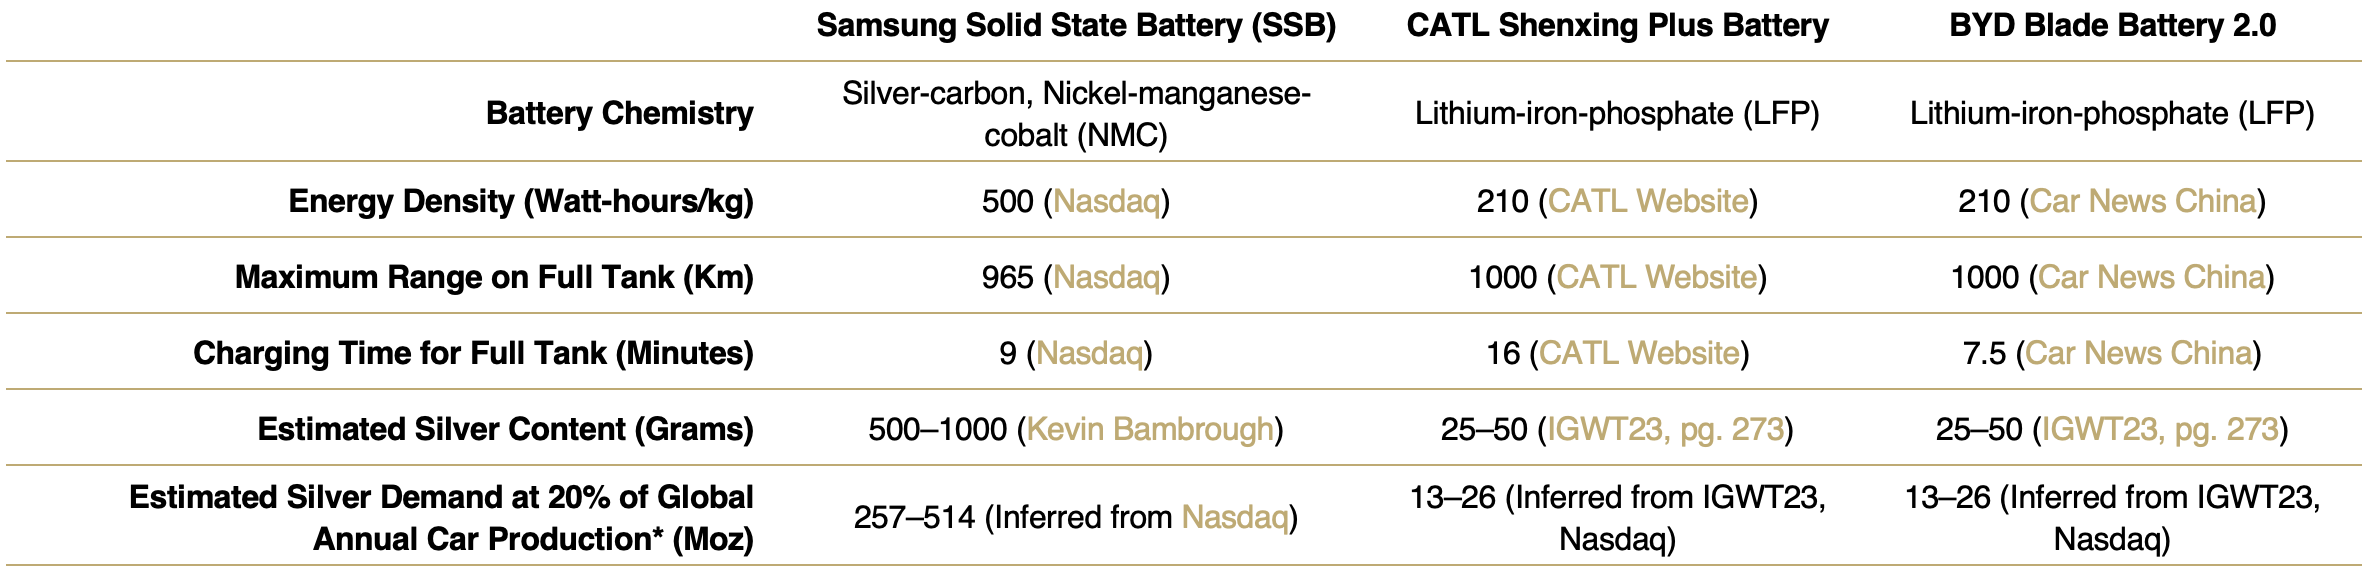
*16,000,000 units in 2024 according to Nasdaq.
For reference, CATL and BYD are the two largest battery manufacturers globally, commanding a 50% share of the global market thanks to their cutting-edge technologies. Despite this, the companies’ most advanced lithium-ion batteries to date wane in comparison to Samsung’s SSB in terms of energy density. This is evidenced by CATL’s very own chief scientist’s admitting that the natural ceiling of liquid lithium batteries may sit at 350 Wh/g – some 30% lower than the energy density of Samsung’s SSB.
Similarly, CATL’s most advanced nickel-based battery – the Qilin NMC – utilizes a nickel-manganese-cobalt cathode that achieves 255 Wh/kg, thereby rivalling the energy density of the 4680 nickel-cobalt-aluminium battery used in Tesla’s Cyber Truck. However, Samsung’s SSB can deliver comparable energy output while occupying half the weight and volume. Moreover, the usage of silver in Samsung’s SSB is paving the way for marked increases in safety and longevity:
An all-solid-state battery with a lithium metal anode is a strong candidate for surpassing conventional lithium-ion battery capabilities. Undesirable lithium dendrite growth and low Coulombic efficiency impede their practical application. A high-performance all-solid-state lithium metal battery with a sulfide electrolyte is enabled by an Ag–C composite anode with no excess Li. The thin Ag–C layer can effectively regulate Li deposition, which leads to a genuinely long electrochemical cyclability.
To be specific, Samsung’s SSB contains a silver-carbon (Ag-C) anode, a sulfide solid electrolyte, and no excess lithium. Each of the estimated 200 Ag-C layers in the battery pack uses up to 5 grams of silver, hence the 1kg figure. In fact, the presence of silver and the absence of flammable liquid electrolyte render the SSB inherently safer than lithium-ion batteries. As such, the Ag-C layers’ regulation of lithium deposition helps facilitate the battery’s lifespan of up to 20 years.
For these reasons precisely, Samsung has already managed to secure an agreement with Toyota to begin mass production of its SSBs in 2027, with Lexus vehicles are scheduled to be among the first to integrate the new technology. As a result, every EV battery manufacturer worth their salt is quietly shifting gears, away from a future solely dominated by LFP and NMC research, and towards one Porsche Consulting is tipping as “The Race for Solid State Batteries”. As Olivier Delaire, Associate Professor of Mechanical Engineering and Materials Science at Duke University, puts it:
All the electric vehicle manufacturers are trying to move to new solid-state battery designs, but none of them are disclosing which composition they’re going for. Winning that race would be a game-changer, because cars could charge faster, last longer, and be safer at the same time.
Of course, substitution is rife in the automotive sector, and innovations can change market dynamics instantaneously. For example, Toyota is leveraging 1000+ patents and 15 years of R&D to develop a relatively more economical sulfide-based SSB. In doing so, the firm is targeting a 1,200 km range, a 10-minute charging time, and mass production by 2027. Mass production will be aided by the plans of fellow Japanese firm Idemitsu Kosan to supply the lithium sulfide for Toyota’s SSBs.
In spite of these developments – and the novel efforts of Volkswagen-backed QuantumScape to engineer a lithium-metal SSB with a ceramic separator – cost will be the principal determinant of whether Samsung’s SSB is adopted en masse. To this point, optimistic academic studies posit that SSBs could be priced at 140 USD/KWh by 2028. However, Goldman Sachs estimates that 94% of batteries will be LFP or nickel-based by 2028, causing average non-SSB battery prices to fall to 72 USD/KWh.
As a result, it appears that SSBs will be confined to the “high-end” EV segment, at least until economies of scale kick in and production costs are pulled downwards. This threshold will arrive when manufacturers possess sufficient agility to pivot away from their deeply entrenched LFP innovatory cycles. Alternatively, when an R&D breakthrough reinforces the inferior performance of LFP relative to SSB to the extent that manufacturers are forced to forego their sunk costs fallacies.
Until that point arrives, the jury is out on silver consumption from SSBs. Although, given the metallurgical versatility that facilitated silver’s eras of dominance in solar and photography, the metal will undoubtedly thrive if global battery demand quadruples from 2023–2030. Whether this derives from EVs or the power generation segment consuming approximately 88 Moz of silver annually is presently unclear. What is clear, however, is that silver’s industrial demand prospects remain as buoyant as ever.
Global Industrial Silver Demand, as % of Mined Production, 2016–2025e
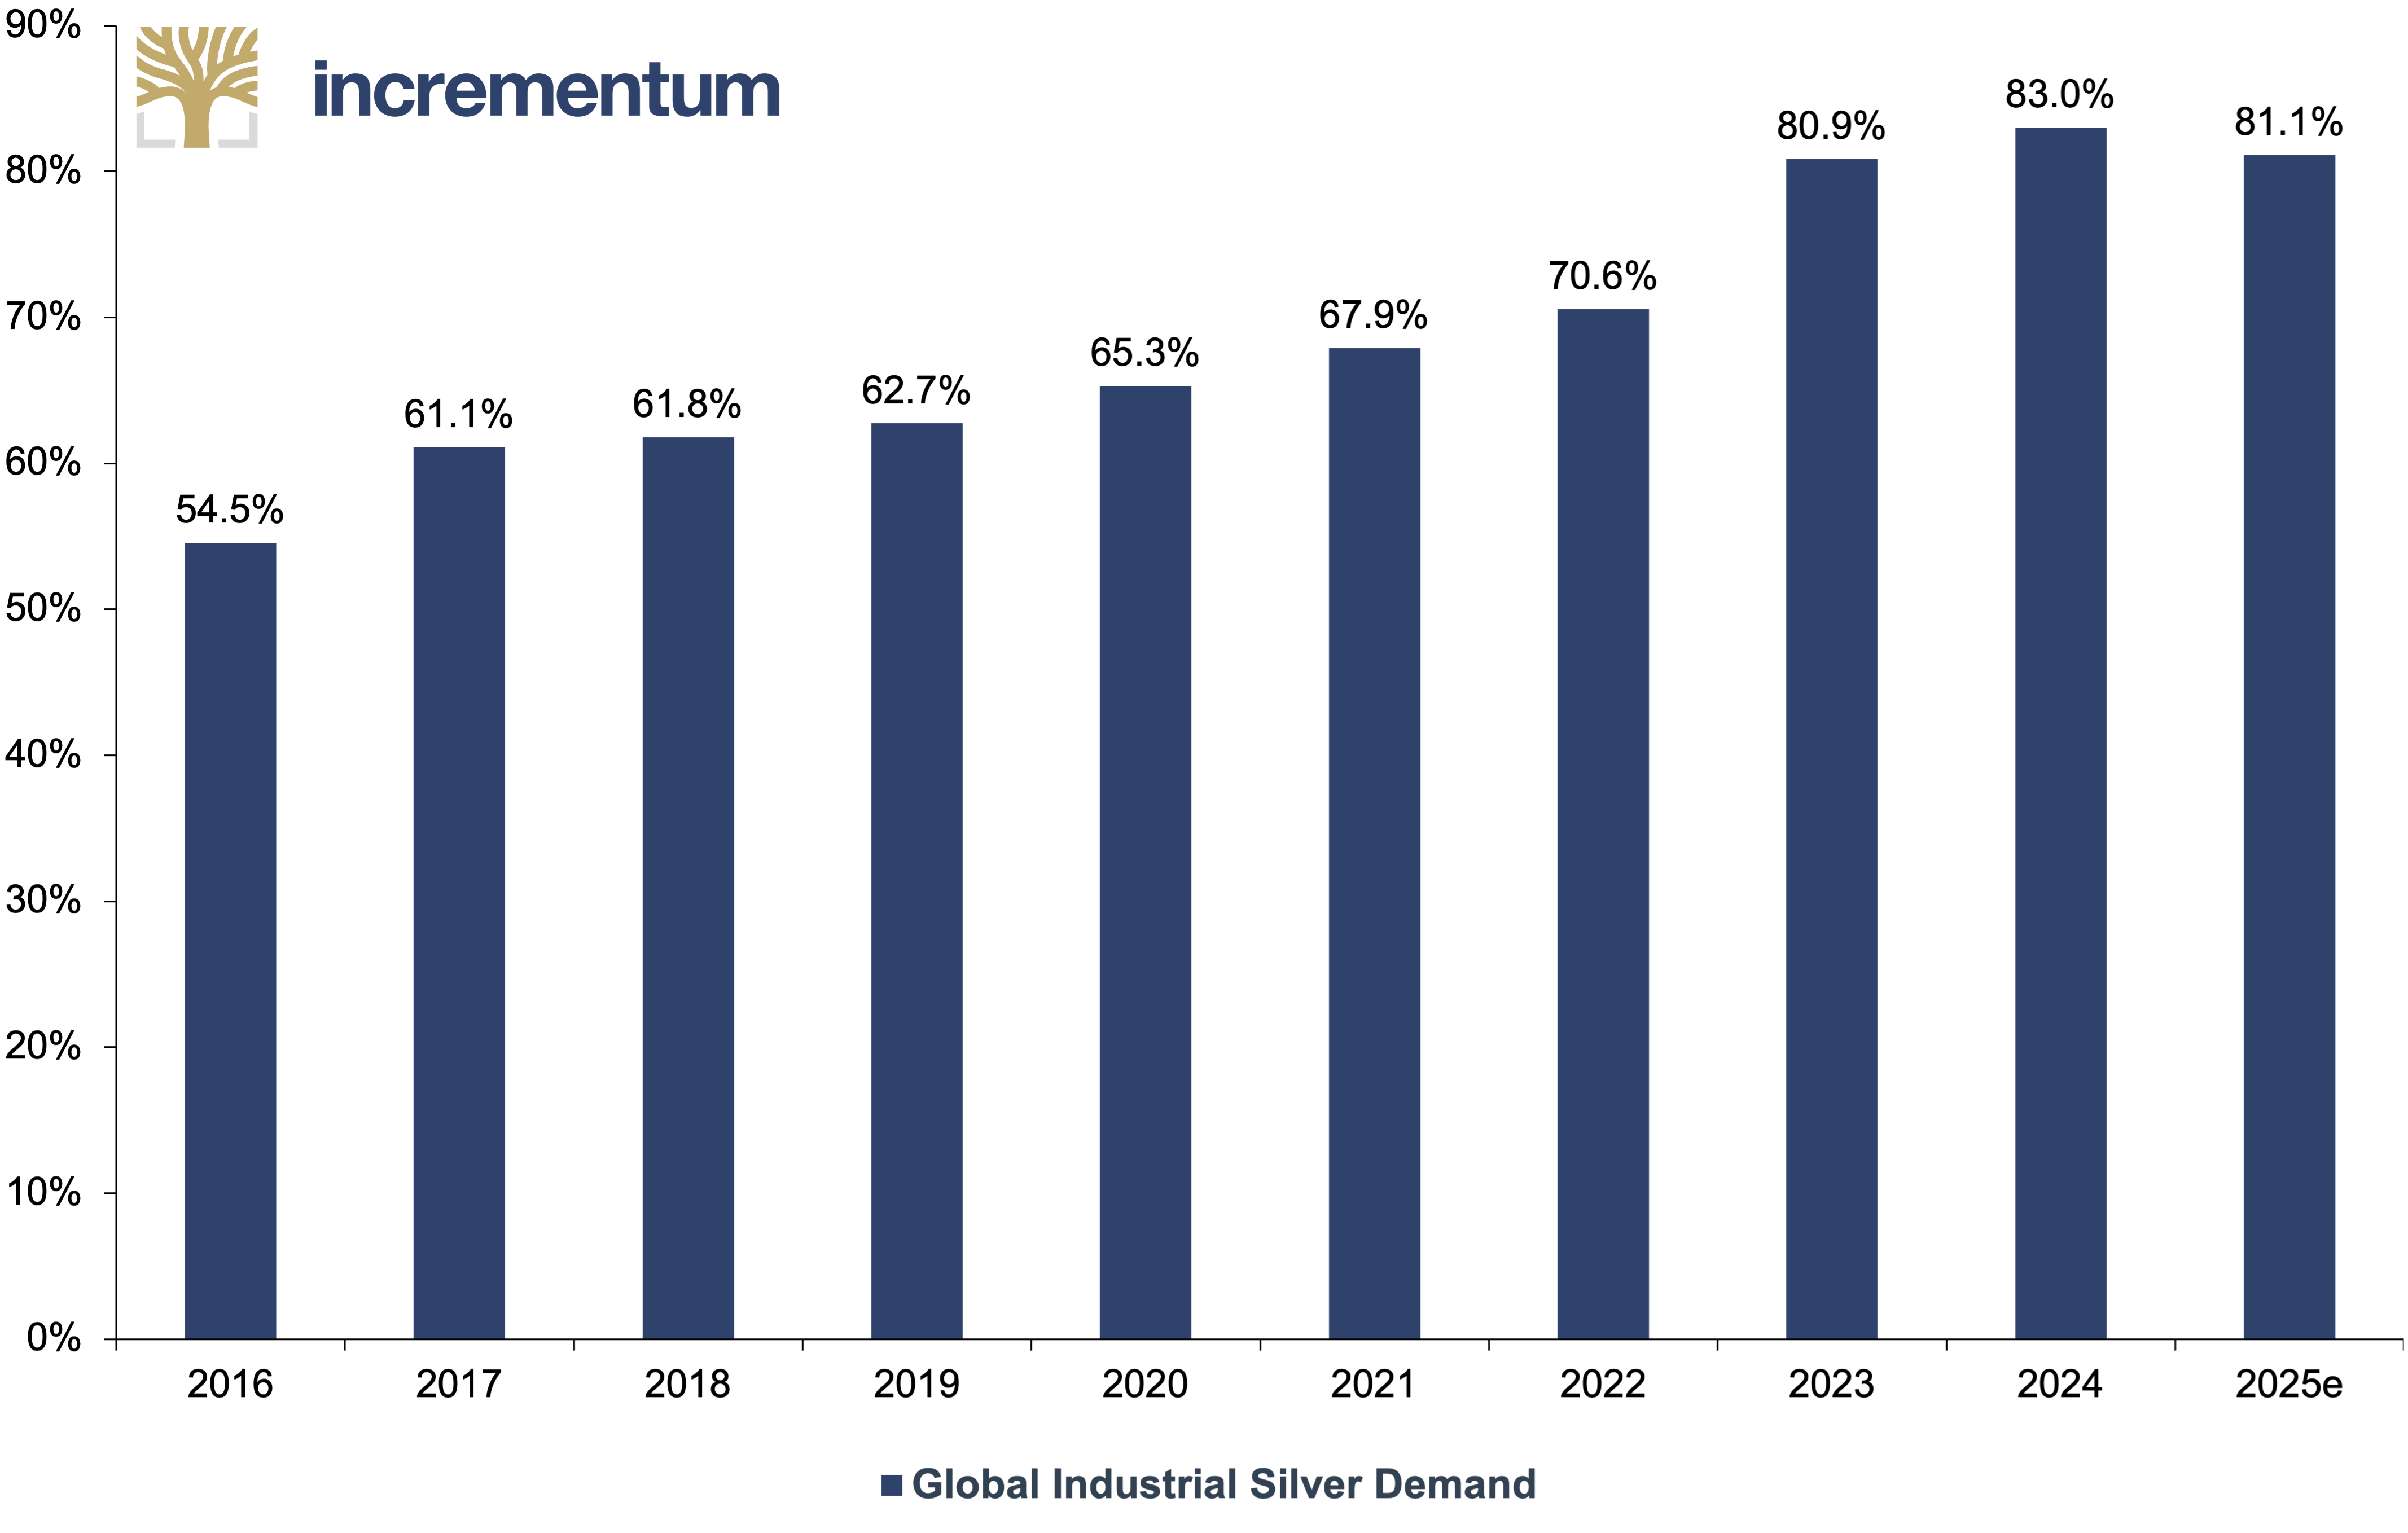
Source: The Silver Institute, Incrementum AG
Military and Safe Haven Demand: An Unforeseen Silver Bullet?
Inexorably intertwined with industrial demand, yet often discarded from silver market analyses due to its highly classified nature, the military consumption of silver is the next silver price catalyst that warrants closer inspection, as we presently exist within a milieu of heightened geopolitical fragmentation – one that is newly characterised by an unprecedented rift between the US and the EU. French President Emmanuel Macron argued:
I want to believe that the U.S will stand by us. But we have to be ready if that is not the case. European states must be able to defend themselves better and deter any aggression, so that it strengthens our armies as quickly as possible and accelerates reindustrialization in all our regions. The future of Europe does not have to be decided in Washington or Moscow. The innocence, so to speak, of the last 30 years, since the fall of the Berlin Wall, is now over.
Macron’s remarks not only foreshadow the potential end of the road for the G7 and NATO, but are also flanked by record increases in military spending across the EU. Most recently, this includes the European Commission’s implementation of its Re-Arm Europe/Readiness 2030 strategy. Introduced in March, the policy is designed to mobilise a colossal EUR 800bn over four years to finance European “defence readiness”.
Principally, the relevance of this to silver lies in its historical role as a metal of war – a title earned from its usage in tomahawk missiles, as well as in silver-oxide-based batteries used in propulsion and guidance systems. To this point, US Congress archives disclose that 100 Moz of silver were being consumed by the US at the height of World War 2 in 1942. The War Production Board was quoted as saying that 200 Moz of silver would be required in 1943. As H. W. Boynton explained to the US Congress on October 14, 1942:
The present consumption of silver for war purposes is at the rate of about 100 Moz a year and is growing rapidly. According to the War Production Board, it is only a matter of months before war demands will have sufficiently increased to require at least 20o Moz a year. Thus, if the estimate is correct, the demand for war purposes alone will next year exceed the total of available foreign and domestic production, which combined is about 175 Moz.
Admittedly, we are not embroiled in a World War 3 scenario yet. As such, 100 Moz of silver usage in 2025 is far-fetched. Despite this, we see rises in silver’s military offtake in light of the EU’s planned defence outlays, escalating US-China tensions, and the recent re-ignition of a centuries-old India-Pakistan conflict. Coincidentally, this environment of pronounced geopolitical conflict is conducive to short-term silver price catalysts, as is exemplified by the metal’s safe haven quality in response to crises over the last 50 years.
Impact of Geopolitical events on Silver and Gold Prices
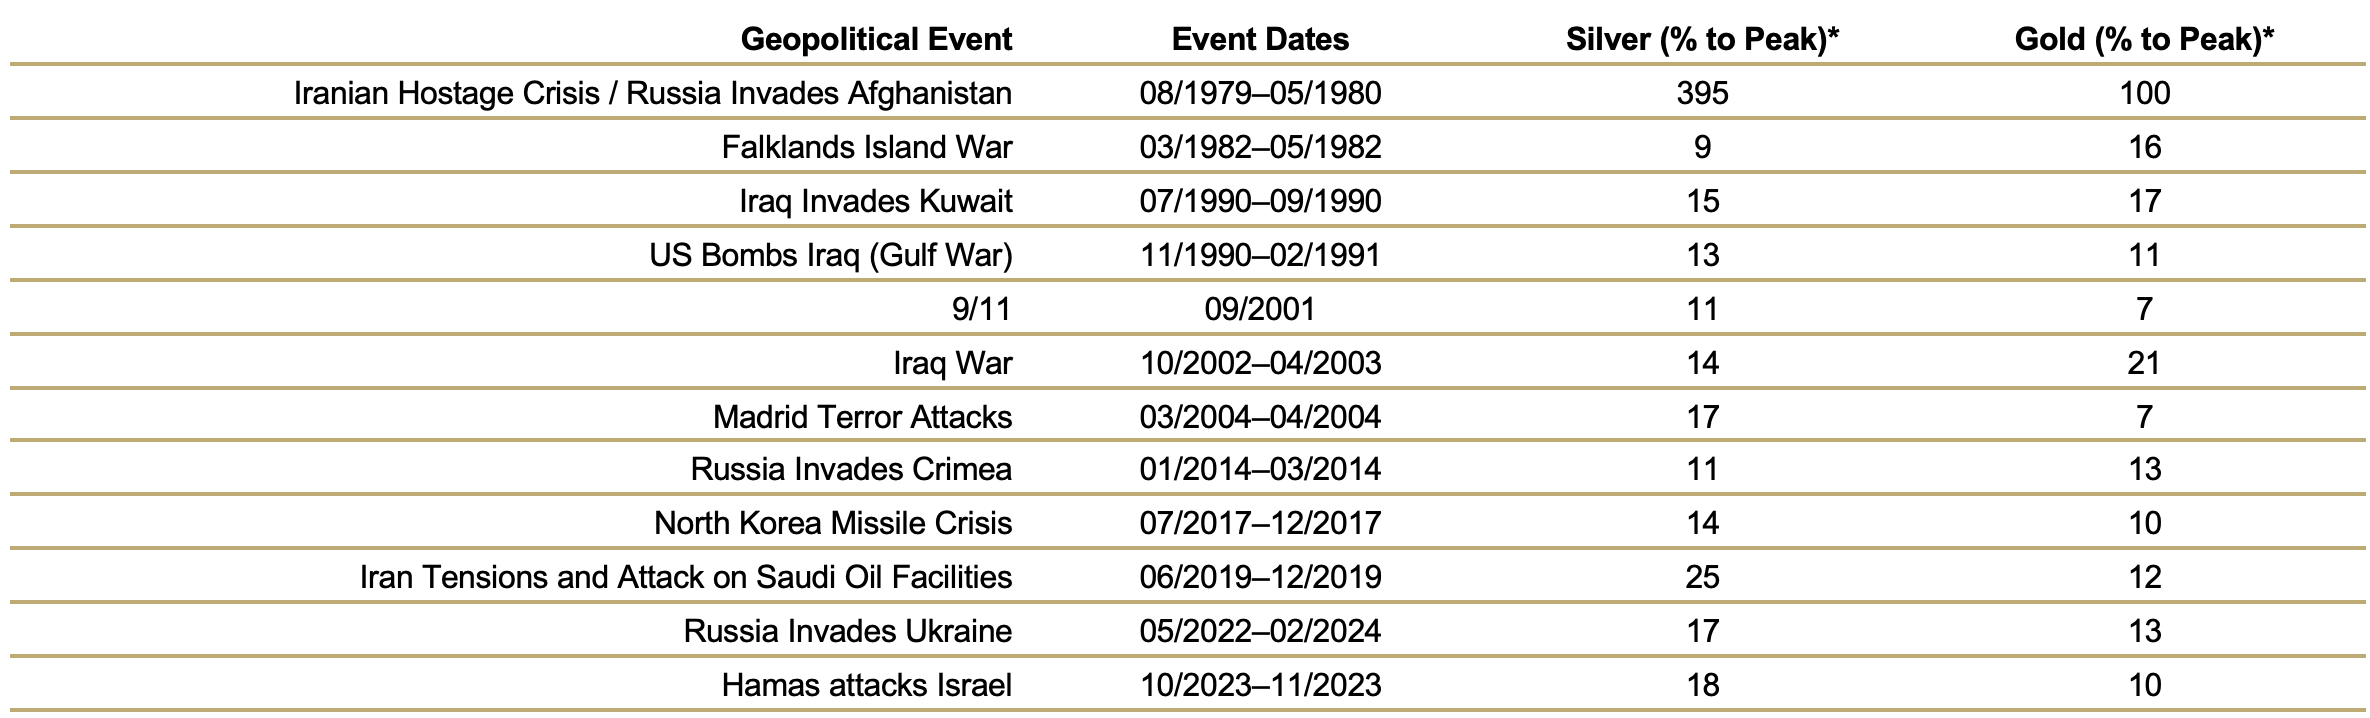
Source: The Silver Institute, Incrementum AG
*(% to Peak) measures the percent change in price from the pre-event trendline to the peak of the geopolitical surge.
Silver ETPs: An Impetus for Indian Investment Demand
Moving away from industrial demand and towards a more cultural determinant, India is a country of roughly 1.45bn inhabitants who hold the key to unlocking new and uncharted territory for the silver price. This is evidenced by the country’s 225 Moz of silver imports in 2024 – a quantity on par with solar’s silver offtake. It is also supported by the fact that the 2024 figure represents double the amount of Indian silver imports in 2023 of 112 Moz.
Of course, as with gold, the lion’s share of this consumption has historically derived from jewelry and silverware. This trend was reinforced in 2024, when India was responsible for approximately 42.1% or 87.9 Moz of total silver jewelry demand and 67% or 36.8 Moz of total silverware demand. Incidentally, this made India the primary driver behind the 3% rise in silver jewelry fabrication in 2024, as factors such as a bullion import duty cut propelled the total silver jewelry demand to 208.7 Moz.
Notwithstanding the fact that many analysts assumed rising prices would motivate Indian investors to liquidate their extensive silver holdings, Metals Focus noted that selling has been “trivial” even as the silver price eclipsed the psychologically important INR 100,000 mark. At the same time, an Indian silver demand category with the firepower to offset any weakness in silverware and jewelry demand has been quietly emerging. Namely, Indian silver ETP holdings are on track to reach over 200 Moz by 2027.
Indian Sliver ETP Holdings, in Moz, 2022–2028e
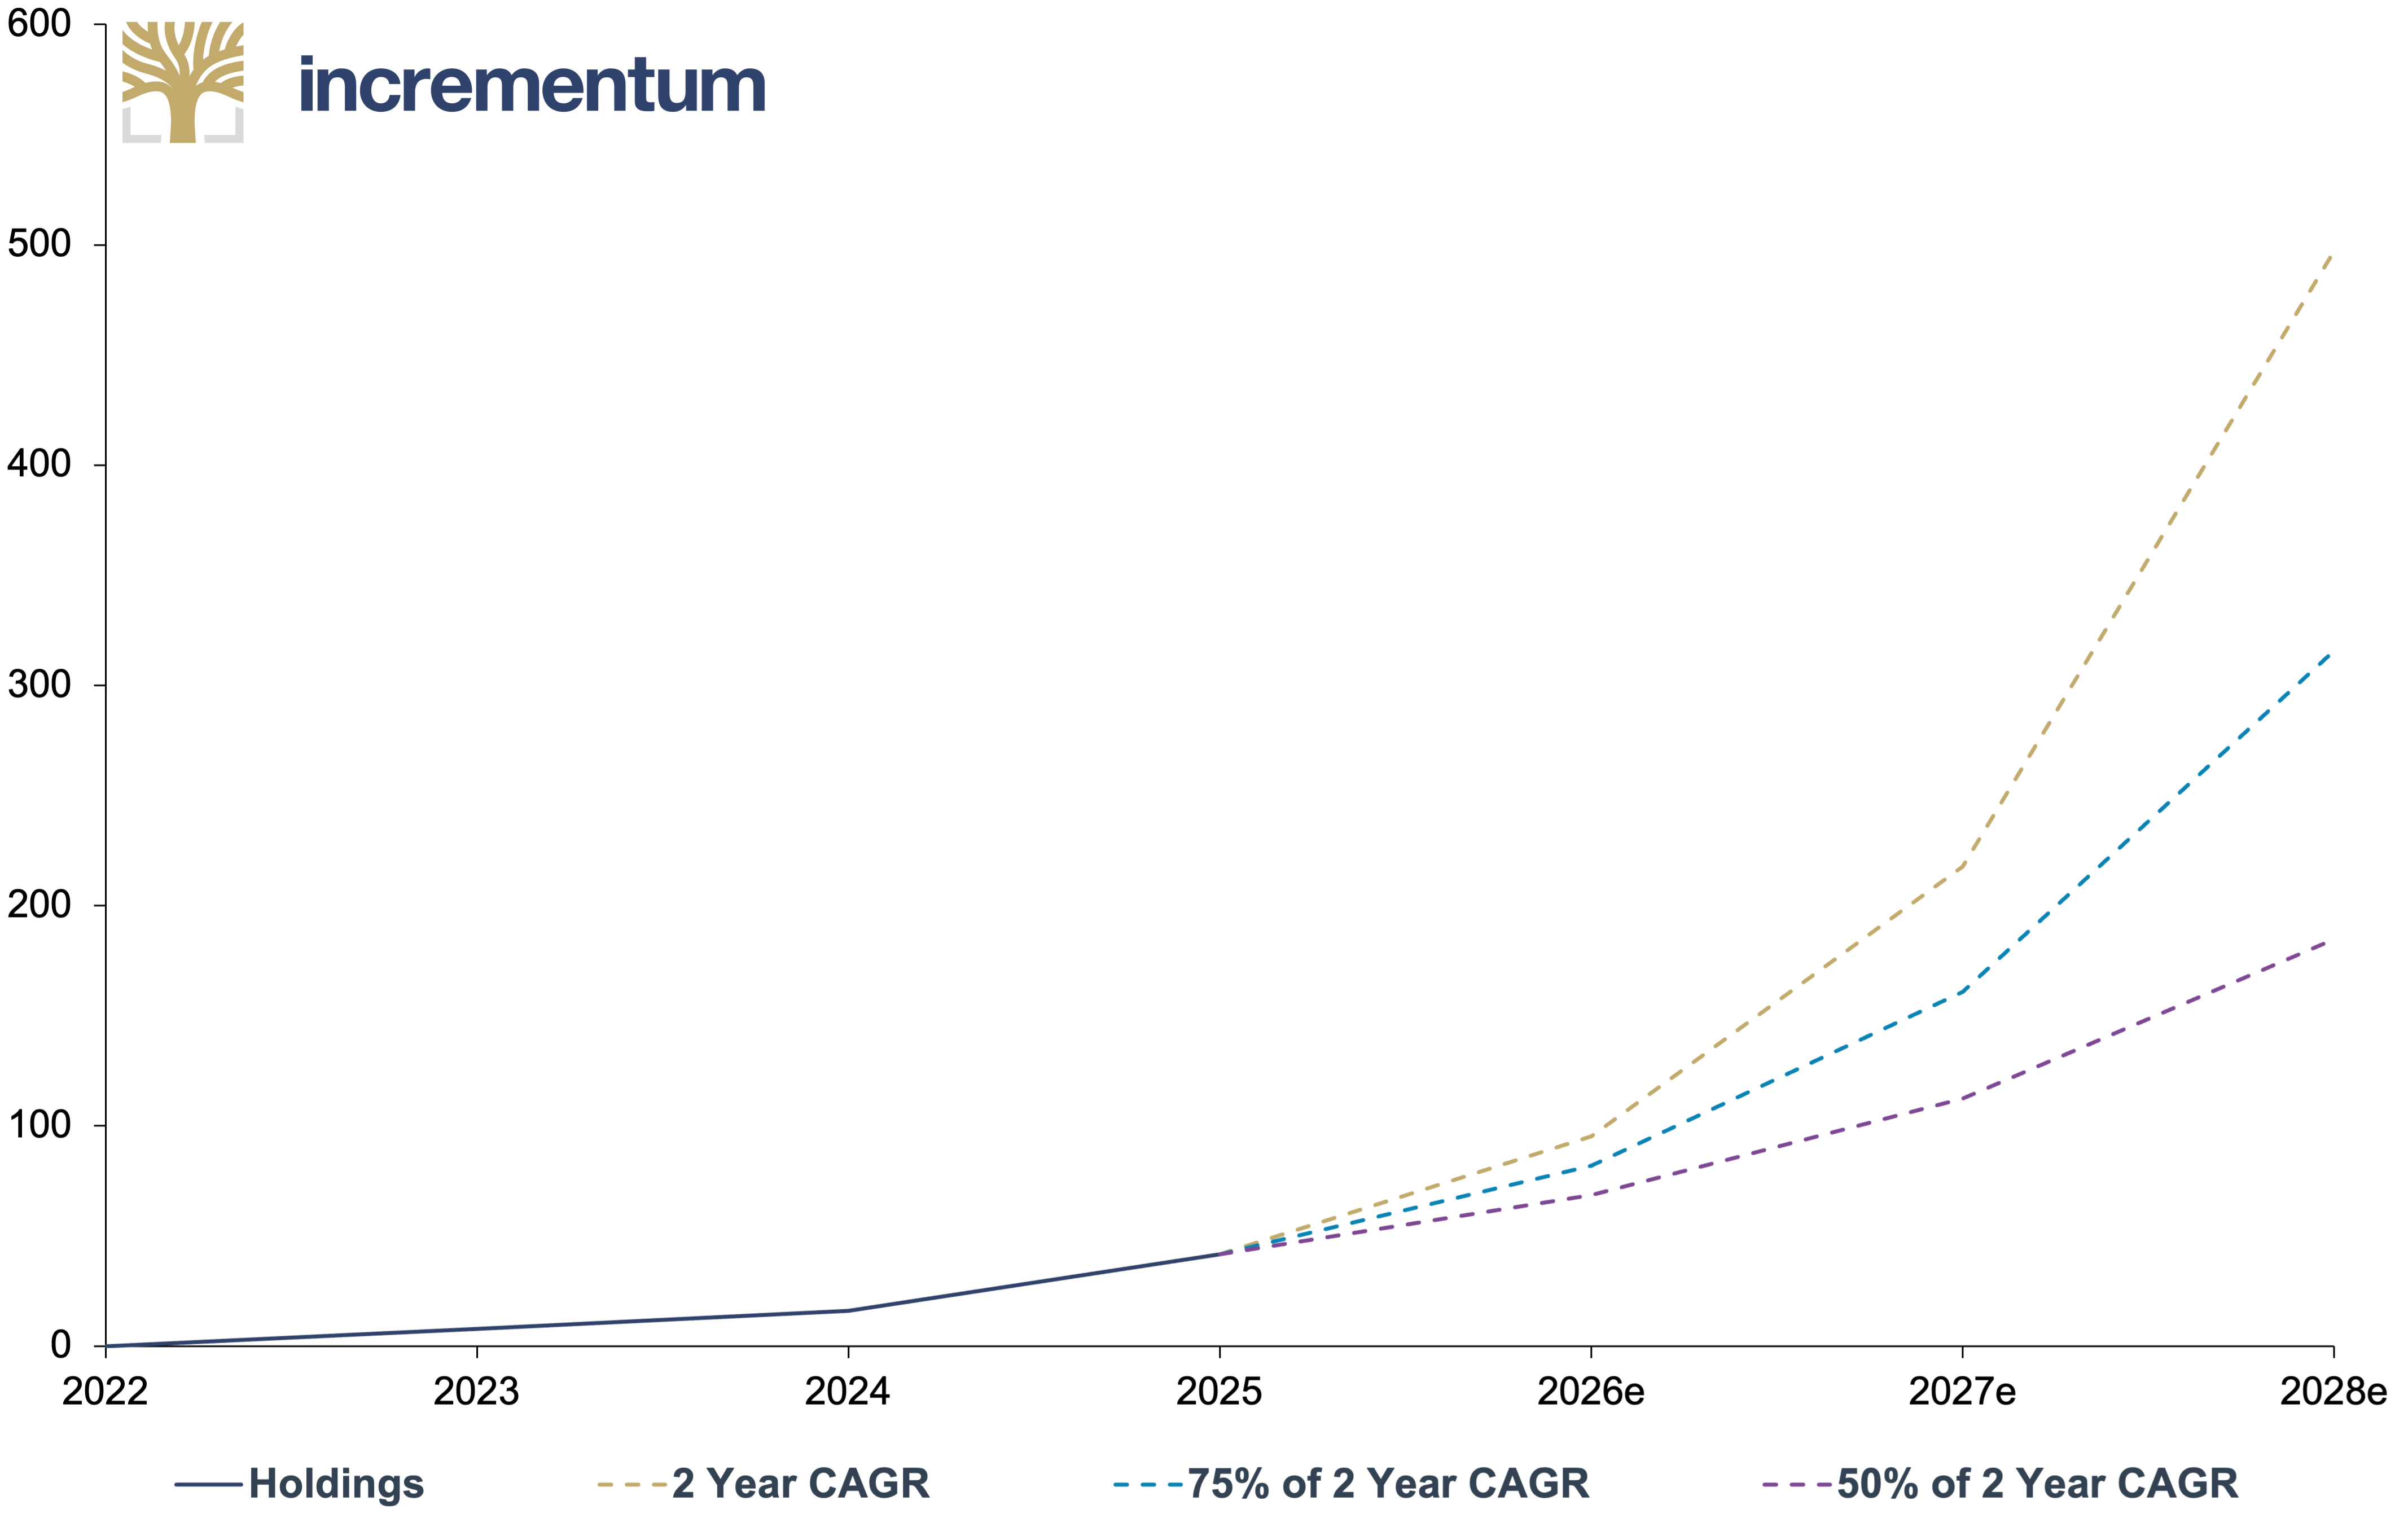
Source: Silver Institute, Metals Focus, Incrementum AG
More specifically, Indian silver ETP holdings surged to a record high of 38.6 Moz in 2024, helping bring net global silver ETP investment to a healthy 61.6 Moz for the year. This rise marked a sea change from the substantial 117.4 Moz outflow in 2022, contributing to a total silver market balance (including ETPs) of -210.5 Moz for 2024 – the second most negative since 2008. As such, India may be deemed the impetus for the revival of silver investment demand.
Whilst this may come as a surprise, it’s worth noting that Indian investors have accumulated over 17,000 t (546 Moz) of silver in bar and coin form over the last 10 years. Since then, the only change has been the increased digitalization of silver investment via ETPs – the results of which can be viewed as an astounding reaffirmation of silver’s monetary metal status: Silver ETPs were equivalent to 40% of India’s total annual retail investment in 2024, compared with just 5% for gold ETPs.
According to the Silver Institute, a rise in financial awareness can be cited as the primary driver of India’s silver ETP boom, along with the convenience of liquidity compared to physical silver and positive price expectations in light of silver’s drastic undervaluation to gold. Thus, we should not be surprised by the sharp rise in Indian trading accounts over the last 5 years – the total of which rose from 41mn in March 2020 to 185mn by end-2024, and included 77mn accounts added in 2023–2024.
Moreover, technological innovation helped India’s physical silver investment rebound in 2024 by 21% to 59.8 Moz, as silver (and gold) coin sales on Q-Commerce platforms grew by 14x compared to 2023. Meanwhile, turnover on the International Bullion Exchange (IIBX) also jumped to 36.2Moz in 2024, comprising 16% of India’s total imports. Naturally, India’s silver demand prospects are robust beyond 2025, as a culturally ingrained asset meets a digitally enabled younger generation.
Silver the Inflation Hedge: A Turkish Case Study
Unlike India, the West showed a distaste for physical silver investment in 2024, as coin and bar demand plummeted 22% yoy to a 5-year low of 190.9 Moz. Shedding 20% yoy in Europe (-5.3 Moz) and a staggering 46% yoy in the US (-55.8 Moz), the decline can be attributed to cost-of-living challenges and curtailed safe-haven demand in the absence of new crises. As such, the category sits 44% lower than 2022’s peak of 338.3 Moz. And yet, demand is expected to rebound 7% to 204.4 Moz in 2025.
Perhaps catalyzing this rebound, inflation has historically provoked silver monetary demand in certain instances, albeit to a lesser degree than gold. Most recently, this relationship was visible in Türkiye, where inflation rose for 18 consecutive months, from 16% in May 2021 to a peak of 85% in October 2022. We observe that Turkish silver imports rose sharply in response to this hyperinflation, as Turks elected the white metal to protect their purchasing power.
Türkiye: Annual Silver Imports (lhs), in USD bn, and CPI (rhs), 01/2018–12/2024
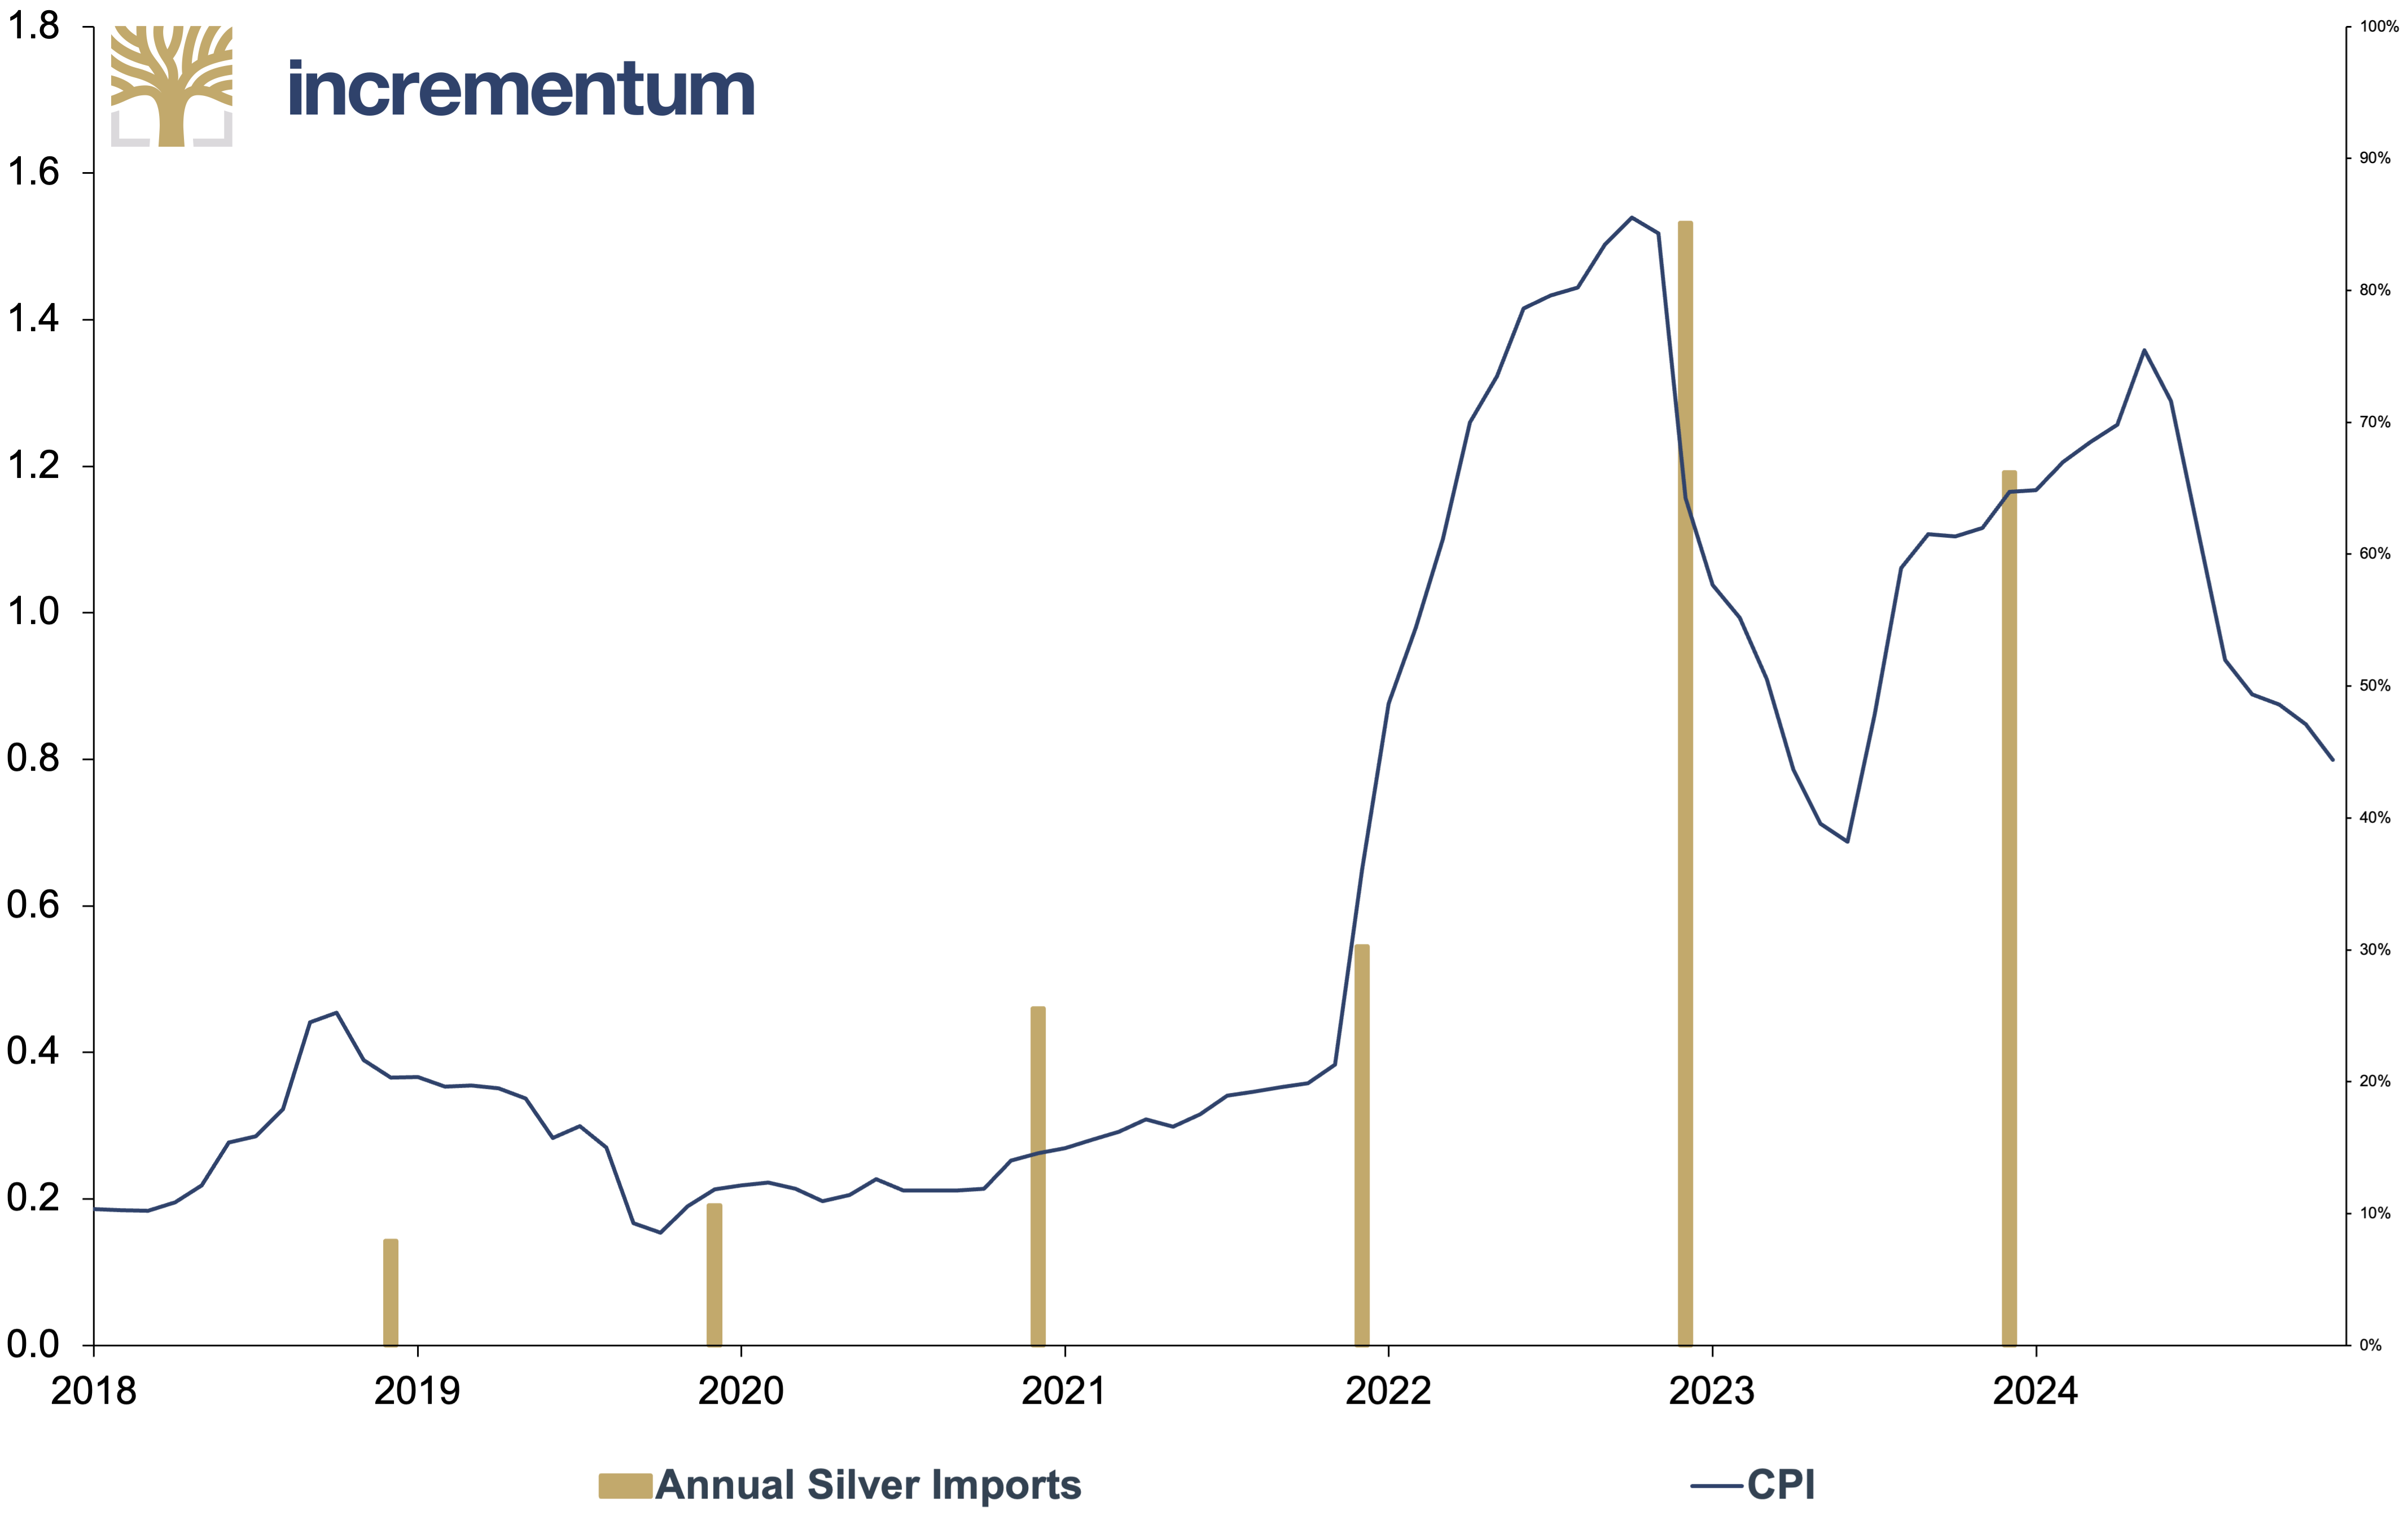
Source: World Integrated Trade Solution, LSEG, Incrementum AG
Of course, the Turkish psyche may not necessarily translate to US investors, who have made a beeline for gold as their monetary metal of choice in recent years, partly due to US disposable incomes being 4.4 times higher than Türkiye’s. Despite this, the above case study proves silver can function as a monetary metal, as is reinforced by the In Gold We Trust report 2024, where we cited silver’s average 332% return during the Federal Reserve’s rate-cutting cycles post-2000.[5]
Moreover, it is feasible to envisage a perfect storm for silver investment demand in the coming years, lifted by the favourable tailwind of interest rate cuts and inflation. For one, Federal Reserve Chair Jerome Powell appears prone to crumbling under pressure from President Trump to cut rates amidst recession fears. Second, Trump’s tariffs are set to be inherently inflationary, necessitating an even weaker dollar, or else US exports will cease to be competitively priced globally.
With that said, it’s vital to note that Trump’s tariffs may instigate a US recession, which would be bearish for silver, as indicated in our Incrementum Recession Phase Model from the In Gold We Trust report 2023.[6] Importantly, this could transpire if Powell ignores Trump’s
“recommendations” and justifies holding rates steady. Despite this, silver remains protected by big brother gold in the form of a 0.77 correlation since 1999, which should mitigate silver’s recession risk, provided gold’s price leadership continues.
Weekly 1 Year Correlation of Gold and Silver, 01/1971–04/2025
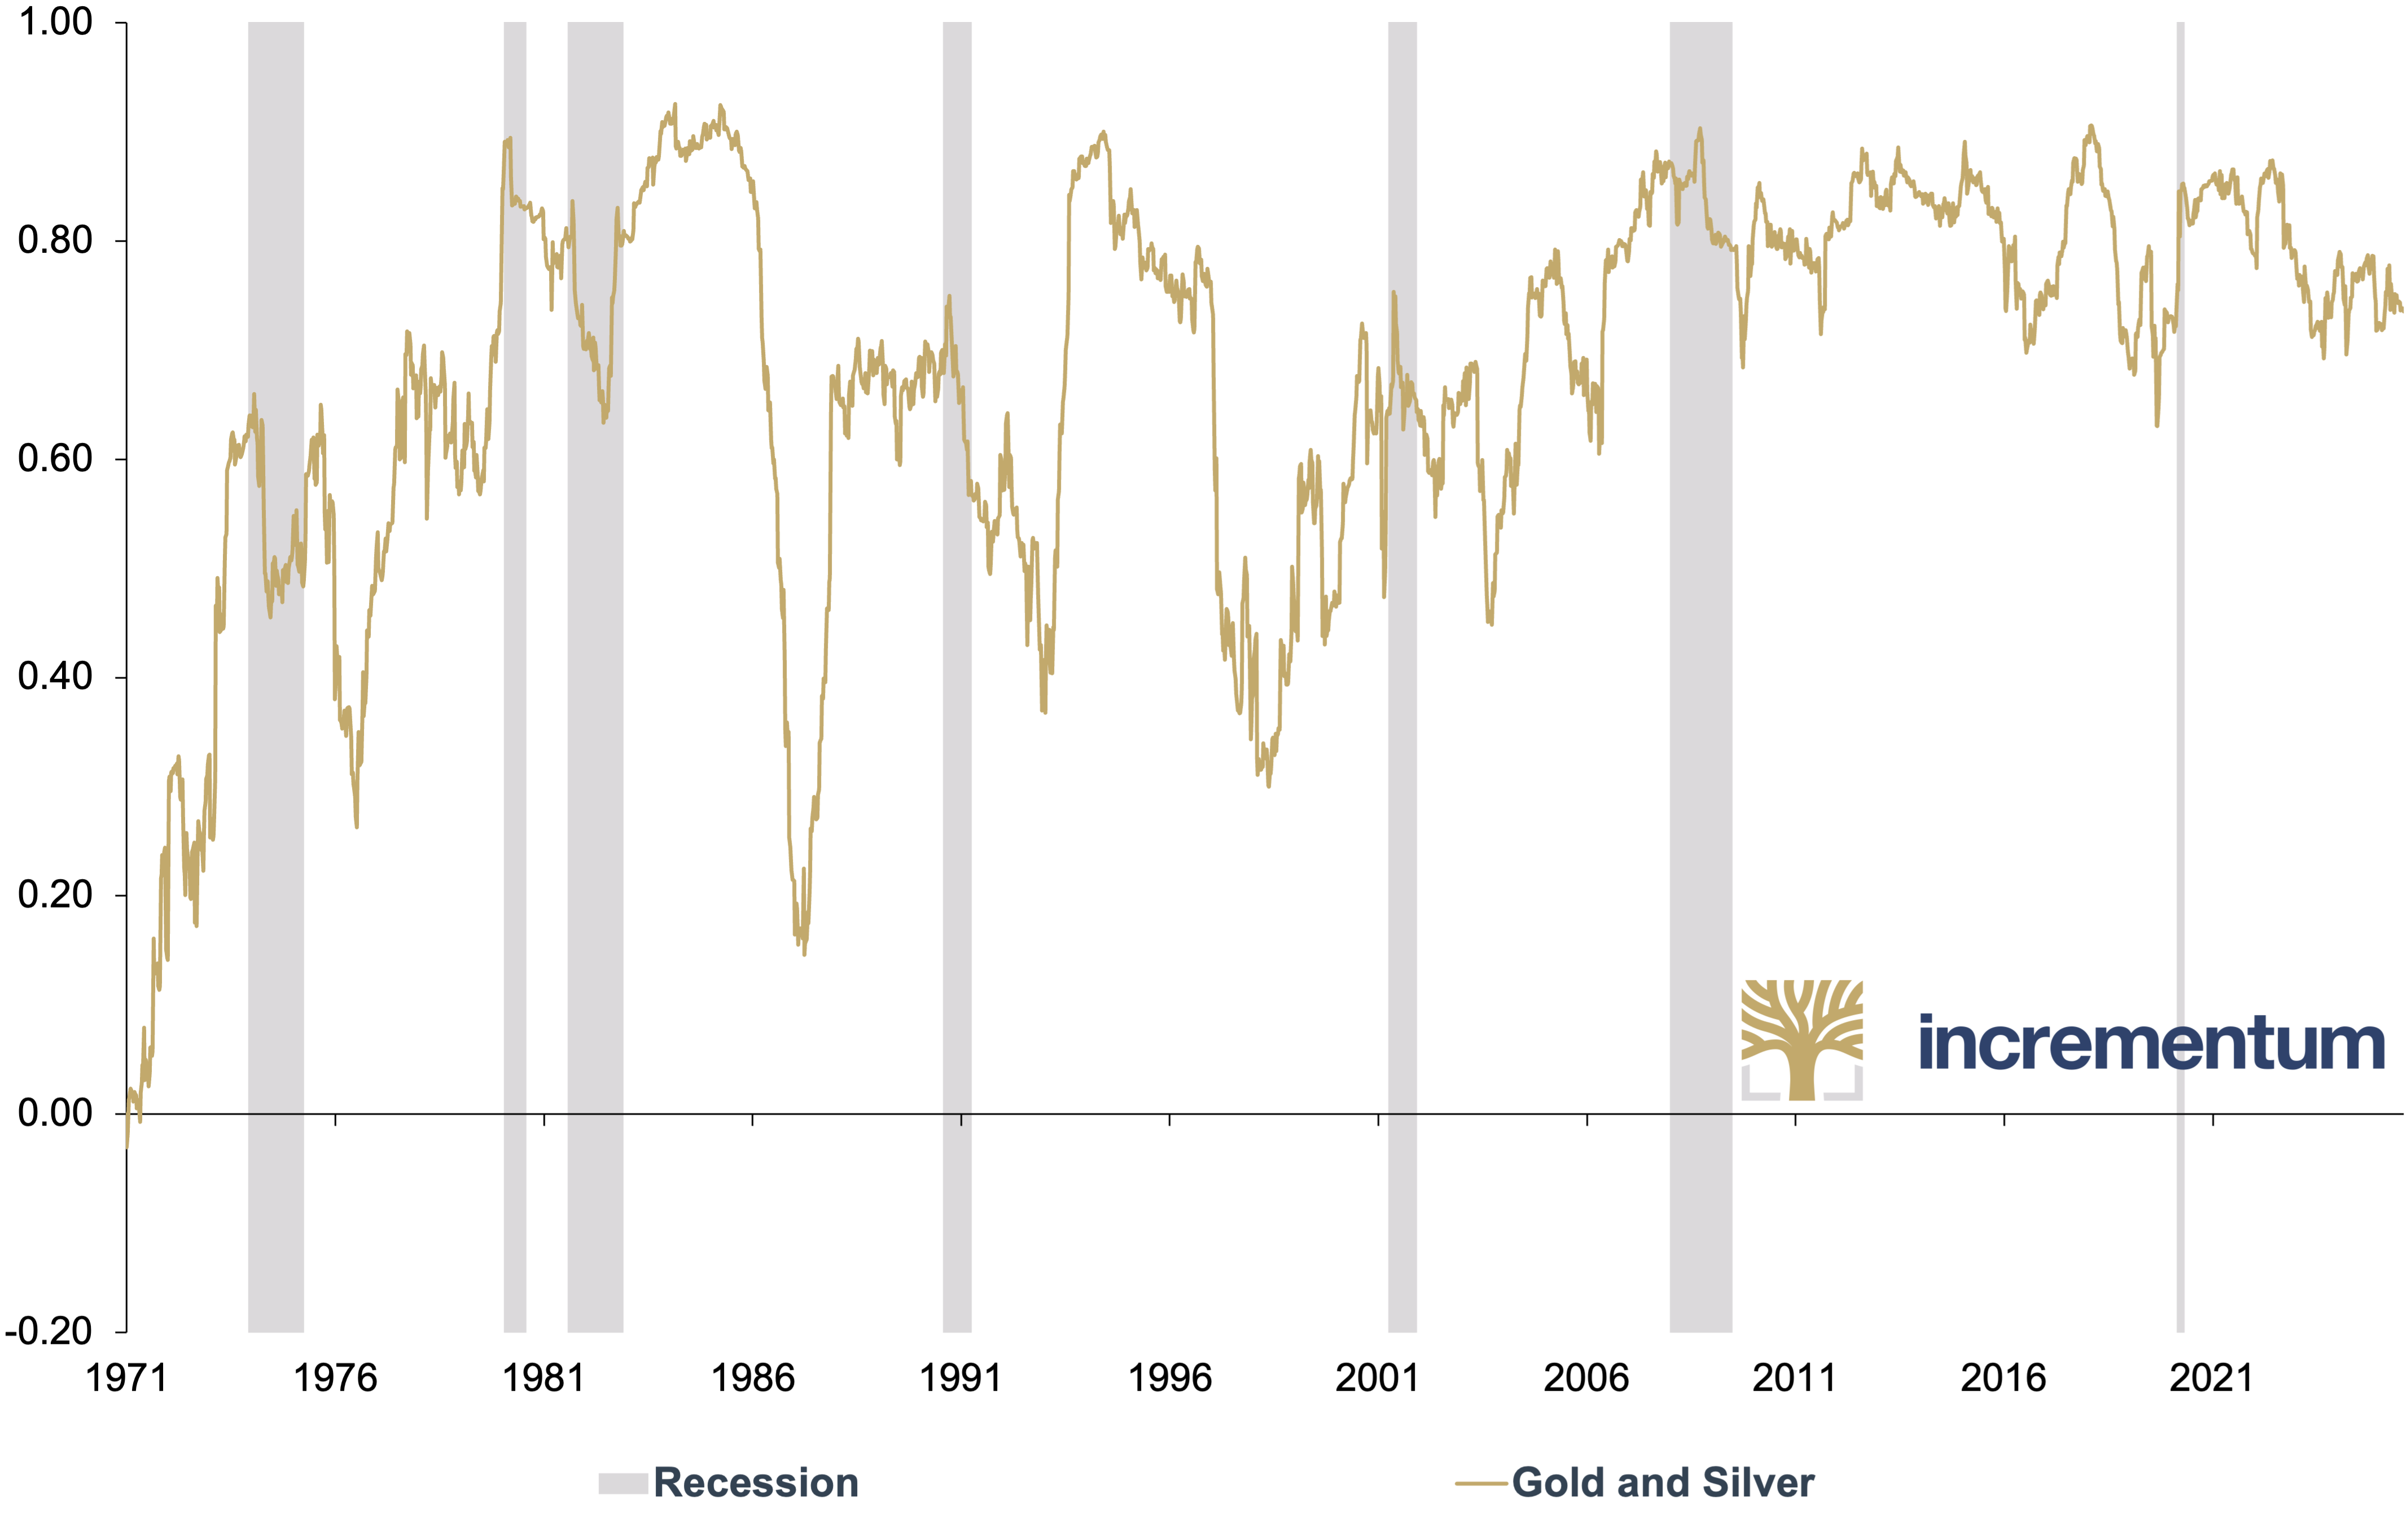
Source: Nick Laird, LSEG, Incrementum AG
Silver’s Supply Crunch
With the most noteworthy silver demand drivers sufficiently covered, we now focus on silver supply, which grew by approximately 2% yoy (17.3 Moz) in 2024 to a total of 1,015.1 Moz. Despite this rising supply – and a 3% yoy fall in total silver demand to 1.164.1 Moz – silver still recorded a supply deficit of 148.9 Moz in 2024, excluding ETPs. This marked the 4th consecutive year of supply deficits, bringing the cumulative deficit since 2021 to a substantial 678 Moz.
Notably, 7 Moz of the annual increase can be attributed to silver mine production, which rose 1% yoy in 2024 to 819.7 Moz. According to the Silver Institute, this change was primarily derived from the resumption of full production at Newmont’s Penasquito, which almost single-handedly drove Mexico’s output up by 3.8 Moz yoy. Elsewhere, leadership from Australian lead/zinc mines helped lift the nation’s silver production by 6.2 Moz yoy, thus offsetting a 17% yoy (-8.8 Moz) drop in Chile.
Although output from primary silver mines registered yet another annual decline of 2% yoy in 2024, recycling grew 6% yoy or 10.4 Moz to 193.9 Moz last year. Primarily, the shift was driven by the processing of spent ethylene oxide catalysts, which caused industrial recycling to rally 5% yoy or 4.8 Moz. Not least, cost of living-related liquidations also governed an 11% yoy jump or 2.5 Moz in silverware recycling.
In 2025, silver recycling is set to flatline at around 193.2 Moz, constrained by photographic scrap’s structural decline and depleted silverware stocks in the West. Meanwhile, silver mine production is expected to rise by 2% yoy to 835.0 Moz in 2025. Endeavour Silver’s Terronera project comes onstream and Peñoles’ mines return to full production after operational challenges in 2024. Chilean production, led by CODELCO and Kinross’ La Coipa, is also expected to reach higher levels.
All things considered, total silver supply is forecasted to grow 2% to 1,030.6 Moz in 2025 and will be met by a marginally lower total silver demand of 1,148.3 Moz. On balance, these market dynamics are set to converge to produce a 117.6 Moz silver supply deficit in 2025. Marking the 5th consecutive year in a row and totaling 796 Moz of cumulative supply deficits from 2021–25, this 5-year silver supply deficit would be collectively sufficient to equal a full year of global silver mine production.
Cumulative Silver Market Balance incl. ETPs and Silver Supply Deficit vs. Silver Mine Production, in Moz, 2016–2025e
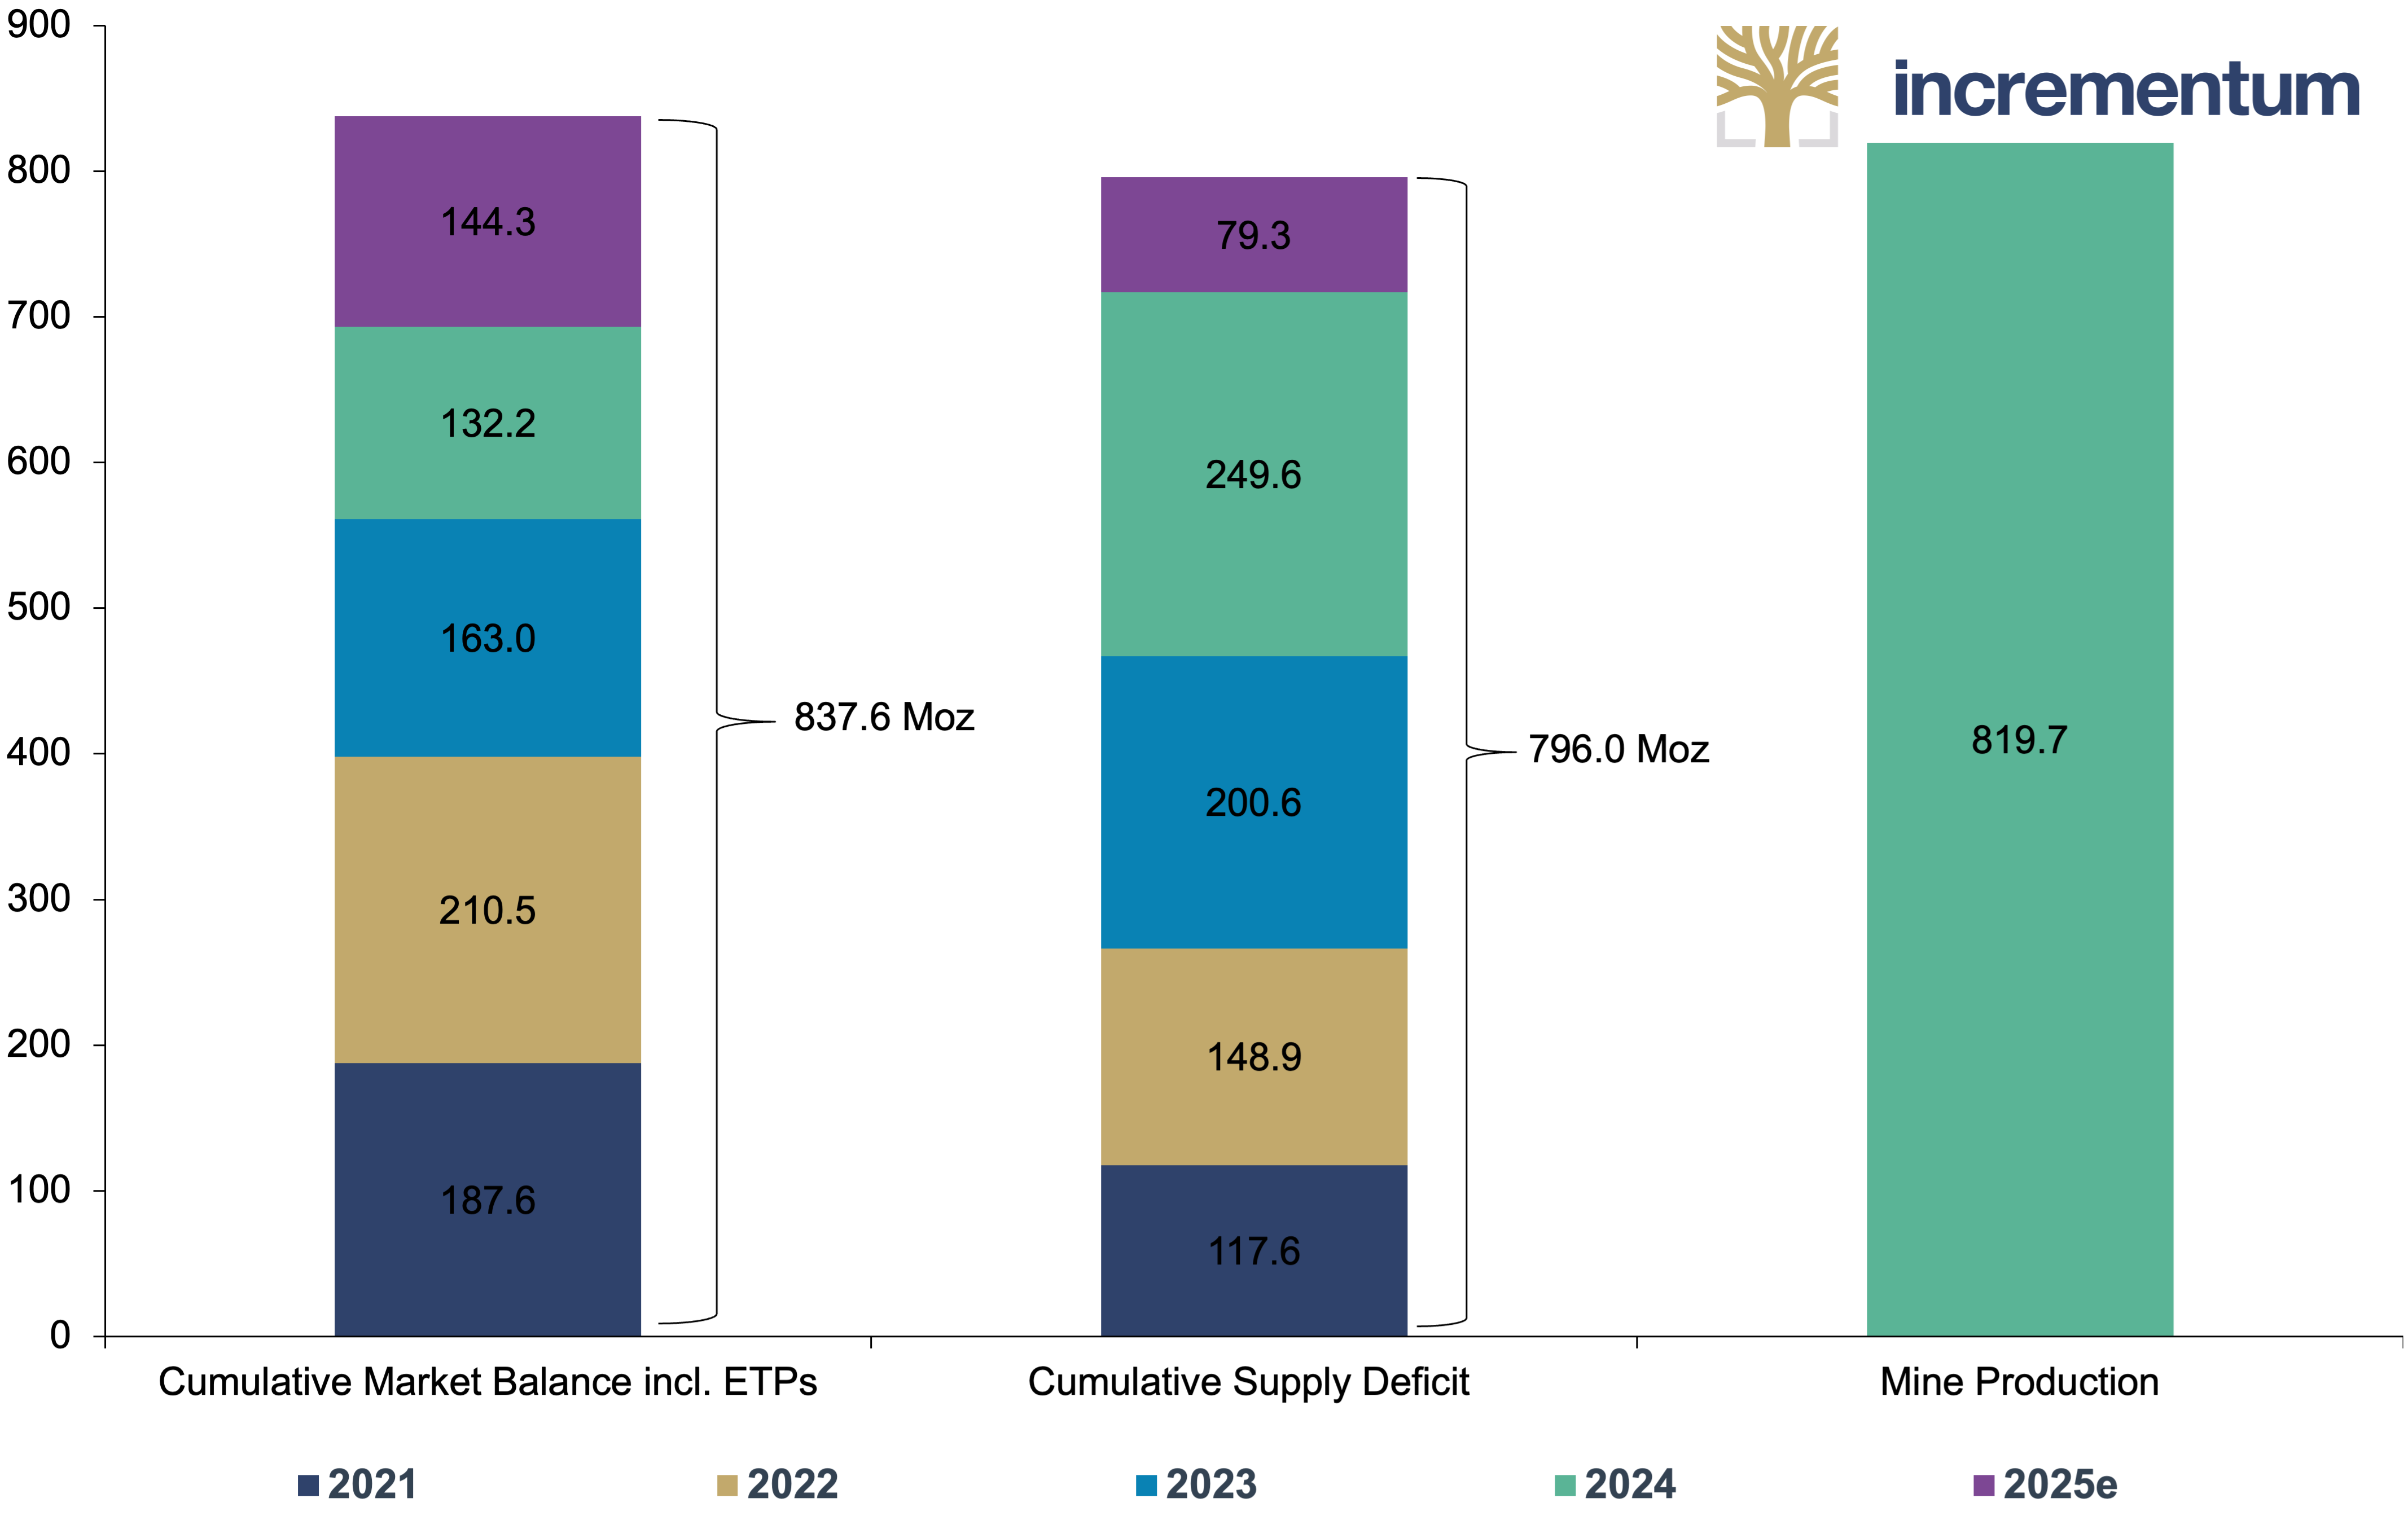
Source: The Silver Institute, Incrementum AG
Incidentally, the Silver Institute notes: “We cannot expect much of a solution to this deficit position from mine production as this is expected to peak in 2026 and then to fall as several mines start to reach their end-of-life.” Thus, recycling must take on the baton meaningfully to help fill the void of future mine production. Furthermore, the Silver Institute cites the need for higher prices to stimulate growth in Indian jewelry and silverware recycling.
In this sense, silver supply will need to derive from sources outside of mine production and recycling if higher silver prices are to be kept at bay over the long term. Aside from an unforeseen fall in silver demand, the only supply-demand factor with the propensity to invalidate the silver supply deficit is above-ground stocks. According to the Silver Institute, these stocks are not only uncorrelated with the silver price but are practically irrecoverable at almost any conceivable silver price:
The World Silver Survey data on supply/demand for the 1960–2023 period, and, specifically, that on supply from Above-Ground stocks supports the conclusion that the bulk of the 57 Boz of historical silver mine production through to 2023 has either been truly “lost” or is practically irrecoverable at almost any conceivable silver price… There is no correlation between the overall level of Above-Ground stocks and the silver price.
With this in mind, the most transparent gauge we have as to whether the silver market is truly in a “supply crunch” is the silver inventories held on exchanges. Curiously, these inventories became subject to a transatlantic arbitrage opportunity earlier this year, initiated by fears amongst traders in the face of President Trump’s tariff policy. Causing EFP premiums to spike considerably, this dragged LBMA silver inventories to 711 Moz – the lowest level since publishing began.
LBMA London Vault Silver Holdings, in moz, 01/2018–03/2025
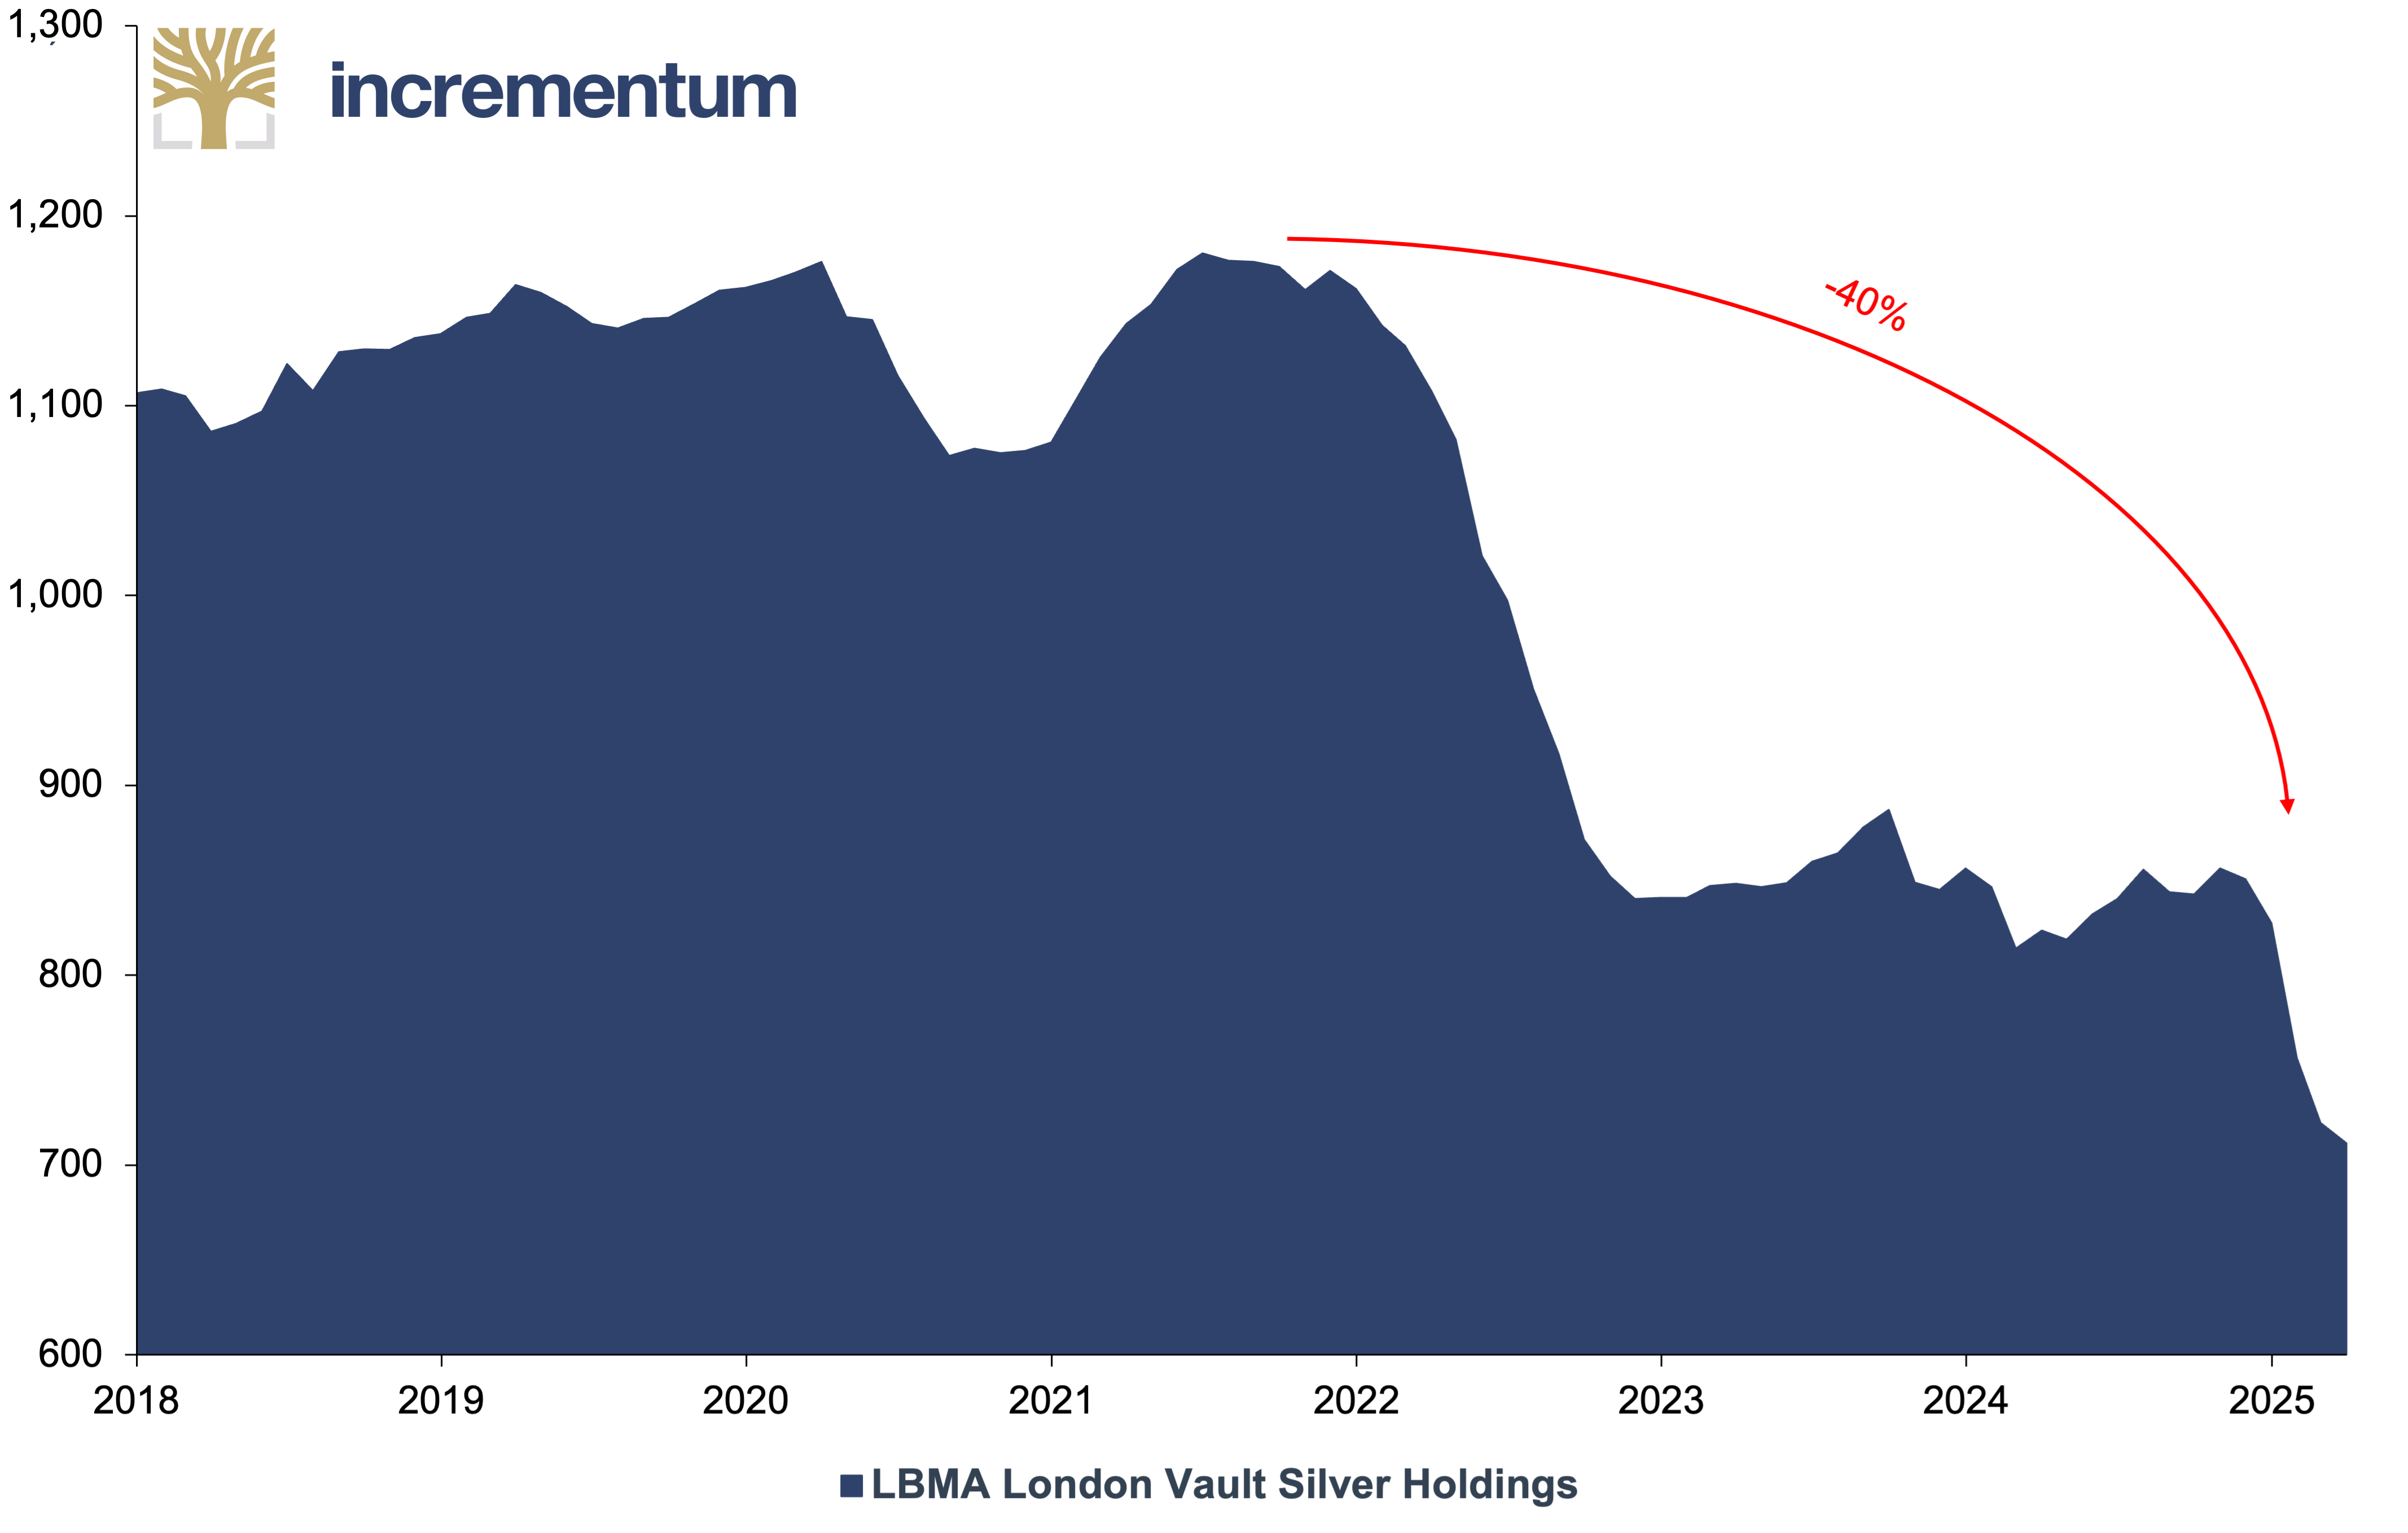
Source: LBMA, Incrementum AG
Admittedly, a proportion of this LBMA silver made its way to the COMEX, where silver stocks stood at 496 Moz as of April – some 100 Moz above the previous peak of in January 2021. Nonetheless, at least 530 Moz of silver has been collectively drained from LBMA and SFE stocks since their respective peaks in 2021. More presciently, 520 Moz of the LBMA’s total 711 Moz silver inventories are already tied up in ETFs. As a result, the LBMA’s daily trading volume – averaging 200 Moz – is no longer covered by free float, as was confirmed by TD Securities’, Daniel Ghali.
In short, this signifies that many reported silver inventories are unavailable for delivery, making the silver market susceptible to outsized purchases from “whales”. To wit, the billionaire tech founder of Entrata, David Bateman, revealed in April that he had invested close to USD 1bn in precious metals over the previous six months. Staggeringly, this included the purchase of 12.69 Moz of silver – equal to roughly 1.5% of the global annual supply.
In the context of peak mine production and flat recycling, one would therefore not be surprised if others followed suit in securing physical silver. Whether it be a Buffett- or Bateman-like “whale”, the collective middle class of India, or a notoriously resolute SLV shareholder acting on behalf of an industrial player, the silver price will not discriminate against who fuels its rise. Nor will the relatively minuscule silver mining industry, which will surely be a beneficiary from these inflows – even if only a fraction of generalists and institutional investors take notice.
Market Capitalization, in USD bn, 04/2024
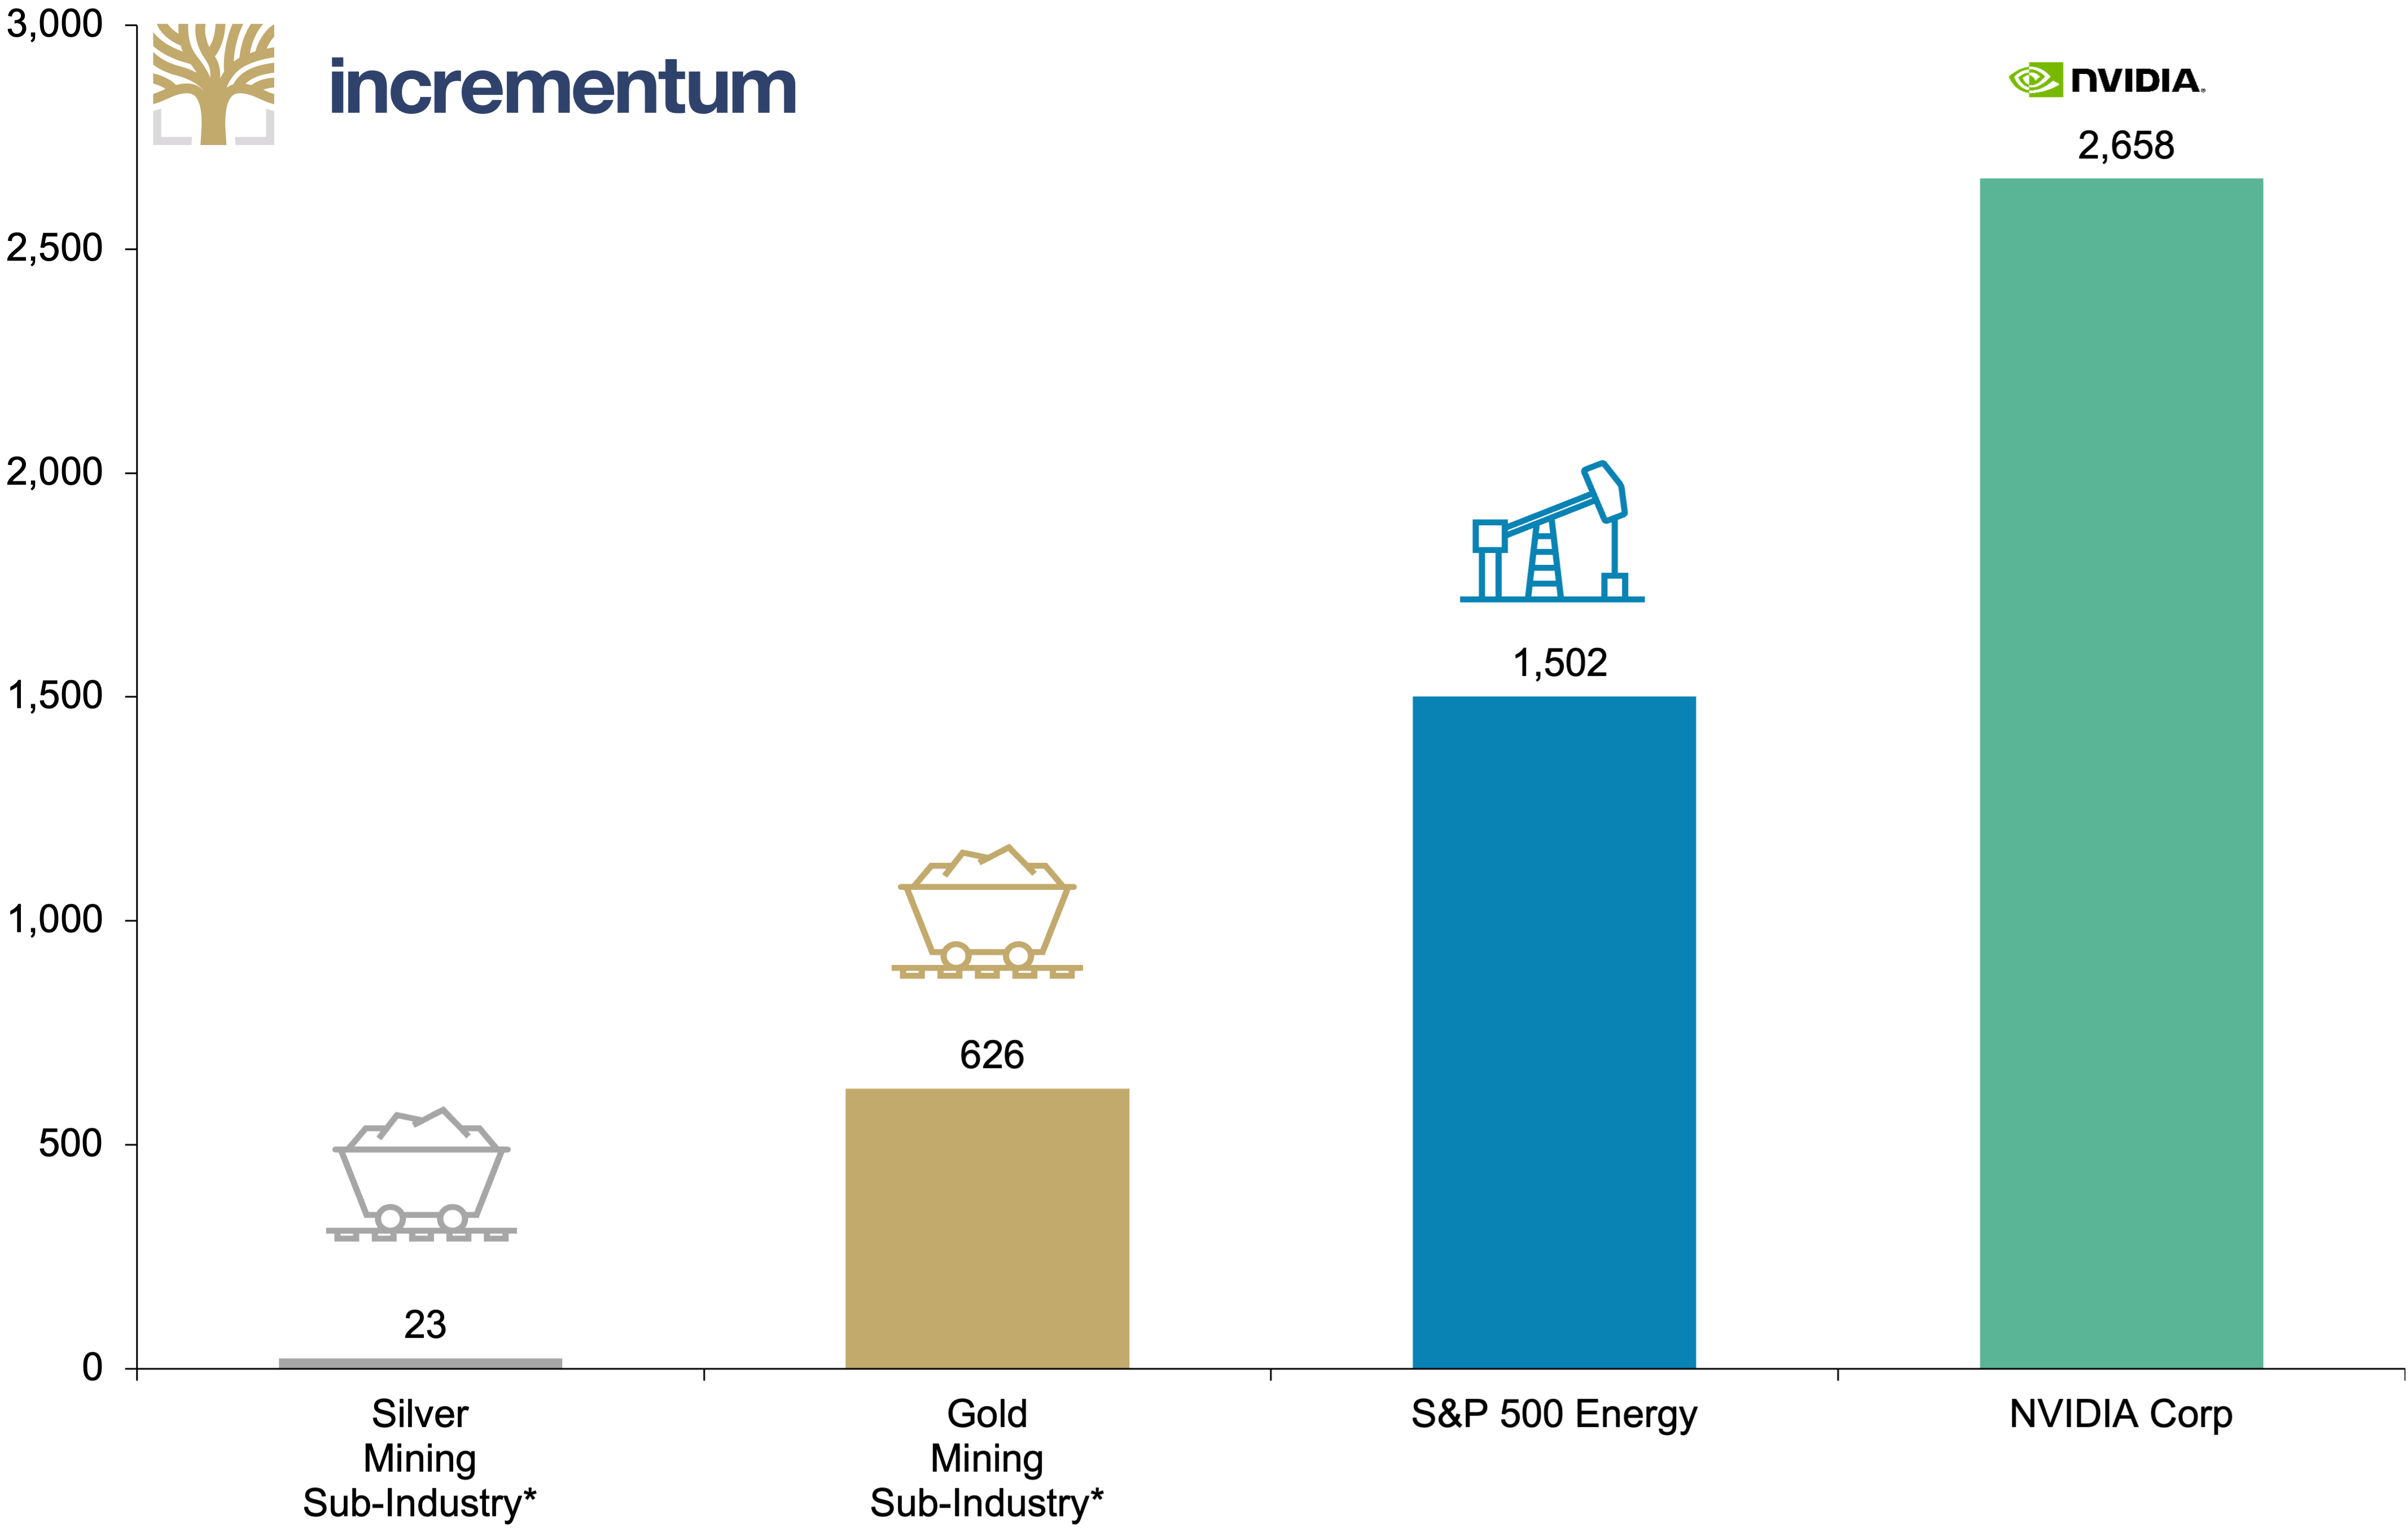
Source: LSEG, Incrementum AG
*GICS classification (Global Industry Classification Standard)
Conclusion: Caveats and Silver Linings
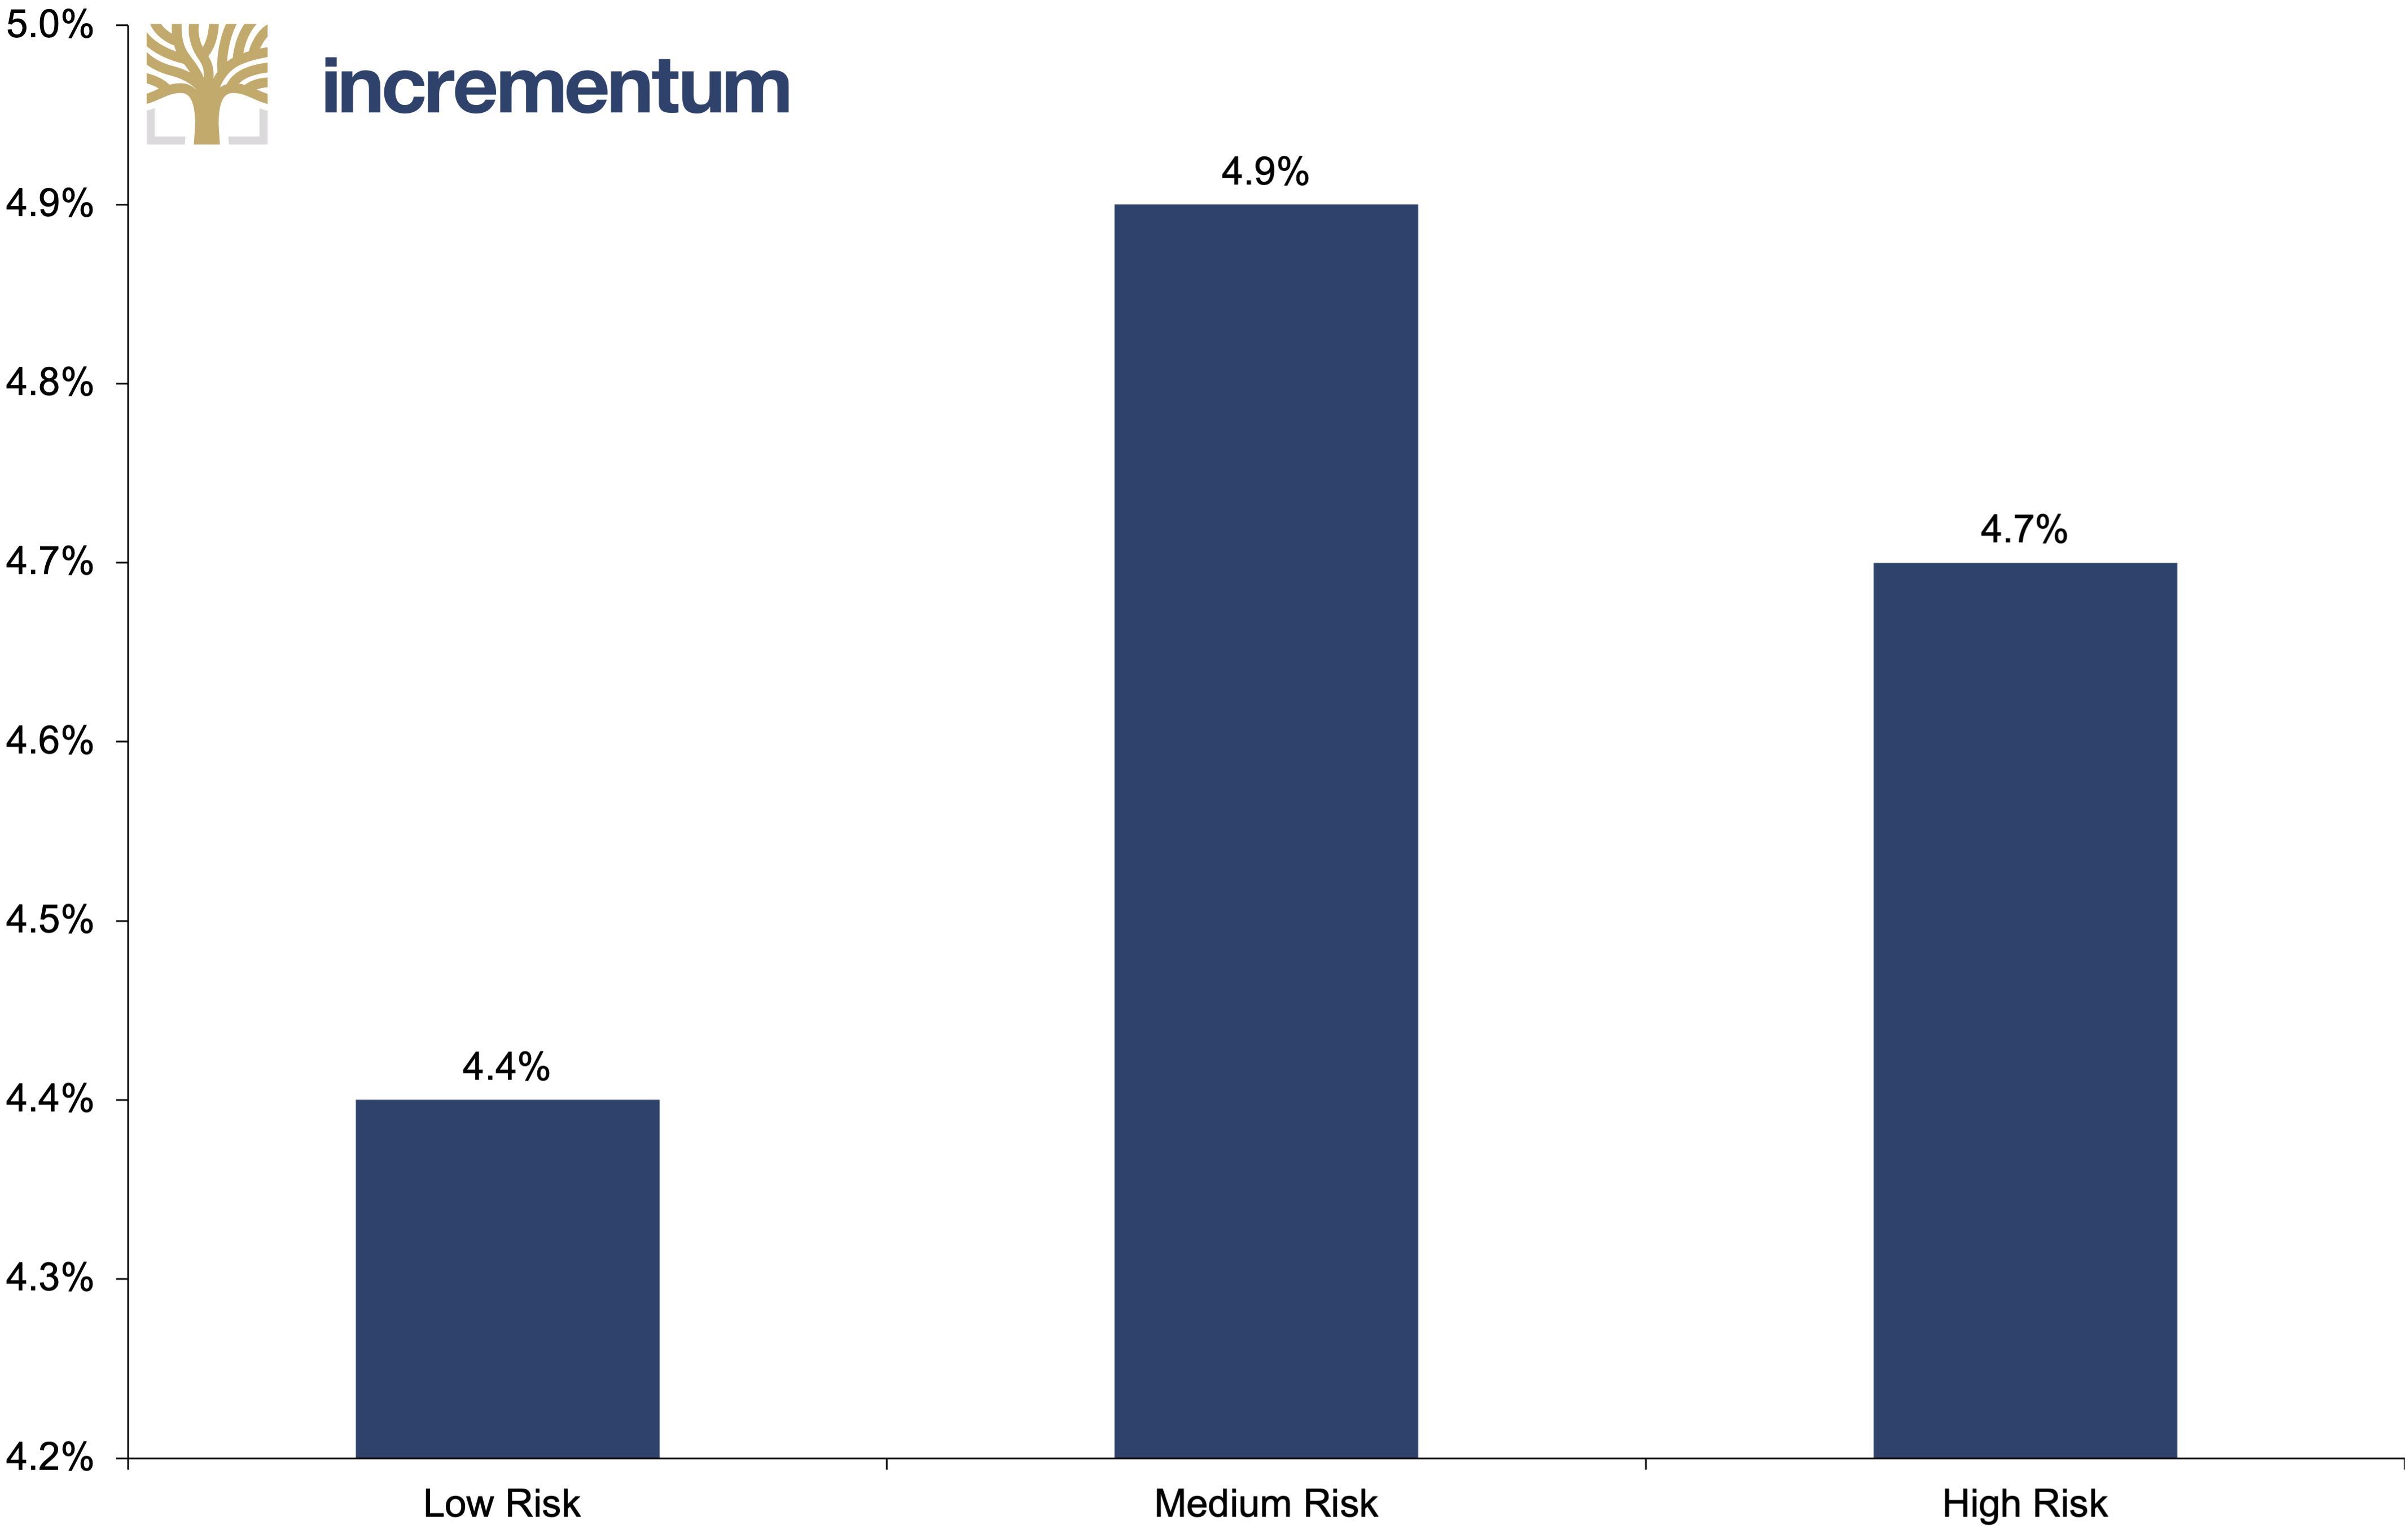
Ultimately, having considered silver’s supply-demand dynamics and its relative undervaluation to gold, we felt it necessary to outline one further point: the extent of its historical under-allocation. Namely, research from CPM Group suggests that the percentage of global wealth allocated to silver has averaged 0.03% over the last decade, compared to over 0.06% in 2011. And yet, a 2022 study by Oxford Economics calculated that the optimal silver weighting should be at 4.4–4.9%.
Optimal Silver Allocation
Source: Oxford Economics, Incrementum AG
In short, this means that, even at the peak of global wealth’s allocation to silver in 2011 of 0.06%, there would need to be a 73-fold increase in the percentage weighting of silver to ensure an optimal silver allocation for low-risk portfolios. And for the allocation over the past decade of 0.03%, the percentage of global wealth would need to increase by 163-fold. Of course, this is not to say that we expect ~5% of global wealth to suddenly flock towards silver. In fact, it must be accepted that silver may experience a complete “failure to launch” in an investment sense, especially if market participants continue to opt for gold’s market depth and tradition as a diversifier, whilst abstaining from silver due to its smaller market size and industrial attributes. Incidentally, this may have informed the 46% yoy fall in US silver coin and bar net demand in 2024.
Despite this, Bank of America states that “moving just 1% of global reserve assets into silver would be equivalent to 5 years’ worth of silver supply”. Moreover, if approximately 1% of the entire global population bought 10 oz of silver, the annual silver production would be totally consumed. As such, we remain bullish on silver as a supply-demand play first and foremost. Beyond that, silver’s ability to fulfil its remit as a high-beta play on gold will determine the true extent of its outperformance. Importantly, the gold price has already fulfilled its part in this historical precedent, rising magnanimously by 25% ytd. It is now high time for “performance gold” to enjoy its moment in the limelight. In theory, this will see the Big Long phenomenon extend itself to mining equities and commodities. Standing as the principal beneficiary when this transpires, silver is a fundamentally scarce, historically undervalued asset whose probability of outperforming gold in its own bull markets stands at 75%.
Performance of Gold and Silver during Bull Markets, 1967–04/2025
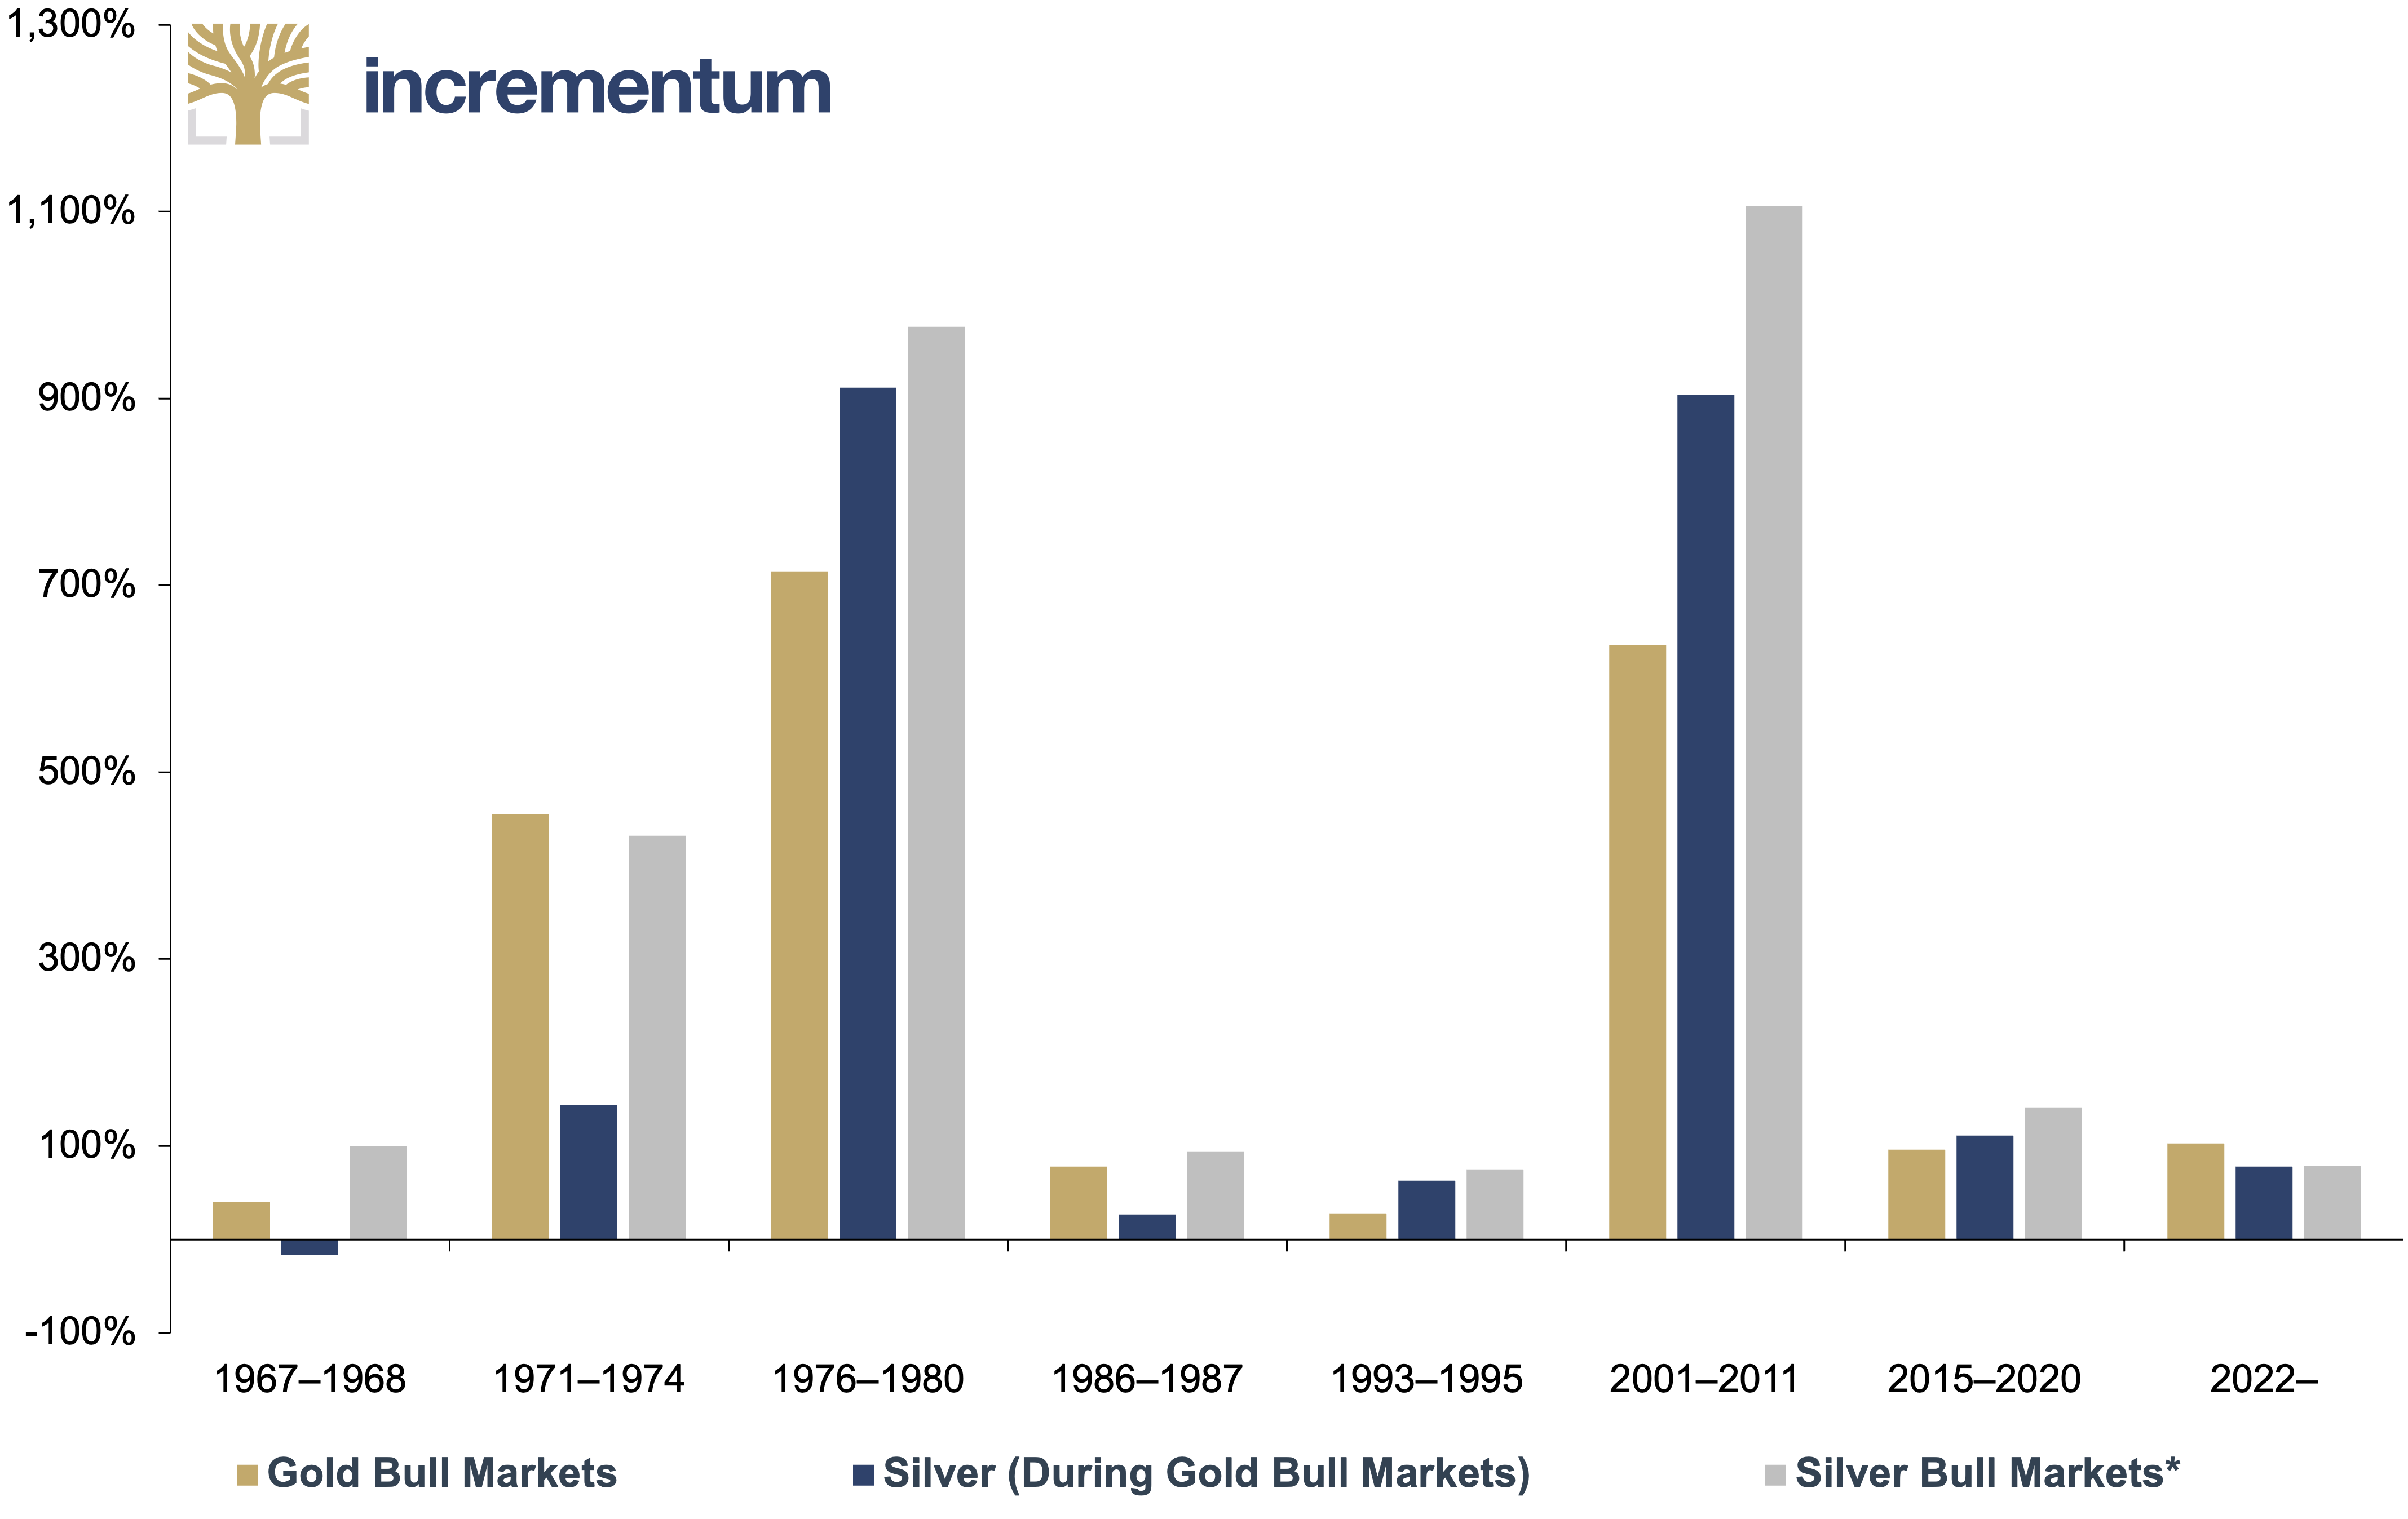
Source: CPM Group, LSEG, Incrementum AG
*Peak to trough during the gold bull markets
[1] See “Breakout or Fake-out: Is this Silver’s Golden Moment?,” In Gold We Trust report 2024
[2] See “Breakout or Fake-out: Is this Silver’s Golden Moment?,” In Gold We Trust report 2024
[3] Heraeus: Precious Appraisal, No. 10, March 10, 2025
[4] Heraeus: Precious Appraisal, No. 10, March 10, 2025
[5] See “Breakout or Fake-out: Is this Silver’s Golden Moment?,” In Gold We Trust report 2024
[6] See “The Showdown in Monetary Policy,” In Gold We Trust report 2023