Quo vadis, aurum?
I could see in the next few years that we are going to have to have some kind of a grand global economic reordering—something equivalent to a new Bretton Woods. Or, if you want to look further back, something akin to the steel agreements or even the Treaty of Versailles. There’s a very good chance we’ll need this within the next four years, and I’d like to be a part of it.
Scott Bessent
Gold is establishing itself as a neutral, liquid, and counterparty-free anchor of confidence and thus as a possible cornerstone for “Bretton Woods III”.
The New Gold Playbook we presented in the In Gold We Trust report 2024 remains intact: Central bank demand and continued high demand from emerging markets – especially China – form the backbone of gold demand. ETF demand in the West is also slowly picking up.
Gold has proven to be a reliable hedge in past recessions and bear markets and diversifies the portfolio in adverse scenarios such as high inflation, stagflation, and increased counterparty risk.
Silver, mining stocks, and commodities offer attractive catch-up potential: Historically, these high-beta assets have lagged the gold price. Performance gold remains undervalued and could outperform significantly in the second half of the decade.
Short-term correction of the gold price to ~USD 2,800 is possible, triggered by profit-taking, very bullish sentiment, a short-term bounce of the US dollar, and a potential, if temporary, geopolitical easing. However, the long-term Big Long case remains intact.
Historical comparisons as well as our proprietary Incrementum Gold Price Model indicate that the gold bull market still has considerable room to run. Our base scenario for the end of the decade remains at USD 4,800. In the event of strong inflation, gold could rise to USD 8,900.
Gold: The GOAT of the Portfolio
“Talent wins games, but teamwork and intelligence win championships.” Michael Jordan’s words became the DNA of the Chicago Bulls in the 1990s. Instead of hasty changes after painful setbacks – the Bulls failed six times in the play-offs and were sometimes humiliated by the “bad boys” of the Detroit Pistons – the management relied on strategic patience, uncompromising team spirit under the leadership of Phil Jackson, and a clear vision. As a result, the Bulls became the best team of an entire NBA generation with six championship titles in just eight years, a Finals win rate of 87.5%, and the iconic record-breaking 1995/96 season with 72 wins and only 10 losses in the regular season. This era impressively demonstrated how individual talent can translate into sustained collective dominance.
Excellence requires courage – especially the courage to take positions that are considered unorthodox or counter-cyclical. This includes daring to invest in gold and sticking with it when gold is unpopular. Or investing in performance gold, such as silver, mining companies, or commodities, when they are labeled as structural underperformers by the market. This is particularly true in the West, where professional investors have consistently displayed a deep-seated aversion to gold for decades.
Whether you are ridiculed as a nonconformist or not, in the long term, it may prove riskier to avoid gold than to bet on it. Those who hold safe-haven gold are well positioned for the fundamental market changes that we have described in detail in our In Gold We Trust reports in recent years and again this year. In our opinion, more risk-averse investors still have the opportunity to profit disproportionately with performance gold.
At the end of this decade, gold will perhaps no longer be seen as a relic of times gone by, but as what it can be: the Michael Jordan of assets, defensively stable and offensively powerful – a real difference-maker. Anyone who has this GOAT, the greatest of all time, in their portfolio is ready for the play-offs on the financial markets.
What does this long-term approach mean in concrete terms? What guidelines must a long-term investor follow in their daily decisions in order to understand the big picture? The Big Long for gold is based on several fundamental political, economic, and social changes.
The Big Realignment: Gold as a Beneficiary of the Geopolitical Realignment
There are currently many indications that the geopolitical realignment is accelerating. Zoltan Pozsar had already taken the debate about a new global monetary order to a new level in 2022 with his article “Bretton Woods III” against the backdrop of the Ukraine war that had just broken out and the sanctioning of Russian currency reserves that was decided shortly afterwards. He concluded his remarks with the following forecast: “From the Bretton Woods era backed by gold bullion, to Bretton Woods II backed by inside money (Treasuries with unhedgeable confiscation risks), to Bretton Woods III backed by outside money (gold bullion and other commodities).” [1] Nobody knows exactly where this journey will take us at the moment. There is no question that we are irrevocably on the path to a new global (monetary) order. Gold is increasingly becoming a monetary life insurance policy for state actors such as central banks and sovereign wealth funds.
A new global monetary order will need an internationally recognized anchor of trust. Gold seems to be predestined for several reasons:
- Gold is neutral
Gold belongs to no state, no political party, no autocrat, no parliament; gold can therefore be the unifying element in a multipolar world that has become much more fragile.
- Gold has no counterparty risk
Financial assets have counterparty risk. Gold, on the other hand, has no counterparty risk. It is pure property.
- Gold is liquid
Gold is one of the most liquid assets in the world. The average daily turnover of gold amounted to more than USD 229bn in 2024. In a study, the LBMA showed that gold sometimes has greater liquidity than government bonds.
The renaissance of gold is manifested in the gradual liberalization of gold valuation by some emerging markets, led by China. This could lead to a revaluation of the gold price in the long term, particularly if central banks were to back their currencies with gold again (implicitly or even explicitly). Until recently, such scenarios were considered marginal. This has changed. They are now increasingly being discussed in the economic policy mainstream.
According to the World Gold Council (WGC), global gold reserves amounted to 36,252 t in February 2025. This means that the heel turn we are forecasting is underway: In 2024, gold’s share of currency reserves reached 22%, its highest level since 1997. This is more than double the low of around 9% in 2016. However, there is still a long way to go before reaching the historic peak of over 70% in 1980. This momentum is likely to continue during the Big Long.
US Debt Held by Foreign Central Banks (lhs), as % of Total Debt, and Central Bank Gold Holdings (rhs), as % of Currency Reserves, Q1/1970–Q3/2024
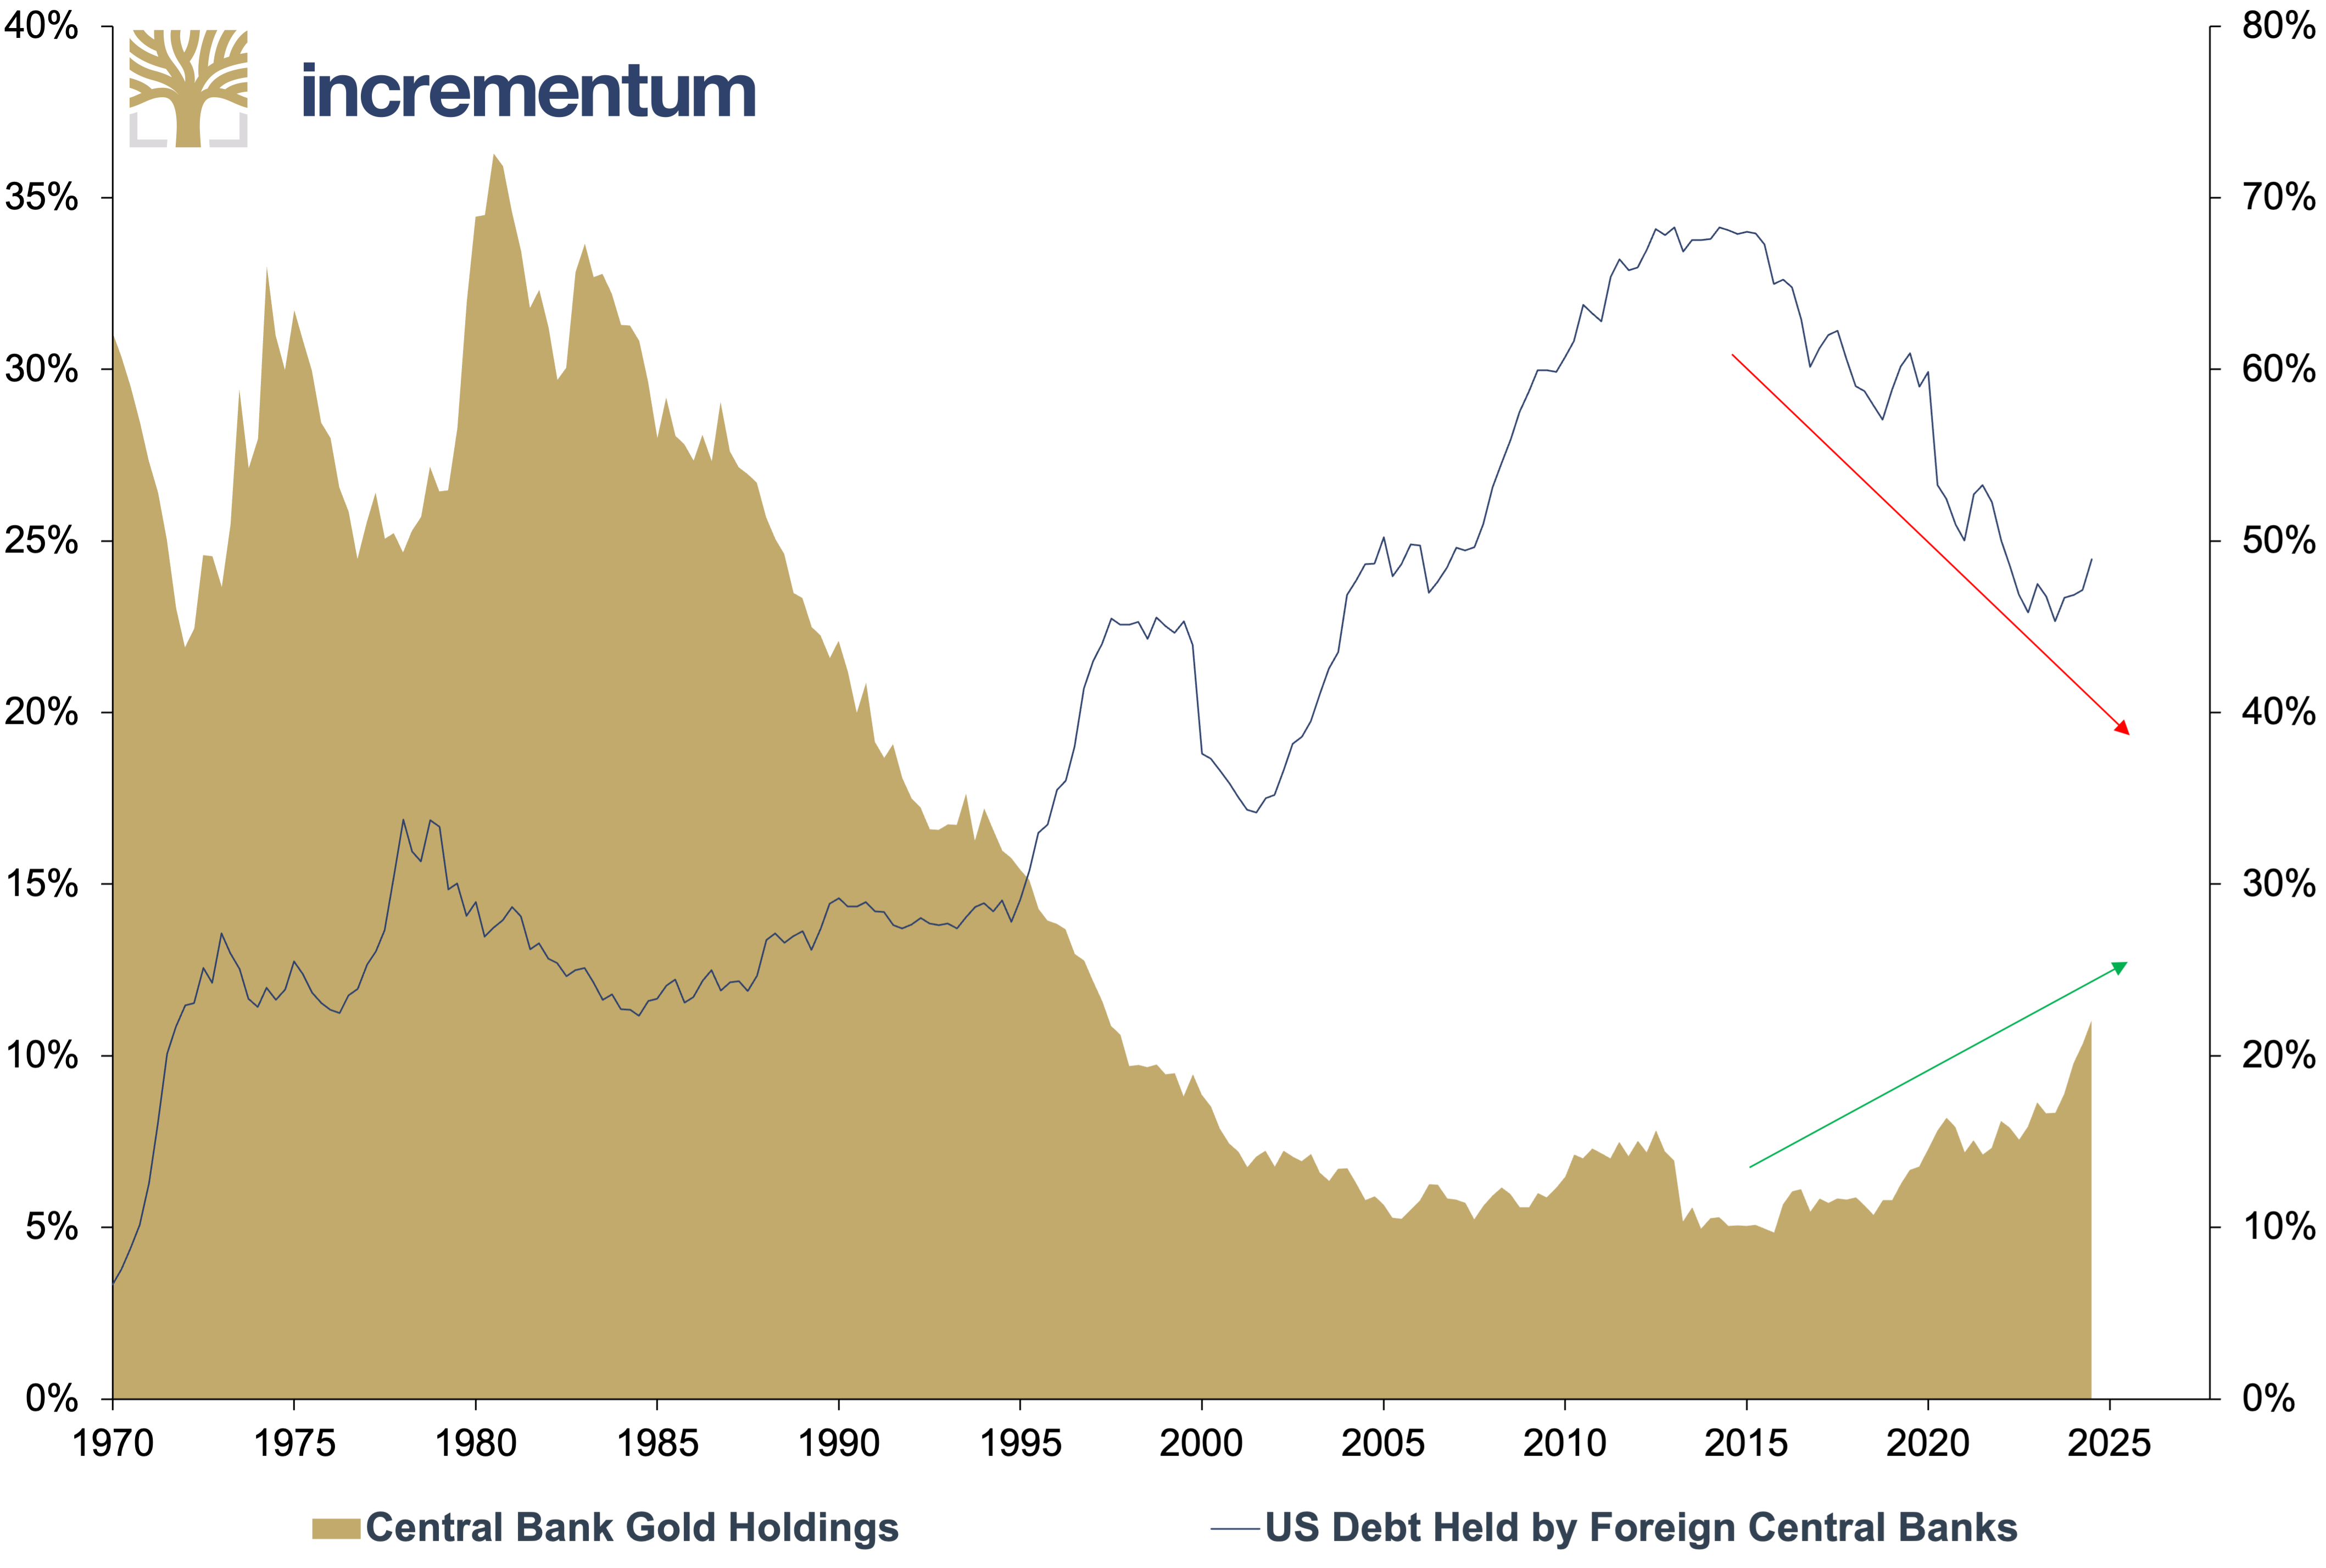
Source: Crescat Capital, Federal Reserve St. Louis, World Gold Council, Incrementum AG
Despite significant purchases, central banks in the emerging markets continue to hold significantly less gold than their counterparts in the industrialized countries. We assume that this gap will gradually narrow. Central bank demand from emerging markets, which are becoming increasingly politically confident, is expected to continue forming the backbone of gold demand in the coming years.
The continued low share of gold in China’s currency reserves is striking. Despite considerable purchases in recent years, the official share is only 6.5%. By comparison, gold accounts for over 70% of reserves in the US, Germany, France and Italy. Russia, on the other hand, increased its share from 8% to 34% between 2014 and Q1/2025. The trend toward the repatriation of gold reserves, which has been observed for years, is also likely to continue as an expression of growing mistrust among countries.[2]
In the study “Gold: Raising Our End-2025 Forecast to $3,300; Top 10 Questions” (which is well worth reading), Goldman Sachs assumes that China will continue to buy an average of around 40 t of gold per month. This means that China’s central bank demand alone would amount to almost 500 t per year. This corresponds to almost half of the total central bank demand of the past three years.
Estimated Timeline for China to Reach Various Gold Reserve Allocation Targets*

Source: Goldman Sachs Global Investment Research, Incrementum AG
*The analysis assumes China to continue buying ~40 tonnes of gold per month. Rising prices further increase the value of existing holdings and help reach allocation targets faster.
But can the official figures be trusted? After all, China has been the largest importer, consumer, and producer of gold for years. According to Jan Nieuwenhuijs, the PBoC has bought around five times the reported quantity. Based on various indicators, such as deviations in the Chinese market balance, Nieuwenhuijs estimates that the PBoC now holds around 5,000 t of gold. This would put China in second place behind the US, but ahead of Germany, among the countries with the largest gold reserves. Therefore, China would have a golden ace that it could play in the form of a Big Surprise.
The Big Economic Cooling: Gold as a Beneficiary of an Economic Downturn?
In our view, gold is not intended to replace traditional securities such as equities or bonds, but to complement them. It is correct to view a gold position in a portfolio as a liquid, alternative cash position that carries exchange rate risk to fiat money. A direct comparison between gold and equities reminds us of the proverbial apples and oranges comparison. Our analyses show: In market crises, gold acts like the tried and tested Italian catenaccio with the reliability of a Giorgio Chiellini in defense and the security of a Gianluigi Buffon in goal. While other investments fluctuate, gold stabilizes the portfolio with predictable resilience.[3]
A further slide on the stock markets could be expected in the event of a significant slowdown in the US economy, and even more so if the US slips sharply into recession. A marked slowdown in the global economy now seems likely, given the erratic nature of the US’s trade conflict. After all, uncertainty weighs heavily on economic drivers, entrepreneurs, and businesses alike. In its April forecast, the IMF has revised its growth prospects significantly downwards.
In the past 16 years, the world has only been plunged into recession once – during the Covid-19 pandemic. And this was an atypical recession triggered by an external shock. Most investors are currently underestimating the real likelihood of another recession and its potential impact on corporate earnings and stock market valuations. While economists put the probability of a recession in the US at the end of April at around 50% and Polymarket bets had it at 64%, we believe that the current valuations on the US equity markets reflect a lower risk. The current P/E ratio of the S&P 500, at 27.7, remains well above the decade-long average of 16.1, despite the recent price declines.
Historically, gold has proven to be an excellent portfolio insurance during recessions and bear markets in US equities. We have analyzed this extensively in the In Gold We Trust report 2023 in the chapter “The Showdown in Monetary Policy”.
Performance of the S&P 500 vs. Gold in S&P 500 Bear Markets, 1929–2025
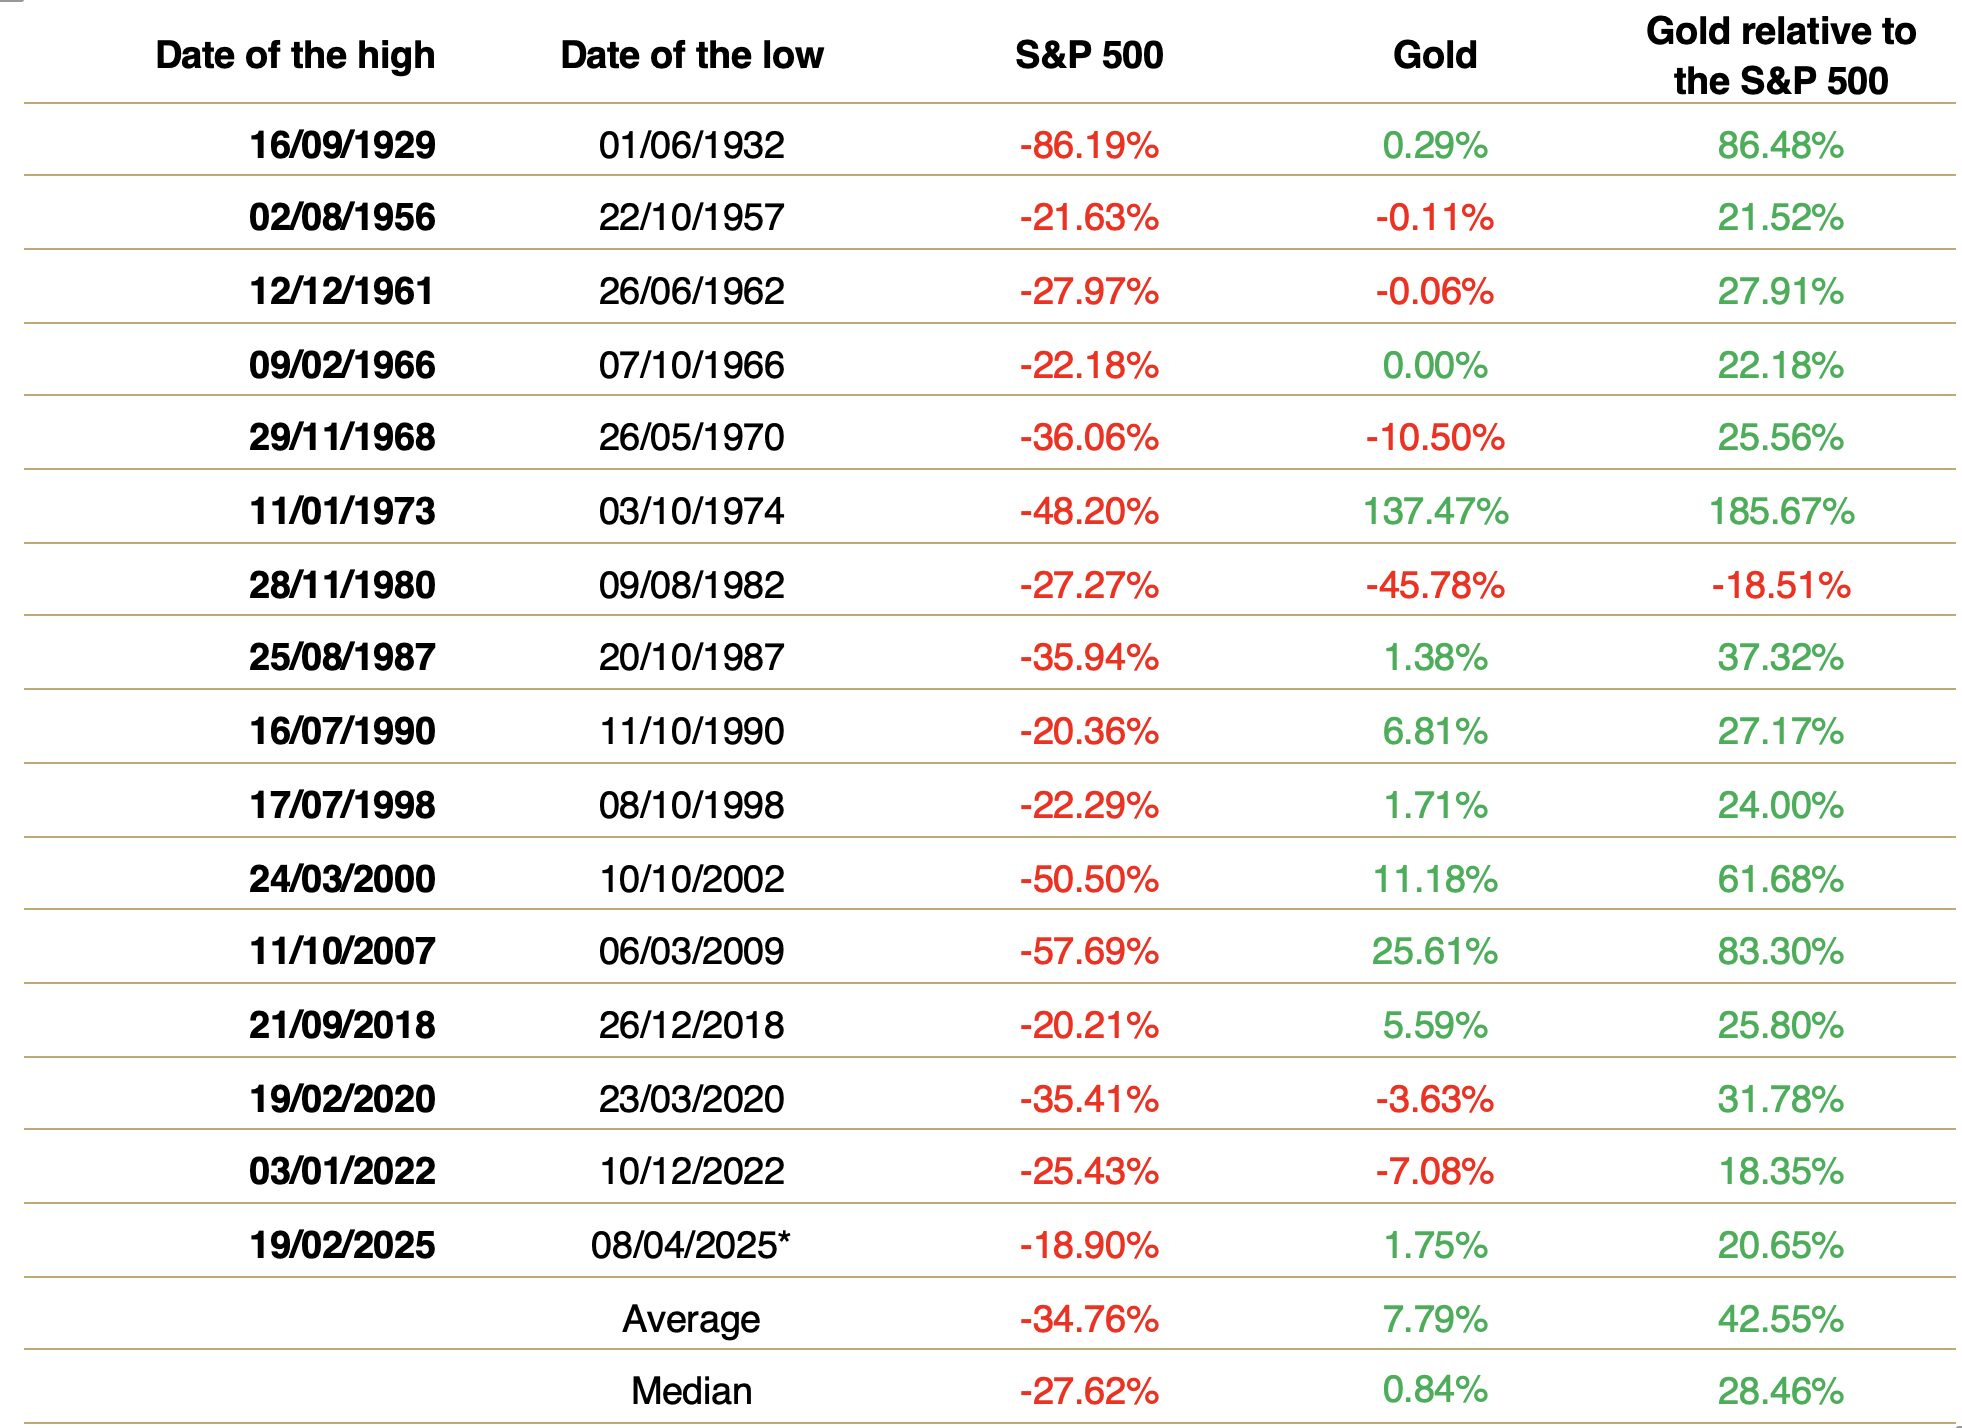
Source: Cornerstone Macro, Bloomberg, LSEG (*Lowest closing price since 02/19/2025), Incrementum AG)
The Big Wave: Is the Next Inflation Wave Building Up?
Furthermore, we should not rule out the possibility of a second wave of inflation, as in the 1970s. If we take the course of inflation in the 1970s as a guide to its future course, we see that the parallelism of developments is striking.
US CPI, yoy, 01/1966–12/1983 (lhs), and 08/2013–07/2031 (rhs)
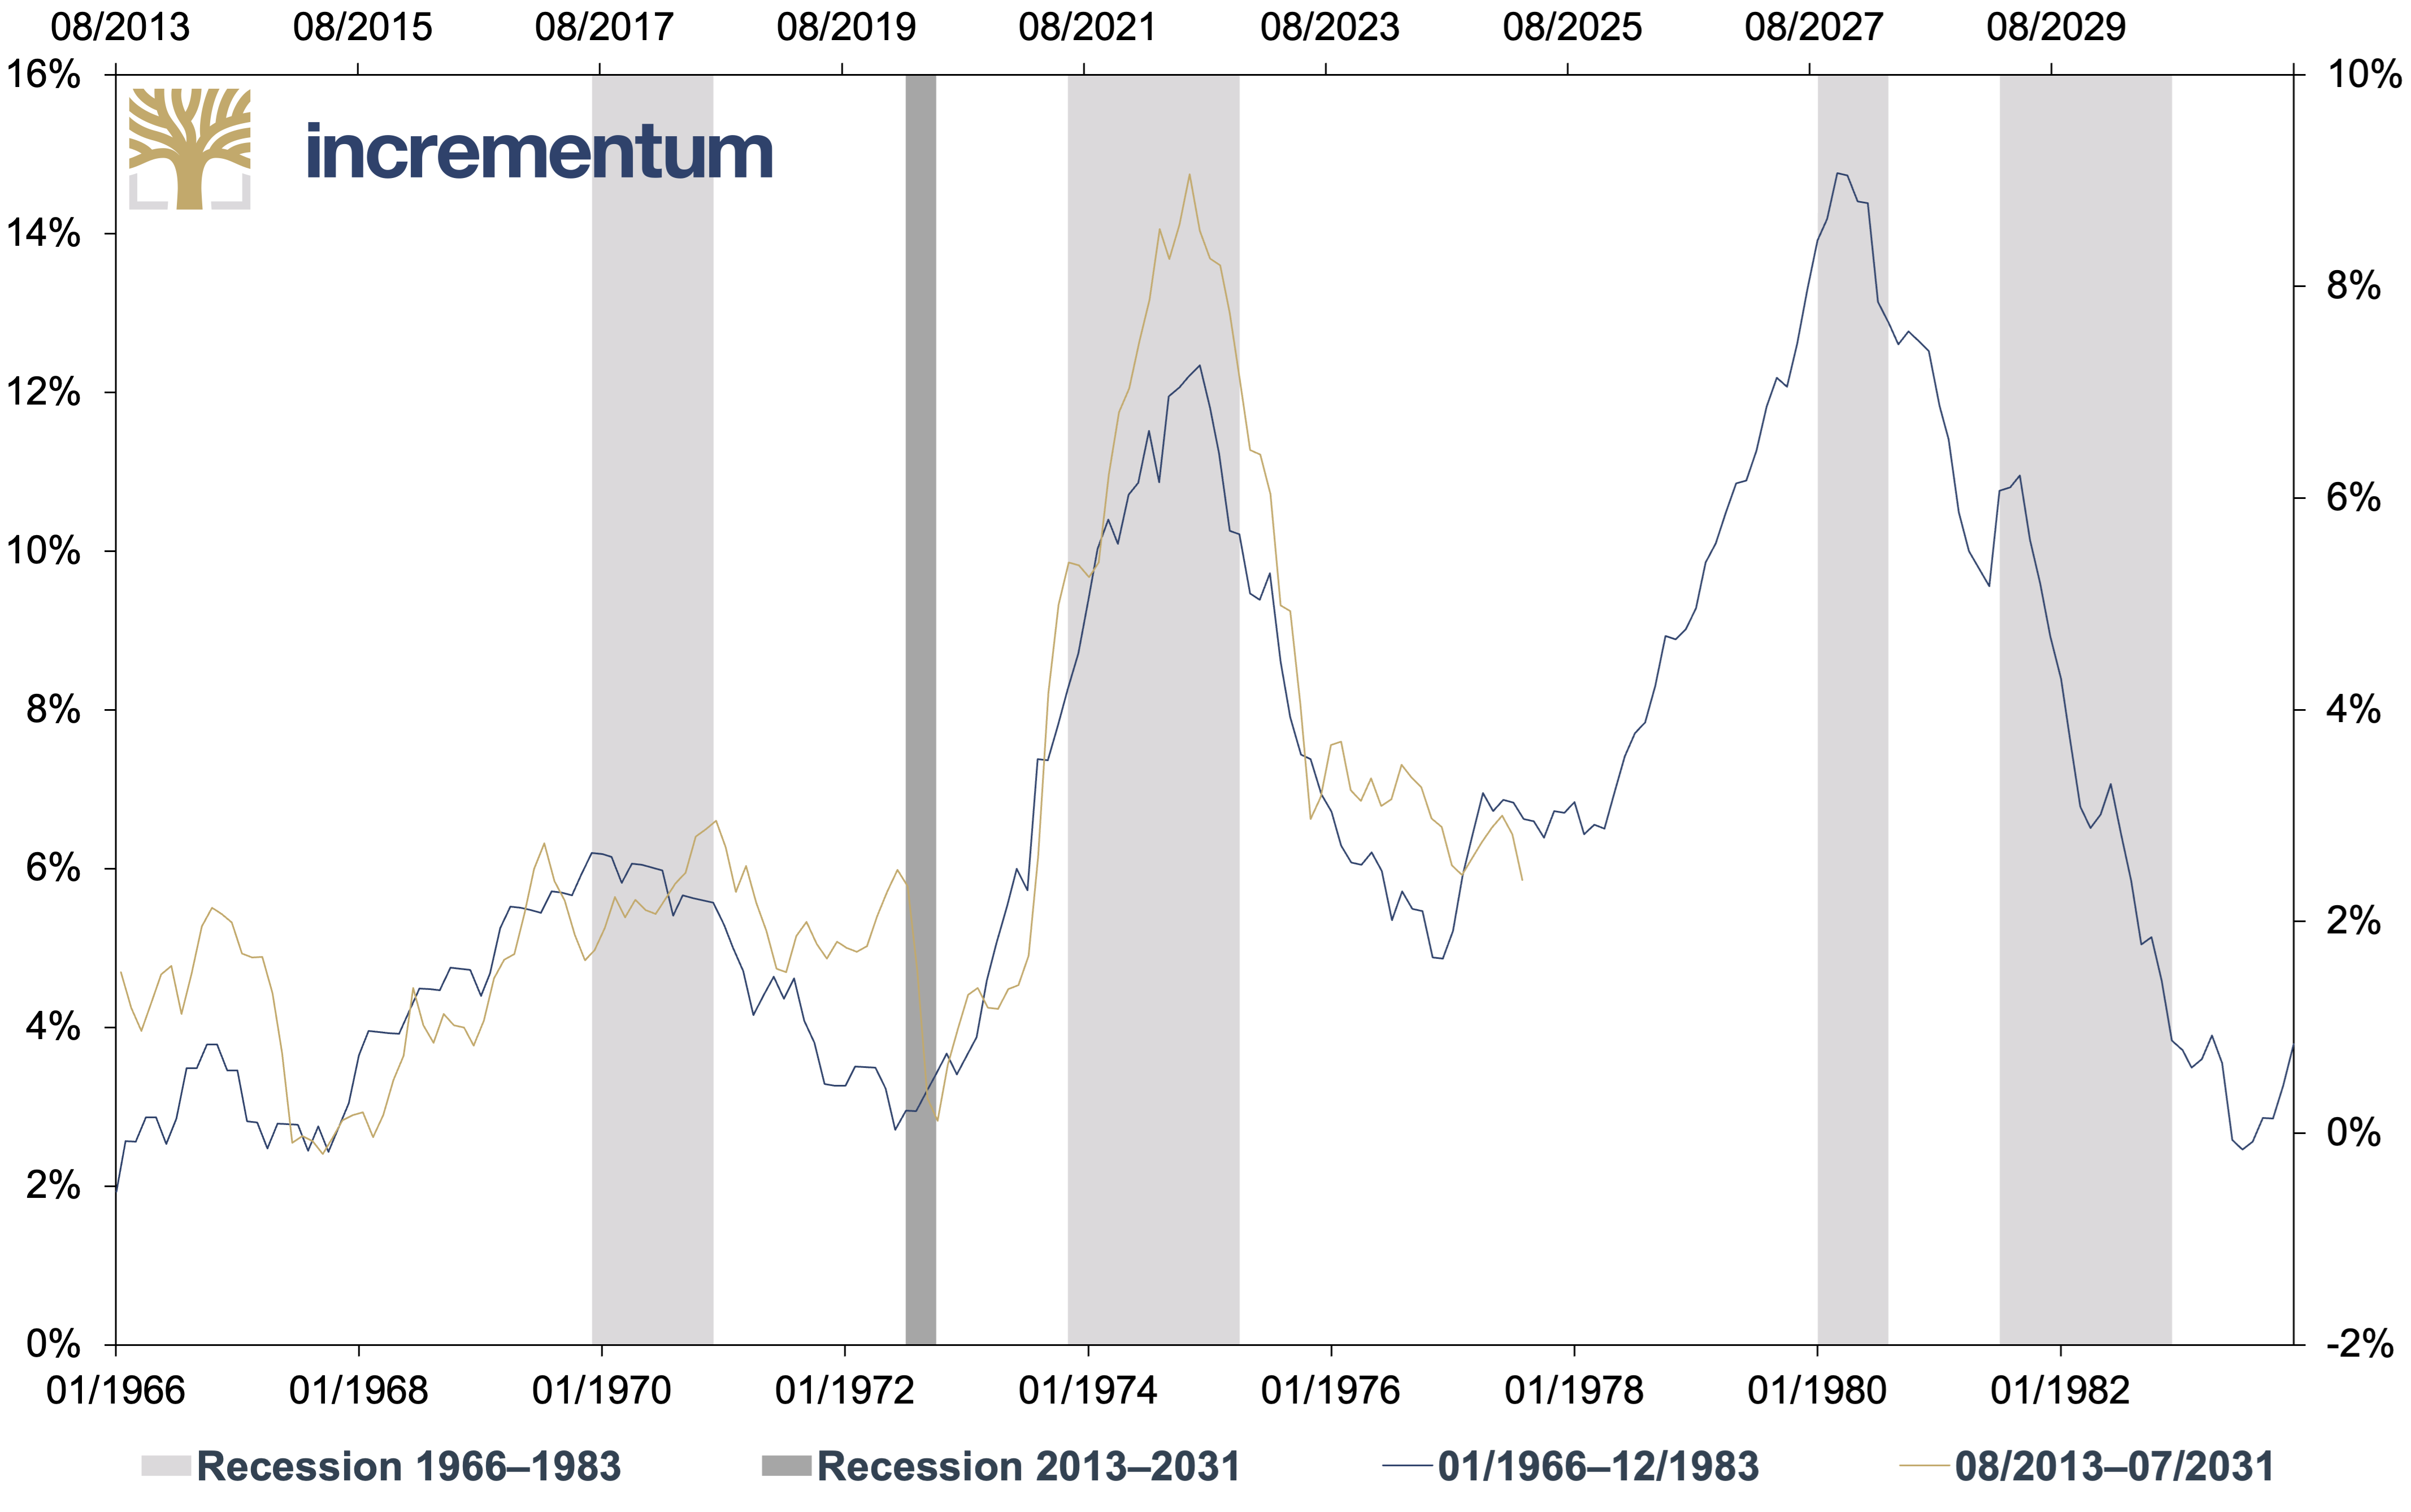
Source: Andreas Steno, LSEG, Incrementum AG
In the coming months, however, we anticipate a predominantly disinflationary trend, particularly due to the sharp decline in oil prices. The significant appreciation of the currencies of leading industrialized countries against the US dollar is reinforcing the disinflationary effect in these countries.
This does not mean that the risk of inflation has been averted. On the contrary: Although recessions and slumps on the capital markets have a disinflationary, sometimes even deflationary effect, the response will be highly inflationary. A brisk counter-reaction by the Federal Reserve seems only a matter of time. What other rabbits could central bankers and politicians pull out of the hat?
Possible measures range from yield curve control, renewed QE or QQE, financial repression, and further fiscal stimuli through to MMT or helicopter money. The use of one or more of these instruments is a foregone conclusion, and the further merging of monetary and fiscal policy will continue unabated. One thing is certain: The next bailouts will assume increasingly larger, more aggressive, and more opaque characteristics. The longer and closer this dangerous love affair between monetary and fiscal policy continues, the greater the stagflationary forces. Our quantitative analysis shows that gold, silver, and mining stocks have performed extremely well in a stagflationary environment.[4]
Real CAGR of Gold, Silver, and BGMI During Proprietary Calculated Stagflation Periods and 70s, 01/1971–04/2025
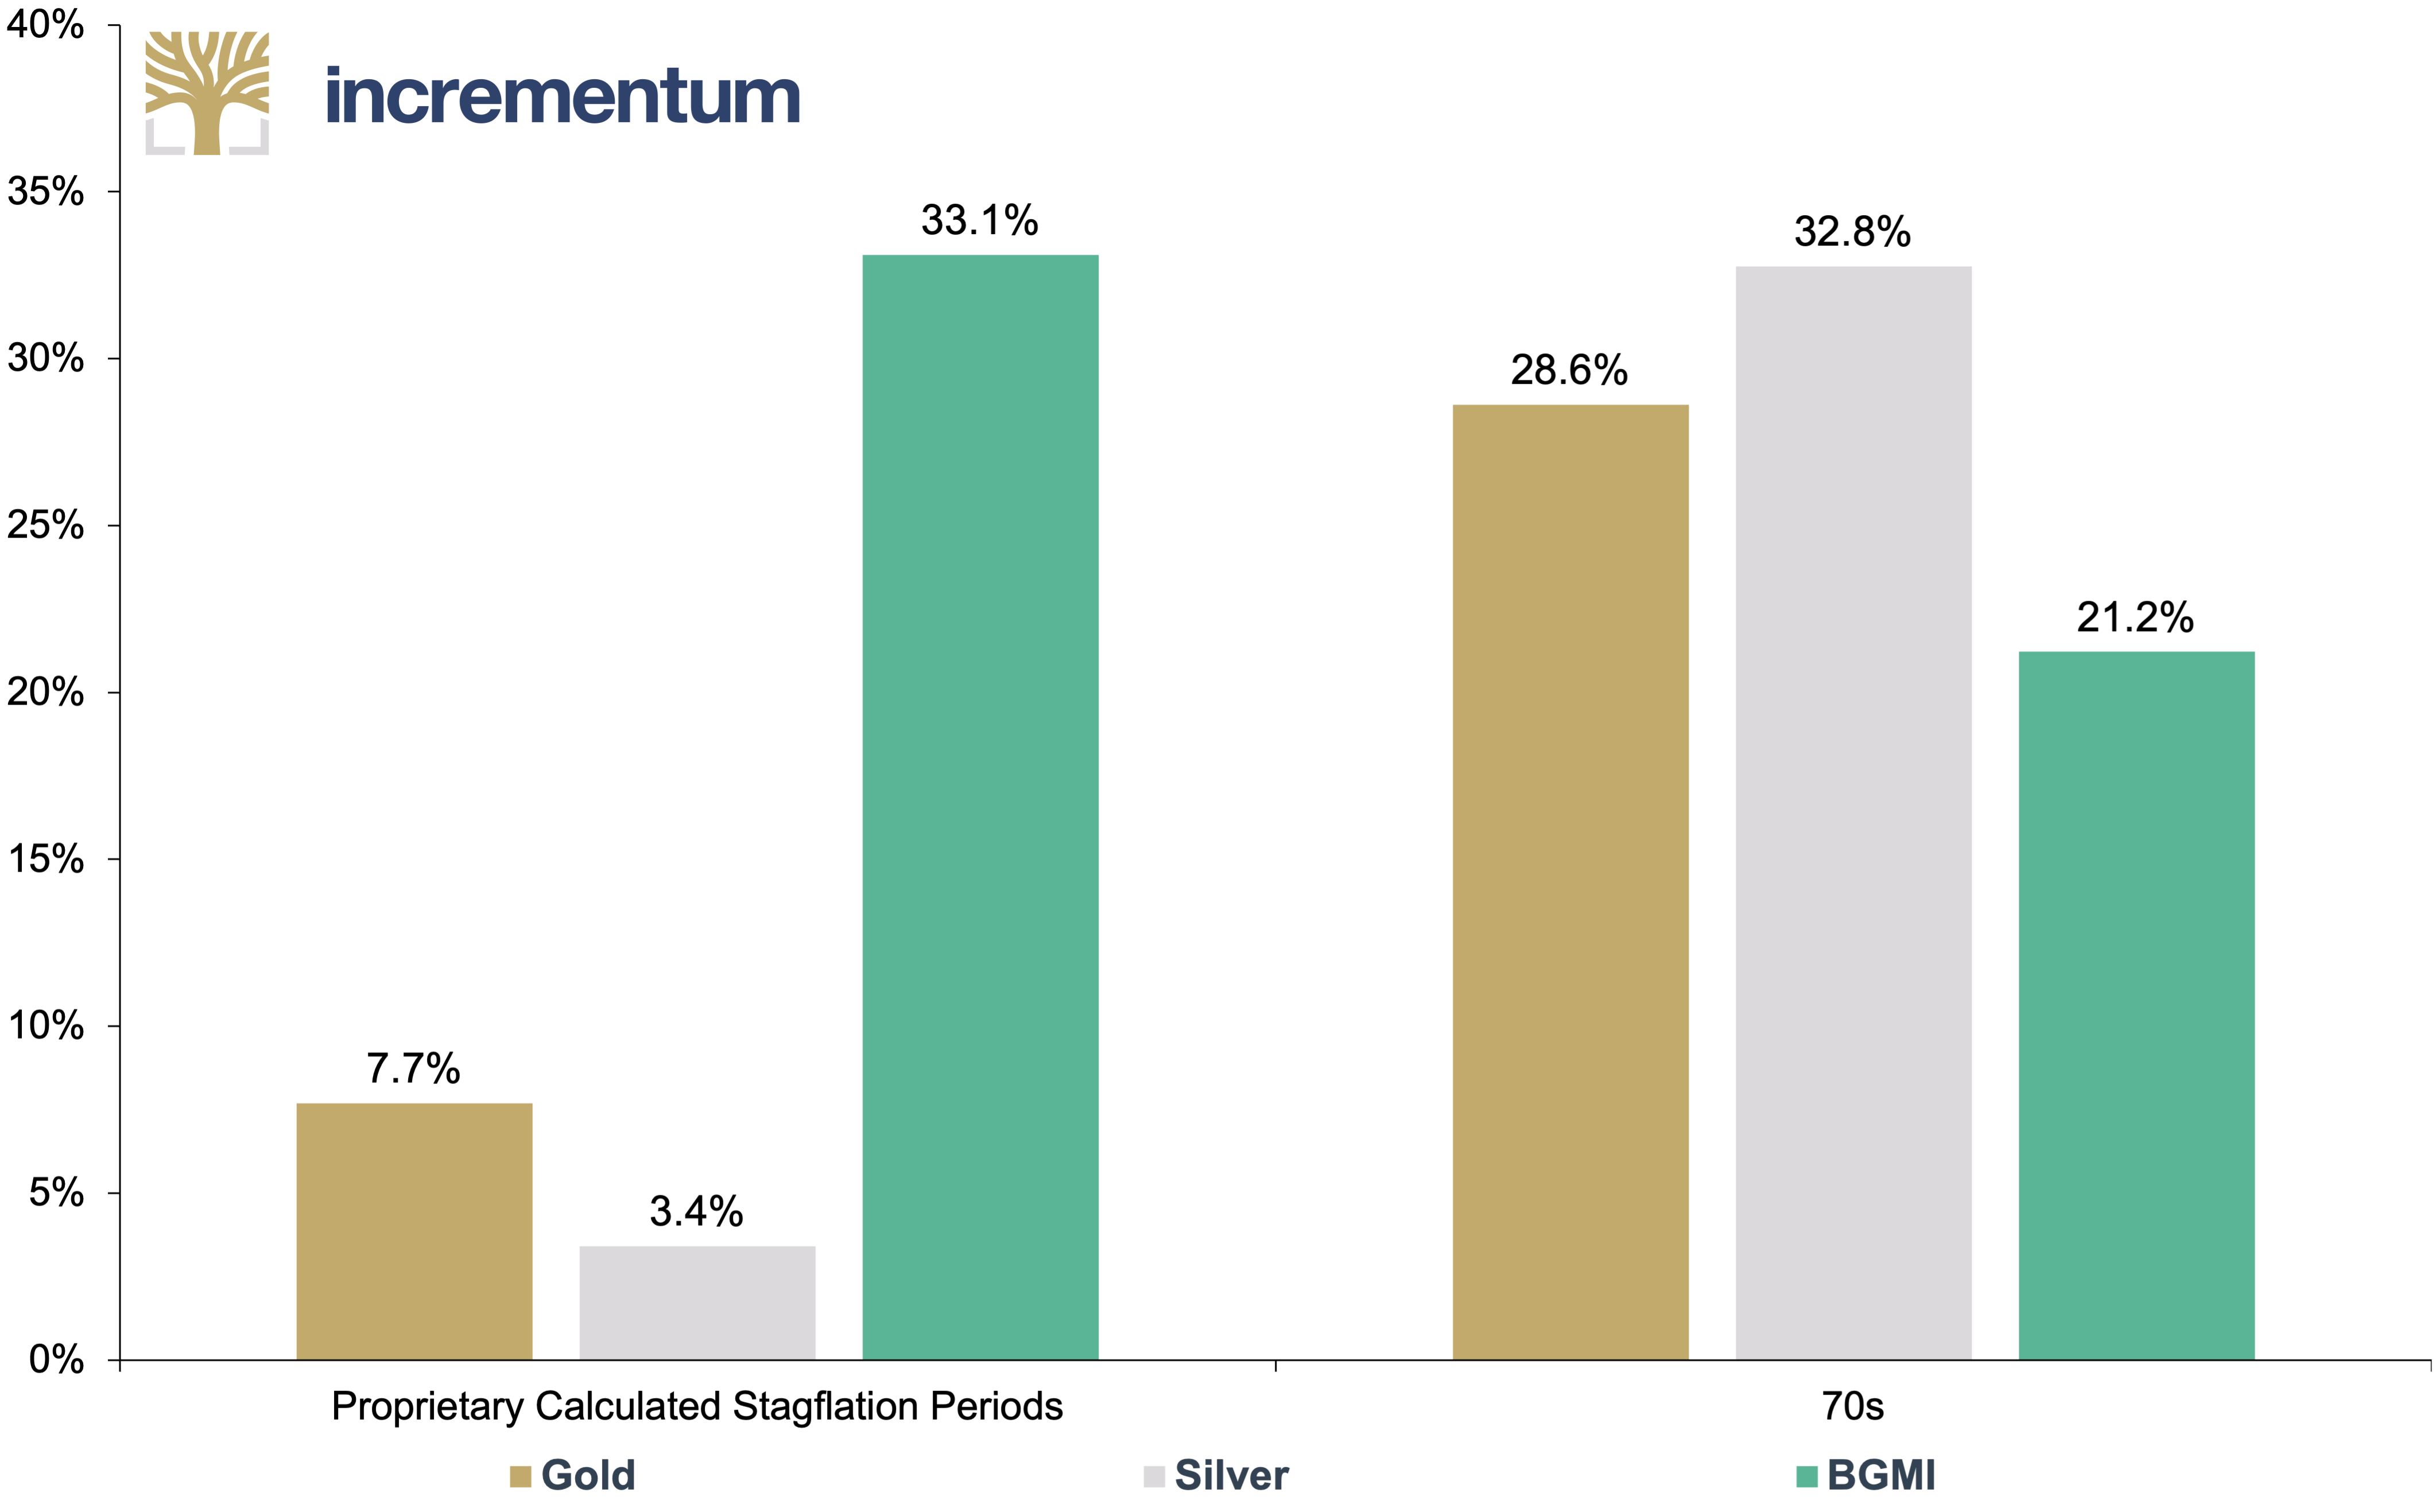
Source: LSEG, goldchartsrus.com, Incrementum AG
And what was long regarded as an academic thought experiment has suddenly become more tangible in recent weeks: the possibility of an inflationary wave due to capital flight from the US dollar. Should confidence in the US currency erode further, a scenario could unfold in which investors flee the US dollar for tangible assets and alternative reserve assets. Such a move would drive US import prices up at an accelerated pace, fuel inflation expectations, and combine classic demand inflation with elements of a currency crisis.
In this scenario, the US dollar could lose its role as a safe haven and thus act as a fire accelerant. As a result, the inflation risk would no longer be primarily driven by supply shocks or wage spirals, but rather by eroding confidence in the US currency itself.
The Big Print: Gold as a Beneficiary of the Ongoing Devaluation of Fiat Money
Loyal readers know: We constantly endeavor to place the monetary function of gold at the forefront of our analyses. Money is subject to the same basic economic principles as all goods: Its value is determined by supply and demand. Confidence in the current and future purchasing power of money depends largely on expectations regarding the development of the future money supply.
The mechanism is clear: If the money supply increases more than the available supply of goods and services, the purchasing power of money will fall sooner or later. This fundamental law of economics explains why gold acts as a natural counterweight to unbacked currencies: The supply of gold cannot be expanded arbitrarily.
The next chart illustrates the development impressively: While the US population has grown by a factor of 4.5, from 76 to 342mn since 1900, M2 money supply has exploded by a factor of 2,333, from USD 9bn to USD 21trn. Per capita, this means an increase of more than 500 times, from USD 118 to over USD 60,000. The money supply has thus swollen like the muscles of a bodybuilder on steroids – impressive on the outside, yet structurally fragile.
US M2 Money Supply per Capita, in USD, 1900–2024
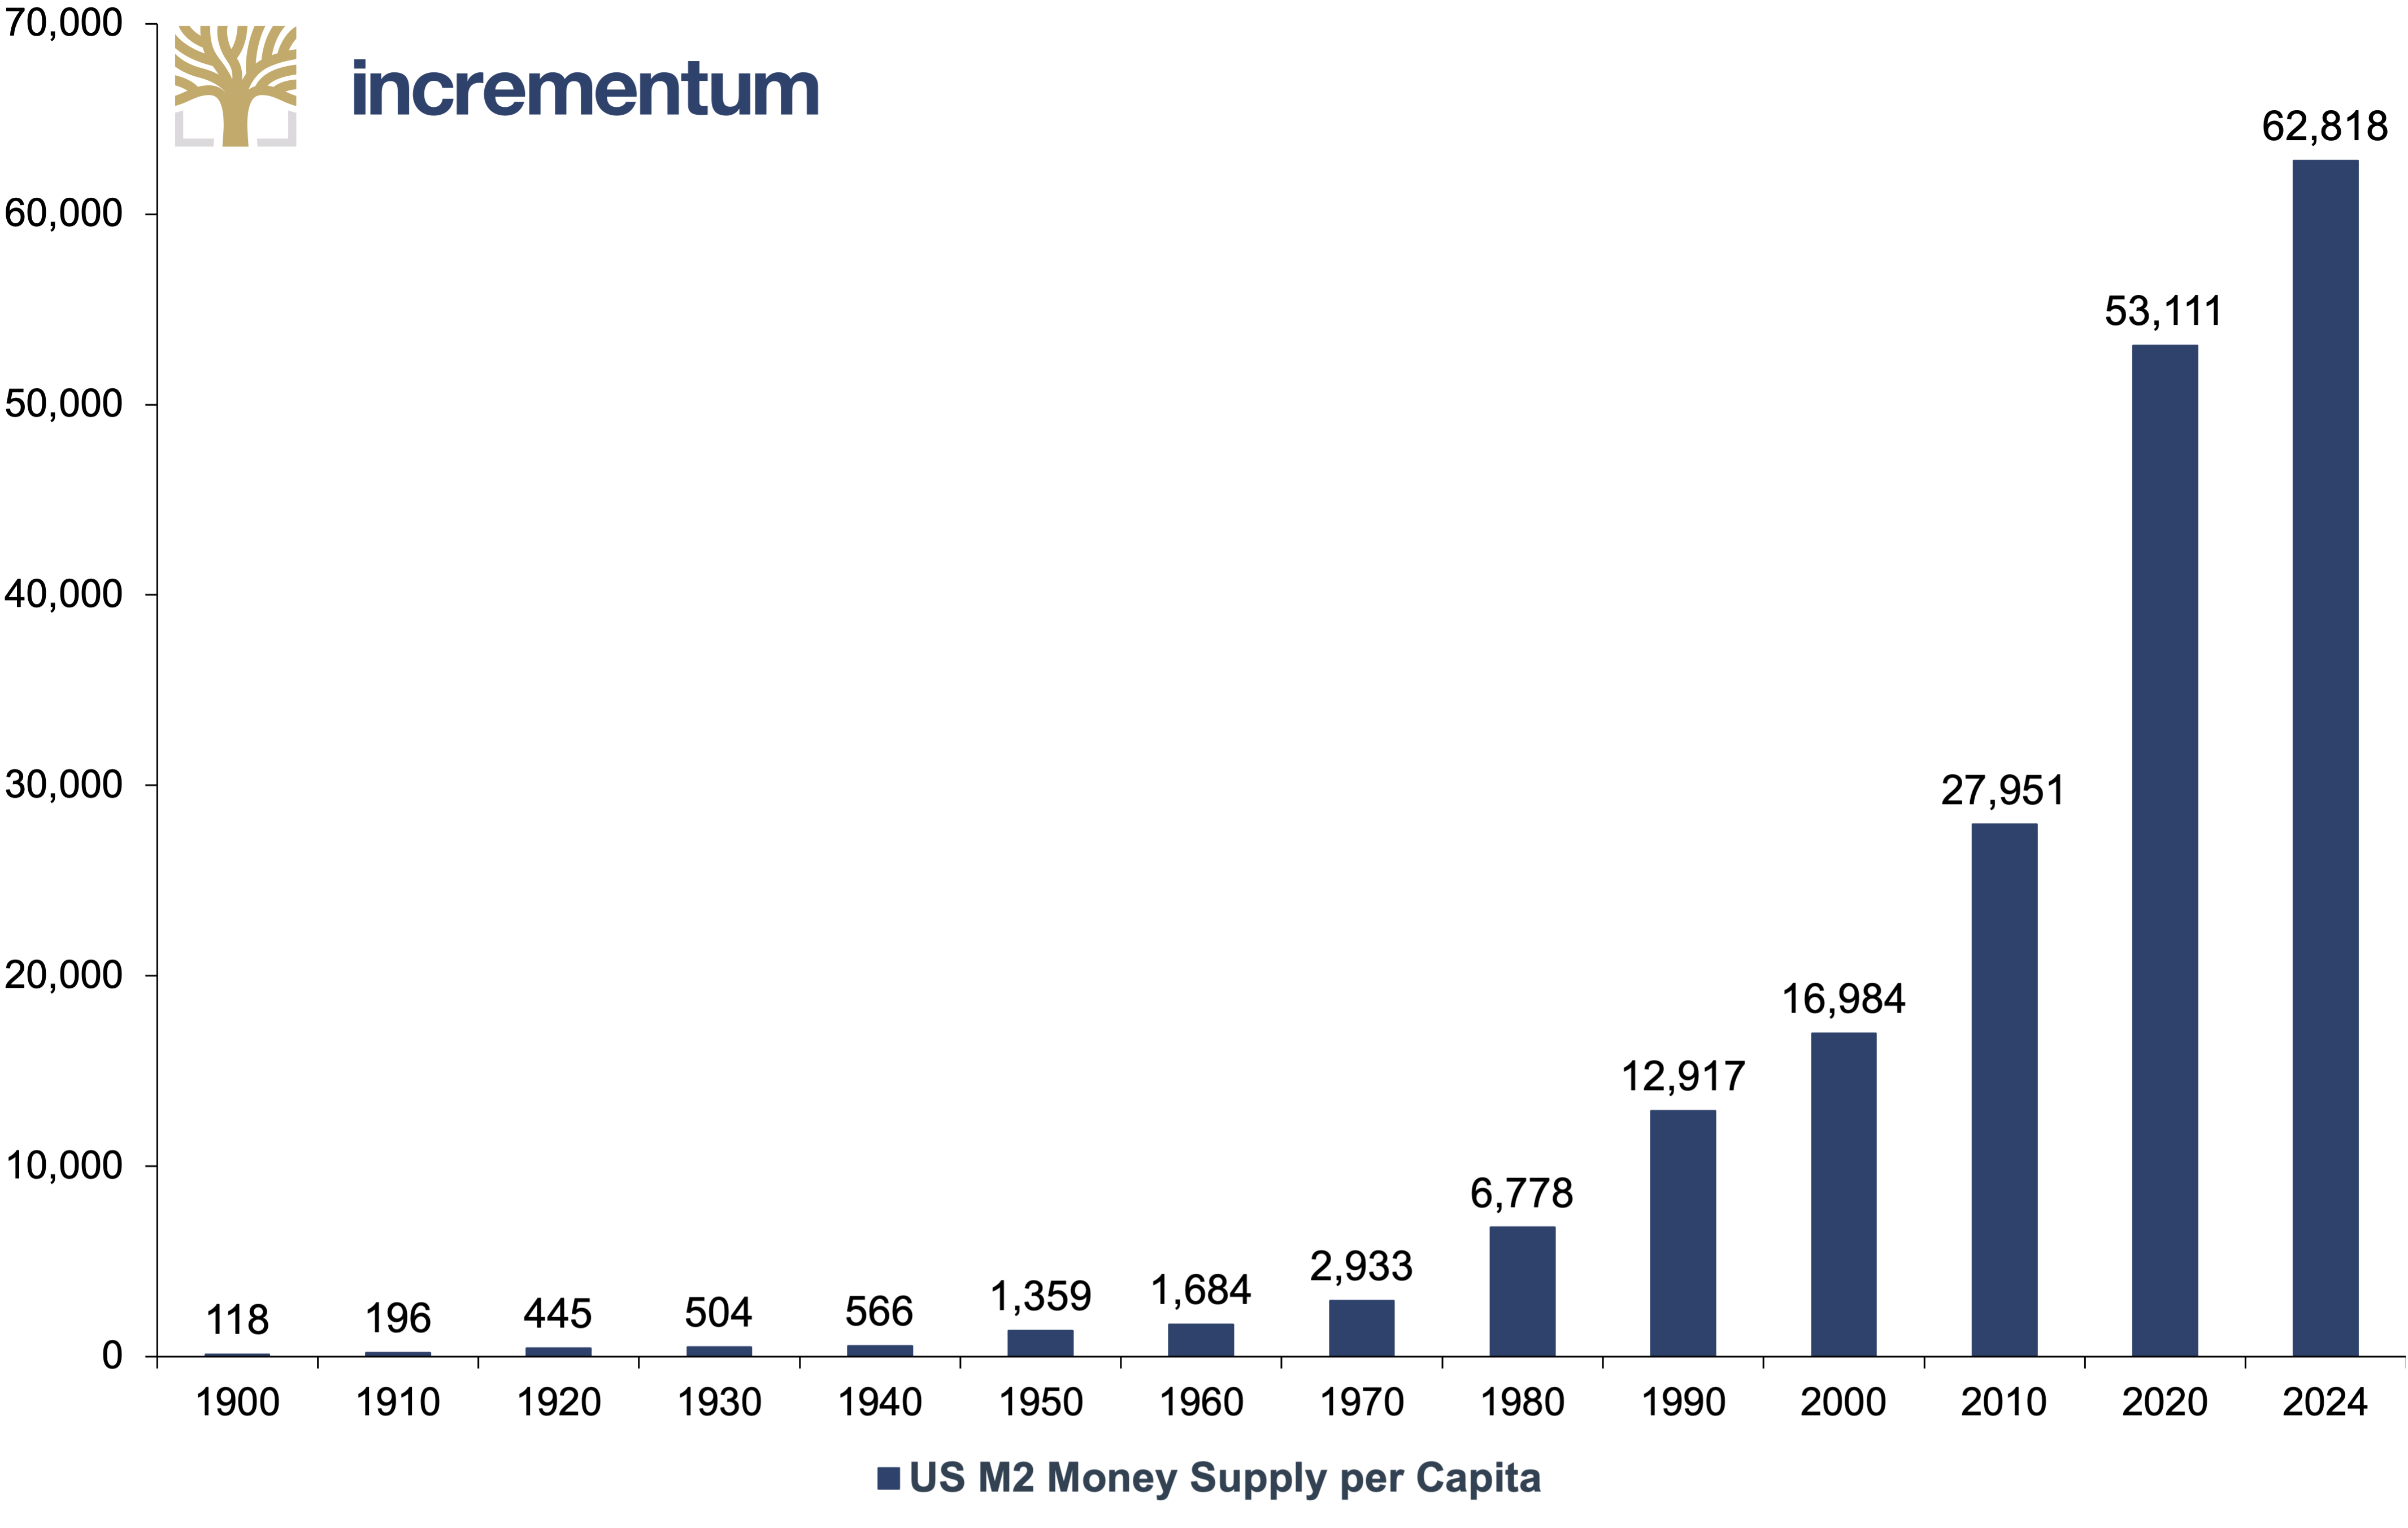
Source: Nick Laird, LSEG, Incrementum AG
Money supply growth is the key driver of the gold price in the long term. After three years of sometimes negative growth, the global money supply is now growing again. On a long-term average, M2 in the G20 countries has grown at a rate of 7.4% per year. The money supply growth is currently at the lower end of its historical range. In his highly recommended book “The Big Print”, our friend Larry Lepard argues that there will be a significant acceleration in money supply growth. If The Big Print does indeed occur, it will act as another catalyst for The Big Long.
Gold (lhs), in USD, and G20 M2 Money Supply (rhs), in USD trn, 01/2004–04/2025
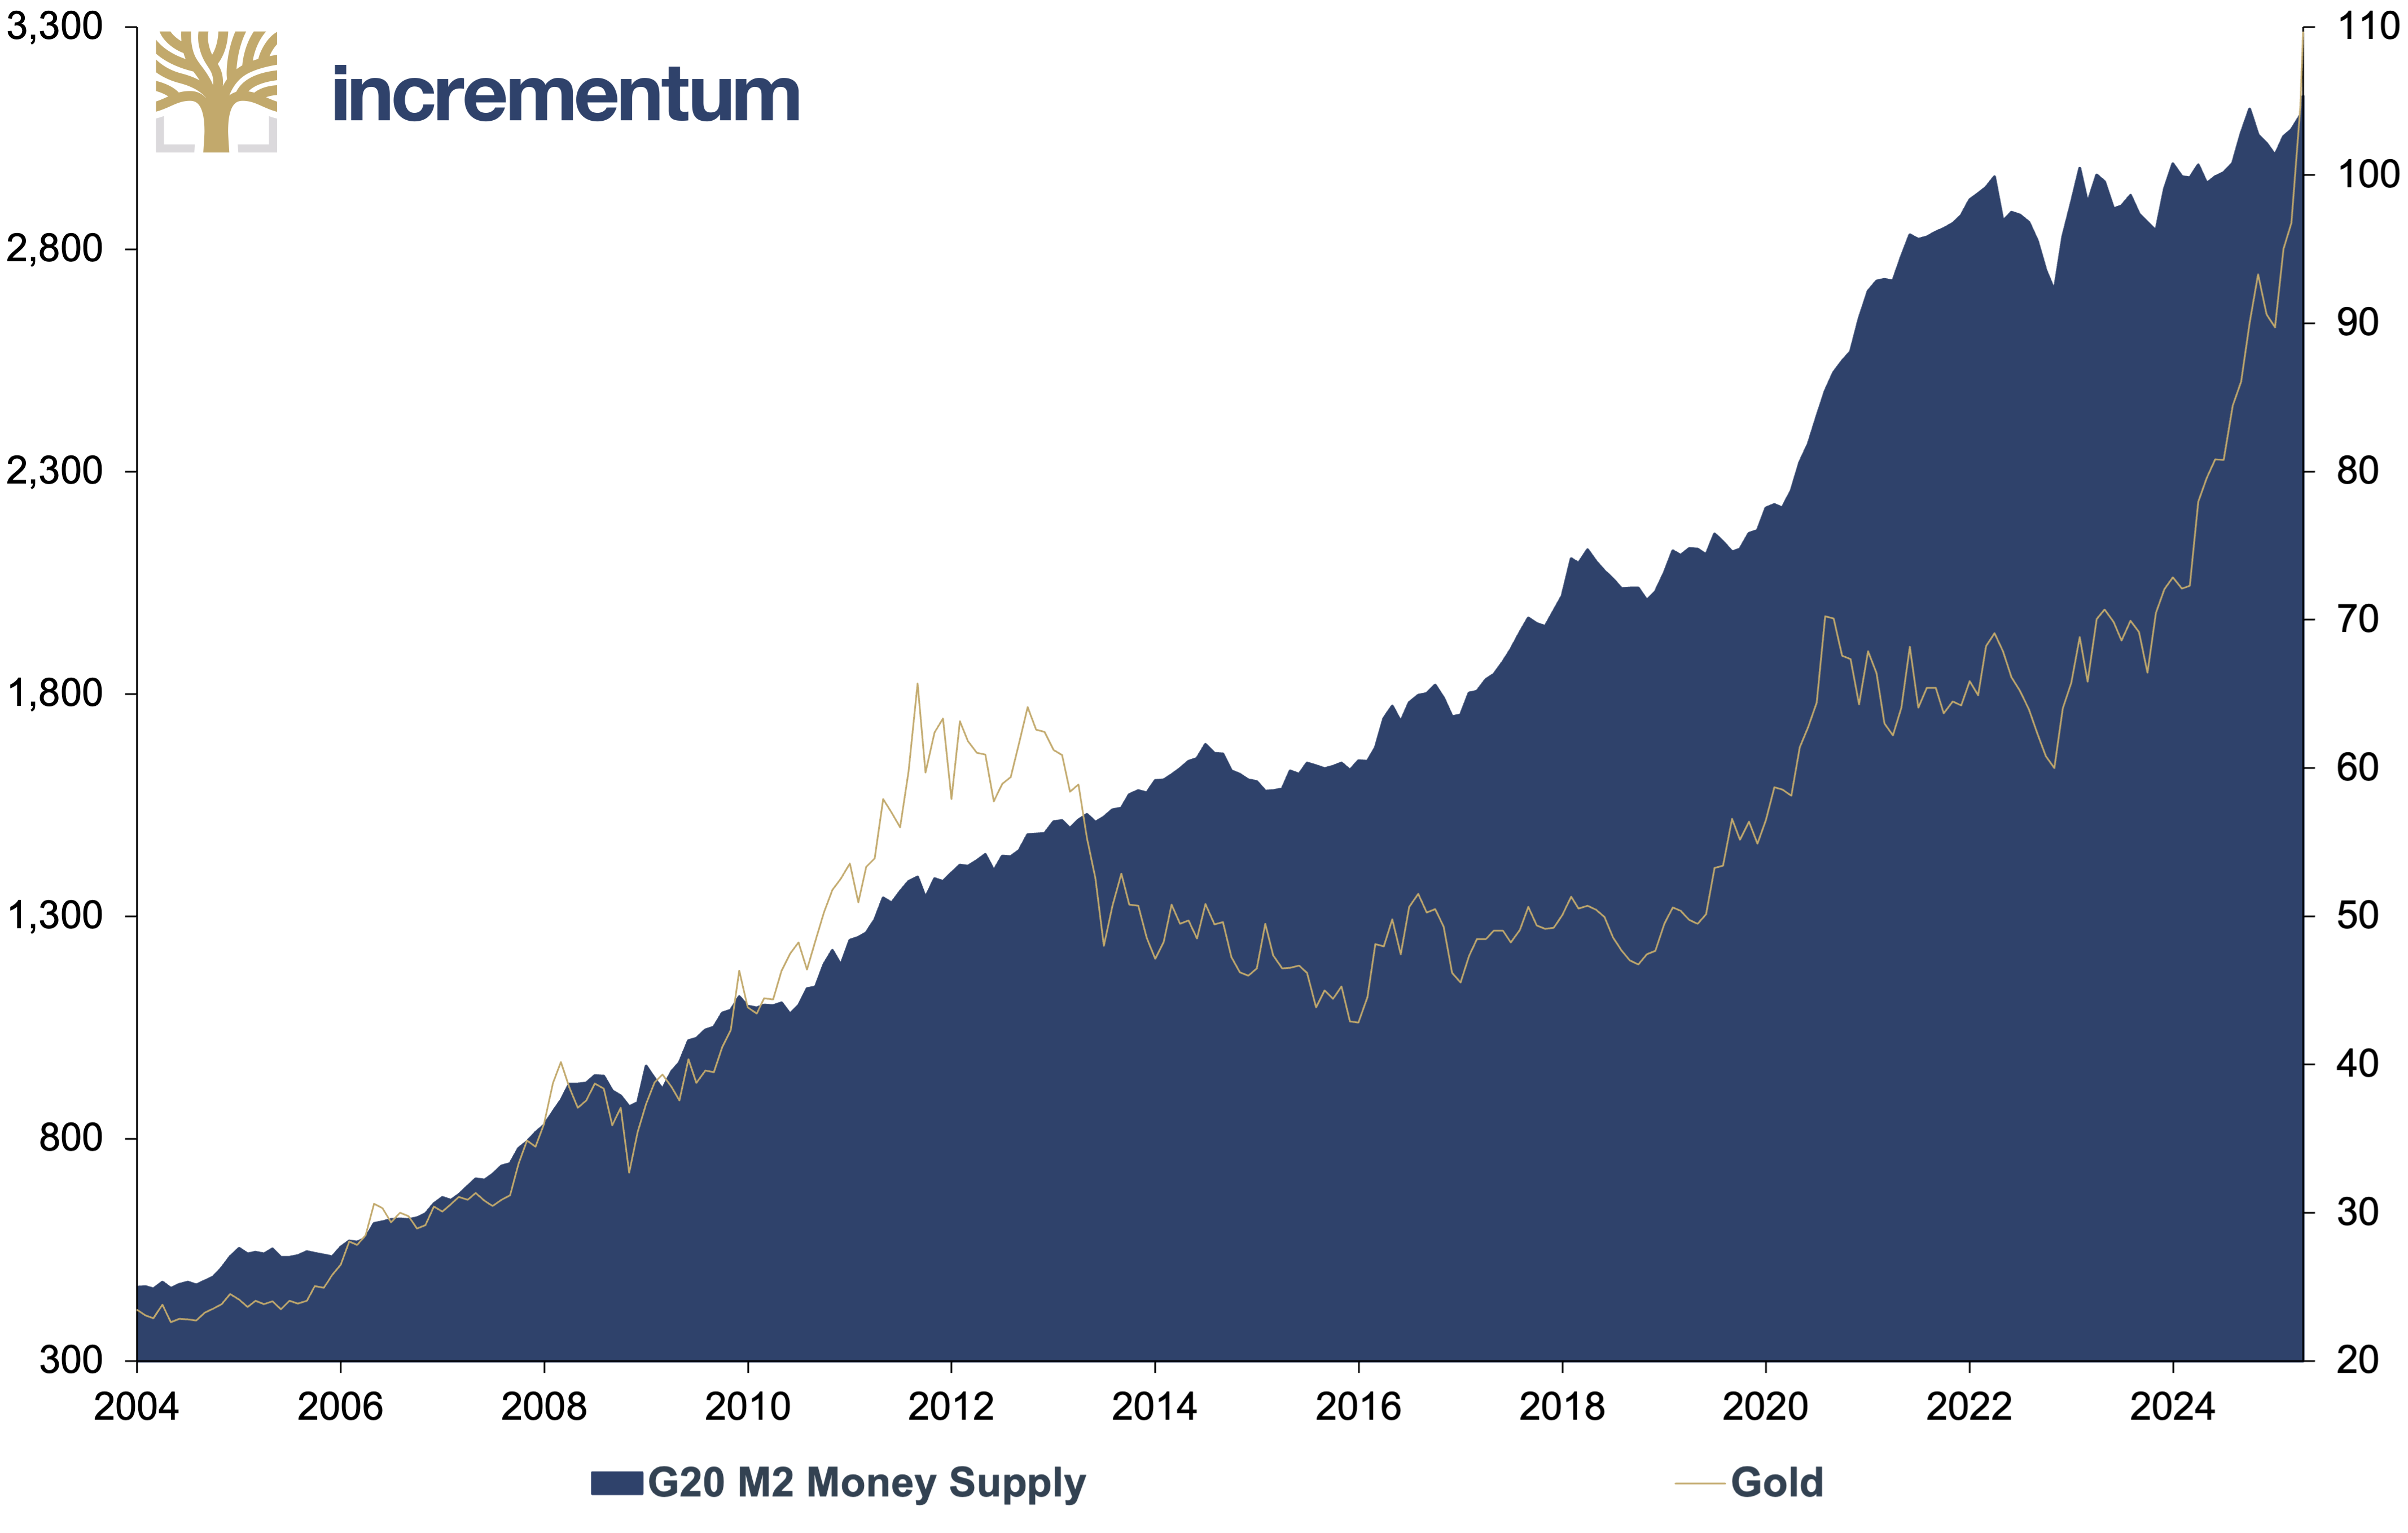
Source: Charlie Morris, LSEG, Incrementum AG
The shadow gold price for gold
In our In Gold We Trust report, we have preserved the idea of the shadow gold price (SGP),[5] even in times when gold’s reserve function was as forgotten as many cult films of the 1980s. But like Top Gun after 36 years, gold is increasingly finding its way back into the limelight. The shadow gold price refers to the theoretical gold price in the event of full gold backing of the base money supply. Theoretically, a return to a fully backed gold currency would be possible if the shadow gold price were reached.
These calculations are by no means just a mind game: the Bretton Woods agreement calculated the exchange rate between the US dollar and gold in this way: US monetary base divided by US gold holdings. The following table shows shadow gold prices with full coverage of the monetary aggregates M0, M1 and M2.
Shadow Gold Price for Various Monetary Aggregates, 12/2024
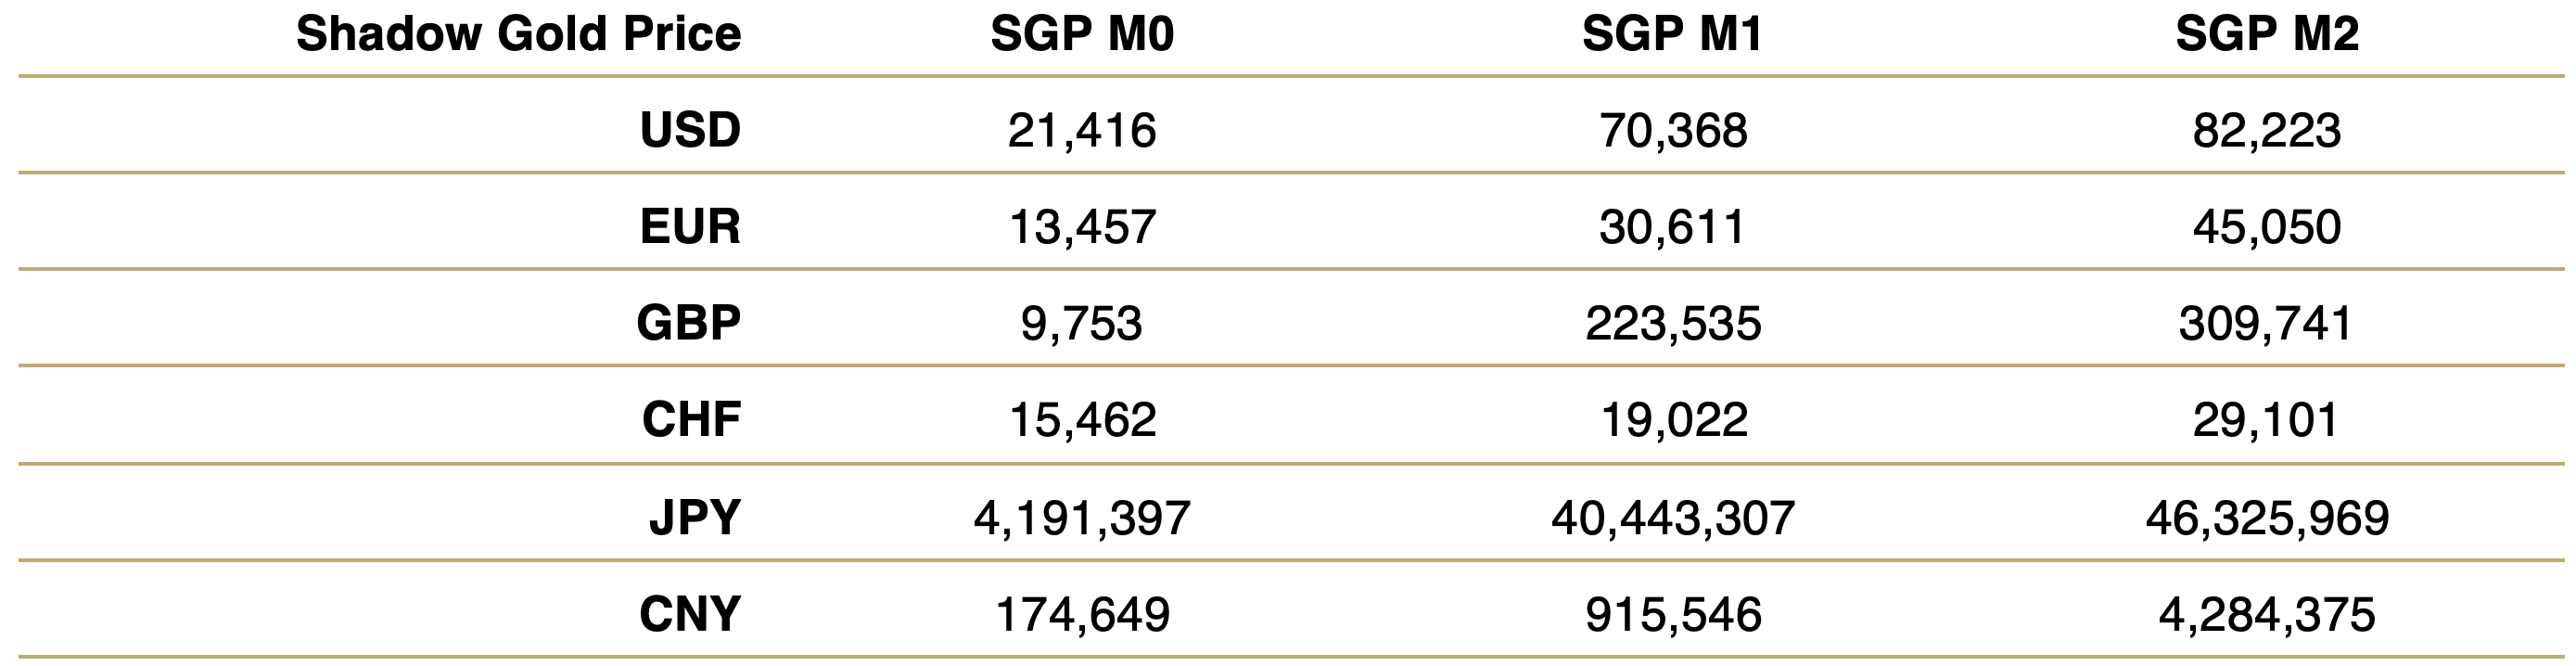
Source: Trading Economics, Incrementum AG
How should this table be interpreted? At a gold price of USD 21,416, the entire monetary base M0 of the US dollar would be 100% covered by the Federal Reserve’s gold reserves – more precisely, by gold certificates valued at market prices. In the eurozone it would be just under EUR 13,500. If the same logic were applied to the broader monetary aggregate M2, 100% coverage would result in a gold price of USD 82,223 for the US and CHF 29,101 for Switzerland, for example.
Historically, however, different forms of partial cover were the rule. For example, the Federal Reserve Act of 1914 stipulated a gold cover of at least 40%. To meet this requirement today, the price of gold would have to rise to USD 8,566. From 1945 to 1971, only 25% coverage was required, which would currently correspond to an M0 shadow gold price of USD 5,354.
Gold Price to Back Monetary Base (log), in USD, 01/1920–03/2025
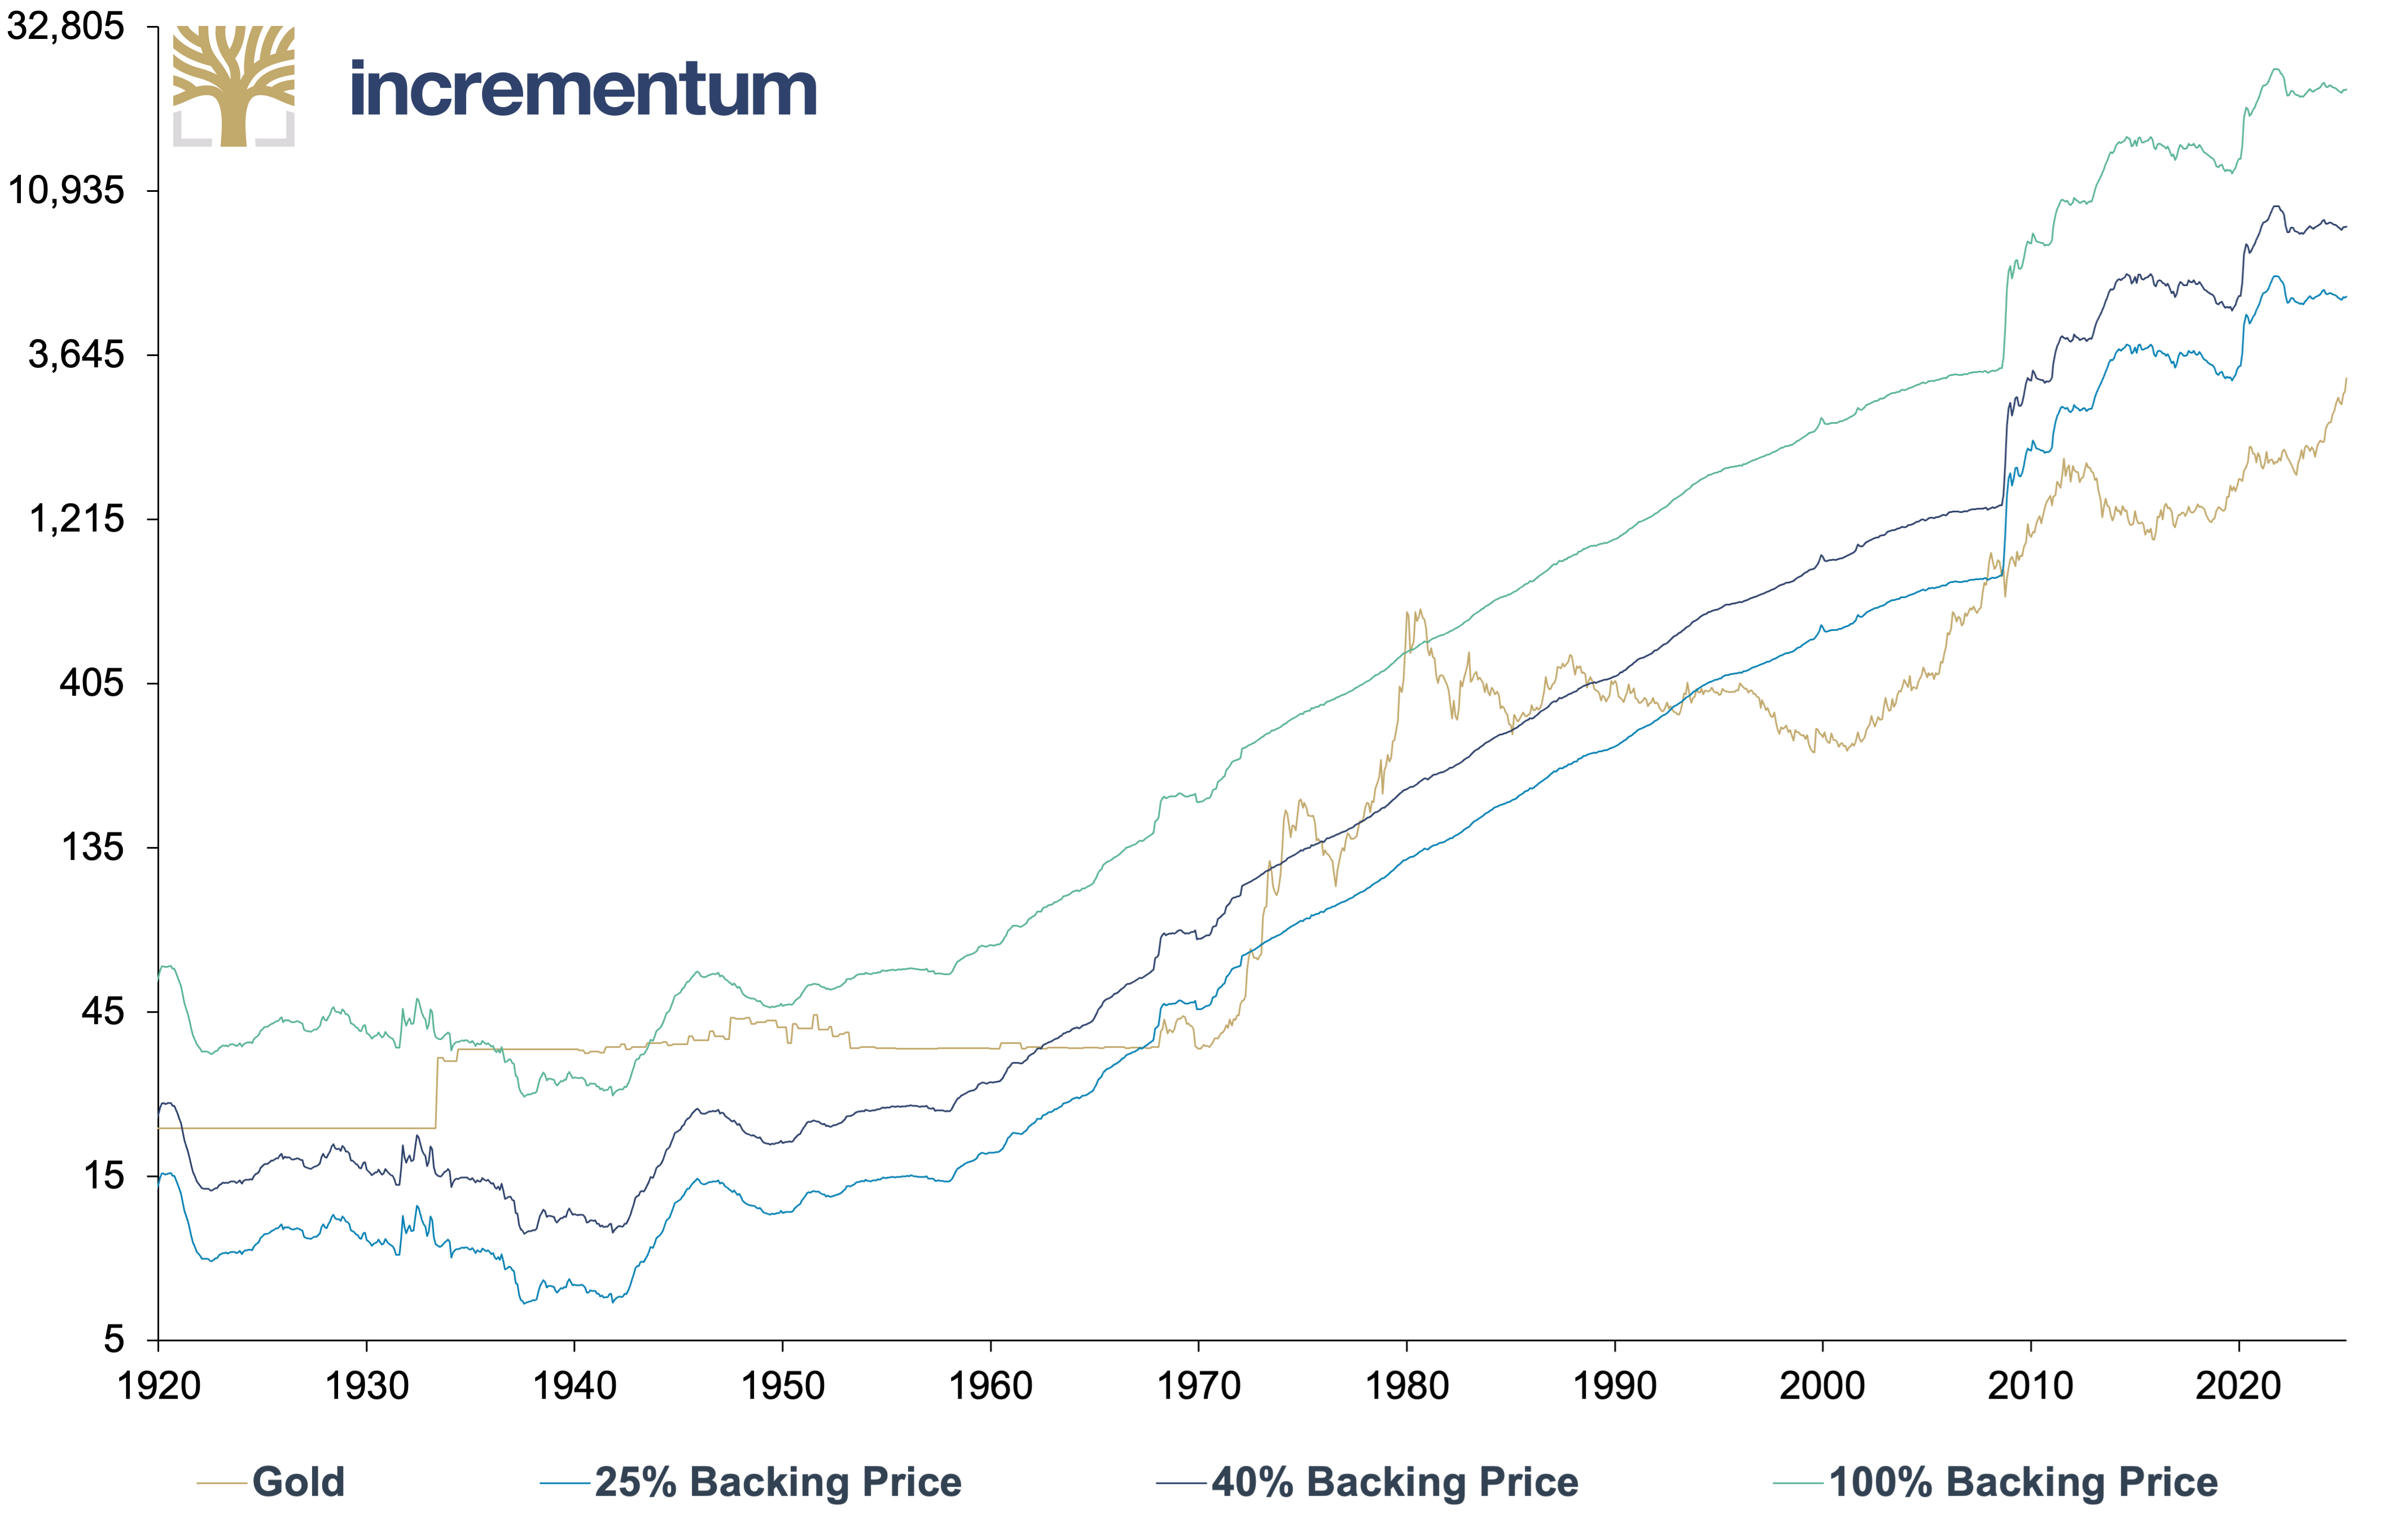
Source: Nick Laird, Federal Reserve St. Louis, LSEG, Incrementum AG
The reciprocal value of the shadow gold price based on current market prices gives the degree of coverage of the monetary base and reflects the state of monetary stability. In the gold bull market of the 2000s, the gold coverage of the monetary base tripled from 10.8% to 29.7%. A comparable coverage ratio today would only arise if the gold price were to almost double to over USD 6,000. Historically, gold coverage reached values above 100% in the 1930s, 1940s and 1980. The record value of 131% from 1980 would correspond to a gold price of around USD 30,000. Currently, the gold coverage ratio of the monetary base in the US is only 14.5%. To put it crudely: Only 14.5 cents of every US dollar currently consists of gold, the remaining 85.5% is air.
Gold Backing of Monetary Base, in %, 01/1920–03/2025
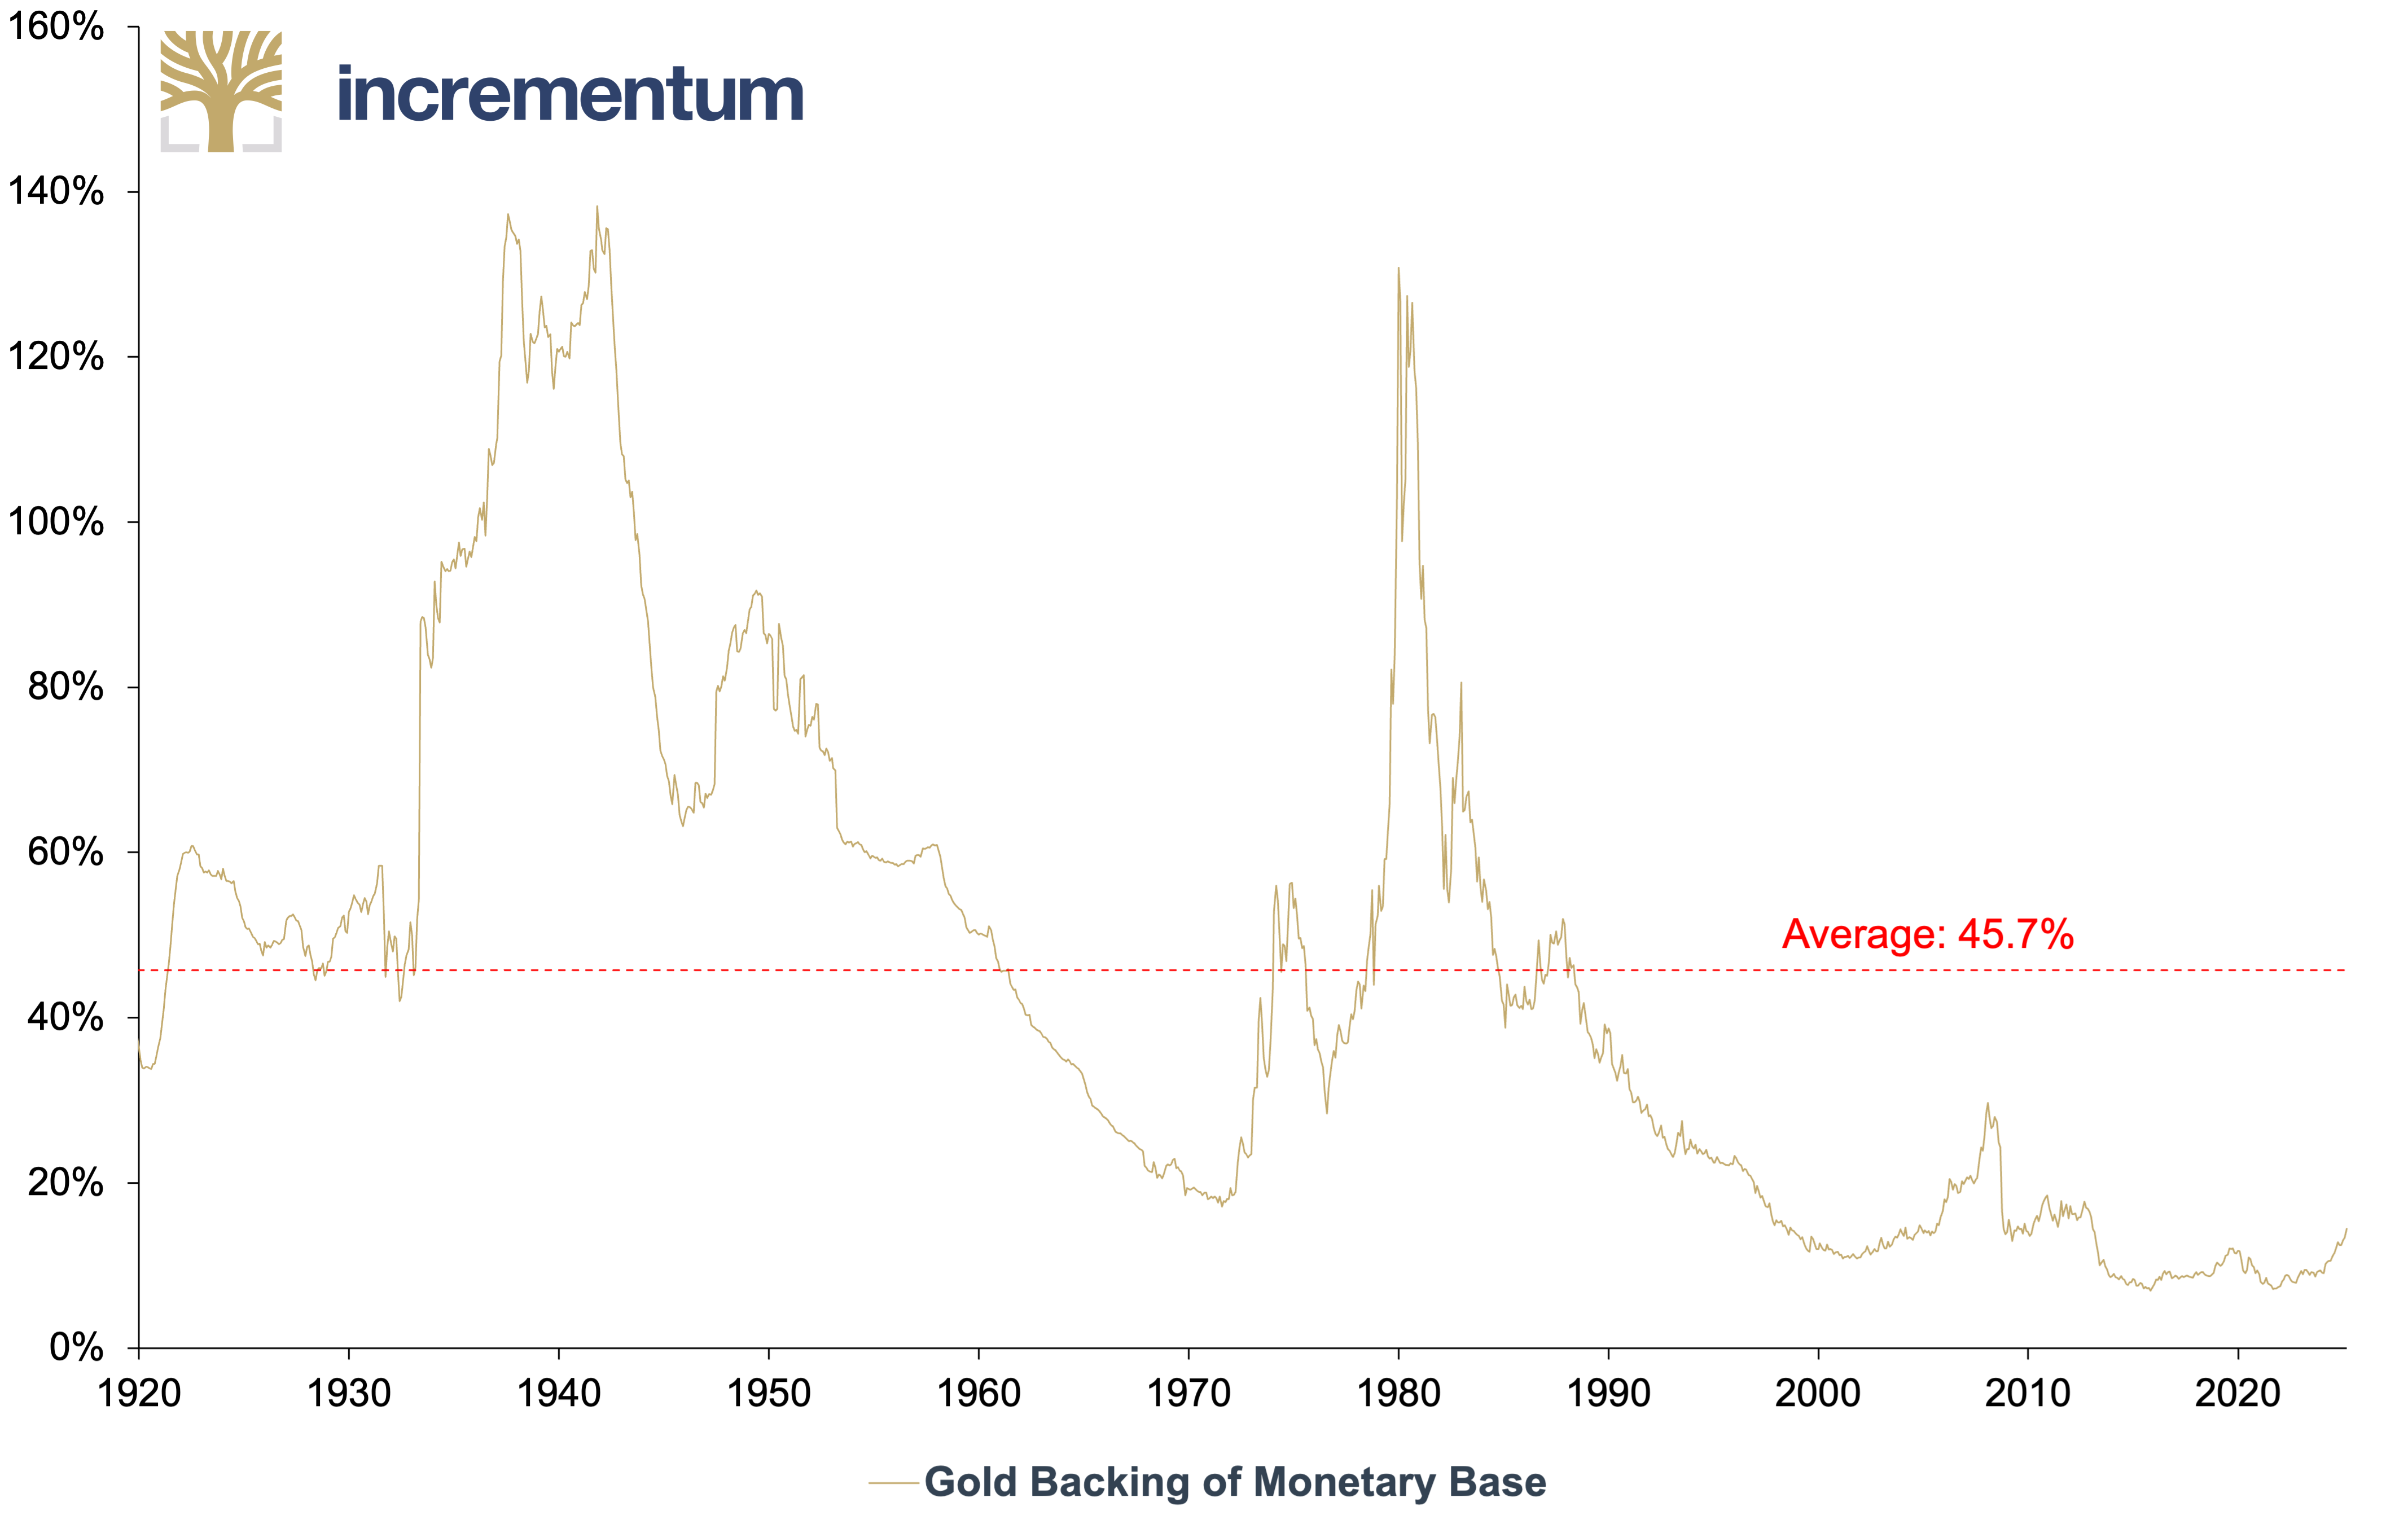
Source: Nick Laird, Federal Reserve St. Louis, LSEG, Incrementum AG
The international shadow gold price shows how high the gold price would have to rise if the money supply (M0 or M2) of the leading currency areas – the US, euro area, UK, Switzerland, Japan, and China – were covered by the central banks’ gold reserves in proportion to their share of global GDP. This view impressively reveals the extent of the monetary expansion: With an – admittedly purely theoretical – 100% coverage of the broad money supply M2, the gold price would be over USD 231,000; even with a moderate 25% coverage, it would be around USD 58,000.
International Shadow Gold Price* at Different Gold Coverage Levels (log), in USD, 12/2024
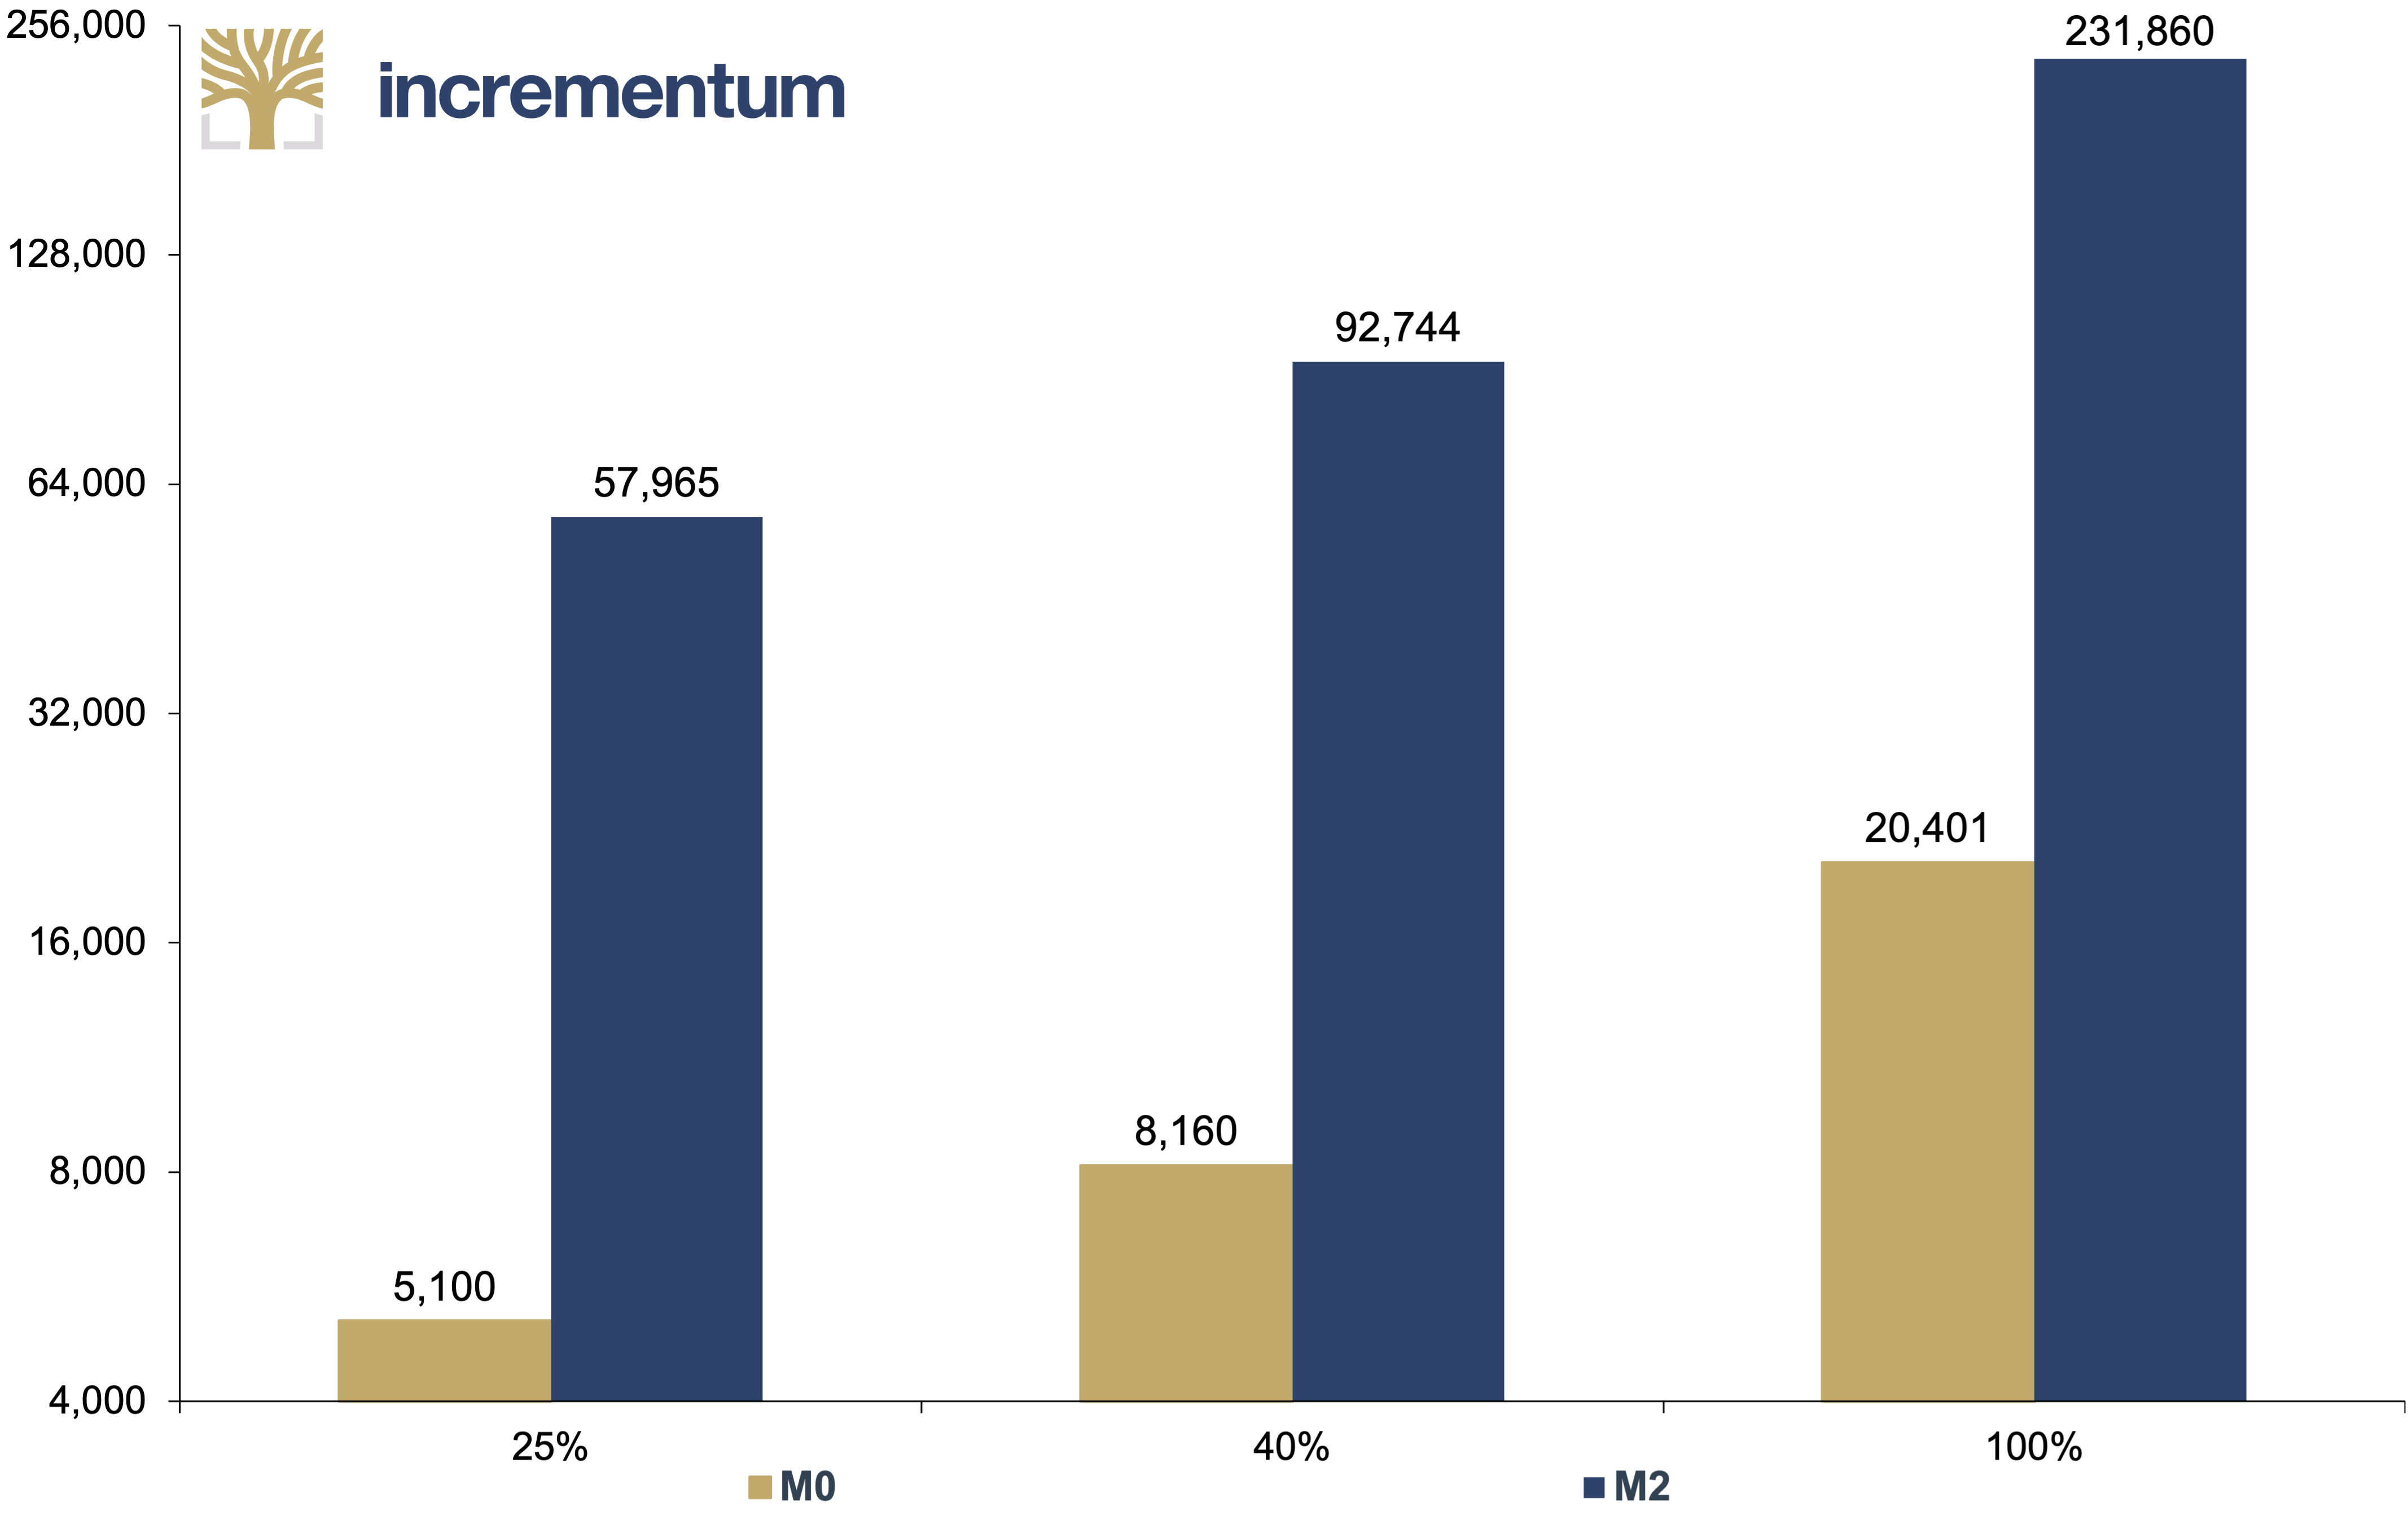
Source: Trading Economics, Incrementum AG
*Calculation based on M0/M2 of the US, Eurozone, UK, Switzerland, Japan, and China, then GDP-weighted and homogenized.
These shadow gold prices reveal two things: firstly, the enormous overexpansion of today’s money supply in relation to the available amount of gold, and secondly, the long-term potential of gold should it be remonetized in the course of a reorganization of the global monetary system through a restoration of the gold redemption obligation. The shadow gold price therefore serves as a strategic compass for investors who regard gold not as a commodity but as a monetary anchor.
Quo Vadis, Aurum?
Update on the gold price forecast until the end of the decade
After these theoretical considerations, we now want to return to the hard ground of investor reality. Now, at the halfway point of the golden decade, is the right time to take stock. We presented our proprietary Incrementum Gold Price Model in the In Gold We Trust report 2020, “The Dawning of a Golden Decade”. In this model, we employed historical data to forecast different scenarios regarding money supply growth and the implied gold coverage ratio, assigning probabilities to each outcome.
The 2020 decade price target of around USD 4,800 in the base scenario, which seemed like a distant mirage to many investors and analysts at the time, is now taking shape. As of 30 April, the gold price is already trading well above the calculated interim target of USD 2,942 for the end of 2025. This target is based on an average annual gold price increase of “only” 7%.
Status of the Gold Price Projection until 2030: Gold, in USD, 01/1970–12/2030
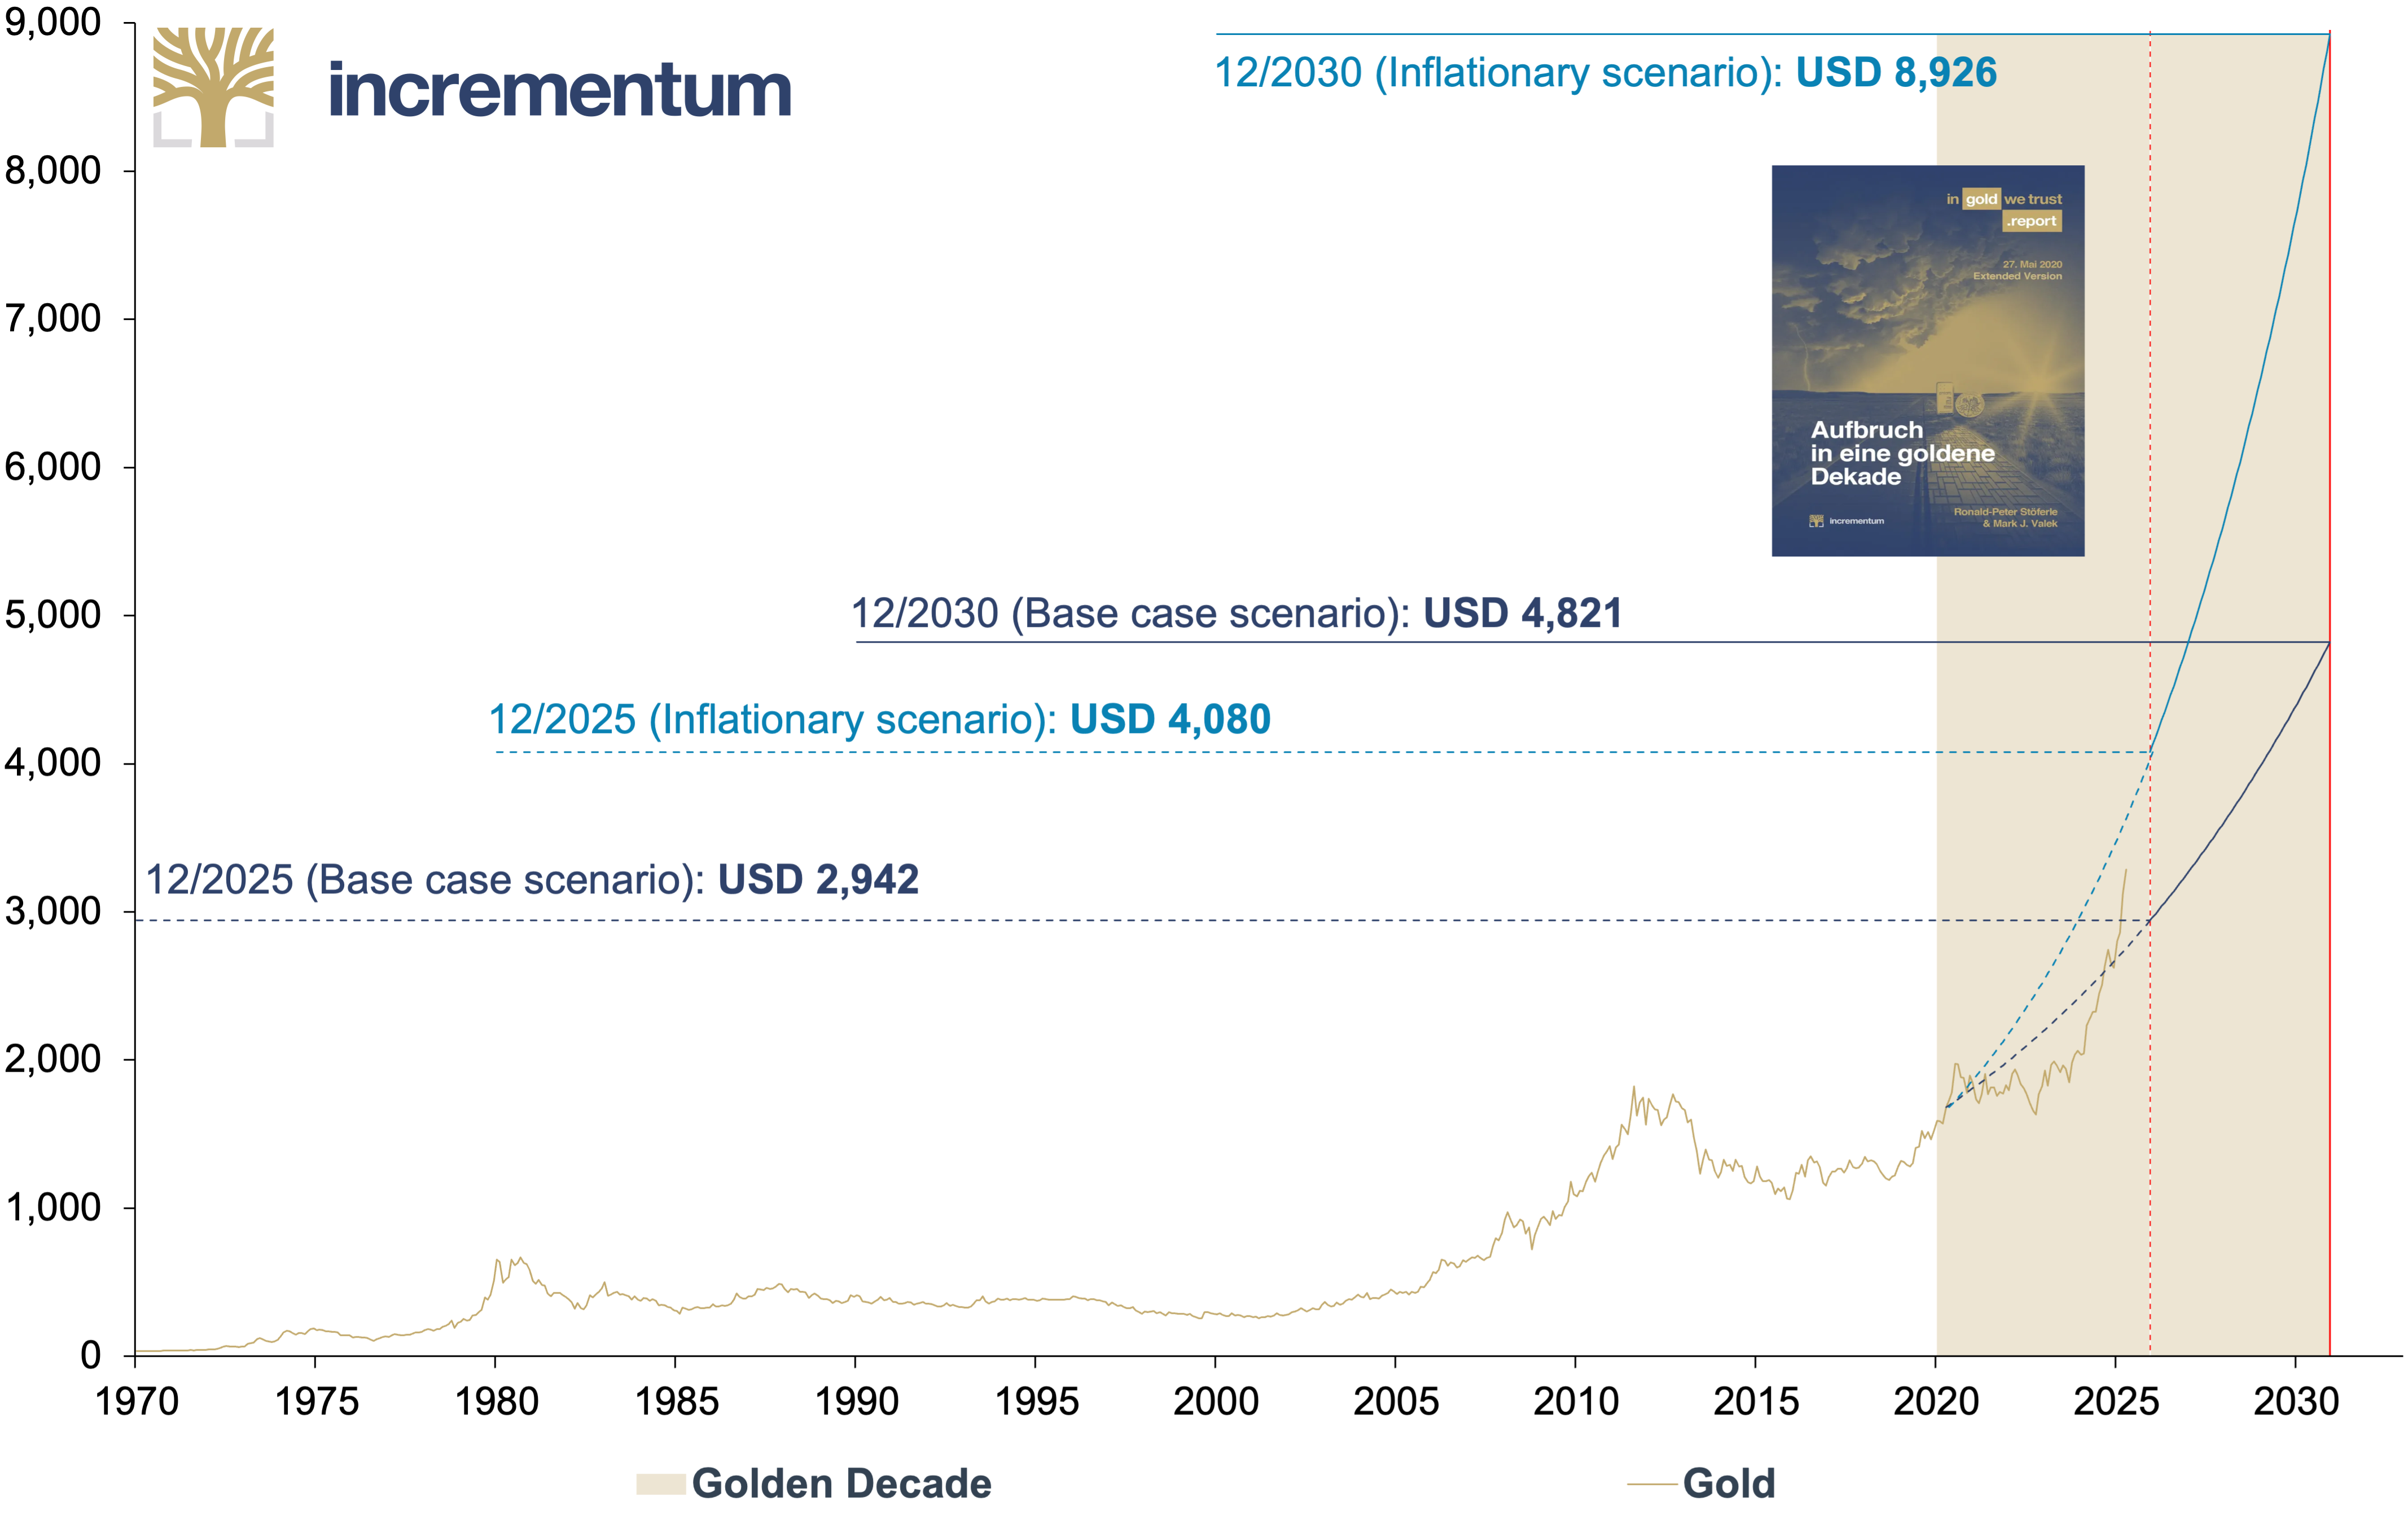
Source: LSEG, Incrementum AG
Given the recent momentum on the gold market, it is worth looking at our alternative scenario: Back in 2020, we pointed out the possibility of an inflationary or stagflationary decade, as in the 1970s. For this tail risk scenario, we attributed a gold price increase to around USD 8,900 by the end of the decade, which – based on current price levels – would still correspond to considerable growth of around 19% p.a. The arithmetical interim target for this scenario is USD 4,080 at the end of 2025. From today’s perspective, a realized price within the range of the two scenarios by the end of the decade appears realistic. The forecast corridor of USD 4,800 to USD 8,900 depends mainly on how inflationary the next five years will be.
The Big Rotation: How Bright Will Performance Gold Shine?
Even though gold is slowly coming back into the spotlight, the big gold rush of Western financial investors is still a long way off: Gold ETFs recorded the second-highest quarterly inflows ever measured in US dollars in Q1/2025, at USD 21.1 billion. However, due to the sharp rise in the price of gold, this is only the tenth largest quarterly inflow in history, measured in tonnes. In addition, current inflows into gold ETFs continue to lag far behind those of equity and bond ETFs — about as far behind as Austria was at halftime in the legendary 0:9 loss against Spain. Or, as Toni Pfeffer famously put it at the break with the score at 0:5, “Hoch werd’ ma’s nimmer g’winna.” (“Well, we certainly won’t win big anymore.”)
ETF Inflows, in USD bn, Q1/2025
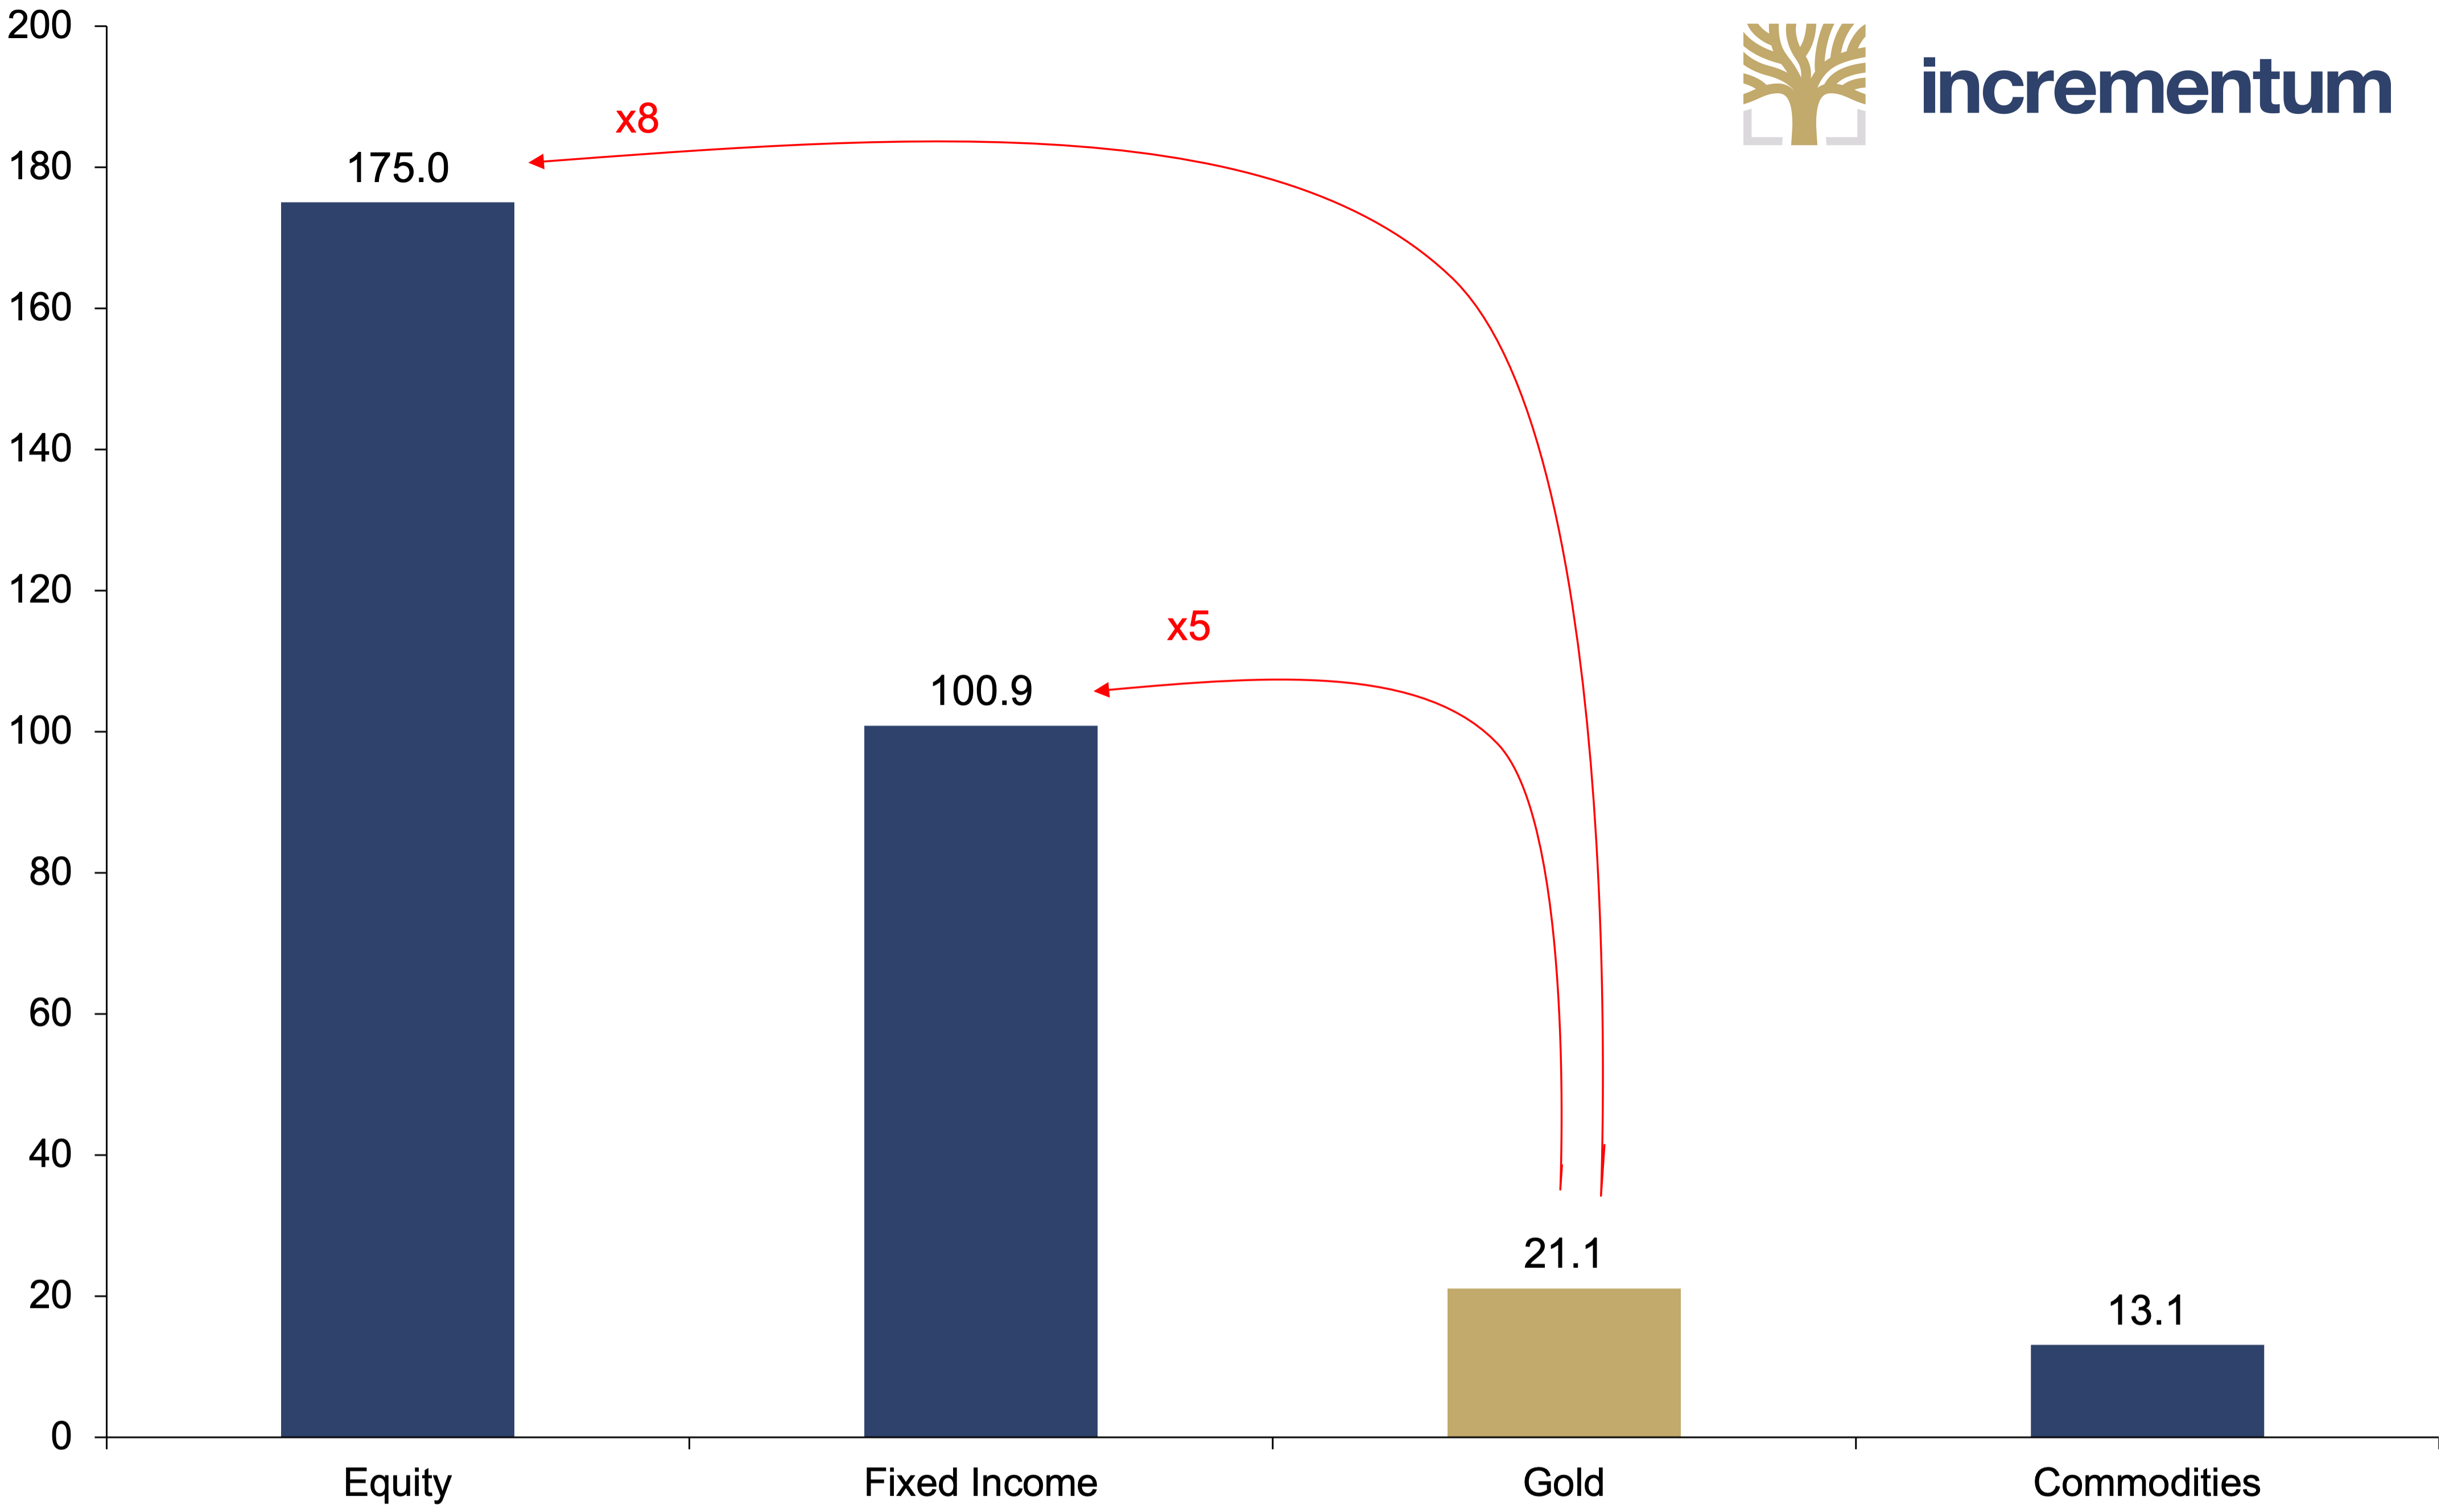
Source: State Street Global Advisors, World Gold Council, Incrementum AG
We now see increasing opportunities in those assets that we summarized in “The New Gold Playbook” under the term performance gold: silver, mining stocks, and commodities, which have come into the limelight in the slipstream of gold, albeit still cautiously.[6]
The following table illustrates the potential of silver, mining stocks, and commodities in the context of historical gold bull markets. A comparison of the performance to date in the current decade with that of the 1970s and 2000s shows considerable catch-up potential for silver and mining stocks in particular.
Performance of Gold, Silver, Mining Stocks*, and Commodities** in Bull Market Decades, in USD, 12/1969–04/2025
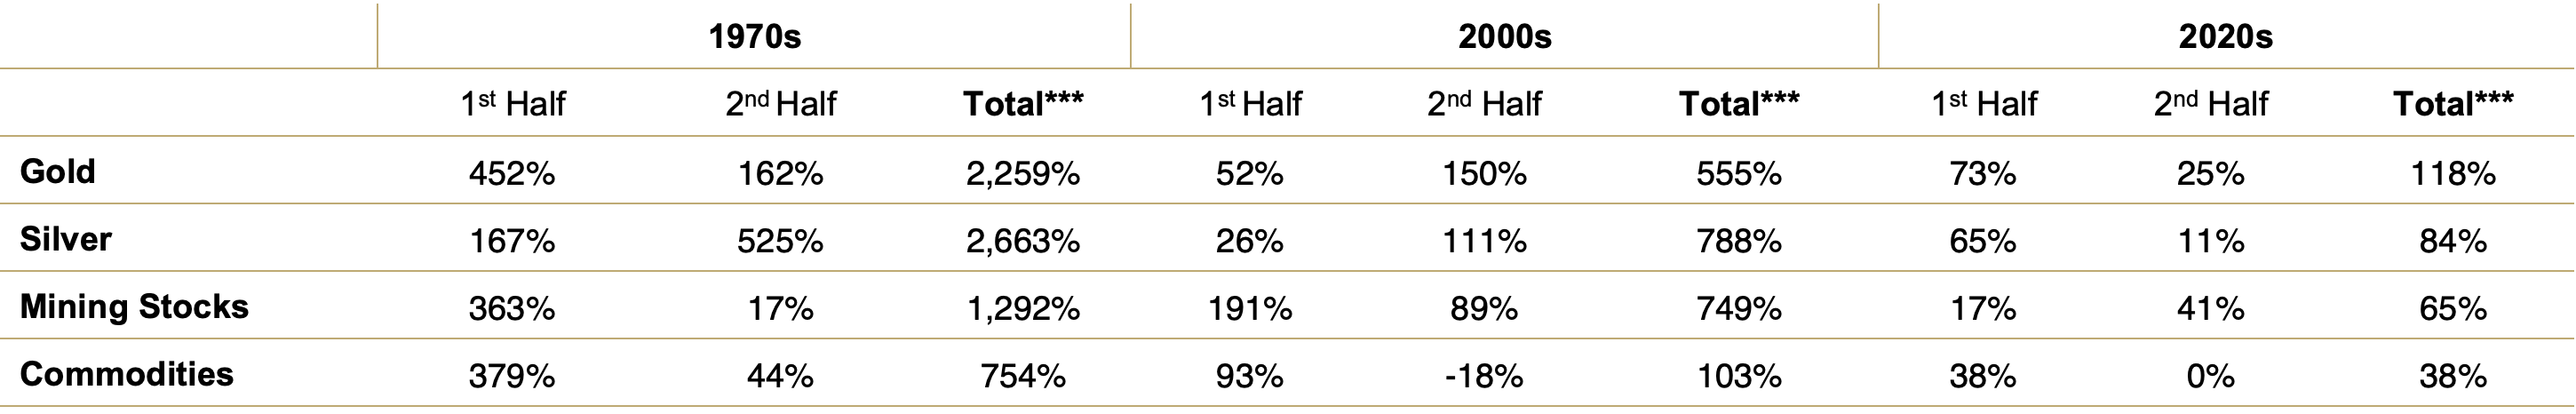
Source: LSEG, Incrementum AG
*BGMI 12/1969–05/1996, HUI 05/1996-. **GSCI Index TR. ***Decade start to peak.
Our thesis is that gold always leads the way, with silver, mining stocks, and commodities following in its wake. The dynamics resemble a relay race: Gold takes the starting leg, sets the pace, and pulls the field apart. Silver, mining stocks, and commodities then take the baton.
Silver
The gold/silver ratio stood at 100.9 at the end of April, putting it in the 100th percentile, a level that was otherwise only reached at the beginning of the Covid-19 pandemic. The long-term median since 1970 is 62.8, which further underlines the striking current divergence. In the past, similarly extreme conditions have been followed by an outperformance of silver.
Gold/Silver Ratio, 01/1970–04/2025
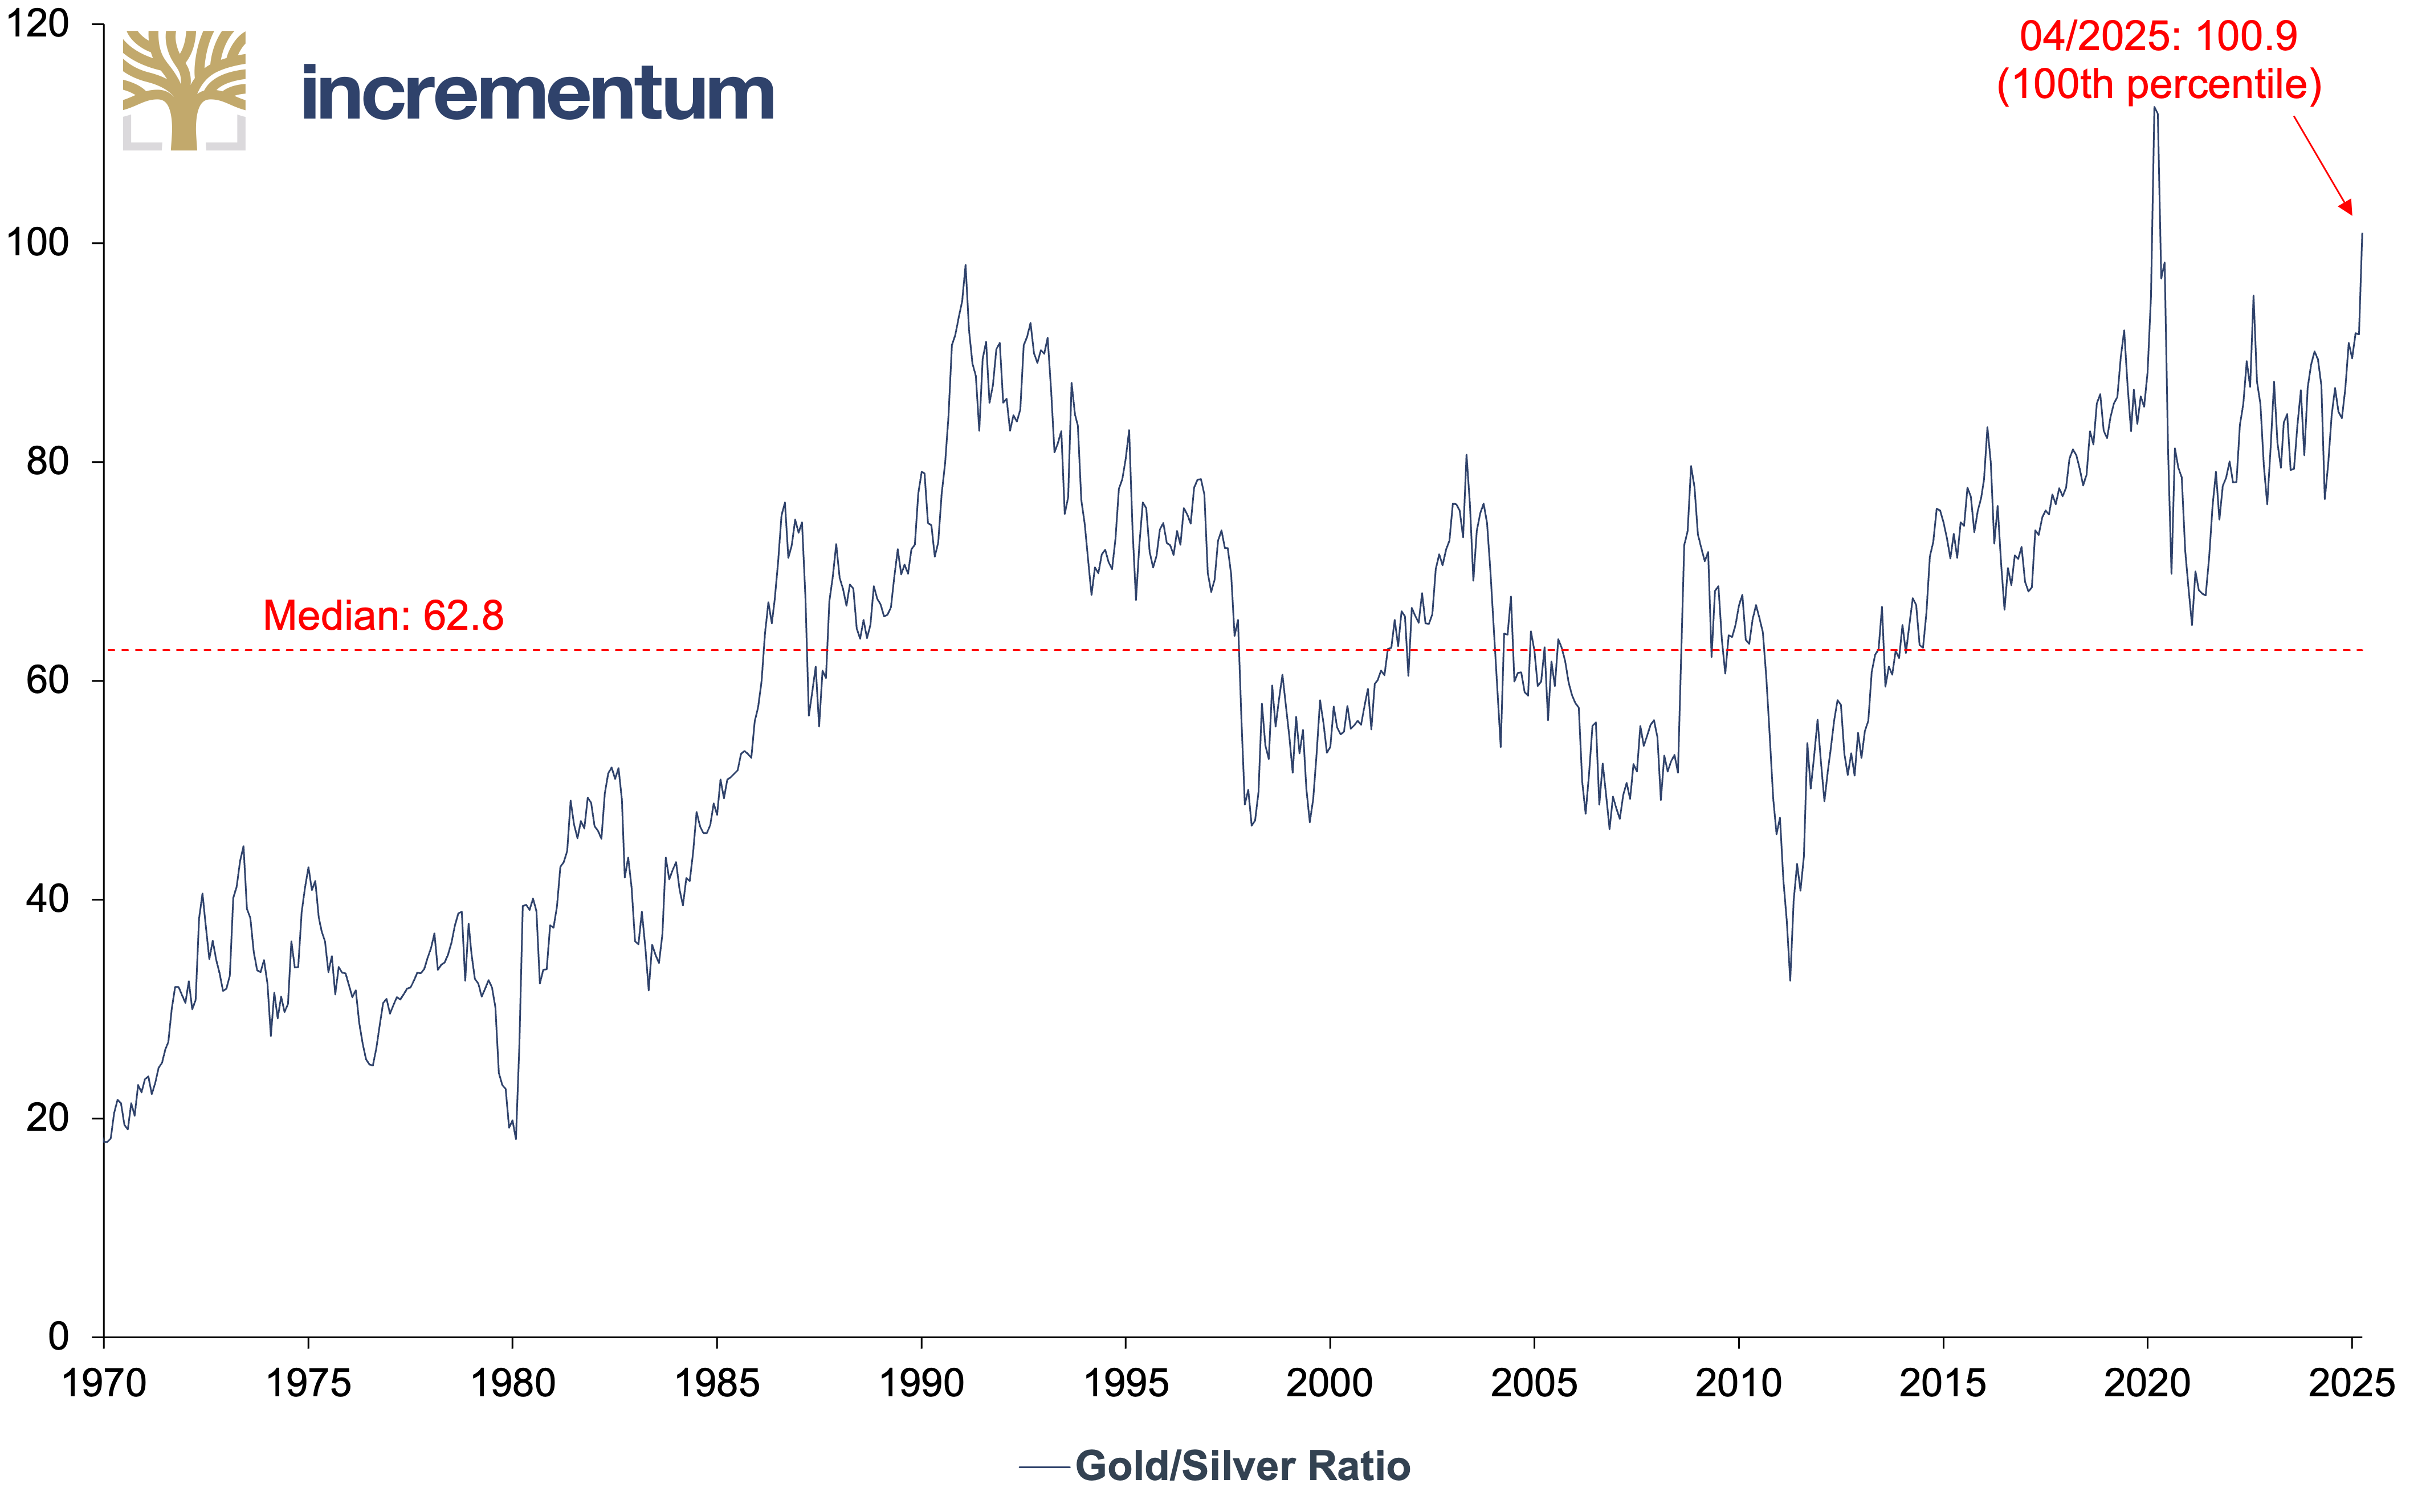
Source: Nick Laird, LSEG, Incrementum AG
Fundamentally, everything seems to be in place for gold’s little brother: Silver recorded a supply deficit for the fourth time in a row in 2024. Demand exceeded supply by 148.9 million ounces (Moz). In the period from 2021 to 2024, the cumulative deficit amounted to 678 Moz, which is the equivalent of ten months of global mine production. For 2025 , the Silver Institute is forecasting a further supply deficit of 117.6 Moz.
This shortage is primarily caused by the ongoing boom in photovoltaic applications. This key sector of the energy transition, which is dominated by China, is now the second largest demand driver for silver after jewelry and was responsible for a demand of 197.6 Moz in 2024.
In addition, silver has outperformed gold in 6 of the last 7 bull markets since 1967. Nevertheless, the price performance of the white metal has so far remained below the historical average, which opens up an attractive investment opportunity, provided that silver finally succeeds in realizing its potential as performance gold.
Gold (lhs, log), in USD, and Silver (rhs, log), in USD, 01/2018–04/2025
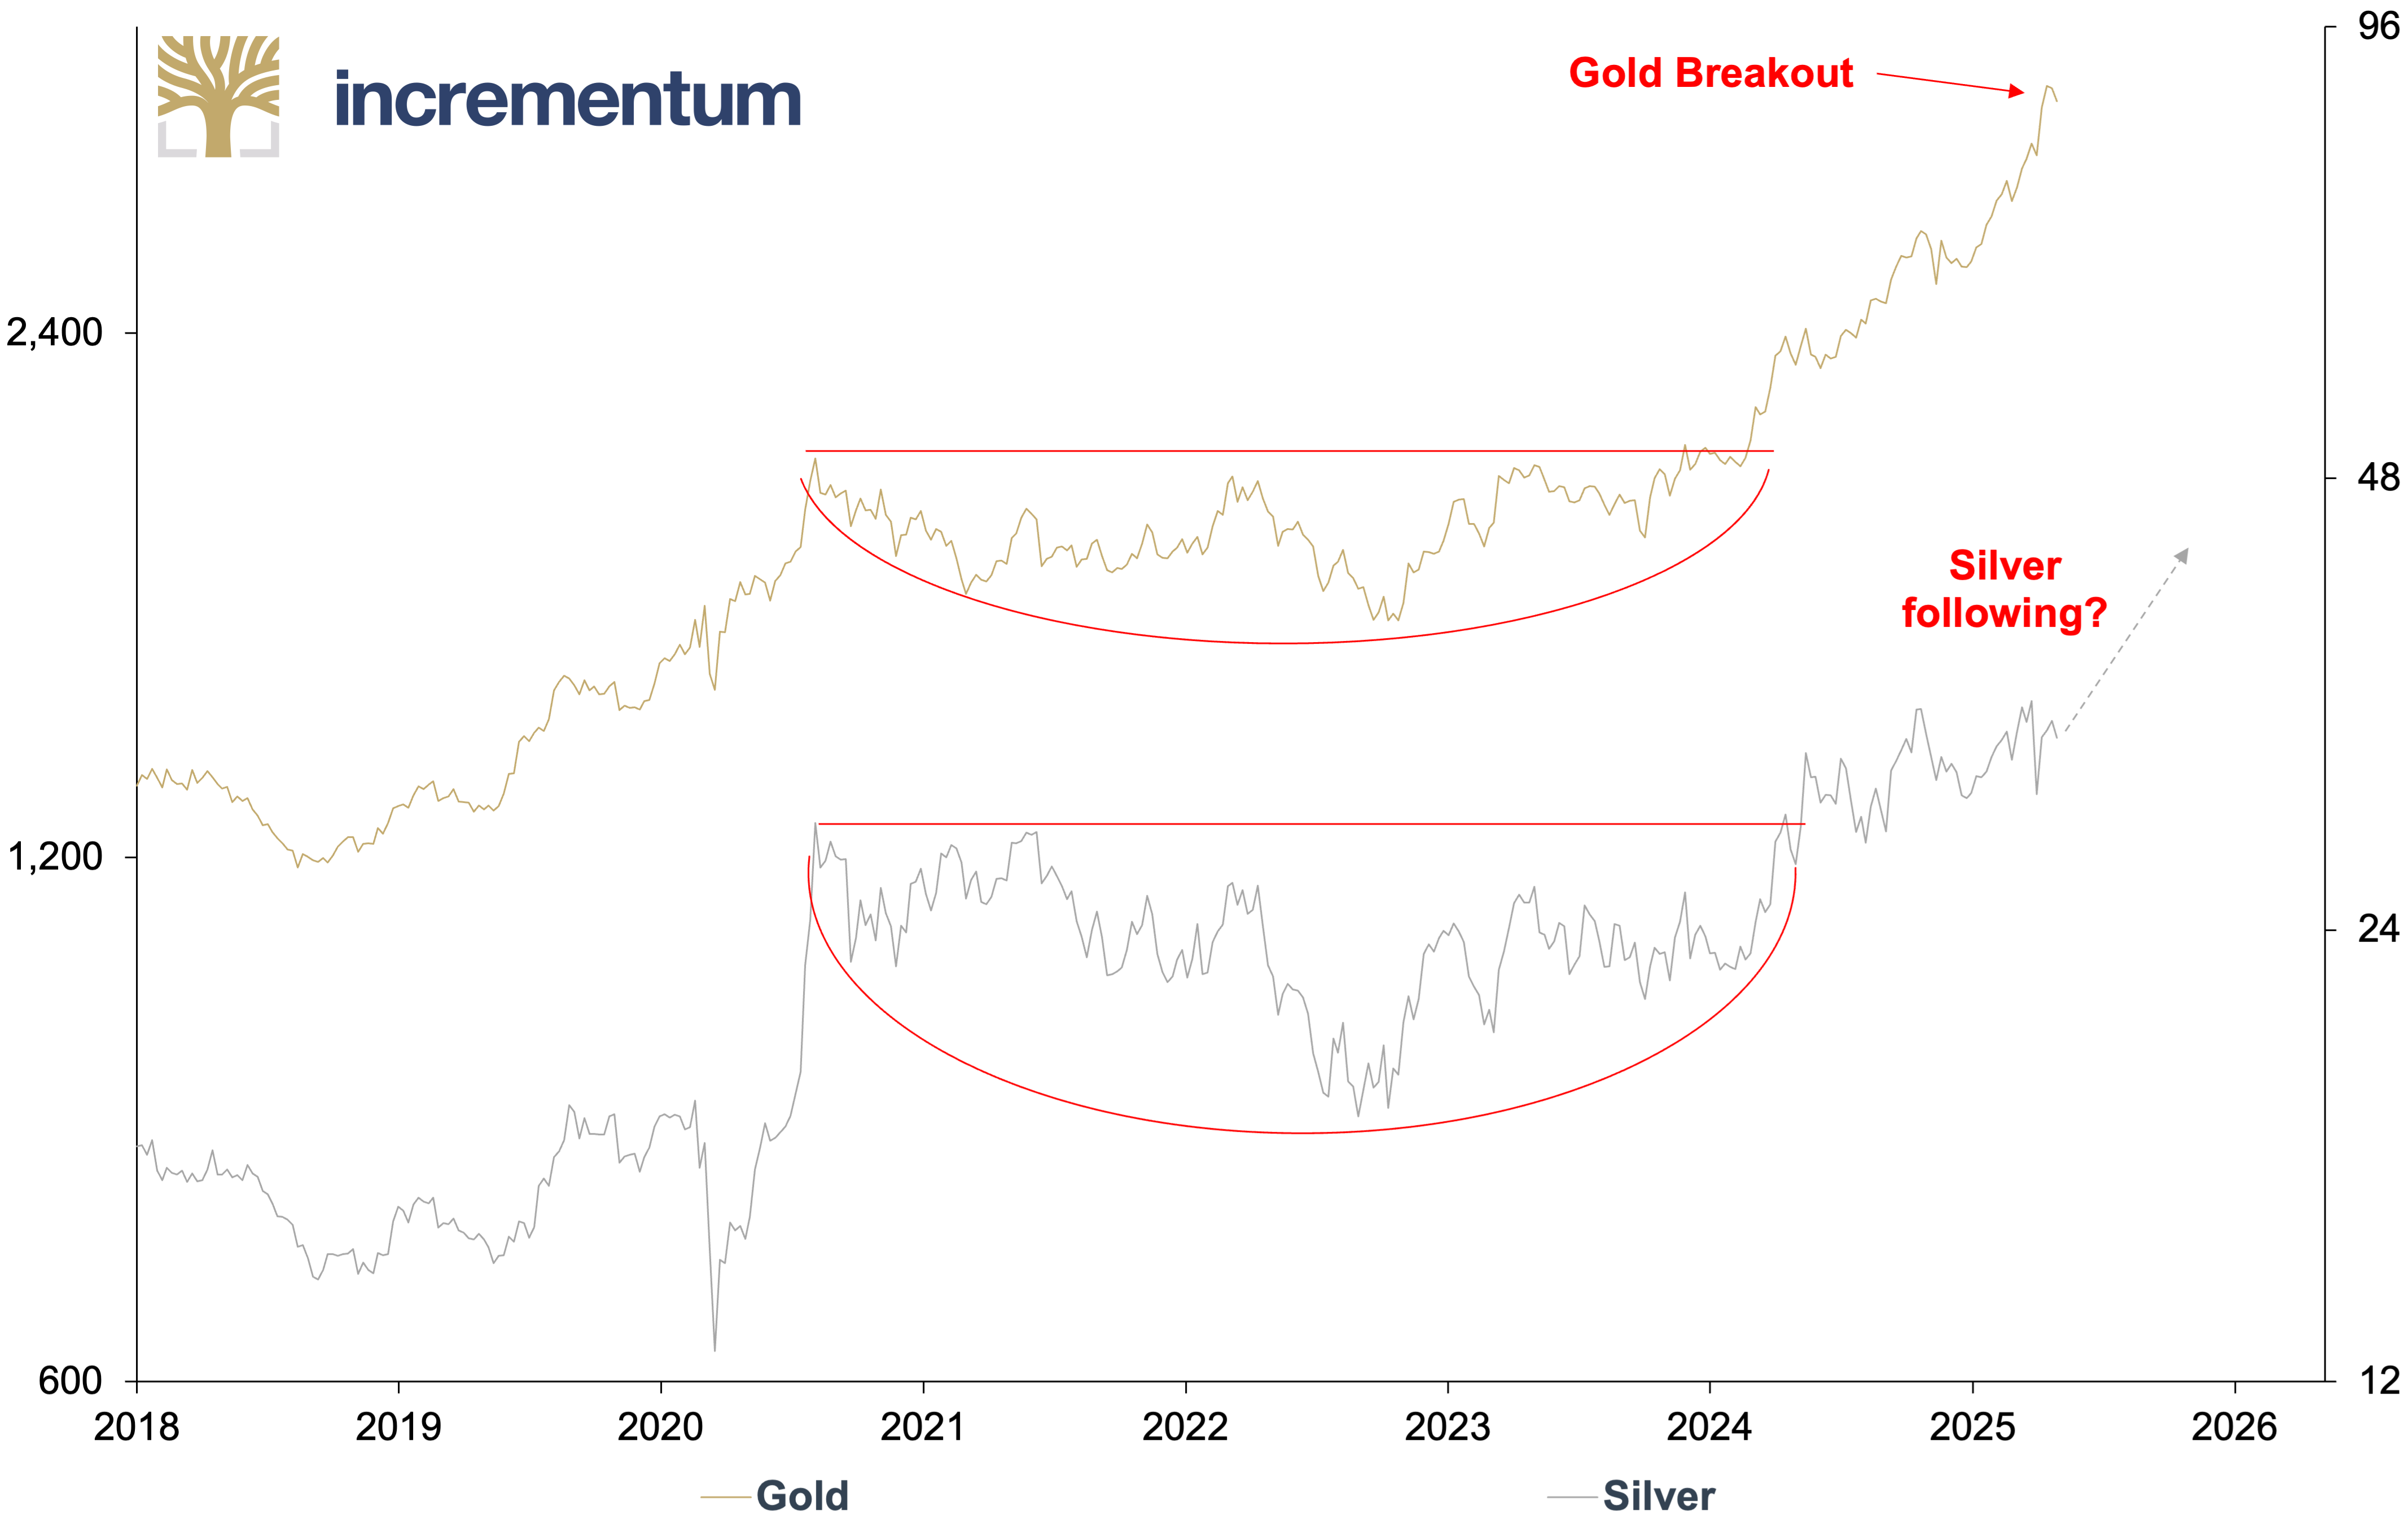
Source: LSEG, Incrementum AG
Investment demand could become the primary driver of silver’s price in 2025. The explosive growth of Indian ETP holdings – with 40% of private investment inflows and 70 Moz net investment – currently points to a change in market dynamics.
Mining shares
While the gold price has reached numerous new all-time highs in recent months, the HUI is currently trading around 40% below its all-time high of 635, set in September 2011. Despite a 27% increase in the gold price in calendar year 2024, the GDX and GDXJ only gained 10.1% and 14.9%, respectively. In the first four months of 2025, the performance was significantly more positive, at 42.5% (HUI), 44.5% (GDX), and 43.6% (GDXJ); however, the miners were still unable to fully emancipate themselves from the gold price. The often-postulated leverage of around 3:1 against the gold price has not even come close to being realized so far.
Gold and HUI, 100 = 01/2000, 01/2000–04/2025
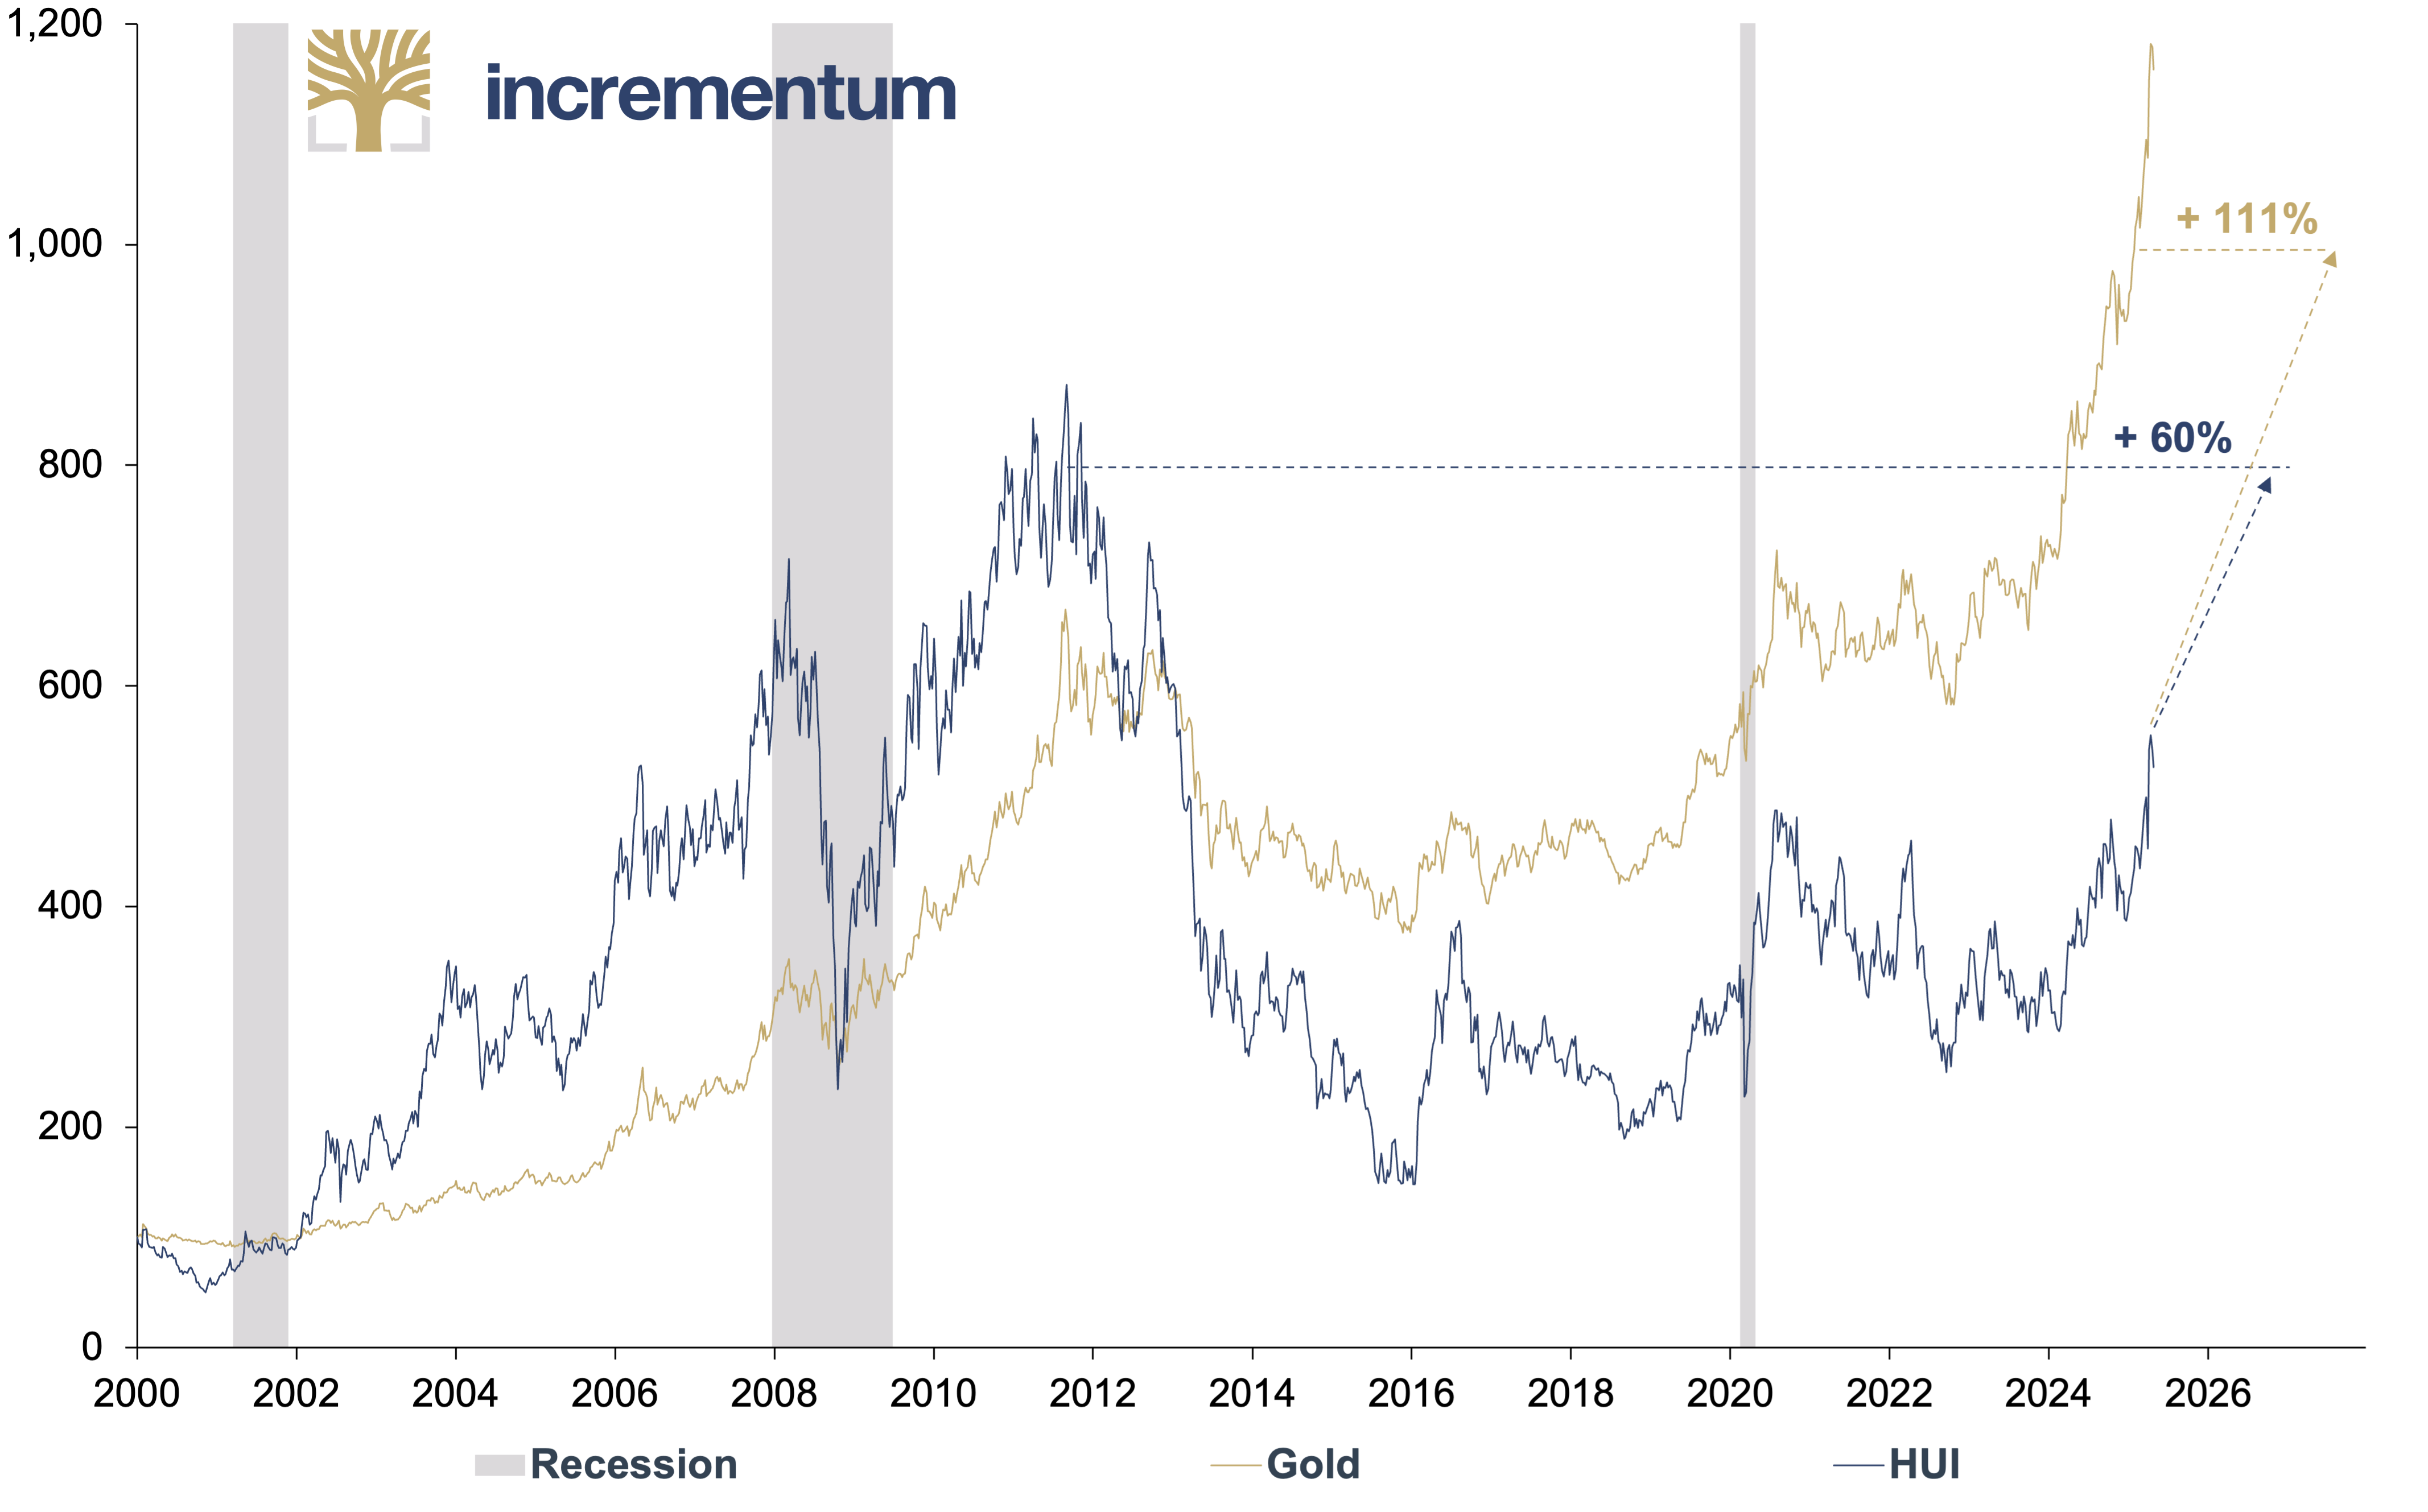
Source: LSEG, Incrementum AG
A look at the market share of mining ETFs in the overall ETF market shows that the party hasn’t started yet. Gold mining ETFs currently account for just 0.27% of all assets invested in ETFs. At its peak in 2011, the share was 1.4% and therefore 5 times as high.
Market Share of Gold Miner ETFs* (lhs), and Gold/S&P 500 Ratio (rhs), 01/2006–04/2025
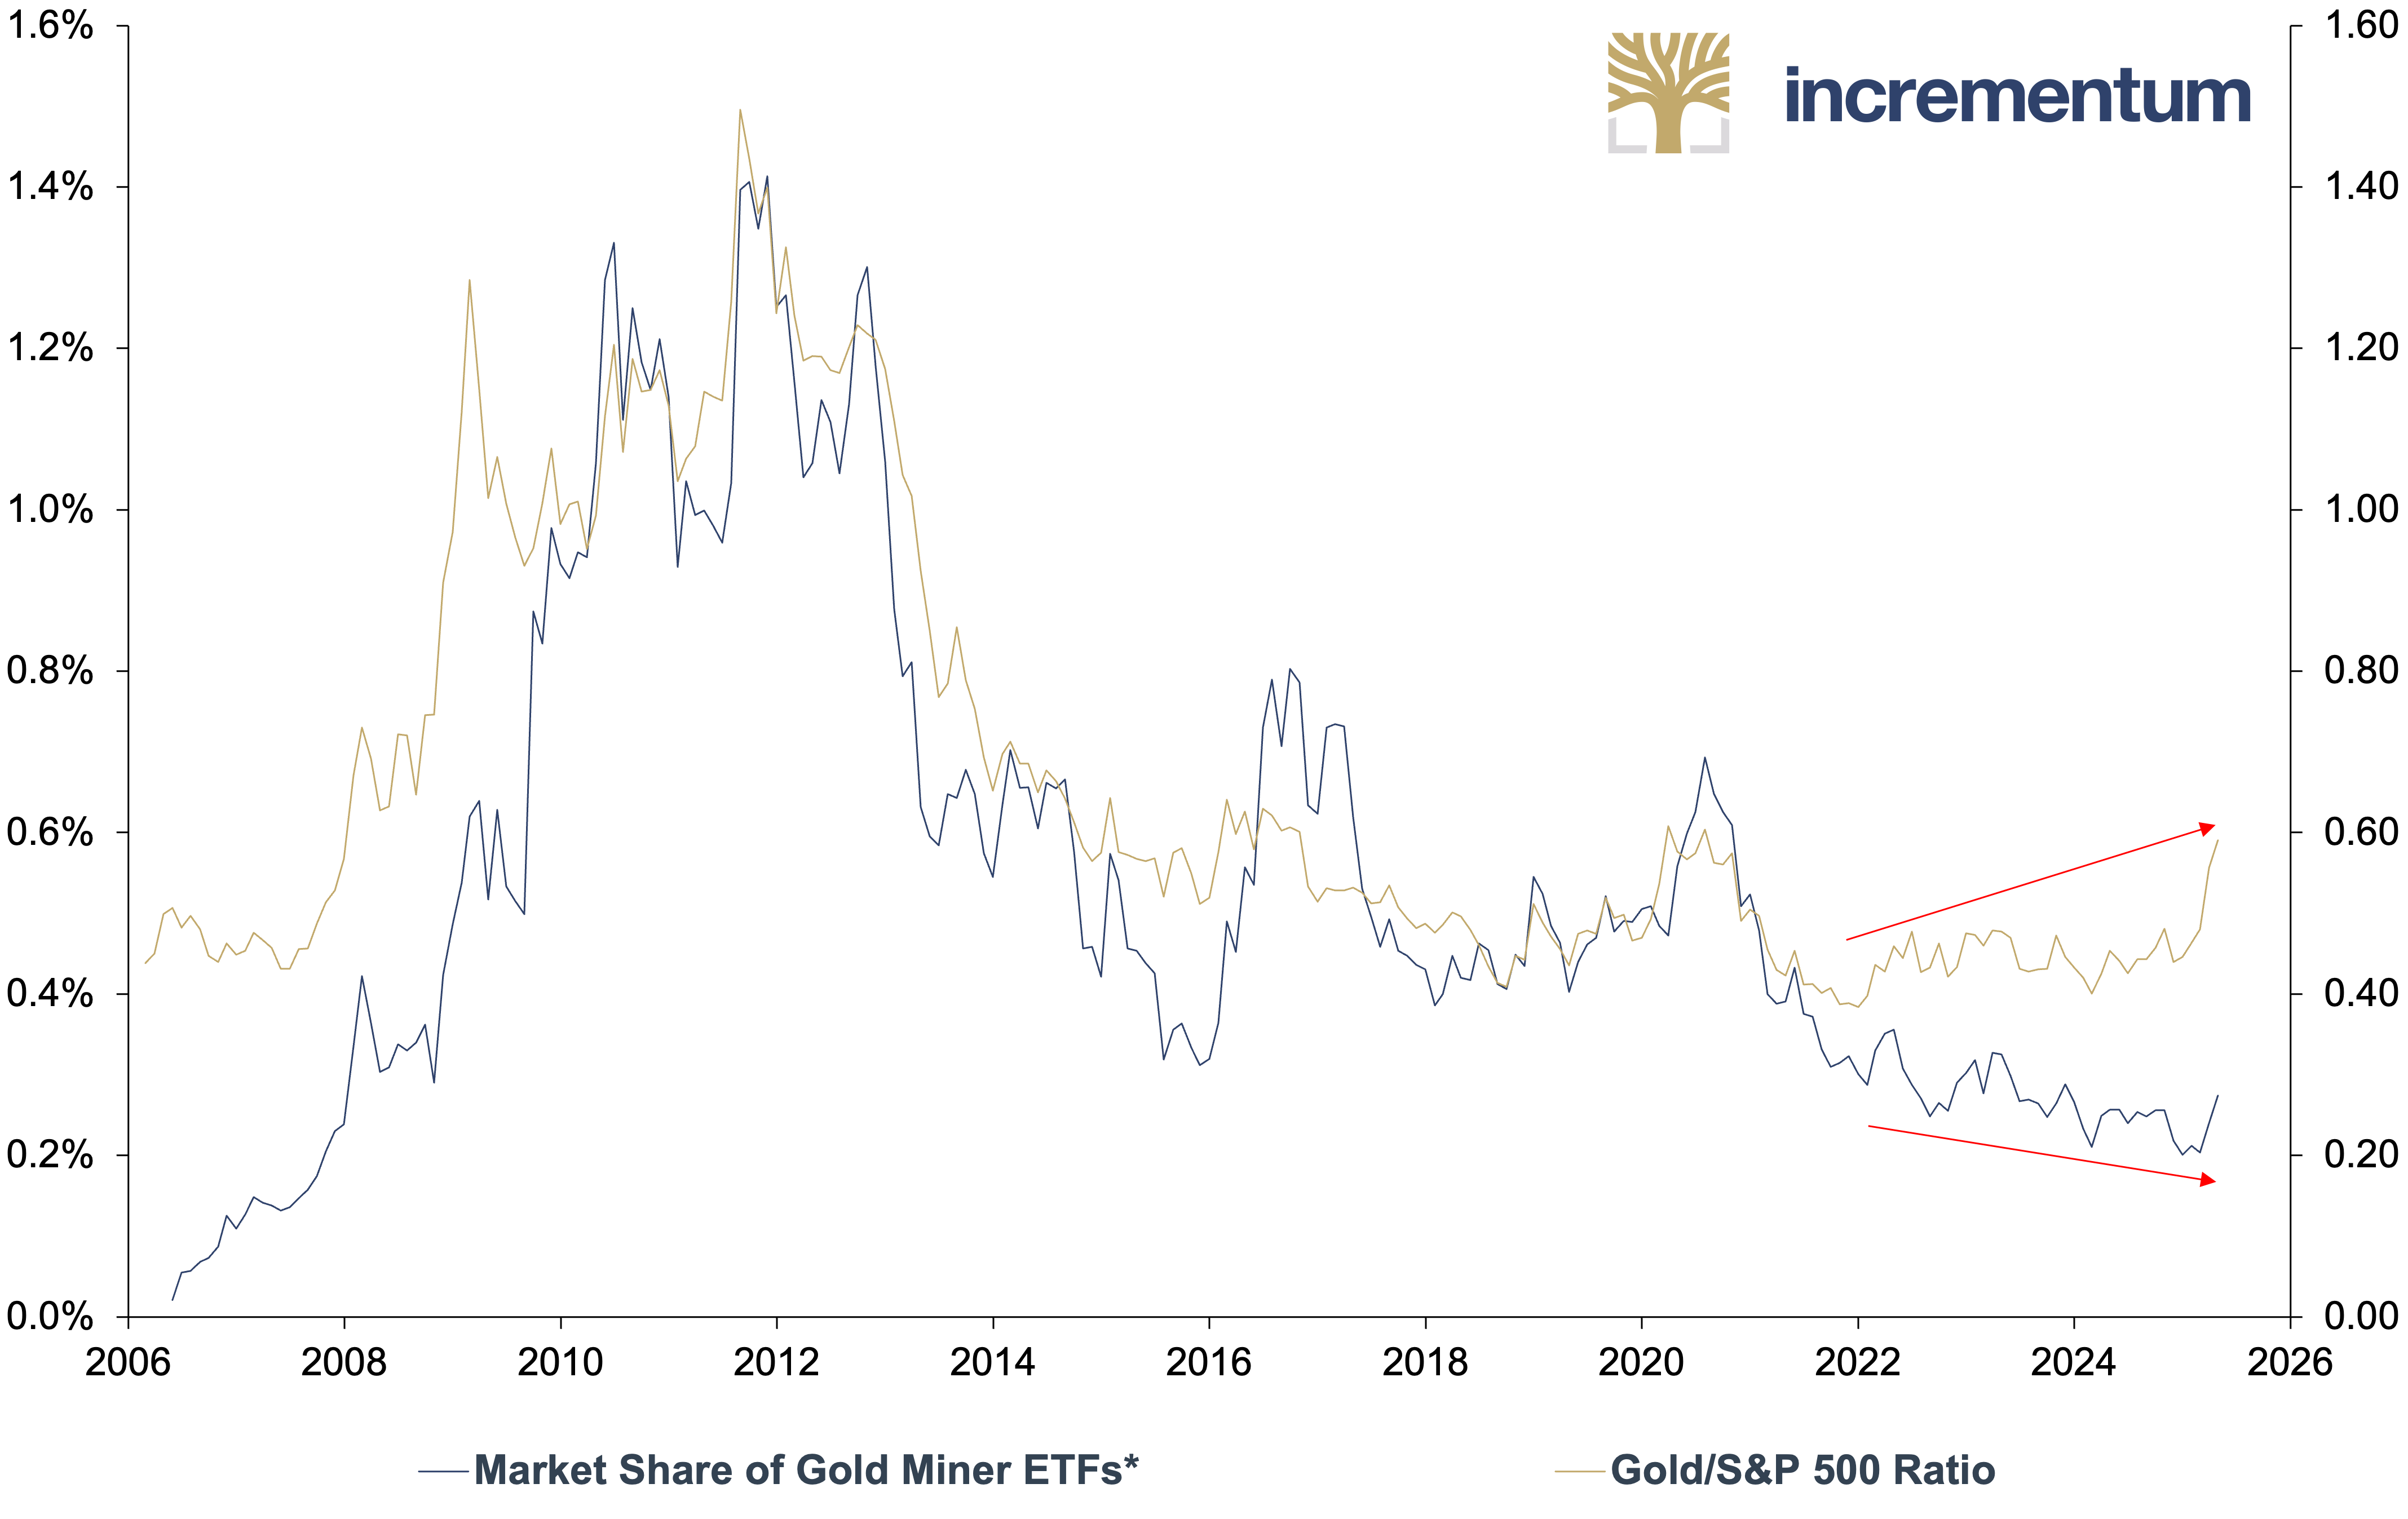
Source: LSEG, Incrementum AG
*Gold Miner ETFs AUM/All Equity ETFs AUM
While the GDX has already surpassed its 2020 high, ETF investors are exercising restraint. At around USD 15bn, the GDX’s current assets under management are USD 4bn below the 2020 level. This discrepancy between price performance and capital inflows suggests that a significant share of ETF investors remains on the sidelines.
GDX Price (lhs), in USD, and GDX AUM (rhs), in USD bn, 01/2020–04/2025
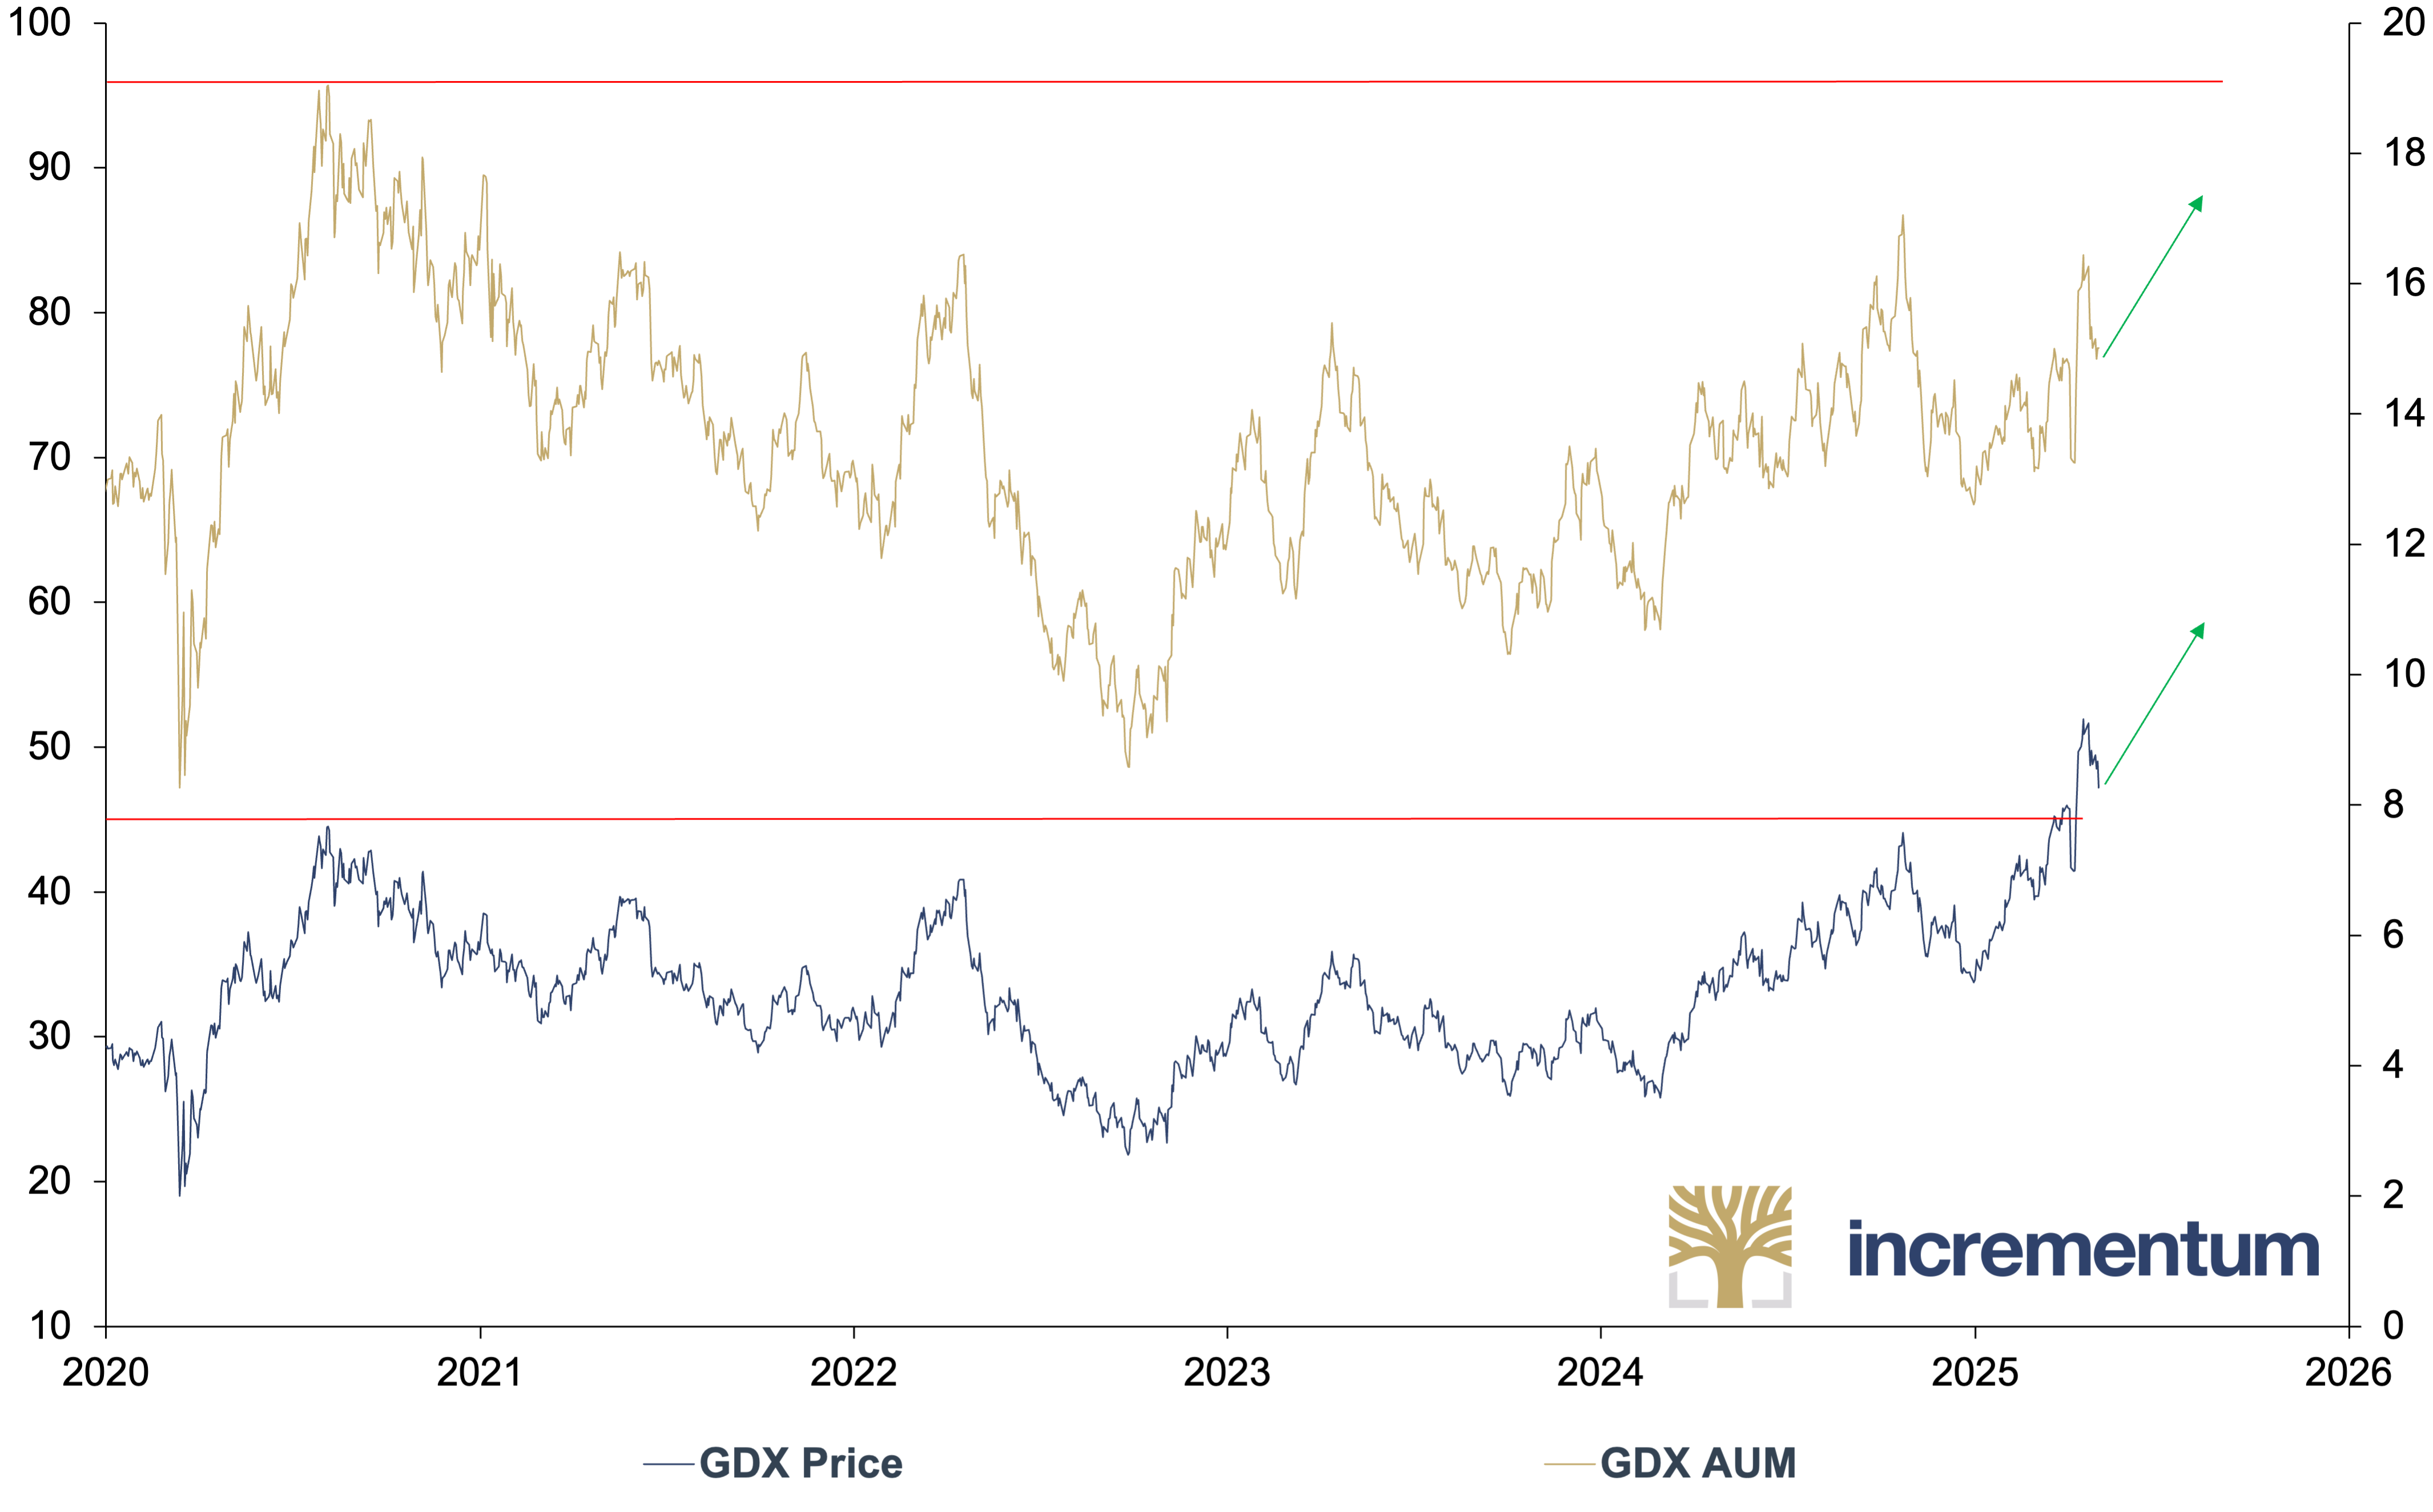
Source: LSEG, Incrementum AG
The negative reputation of the past cycle still clings to the sector – wrongly, in our opinion.[7] This is because many companies are now acting much more conservatively and are increasingly focusing on cash flow and margin optimization, which significantly increases their resilience to falling gold prices. The fall in the oil price is also proving to be an additional tailwind on the cost side. Both the absolute and relative undervaluation are remarkable.
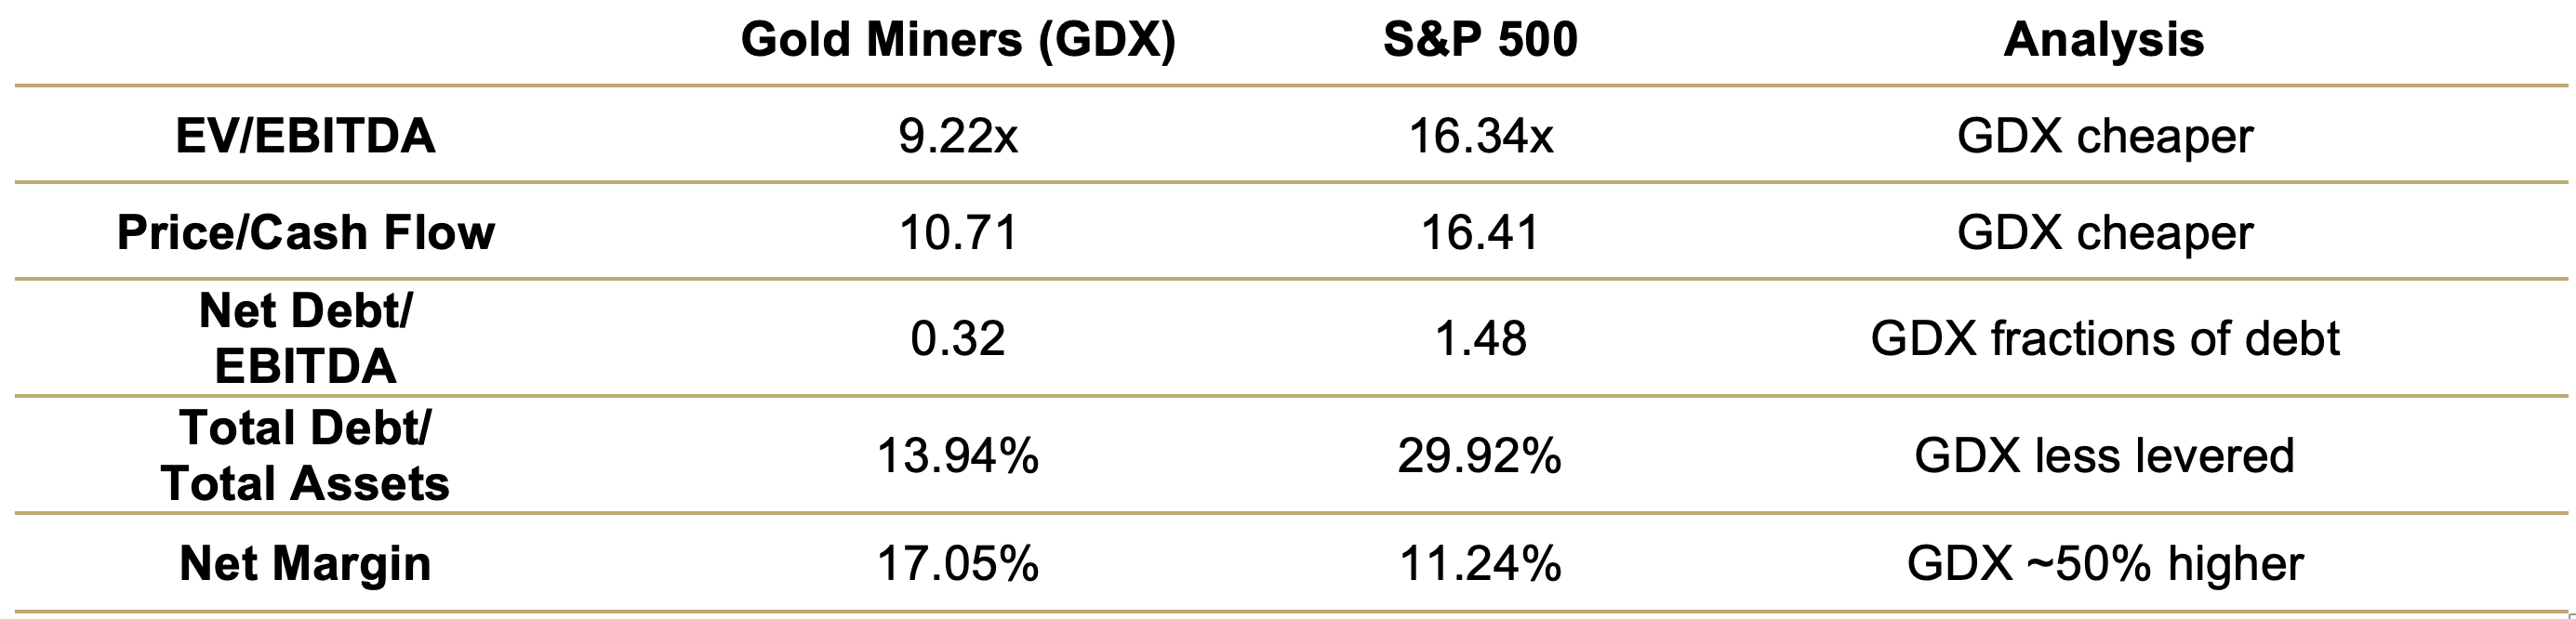
Source: Factset, Incrementum AG
Nevertheless, the inflow of funds for new projects remains insufficient. In order to close production gaps, the current M&A wave in the mining sector is gaining momentum. Recent deals such as MAG Silver/Pan American, Lundin/Filo, Gold Fields/Osisko, and Equinox/Calibre show that, so far, acquisitions have focused on mid-cap companies. However, the real game changer is yet to come – the next phase will be mega acquisitions of large caps financed by record-high margins and free cash flows, driven by acute reserve replacement requirements (42 Moz annually) and declining deposit quality. Falling interest rates will benefit the sector in two ways: through lower capital costs for the capital-intensive industry and the increasing attractiveness of gold mining dividends.
Within the gold sector, there is not only a divergence between gold and mining stocks but also between large- and small-cap companies. This is primarily an expression of the cautious risk appetite. If the sustained upward trend in the gold price draws more attention to the valuation and performance potential in the mining sector, this could usher in a new phase of relative strength as part of a risk-on move, especially in the small- and mid-cap segment. In such a scenario, the gap that has existed between large and small caps since 2010/2011 is likely to close.
GDX/GLD and GDX/GDXJ, 100 = 01/2010, 01/2010–04/2025
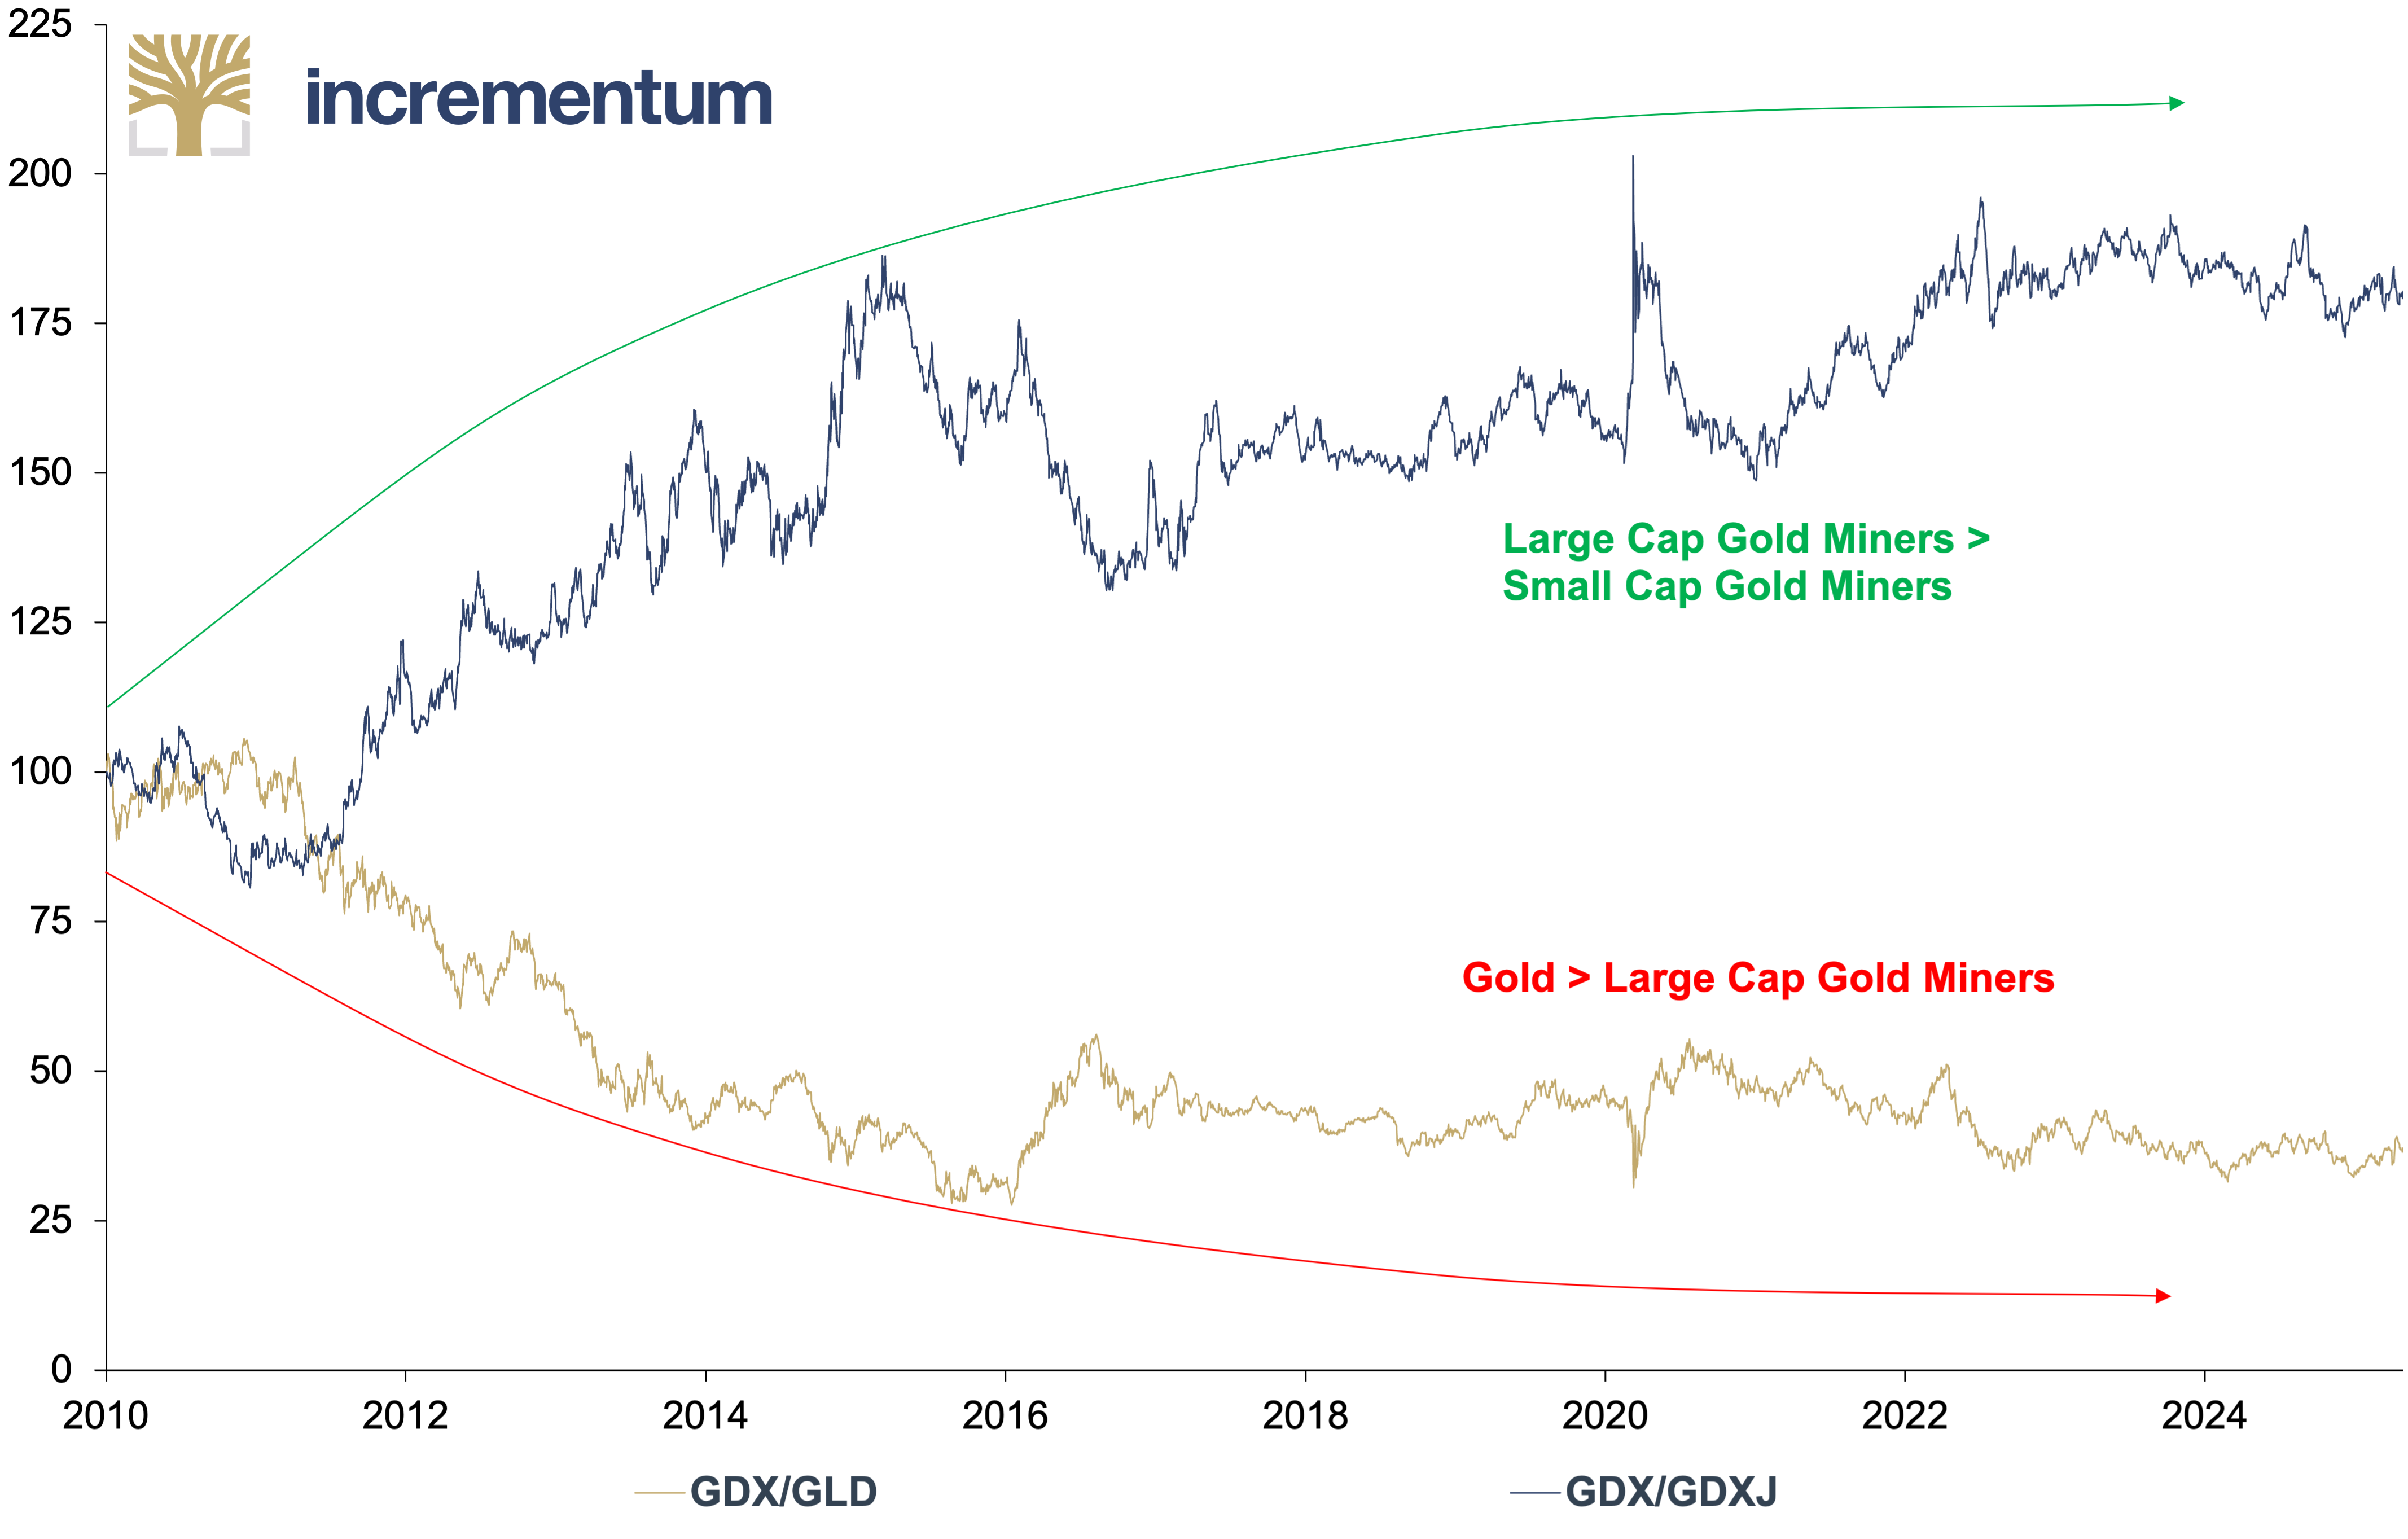
Source: LSEG, Incrementum AG
Commodities
The commodity cycle is currently experiencing an exhausting pause. The recent discrepancy between the price of gold and oil is particularly striking. Most recently, the uncertainty surrounding the US’s new tariff policy has had a particularly negative impact on commodity prices. Historically speaking, phases of decoupling between gold and oil prices are quite normal, but commodity supercycles are largely synchronized, even if the respective turning points are sometimes shifted in time. This can be illustrated by comparing the relative performance of gold and oil against the S&P 500.
WTI/S&P 500 Ratio (lhs, log), and Gold/S&P 500 Ratio (rhs, log), 01/1950–04/2025
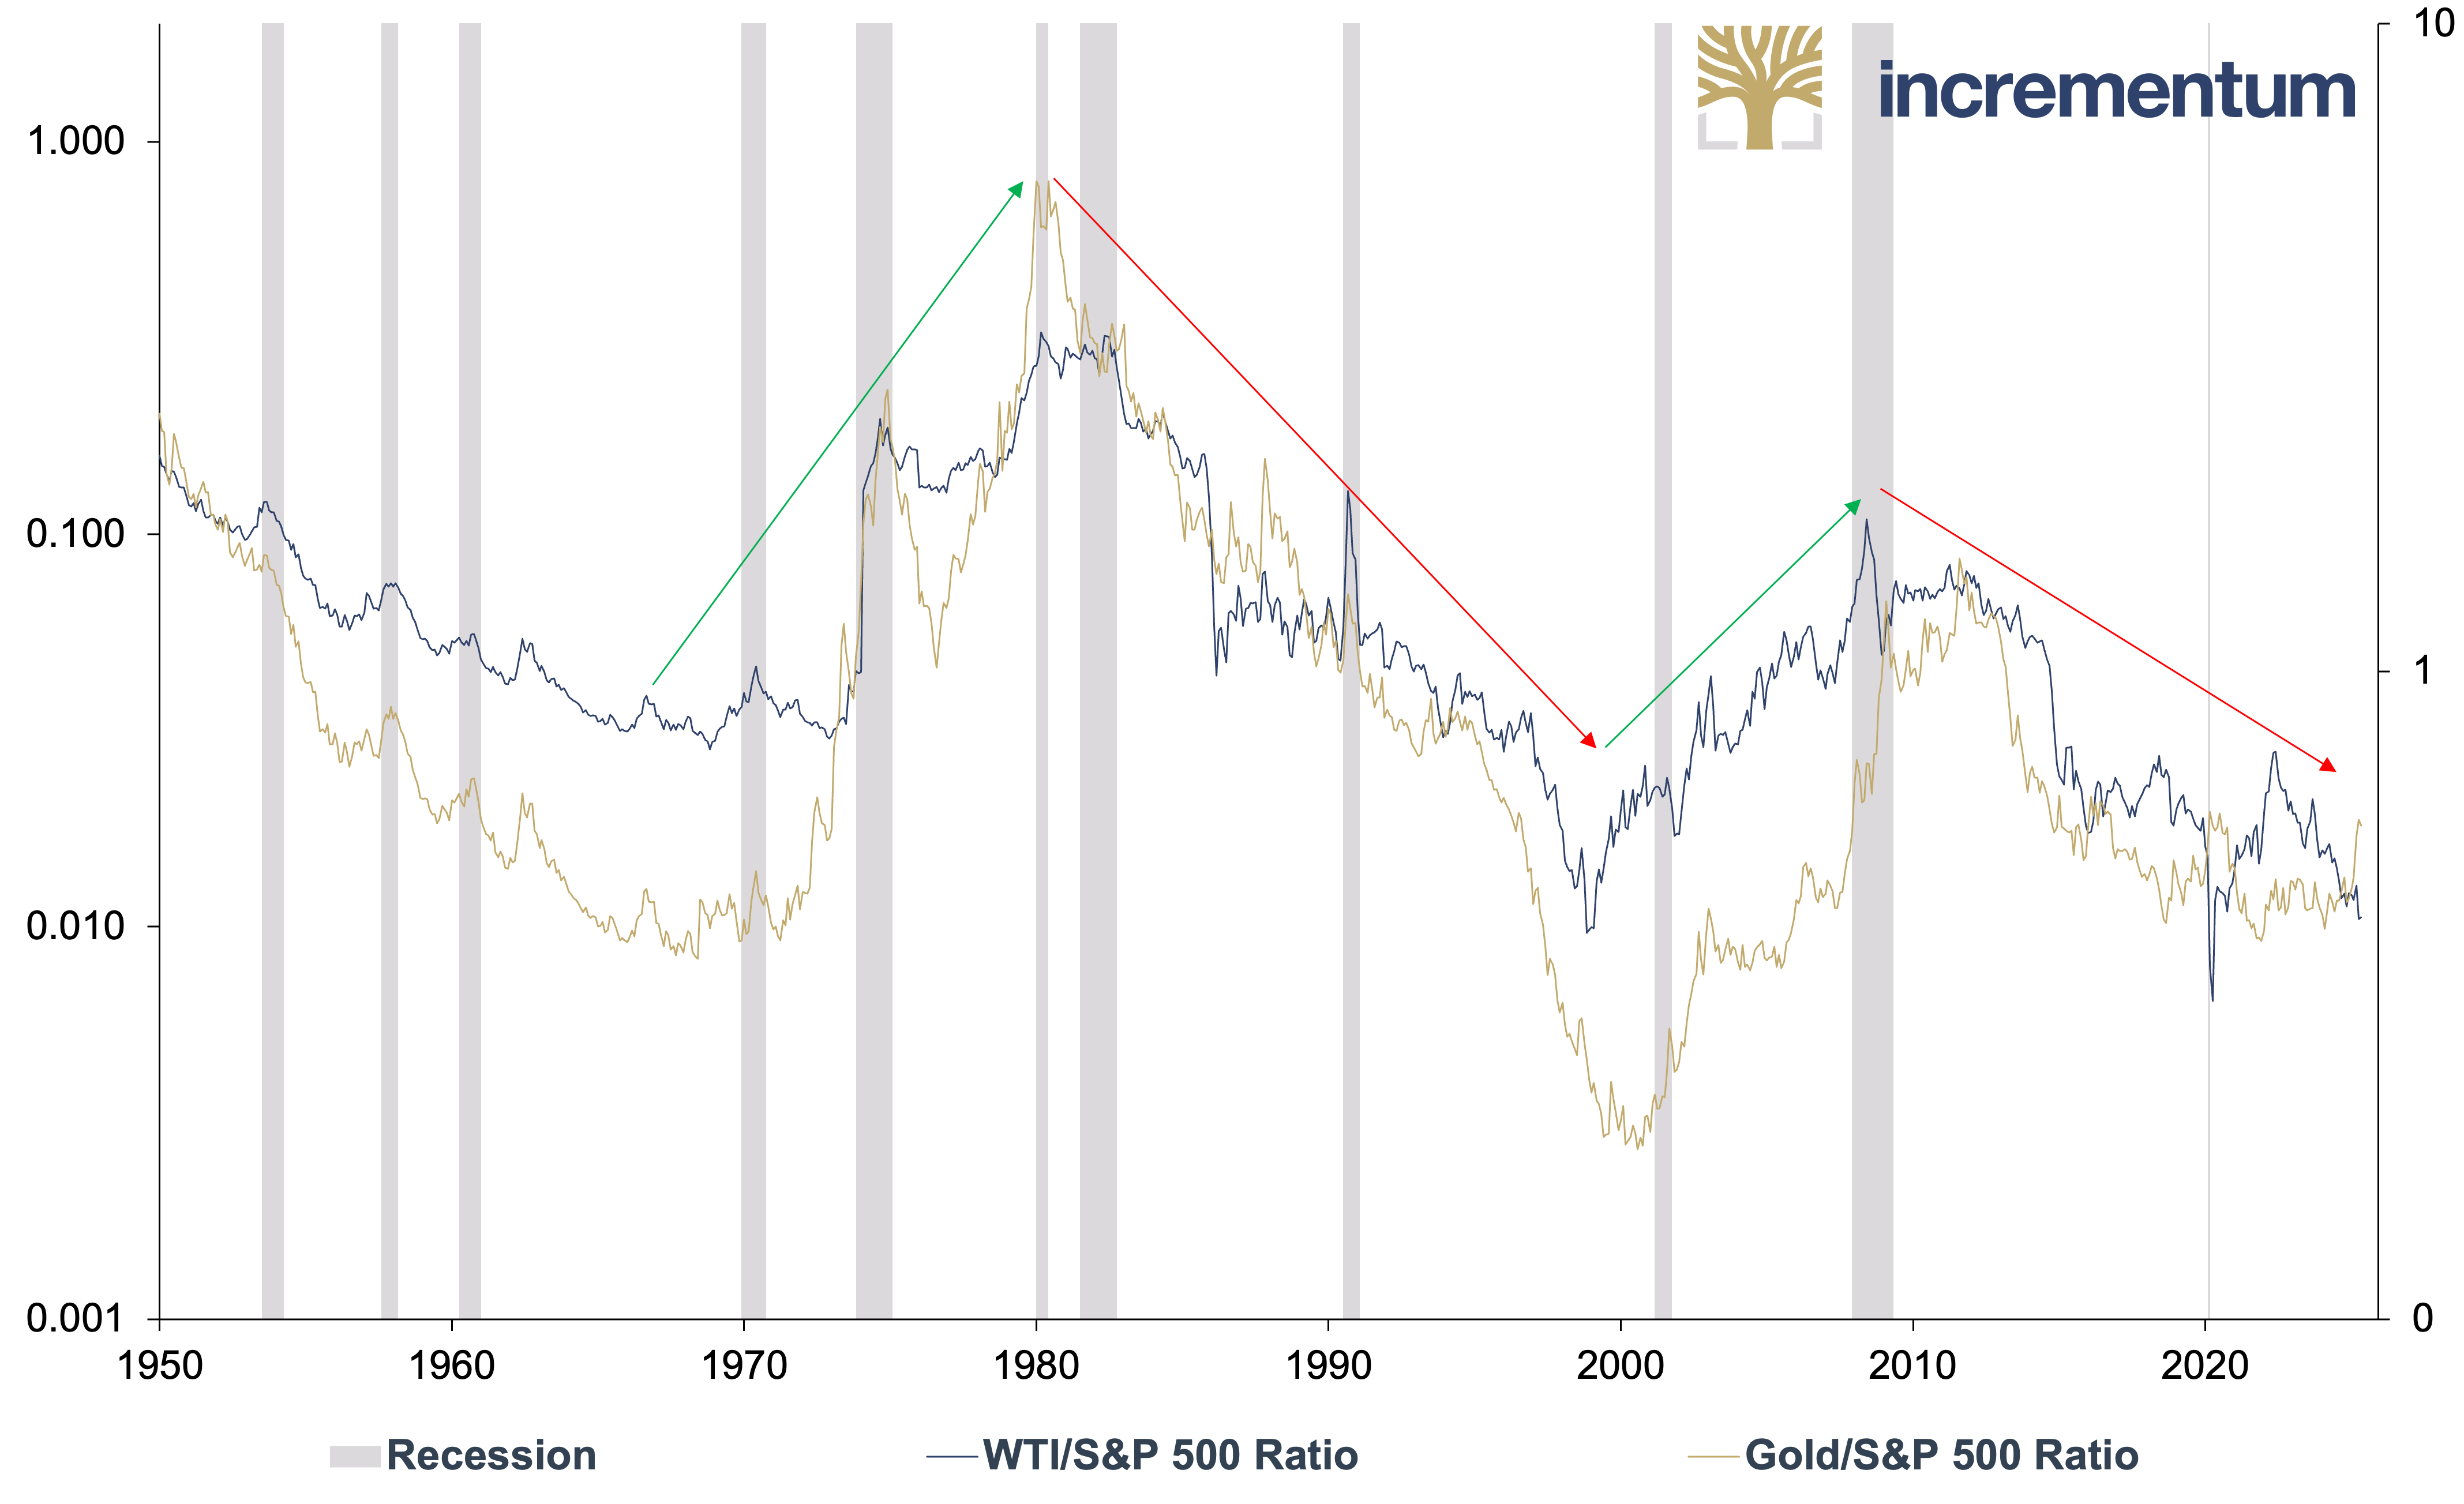
Source: Nick Laird, LSEG, Incrementum AG
In the medium term, the commodities market will reflect the new geopolitical realities: As the US reduces its global leadership role, Europe, China, and the rest of the world are expanding their defense and energy infrastructure, driving demand for strategic commodities. In a world where geopolitical certainties are crumbling, both nations and companies will be forced to hoard strategic resources.
China is accelerating this development through targeted decoupling: The US export share fell from 19.2% (2018) to 14.7% (2024), while Beijing controls 60% of global production and 90% of rare earth processing, for example. This dominance is further cemented by targeted export restrictions, especially for exports to the US, and creates a structural supply risk. Raw materials have long since become an instrument of geo-economic power, both as a weapon and as an insurance policy. If you want to invest successfully in this environment, you need to comprehend the new power structures and the political function of certain commodities.
However, there are also potential bullish triggers in the short term: An easing of monetary policy could herald the next upturn – accompanied by a weaker US dollar and expansive fiscal and monetary policy stimuli from China. In addition, growing demand from the defense industry and green transformation investments are reinforcing this trend.
US Commodity Price Index, 10-year rolling CAGR, 01/1815–04/2025
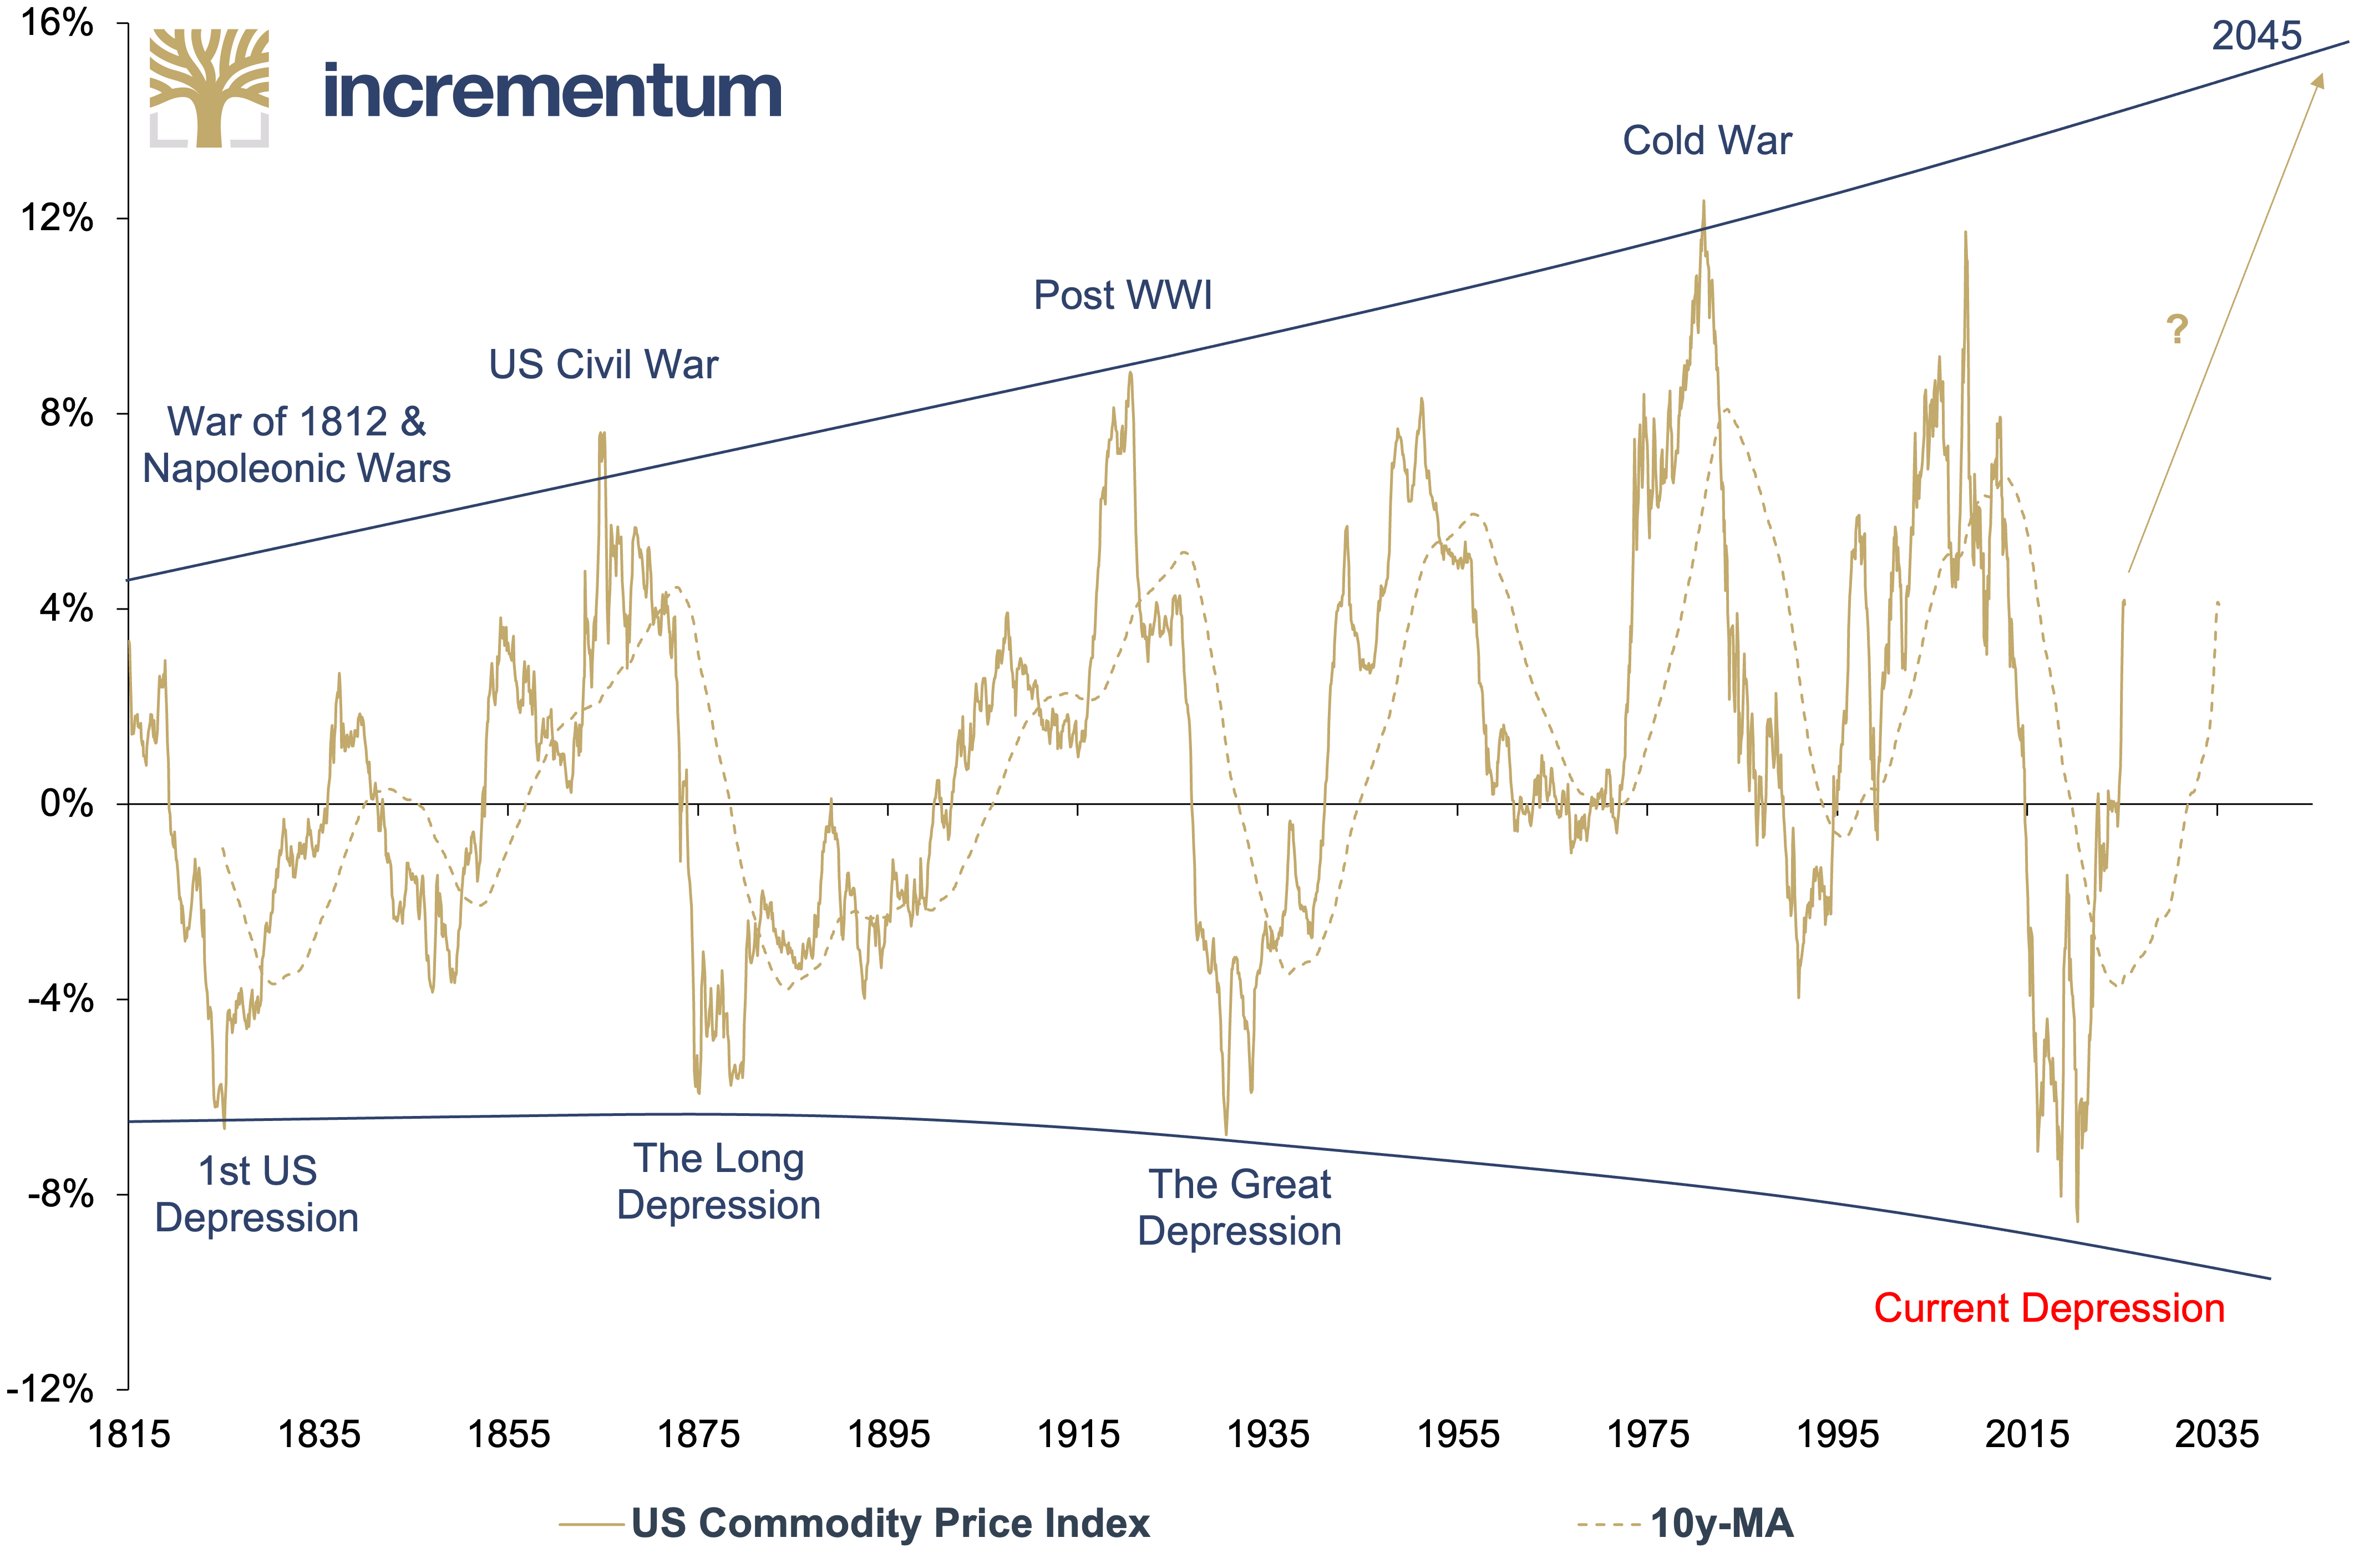
Source: Stifel Report, LSEG, Incrementum AG
Bitcoin
Could Bitcoin also emerge as a winner from the current re-sorting of the world (dis)order? Against growing geopolitical tensions, the advantages of a decentralized cryptocurrency like Bitcoin seem obvious. Thanks to its independence from state control and its cross-border transaction capability, Bitcoin would indeed offer an alternative to traditional currencies. With the passing of the law to introduce a strategic Bitcoin reserve, the US has also entered the race for digital gold at the state level.[8]
However, there is still a long way to go before gold is replaced by Bitcoin. The market capitalization of all mined gold as of 30 April is approximately USD 23trn – 217,465 t at a price of USD 3,288 per ounce. At a price of just under USD 94,200 per Bitcoin at the end of April, the market capitalization of Bitcoin stands at around USD 1.9trn. This corresponds to around 8% of the market capitalization of gold. In line with our gold price forecast with a time horizon until the end of 2030, it is conceivable that Bitcoin could reach a market capitalization of 50% relative to gold by then. If we now assume our conservative gold price target of around USD 4,800, the Bitcoin price would have to rise to around USD 900,000 in order to reach 50% of gold’s market capitalization. This may be ambitious throughout, but would ultimately be consistent with the historical performance of both assets.
Market Cap of Gold and Bitcoin (lhs), in USD bn, and Bitcoin/Gold Market Cap Ratio (rhs, log), 01/2013–12/2030*
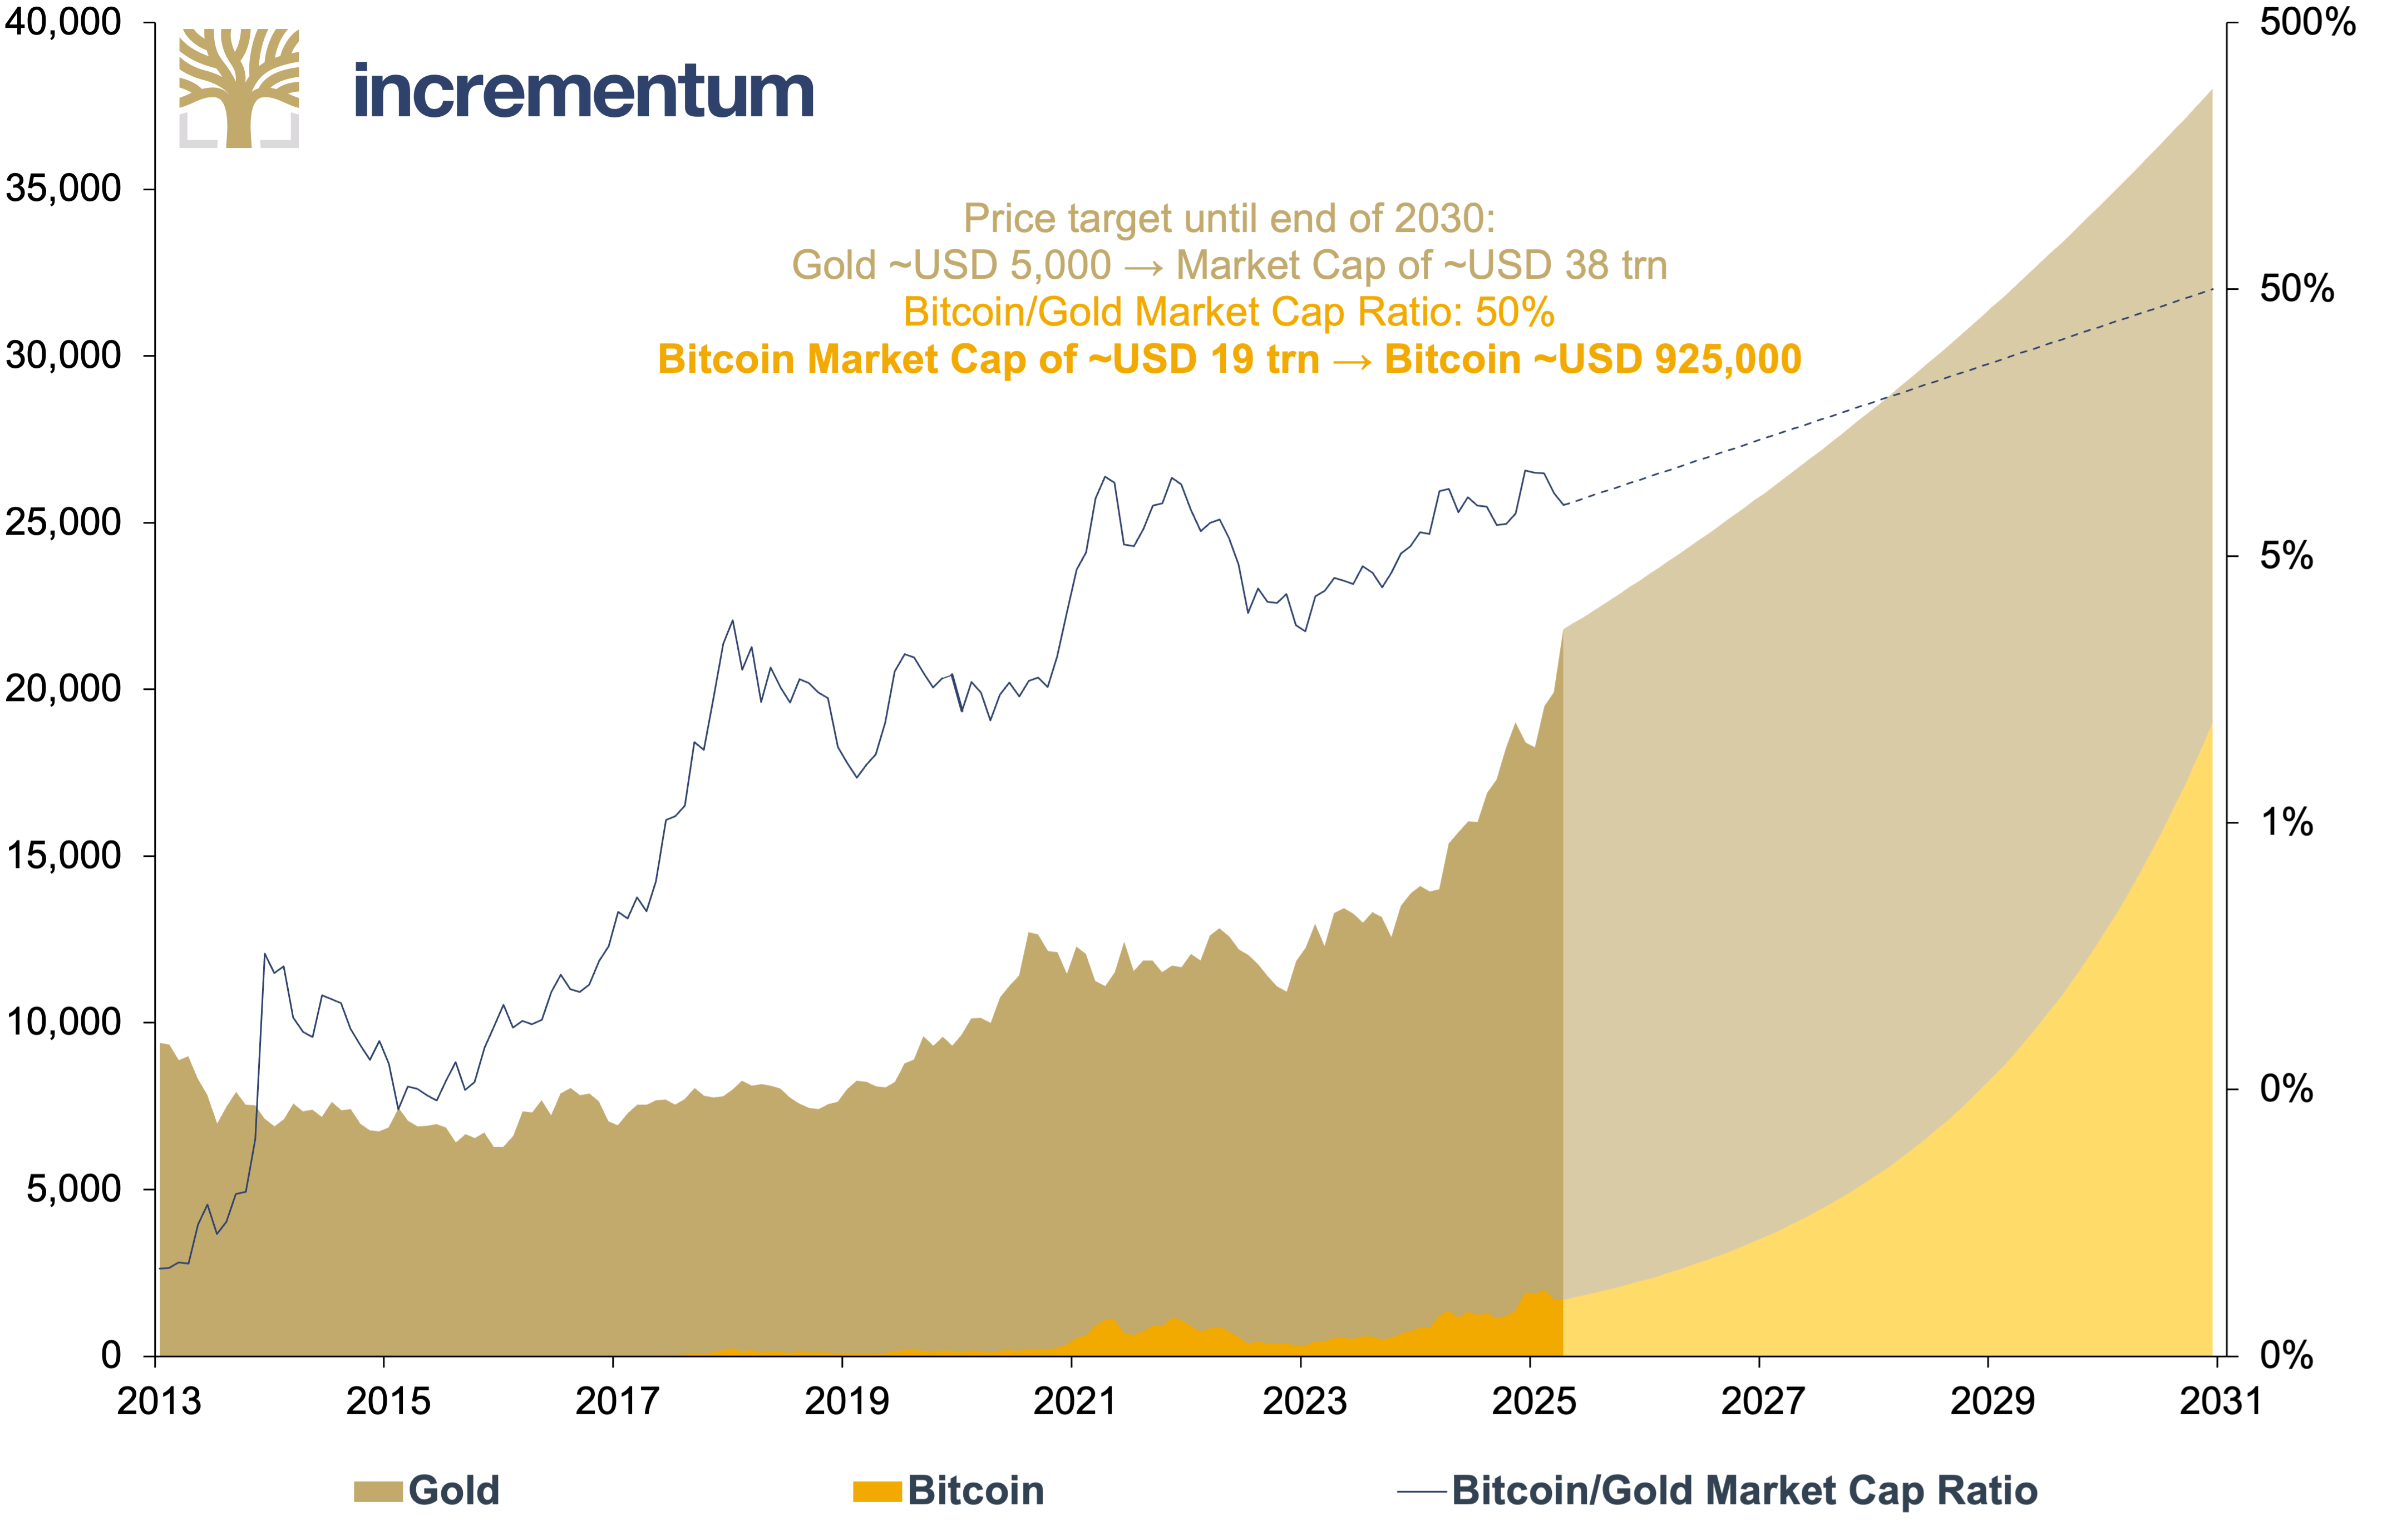
Source: LSEG, World Gold Council, coinmarketcap.com, Incrementum AG
*Based on the expected Bitcoin supply at end of 2030 and gold supply at end of 2030 assuming an annual supply growth of 1.5%.
The fact that gold has gained a competitor in the universe of noninflationary assets is not necessarily a disadvantage in itself. According to the motto “competition stimulates business”, it is likely that more and more investors will realize that a combined investment in gold and Bitcoin is superior to the respective individual investments on a risk-adjusted basis. Our credo for years has been: “Gold for stability, Bitcoin for convexity.” Even if the two asset classes are different, buying both assets is an active decision to turn your back on the fiat world.[9]
75% Gold / 25% Bitcoin*, and MSCI World Index, 1,000 = 02/2014, 02/2014–04/2025
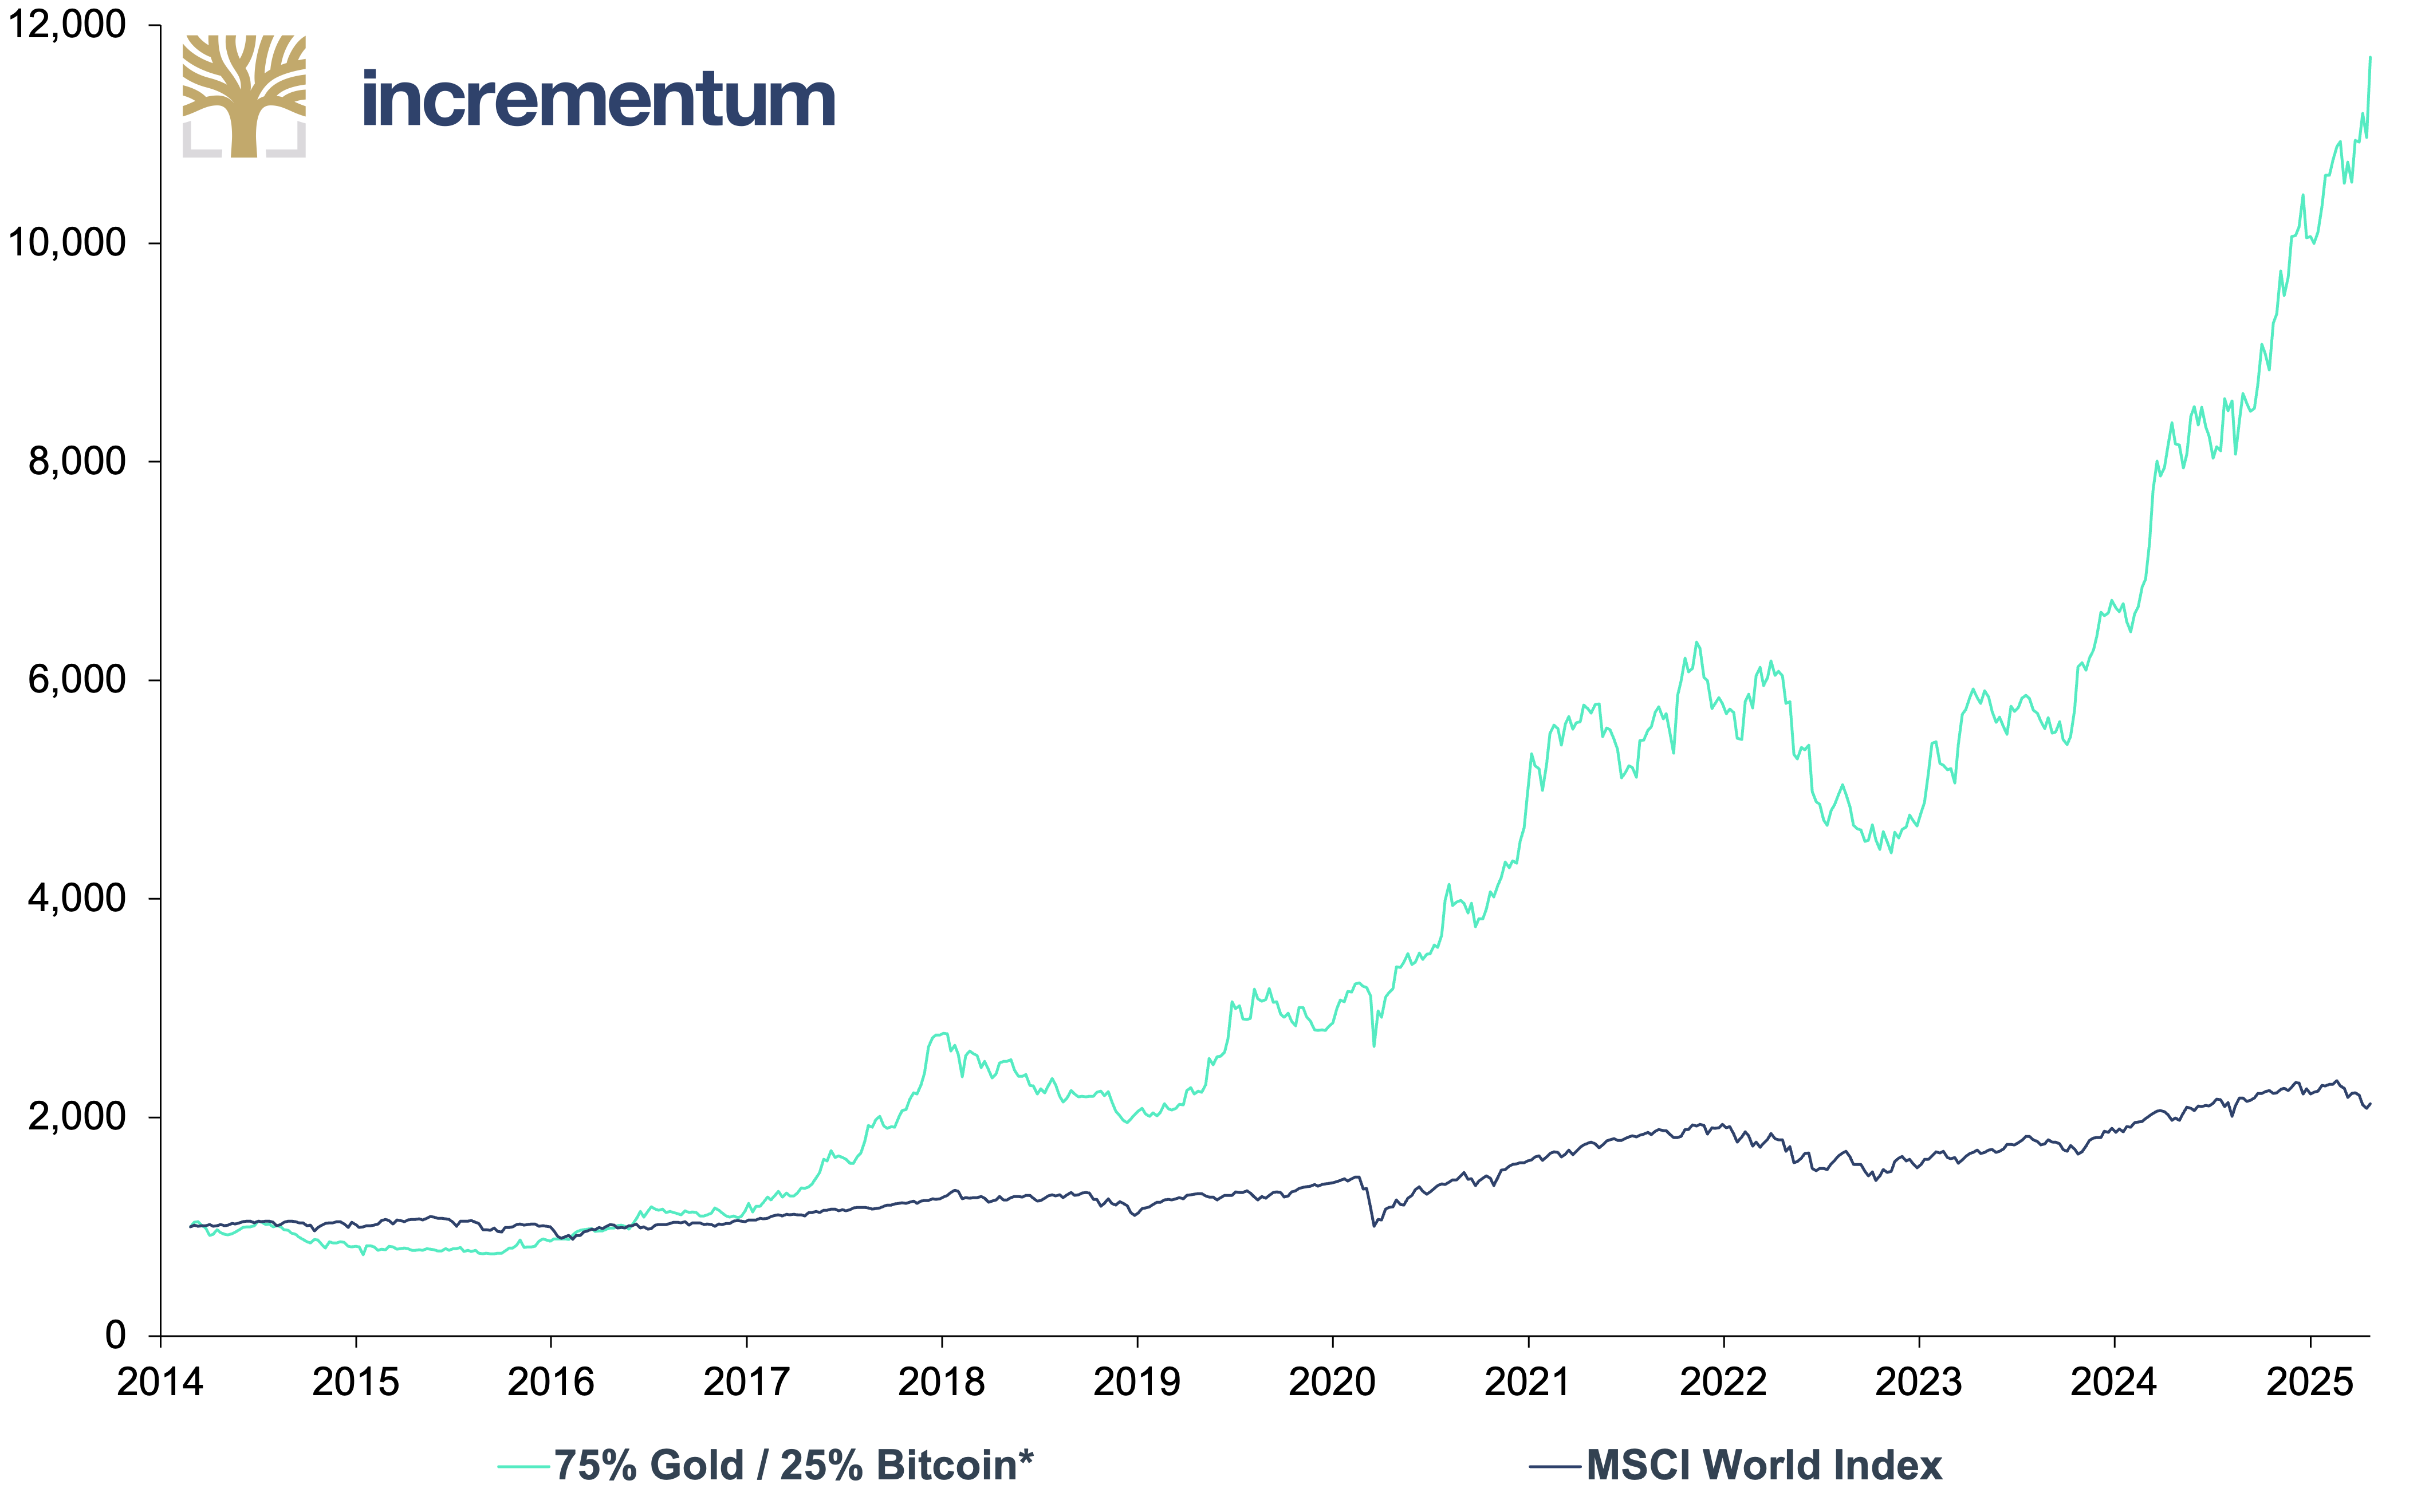
Source: LSEG, Incrementum AG
*Weekly Rebalancing
The Big Correction? – What Factors Point to a Correction in the Price of Gold?
Despite the intact long-term uptrend, a correction is likely, according to our analyses. The following factors suggest a temporary phase of weakness:
- Central banks as a key risk: An unexpected decline in central bank demand from the current average of 250 t per quarter could withdraw structural demand.
- Investor de-risking & position reduction: Broad sell-offs such as those in April, immediately following Liberation Day, show how quickly speculative positions are being reduced. Profit-taking by large investors cannot be ruled out either, especially if volatility on the US equity market decreases.
- Decline in the geopolitical premium: An agreement in the Ukraine war, a resolution of the situation in the Middle East, or a rapid end to the trade war, particularly with China, would significantly reduce the respective geopolitical premia and weaken the gold price.
- US economy stronger than expected: A robust US economy could prompt the Federal Reserve to tighten interest rates.
- High technical and sentiment-driven risks: Sentiment is bullish, and the positioning is extreme in some cases.
- Stronger US dollar: The US dollar is oversold in the short term and sentiment is extremely negative.
The short-term market situation is tense; a correction to ~USD 2,800 does not seem unrealistic. A temporary sideways market would also be conceivable as part of a price consolidation and would ultimately be healthy for the bull market. This would in no way jeopardize the medium to long-term Big Long case for gold.
Gold, in USD, 01/2023–04/2025
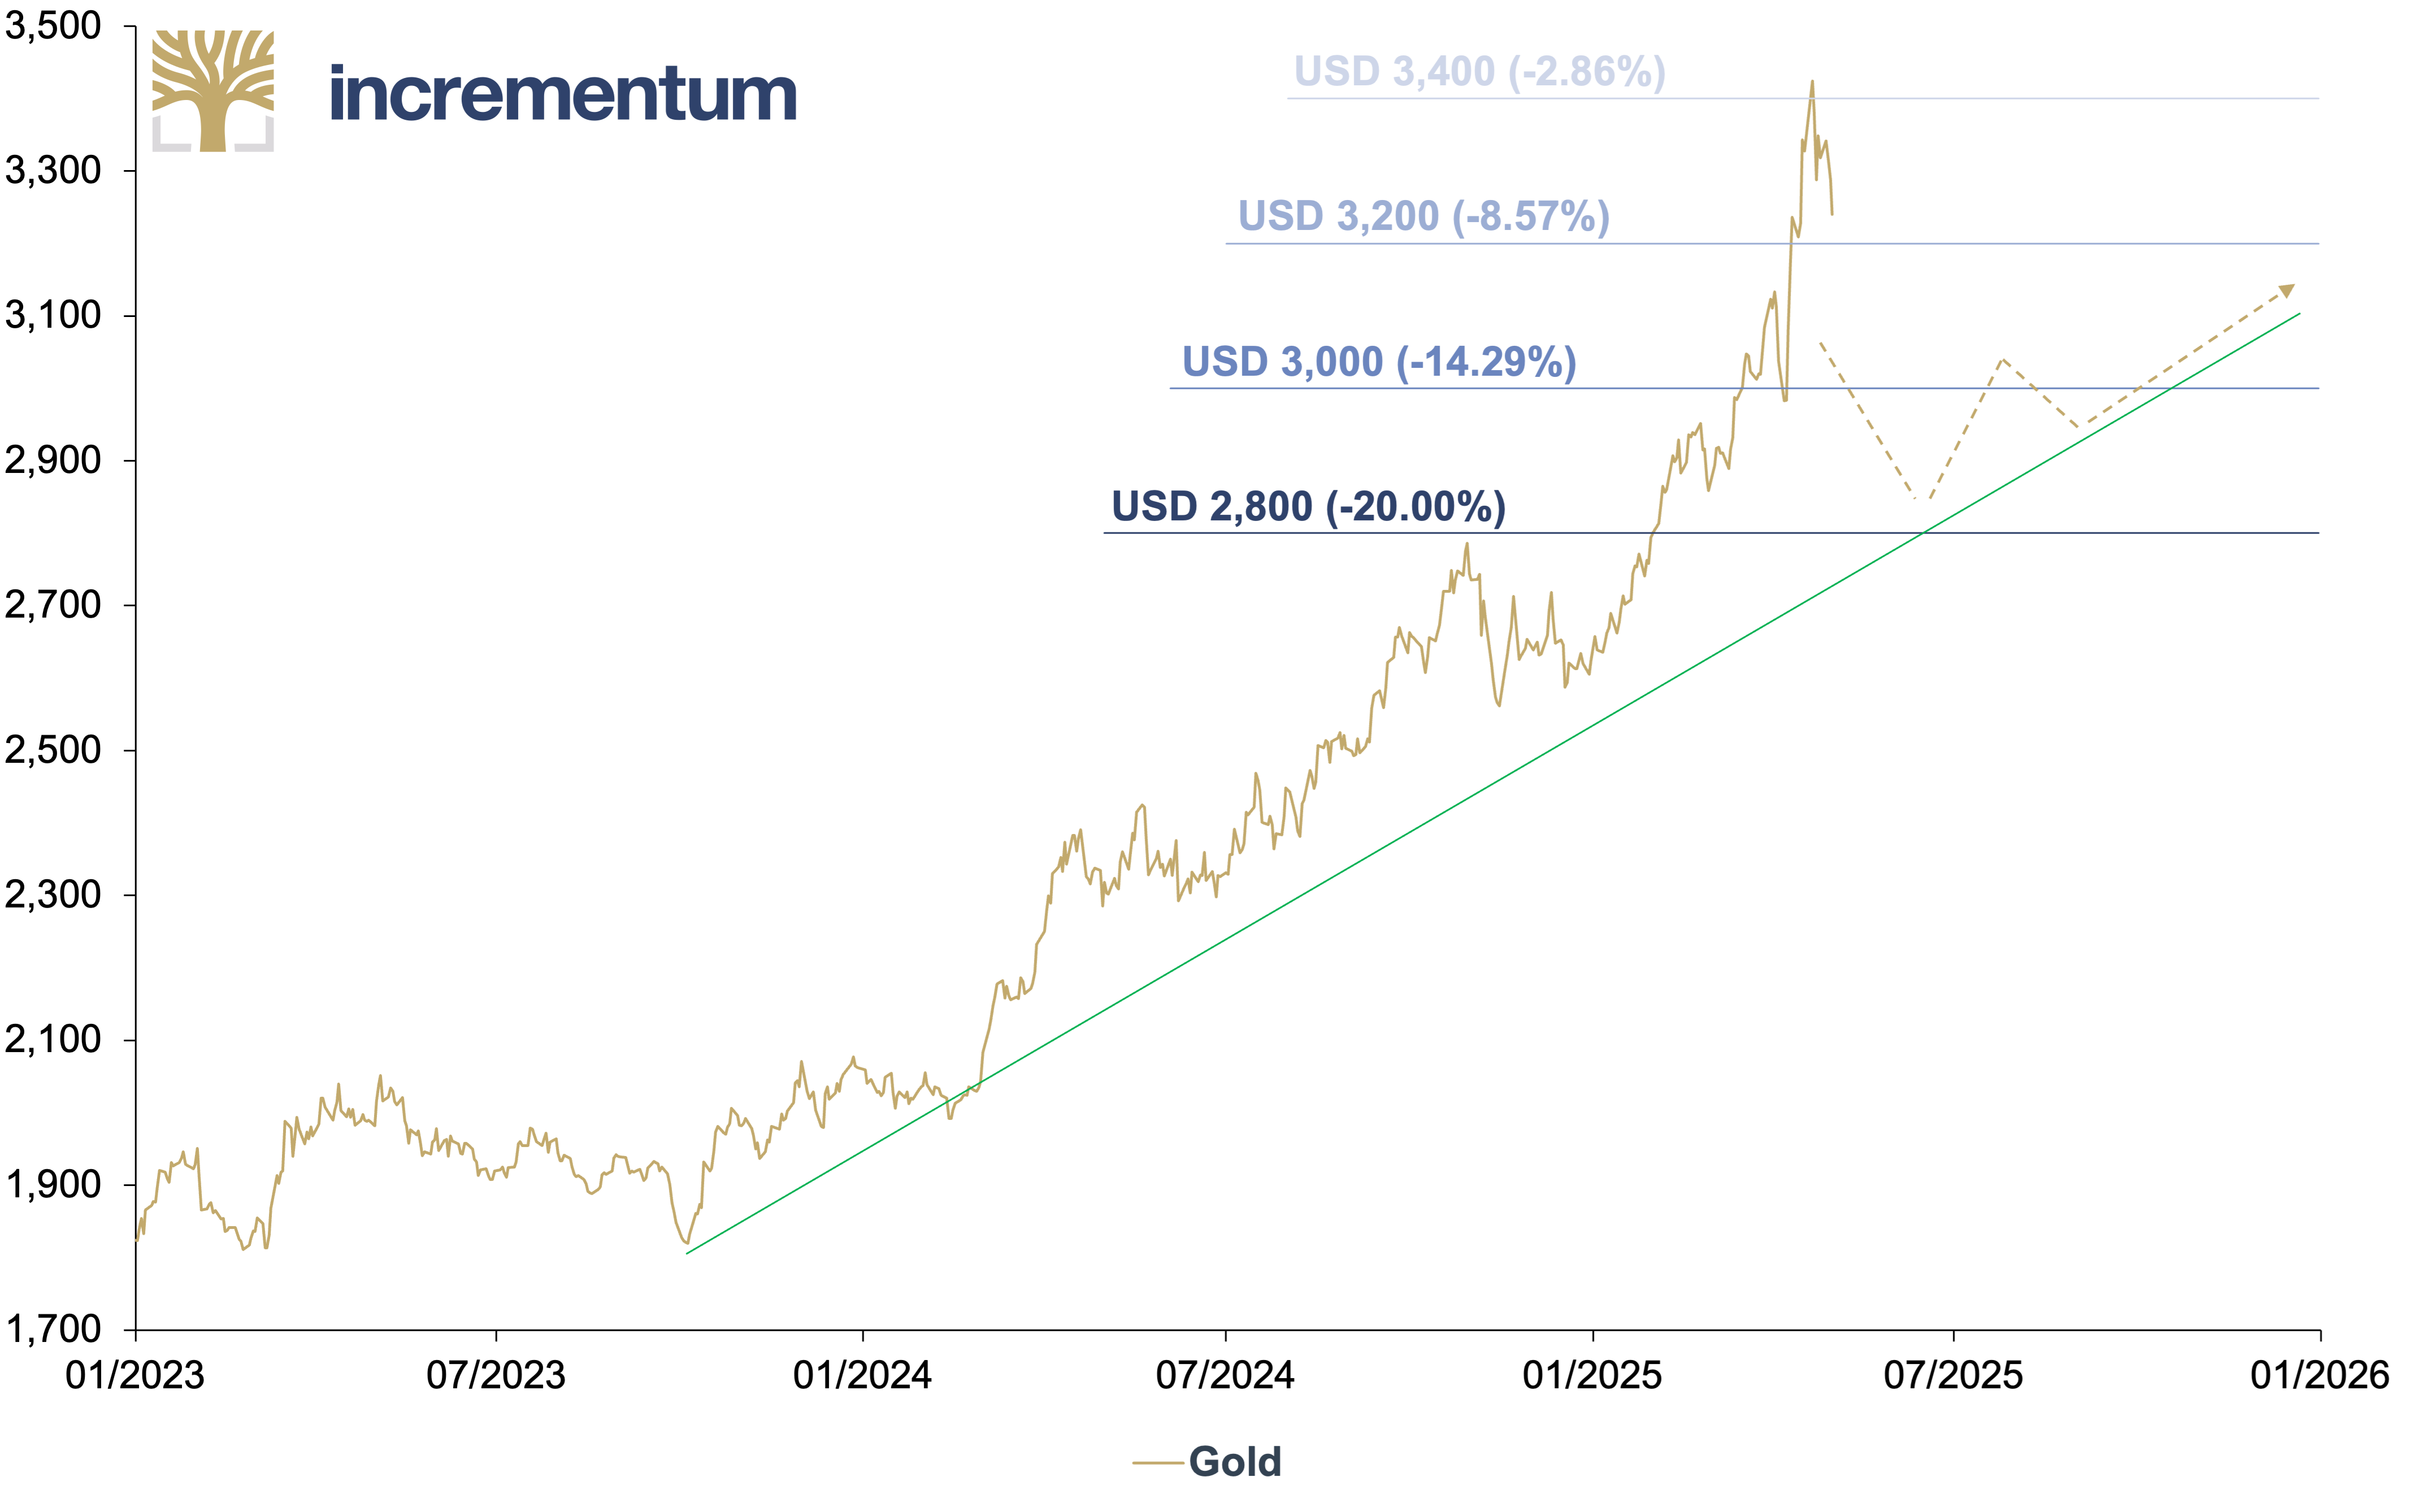
Source: LSEG, Incrementum AG
The Big Long: The Rise of the Golden Swan?
The Big Short was a strategic investment decision against a dysfunctional financial system that was in the final phase of irrational exuberance. The Big Long is a strategic investment decision based on several reinforcing pillars:
- the inevitable restructuring of the global financial and monetary system in the face of deep political and economic turmoil.
- an inflationary attitude on the part of governments and central banks – monetary climate change.[10]
- the economic upturn in regions with an affinity for gold, particularly Asia and the Arab world.
- the reallocation of capital out of US assets (USD, US stocks, US Treasuries), which have stolen the show from gold for many years.
- The expected outperformance of performance gold, i.e. silver, mining stocks and commodities.
The parallel with The Big Short is no coincidence: Just like the underdog investors around Michael Burry in the aughts, those who recognize fundamental market distortions and embrace the Big Long are benefiting today — including many readers of the In Gold We Trust report. These investors, who adhere to the tradition of the Austrian School, have been derided as “gold bugs” for decades. The chrysophiles and sound money advocates see their theses confirmed by current market developments.
Gold, mankind’s oldest store of value, is sending out visible signals. However, the extraordinary gold price rally of recent quarters could be more than just a reflection of crises; it could be the first harbinger of a golden swan moment: a rare but hugely positive signal for gold in the maelstrom of global upheaval. While the existing monetary system is increasingly losing credibility, there is a growing likelihood that gold will regain its traditional role as a monetary asset, possibly in the form of a supranational settlement asset – not as an instrument of political power but as a neutral, debt-free basis for trade, exchange and trust. Gold serves as a monetary anchor that could lay the groundwork for a calmer, more stable, and more peaceful era.
Whatever the outcome, in view of the geopolitical and economic climate, one thing is certain:
IN GOLD WE TRUST
[1] See also “Exclusive Interview with Zoltan Pozsar: Adapting to the New World Order,” In Gold We Trust report 2023
[2] See the chapter “Bringing it Home: Central Bank Gold Repatriation” in this In Gold We Trust report
[3] See “Mastering the New Gold Playbook,” In Gold We Trust report 2024; “Portfolio Characteristics: Gold as Equity Diversifier in Recessions,” In Gold We Trust report 2019
[4] See in particular “Stagflation 2.0,” In Gold We Trust report 2022
[5] See “Possible targets for the gold price“, In Gold We Trust report 2011; see “The Portfolio Characteristics of Gold,” In Gold We Trust report 2018
[6] See the chapter “1970s, 2000s, 2020s…: “A déjà vu in two acts – Act Two” in this In Gold We Trust report, as well as “Mastering the New Gold Playbook,” In Gold We Trust report 2024
[7] See chapter “Gold Miners’ Puzzle in This Market Cycle: To Grow or to Save?” and “Performance Gold – Is It Time for Mining Stocks?” in this In Gold We Trust report
[8] See chapter “A Monetary Turning Point: Bitcoin’s Rise to Strategic Reserve Currency” in this In Gold We Trust report
[9] You can find more information on our investment strategies at www.incrementum.li/investmentfonds. For Bitcoin enthusiasts, we also offer a quarterly publication, “The Bitcoin Compass”, which can be downloaded free of charge: https://www.incrementum.li/en/incrementum-bitcoin-compass/.
[10] See “Gold and the Turning of the Monetary Tides,” In Gold We Trust report 2018