Performance Gold – Is It Time for Mining Stocks?
“Value investing is pain, and the higher the level of pain, the better the future performance.”
Jean-Marie Eveillard
- Following the successful breakout of the gold price, now is the time for performance gold. However, mining shares are not a simple buy-and-hold investment, but require active management.
- An active mining stock strategy using our new, proprietary Incrementum Active Aurum Signal is clearly superior to a passive strategy from both a performance and a risk perspective.
- While the gold price reached new all-time highs in the spring, the valuation of gold mining companies does not yet reflect the sharp rise in profitability.
- In the short term, the technical situation for gold miners seems somewhat extended. Additionally, the second half of the year tends to be the less bullish half for mining equities. In this respect, any second-half pullbacks could offer attractive entry points.
- We expect strong producer cash flows will lead to replenishing their dwindling reserves through acquisitions. The beneficiaries of this development will be junior producers, well-funded developers and explorers with world-class discoveries in Tier 1 regions.
- Despite the largely positive developments, there are still only a few sectors that are more underweighted by investors than the mining sector. This is reflected in the sector’s almost dwarfed market capitalization.
Commodities and mining stocks are considered a highly complex and demanding asset class. Fortunes are made and also quickly wiped out again. Complex interactions between price trends, technical challenges in extraction, management risks, substitution, and technological progress characterize the micro level of the industry. Forecasts in this area, therefore, regularly turn out to be a waste of time.
At the macroeconomic level, factors such as interest rates, energy and labor costs, political uncertainty, and the interplay between inflation and deflation collectively influence the success or failure of a mining investment. In our opinion, this requires active timing when investing in mining stocks.
Time for Performance Gold?
“Should I buy gold or gold mining shares?” is a question journalists and investors often ask us. Our slightly mischievous answer is usually that this is as meaningful a comparison as between the Austrian ski jumping team and the Brazilian national soccer team. The comparison only makes minimal sense.
Attentive readers of our gold studies are already familiar with our differentiation between safe-haven gold in the form of physical gold on the one hand and performance gold such as (gold) mining shares and mining funds on the other. While the primary aim of acquiring physical gold, i.e. safe-haven gold, is to preserve purchasing power, gold and silver mining shares and mining funds, i.e. performance gold, offer the potential for significant capital growth.
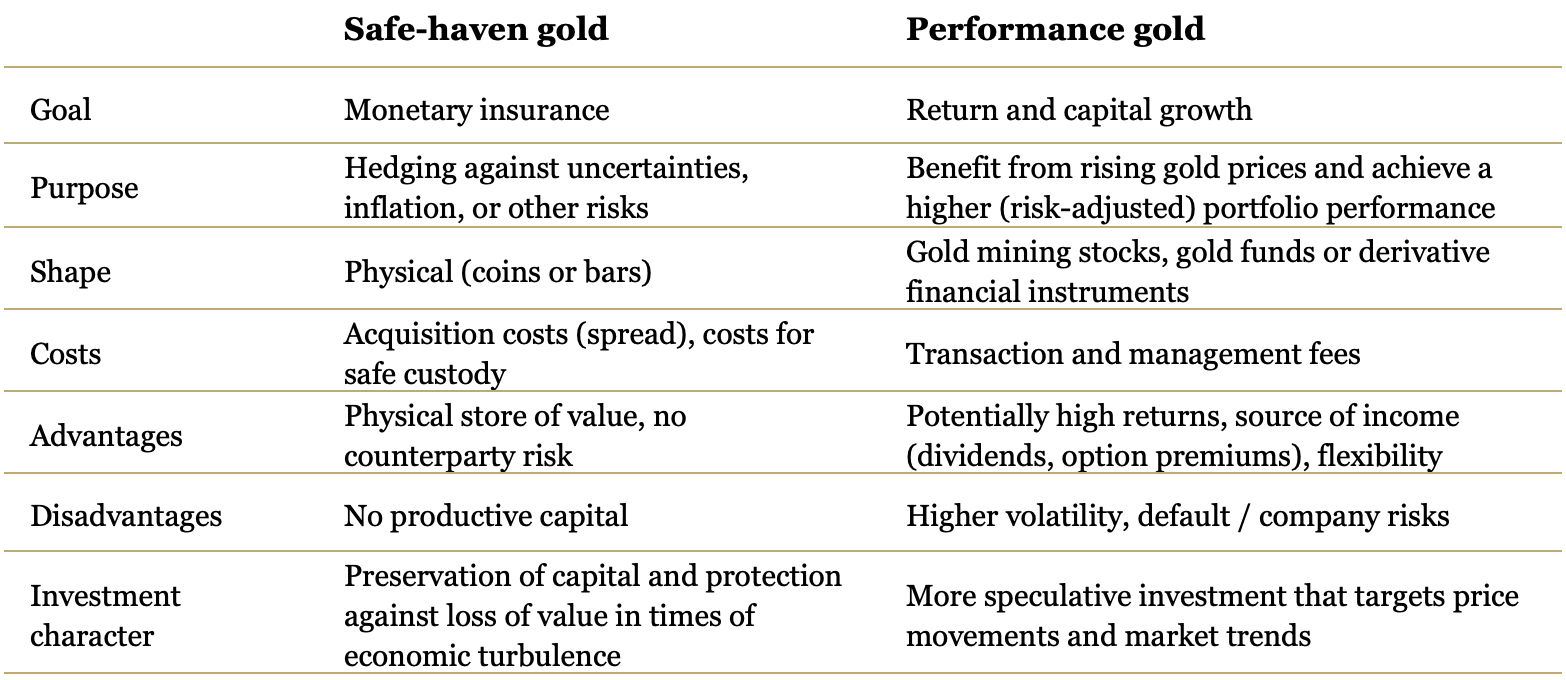
Source: Incrementum AG
One thing is clear: gold mining shares are not a buy-and-hold investment. The assumption that they are merely a direct lever on the gold price is an oversimplification. Rather, every type of mining company – whether explorers, developers, producers, or royalty companies – harbors a multitude of risks and opportunities that go beyond the pure gold price and have a significant influence on the price trend.
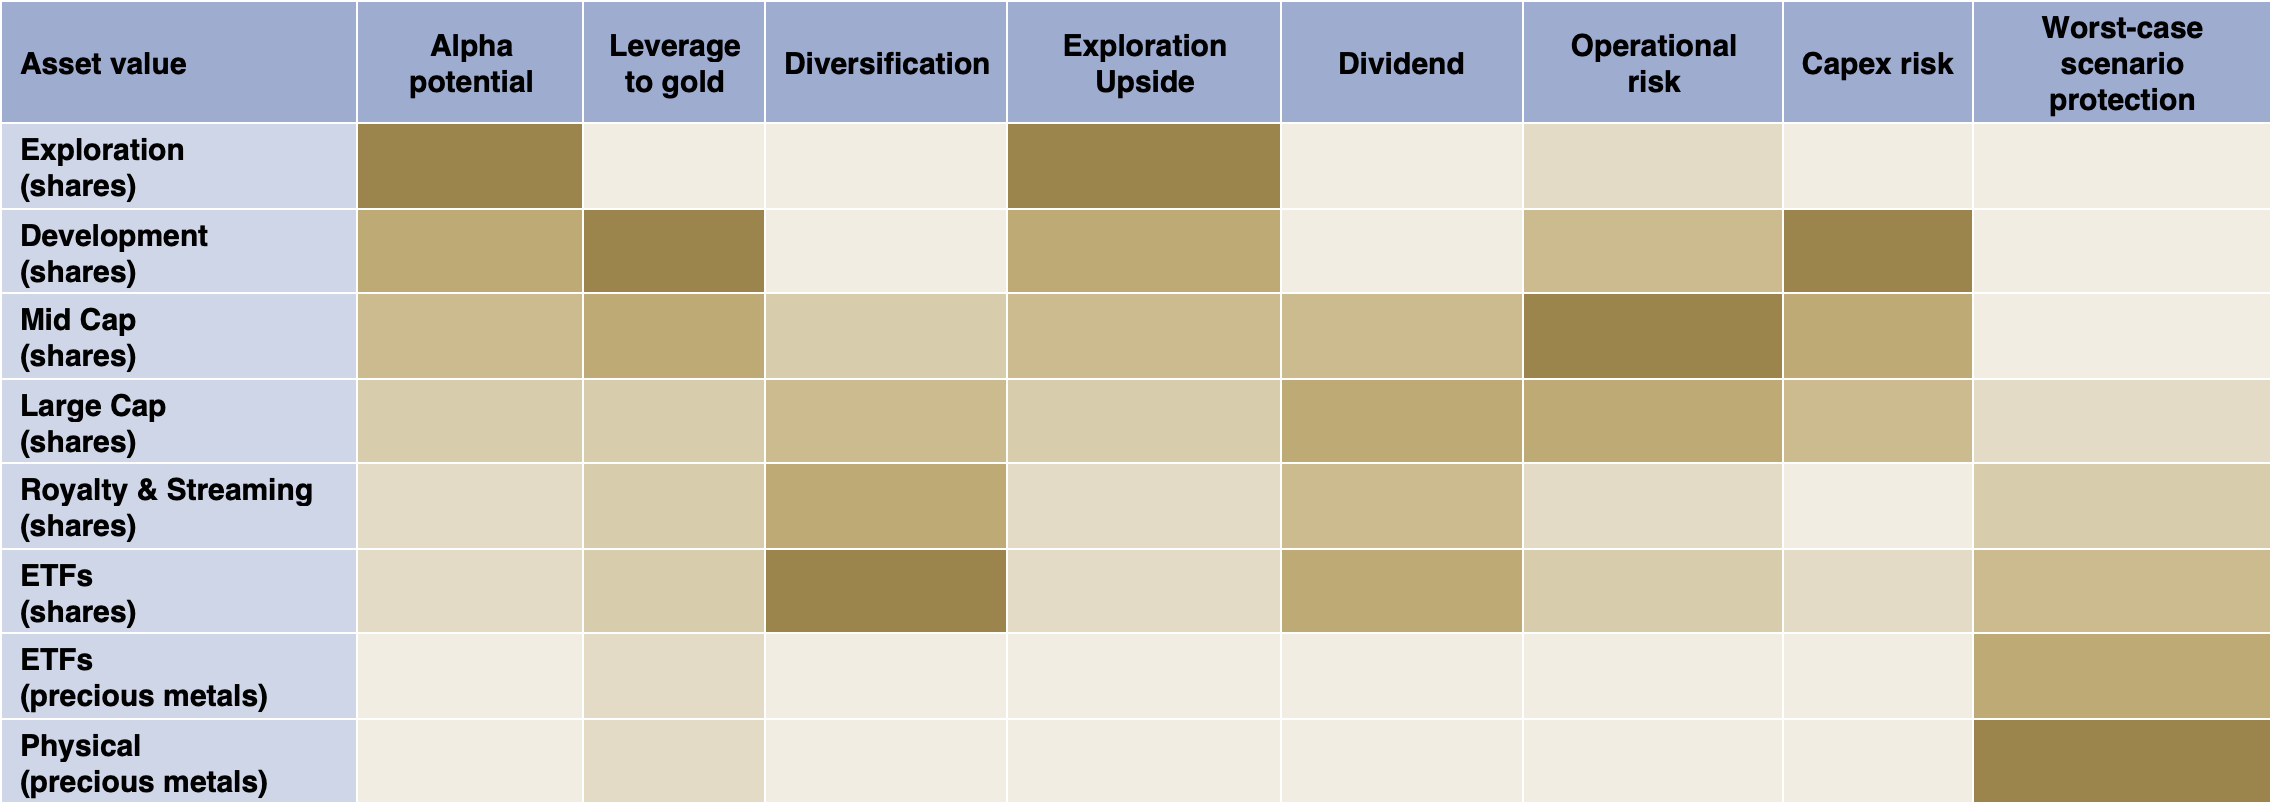
Source: Jefferies, Incrementum AG
Given the many risks, we advocate an active investment strategy when dealing with gold mining stocks. This is because bear and bull markets in this sector are typically more extreme than conventional equities.
Gold Miners* Bull/Bear Markets, 01/1970–04/2025
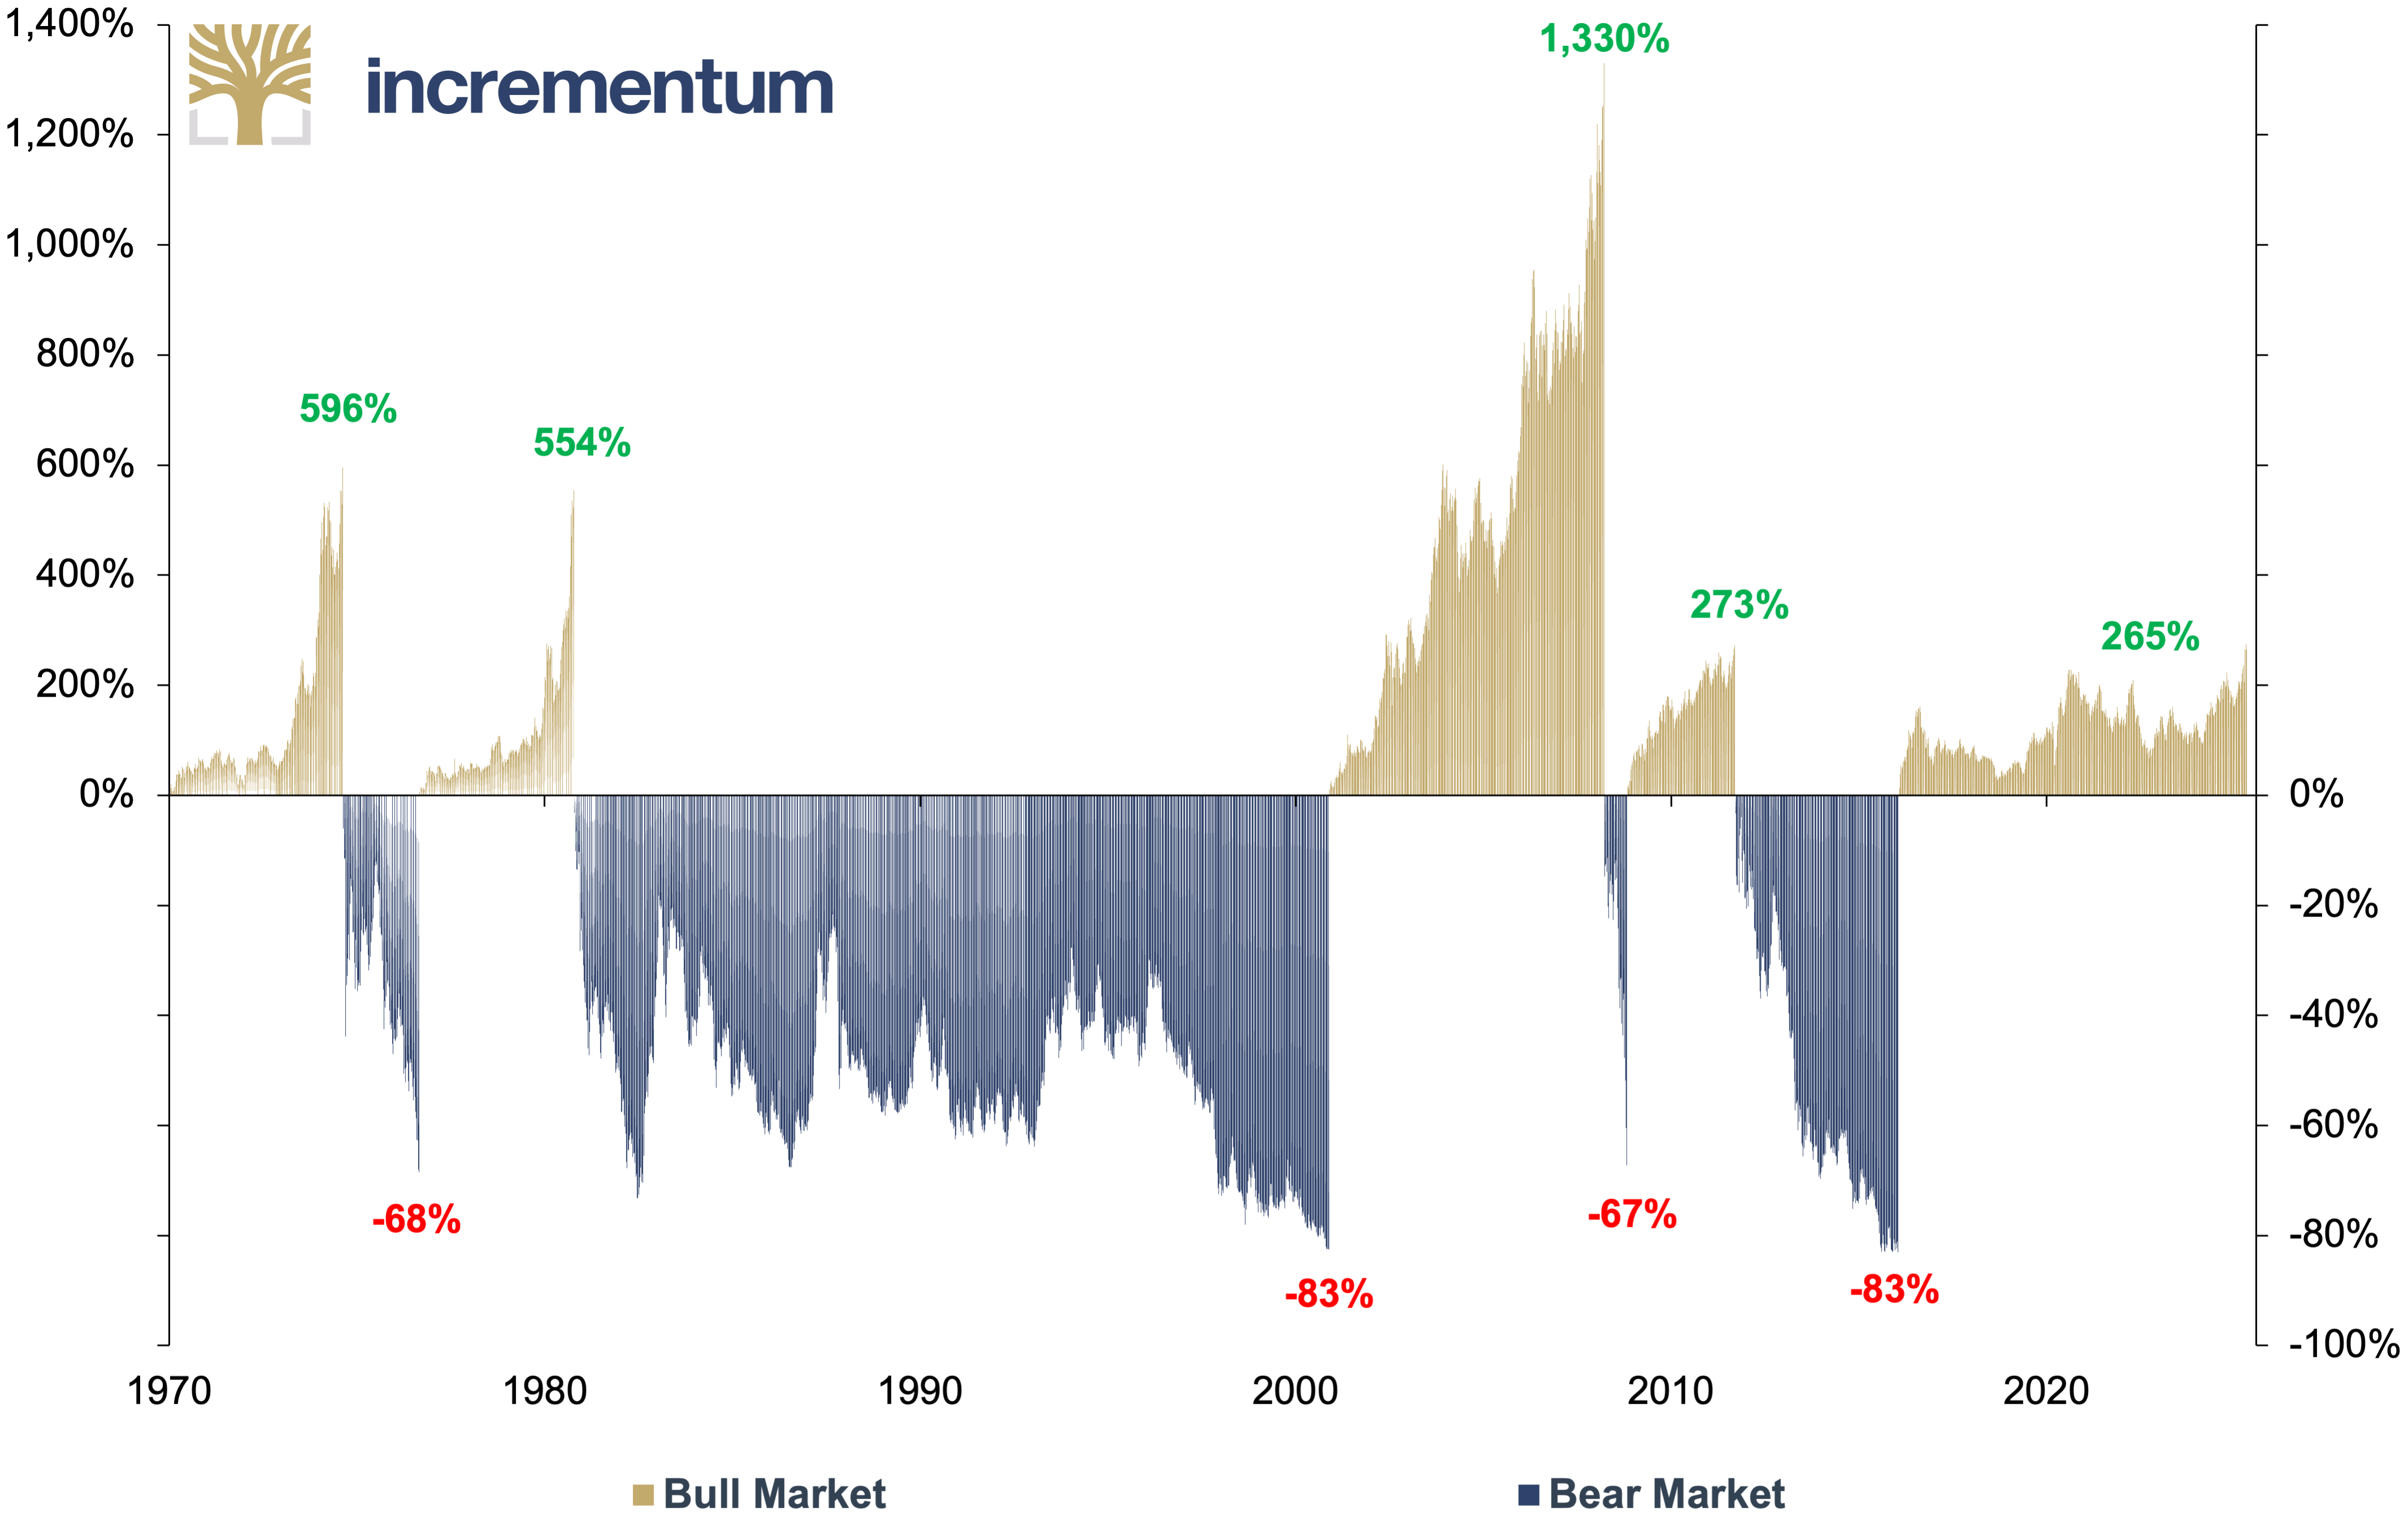
Source: Nick Laird, LSEG, Incrementum AG
*BGMI = 1970–2000, HUI = 2000–
A proven approach to risk diversification in a portfolio of mining stocks is to focus on royalty and streaming companies. These companies are characterized by the fact that they do not operate their own mines, but focus on acquiring rights to future gold and silver production.[1] Their business model has proven to be extremely robust, as they generate solid returns during upturns and are often more resilient than the overall market during downturns.
GDX, GDXJ vs. Royalty & Streaming Stocks, in USD, 100 = 01/2011, 01/2011–04/2025
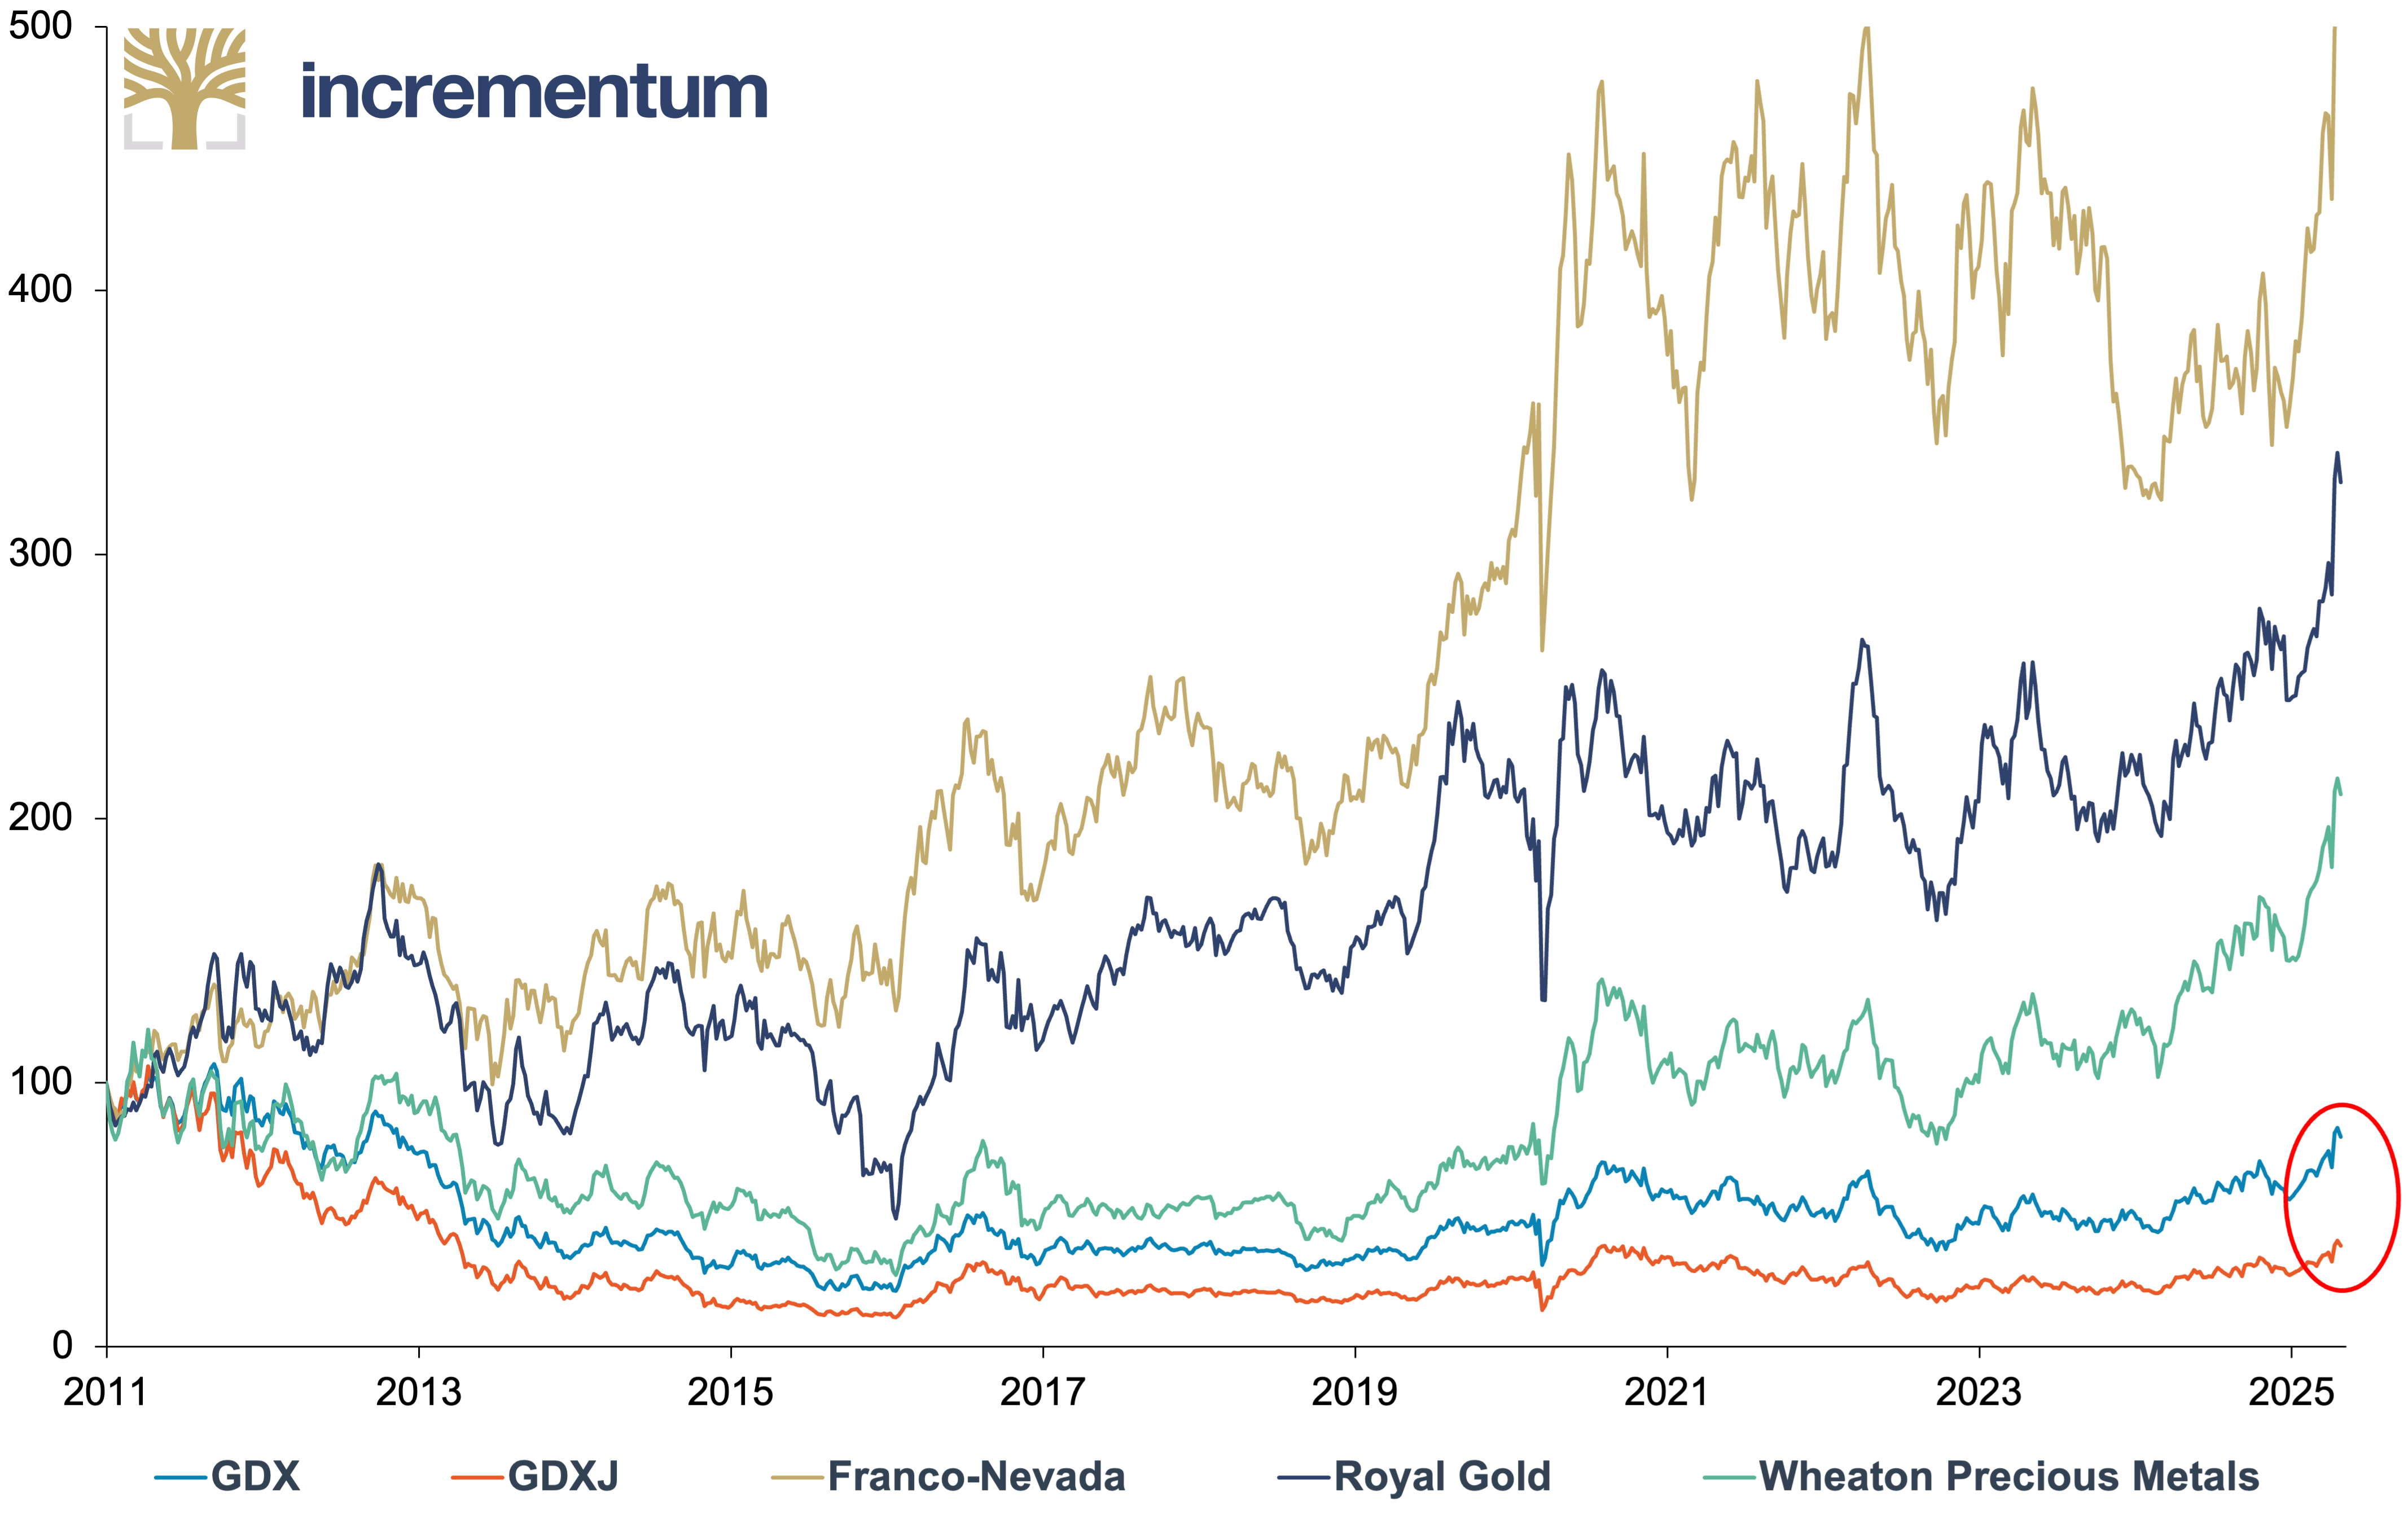
Source: LSEG, Incrementum AG
Thanks to their business model, which allows them to benefit from rising gold and silver prices without bearing the direct operational risks of mines, they exhibit remarkable anti-fragility. Their diversified portfolios reduce the risk of individual mines and thus offer a better hedge against market fluctuations.
Gold mining stocks: Active management is required!
Gold and silver mining stocks are significantly more volatile than royalty and streaming stocks. Despite the recent stellar performance, the gold mining sector is still as unpopular with generalist investors as Elon Musk is with civil servant unions.
Gold, GDX, and MSCI World, in USD, 100 = 01/2020, 01/2020–04/2025
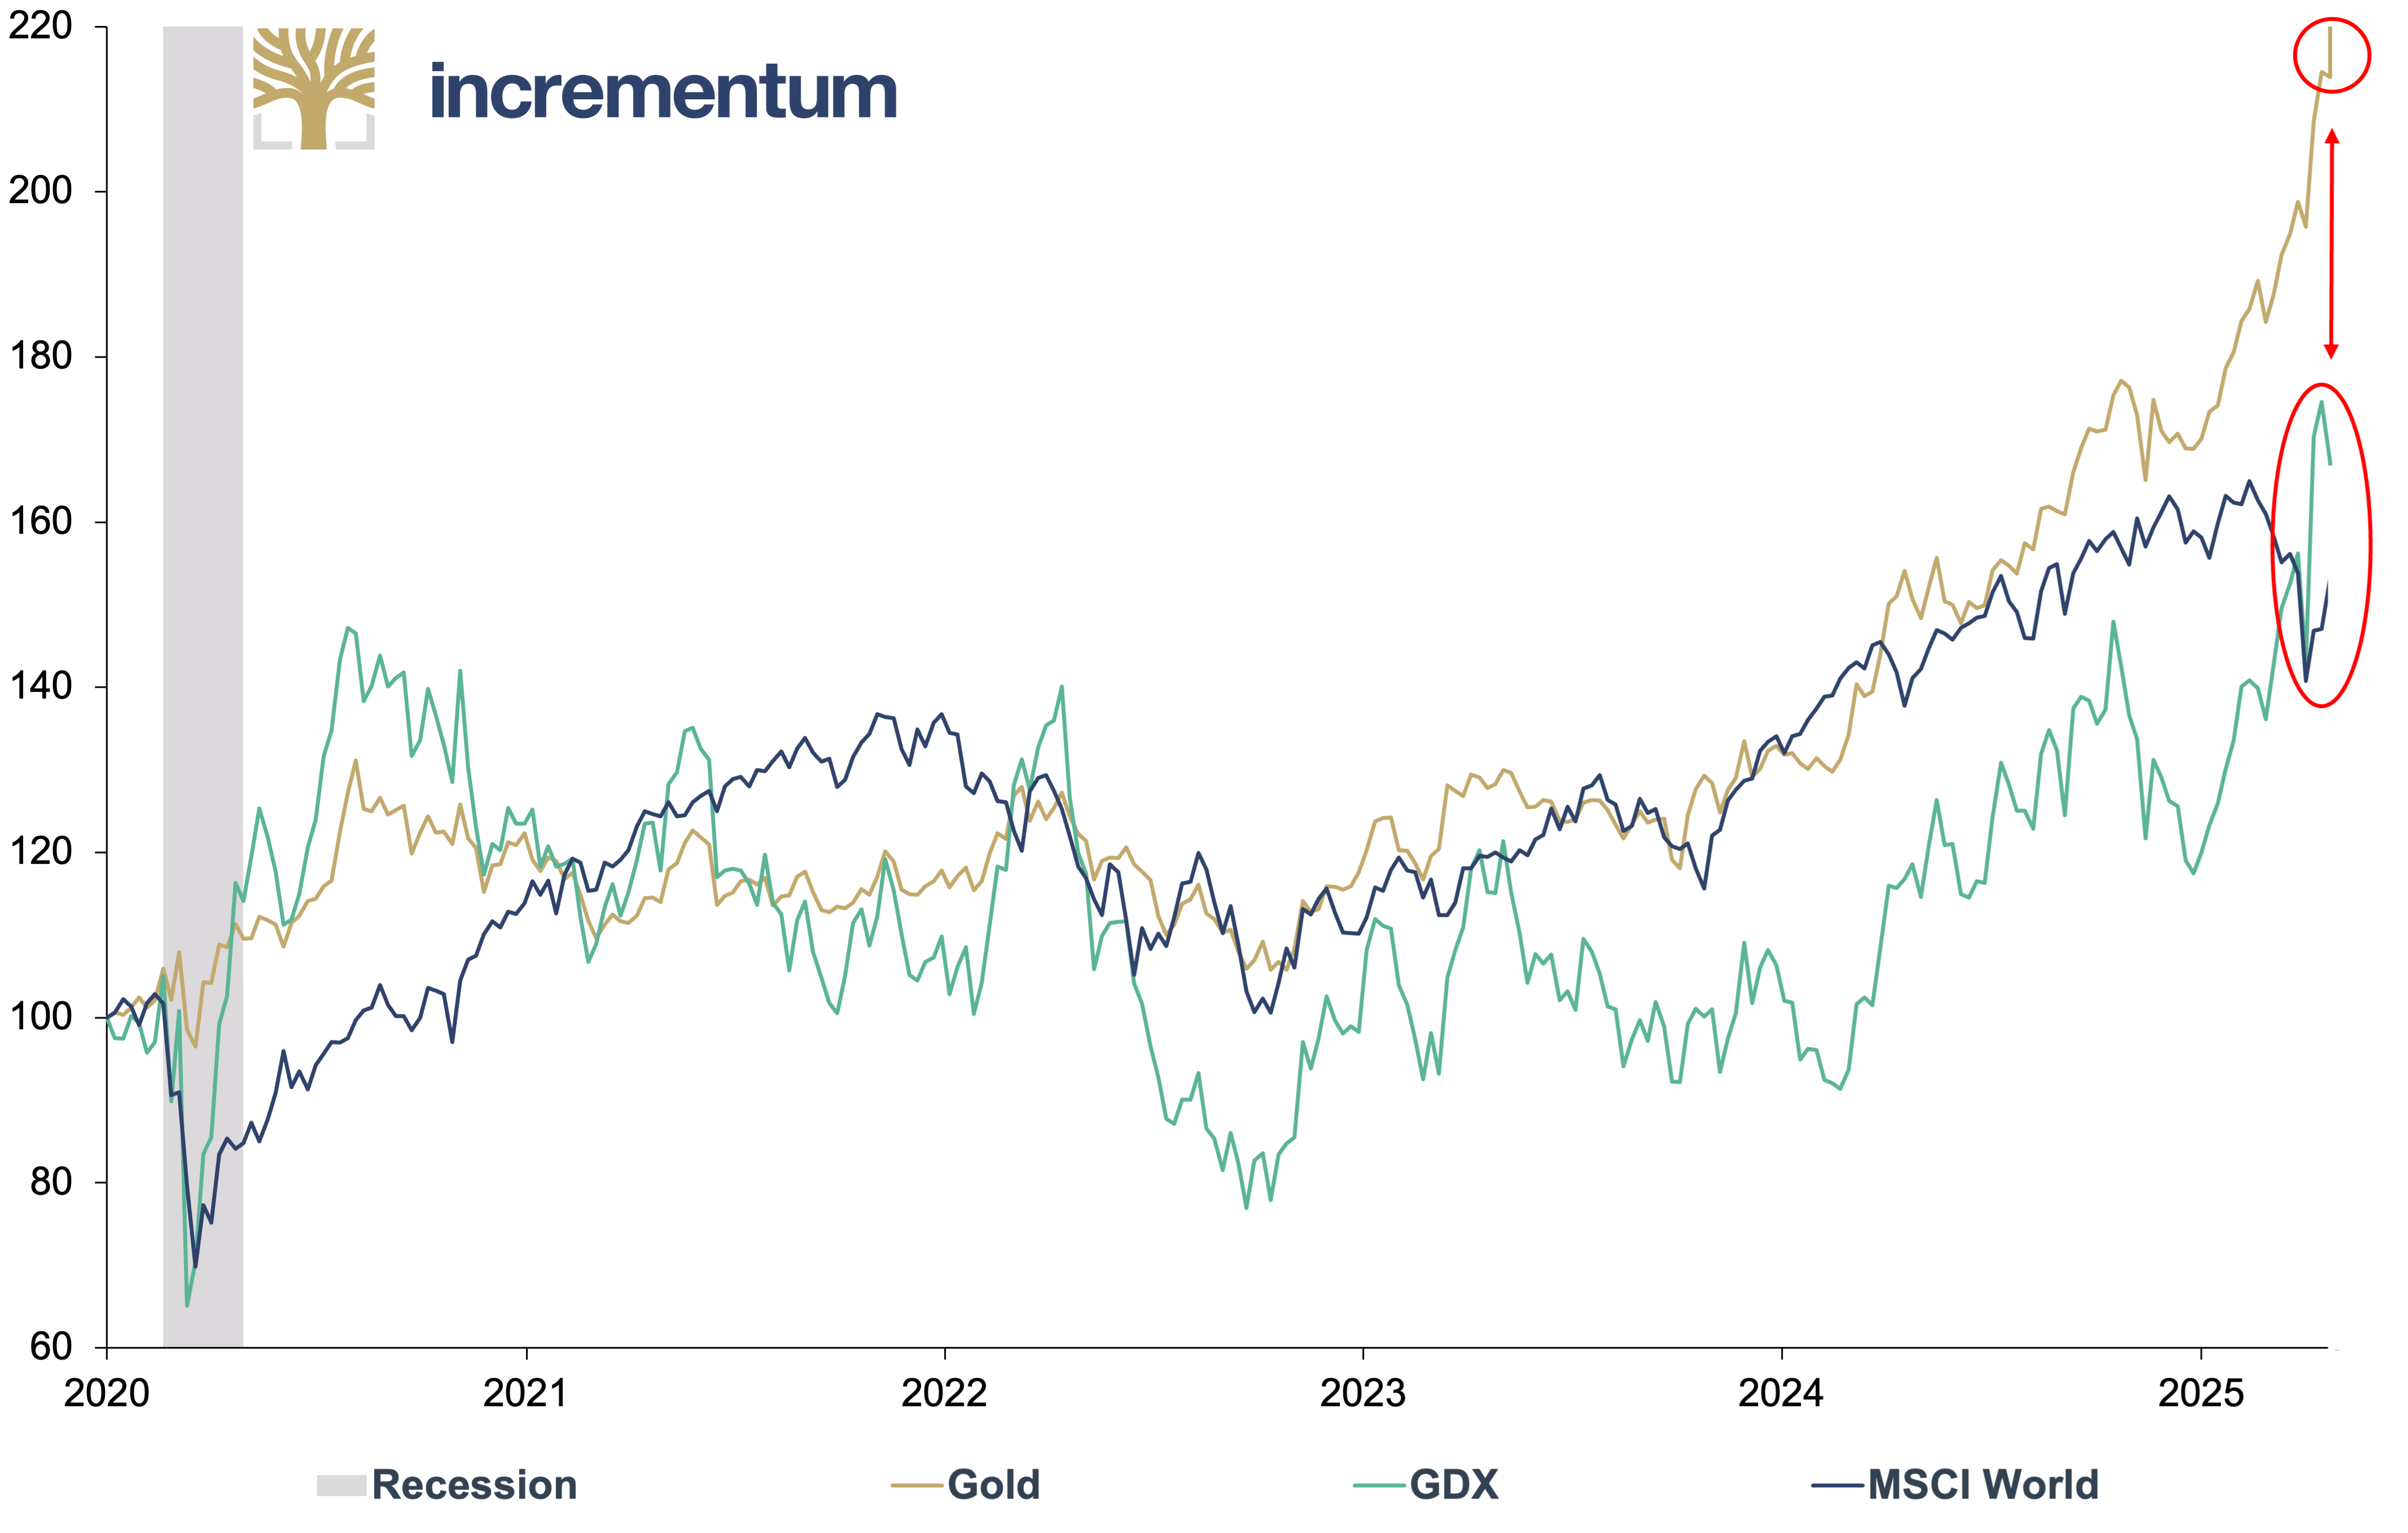
Source: LSEG, Incrementum AG
The Incrementum Active Aurum Signal
But what indicators are there for recognizing the optimal time to go on the offensive and performance gold to your portfolio? And when is it time – according to the football wisdom “offense wins games, but defense wins championships” – to act more defensively?
Over the past years, we have worked intensively on this issue and developed a signal that helps us precisely anticipate this point in time. The result of our analysis is our proprietary Incrementum Active Aurum Signal. The signal determines the optimum time to adjust the gold exposure in the portfolio.
It examines when it is advisable to acquire performance gold in the form of mining shares or equity funds to increase the gold beta. It also determines when it is appropriate to take a more defensive approach to gold exposure. This can be implemented, for example, by shifting from higher-risk mining stocks – particularly in the small caps segment – to bonds issued by mining companies or royalty and streaming companies, or simply by reducing the exposure in order to achieve a lower overall beta to gold.
Composition of the signal
The Incrementum Active Aurum Signal consists of two sub-signals: the cycle signal and the fundamental signal. The cycle signal is made up of five anti-cyclical components:
- Momentum: Relative Strength Index (RSI) of gold mining stocks: The RSI of the gold mining sector provides information on whether gold mining stocks are overbought or oversold. This can be an indication that the market is overheated or that a trend reversal is looming.
- Sentiment: CFTC net gold positioning: Total net gold positioning as measured by CFTC data can indicate how market players such as hedge funds and other institutional investors are positioned. Extremely positive or negative sentiment can indicate that the market may be at a turning point.
- Risk appetite: Bollinger Bands on gold mining stocks/gold ratios: Analyzing the Bollinger Bands of mining stocks versus gold and junior mining stocks versus mining stocks can indicate how risk-averse investors are. High volatility and a strong movement of the bands can indicate increasing uncertainty and risk aversion.
- Macro environment: Treasury Inflation-Protected Securities (TIPS): The TIPS analysis compares the real yield of inflation-protected bonds with their 52-week moving average. This can provide an indication of market expectations regarding inflation and real interest rates, which in turn can affect the attractiveness of gold as an inflation hedge and thus also the price performance of gold mining stocks.
- Boom/bust indicator: Gold mining stocks relative to their moving average: The delta between the current price and the moving average can indicate whether gold mining stocks are fundamentally overvalued or undervalued. A significant delta can indicate that the market is in an overbought or oversold phase, and a correction is likely.
All sub-indicators oscillate between 0 and 100, affecting the cycle signal with different weightings. Overall, this results in the cycle signal with a value between 0 and 100. Buy or sell signals are achieved when the cycle signal is above 85 (= sell signal) or below 20 (= buy signal). A high value therefore indicates a potential overbought situation or a largely exhausted upside, while a low value indicates an oversold situation and limited downside.
Gold Mining Stocks* (lhs, log), in USD, and Cycle Signal (rhs), 01/1972–04/2025

Source: LSEG, Incrementum AG
*BGMI = 01/1972–06/2006, GDX = 06/2006–
The second cornerstone of the Incrementum Active Aurum Signal is the fundamental signal, which can be understood as a pro-cyclical indicator for gold mining companies. A gold mining stock margin trend channel was created as a central input factor that takes into account developments on the commodities market.
In contrast to the cycle signal, the fundamental signal only has two levels:
0: negative/weak fundamental environment
100: positive/strong fundamental environment
A buy signal is triggered at a value of 100, and a sell signal at a value of 0.
Gold Mining Stocks* (lhs, log), in USD, and Fundamental Signal (rhs), 01/1972–04/2025
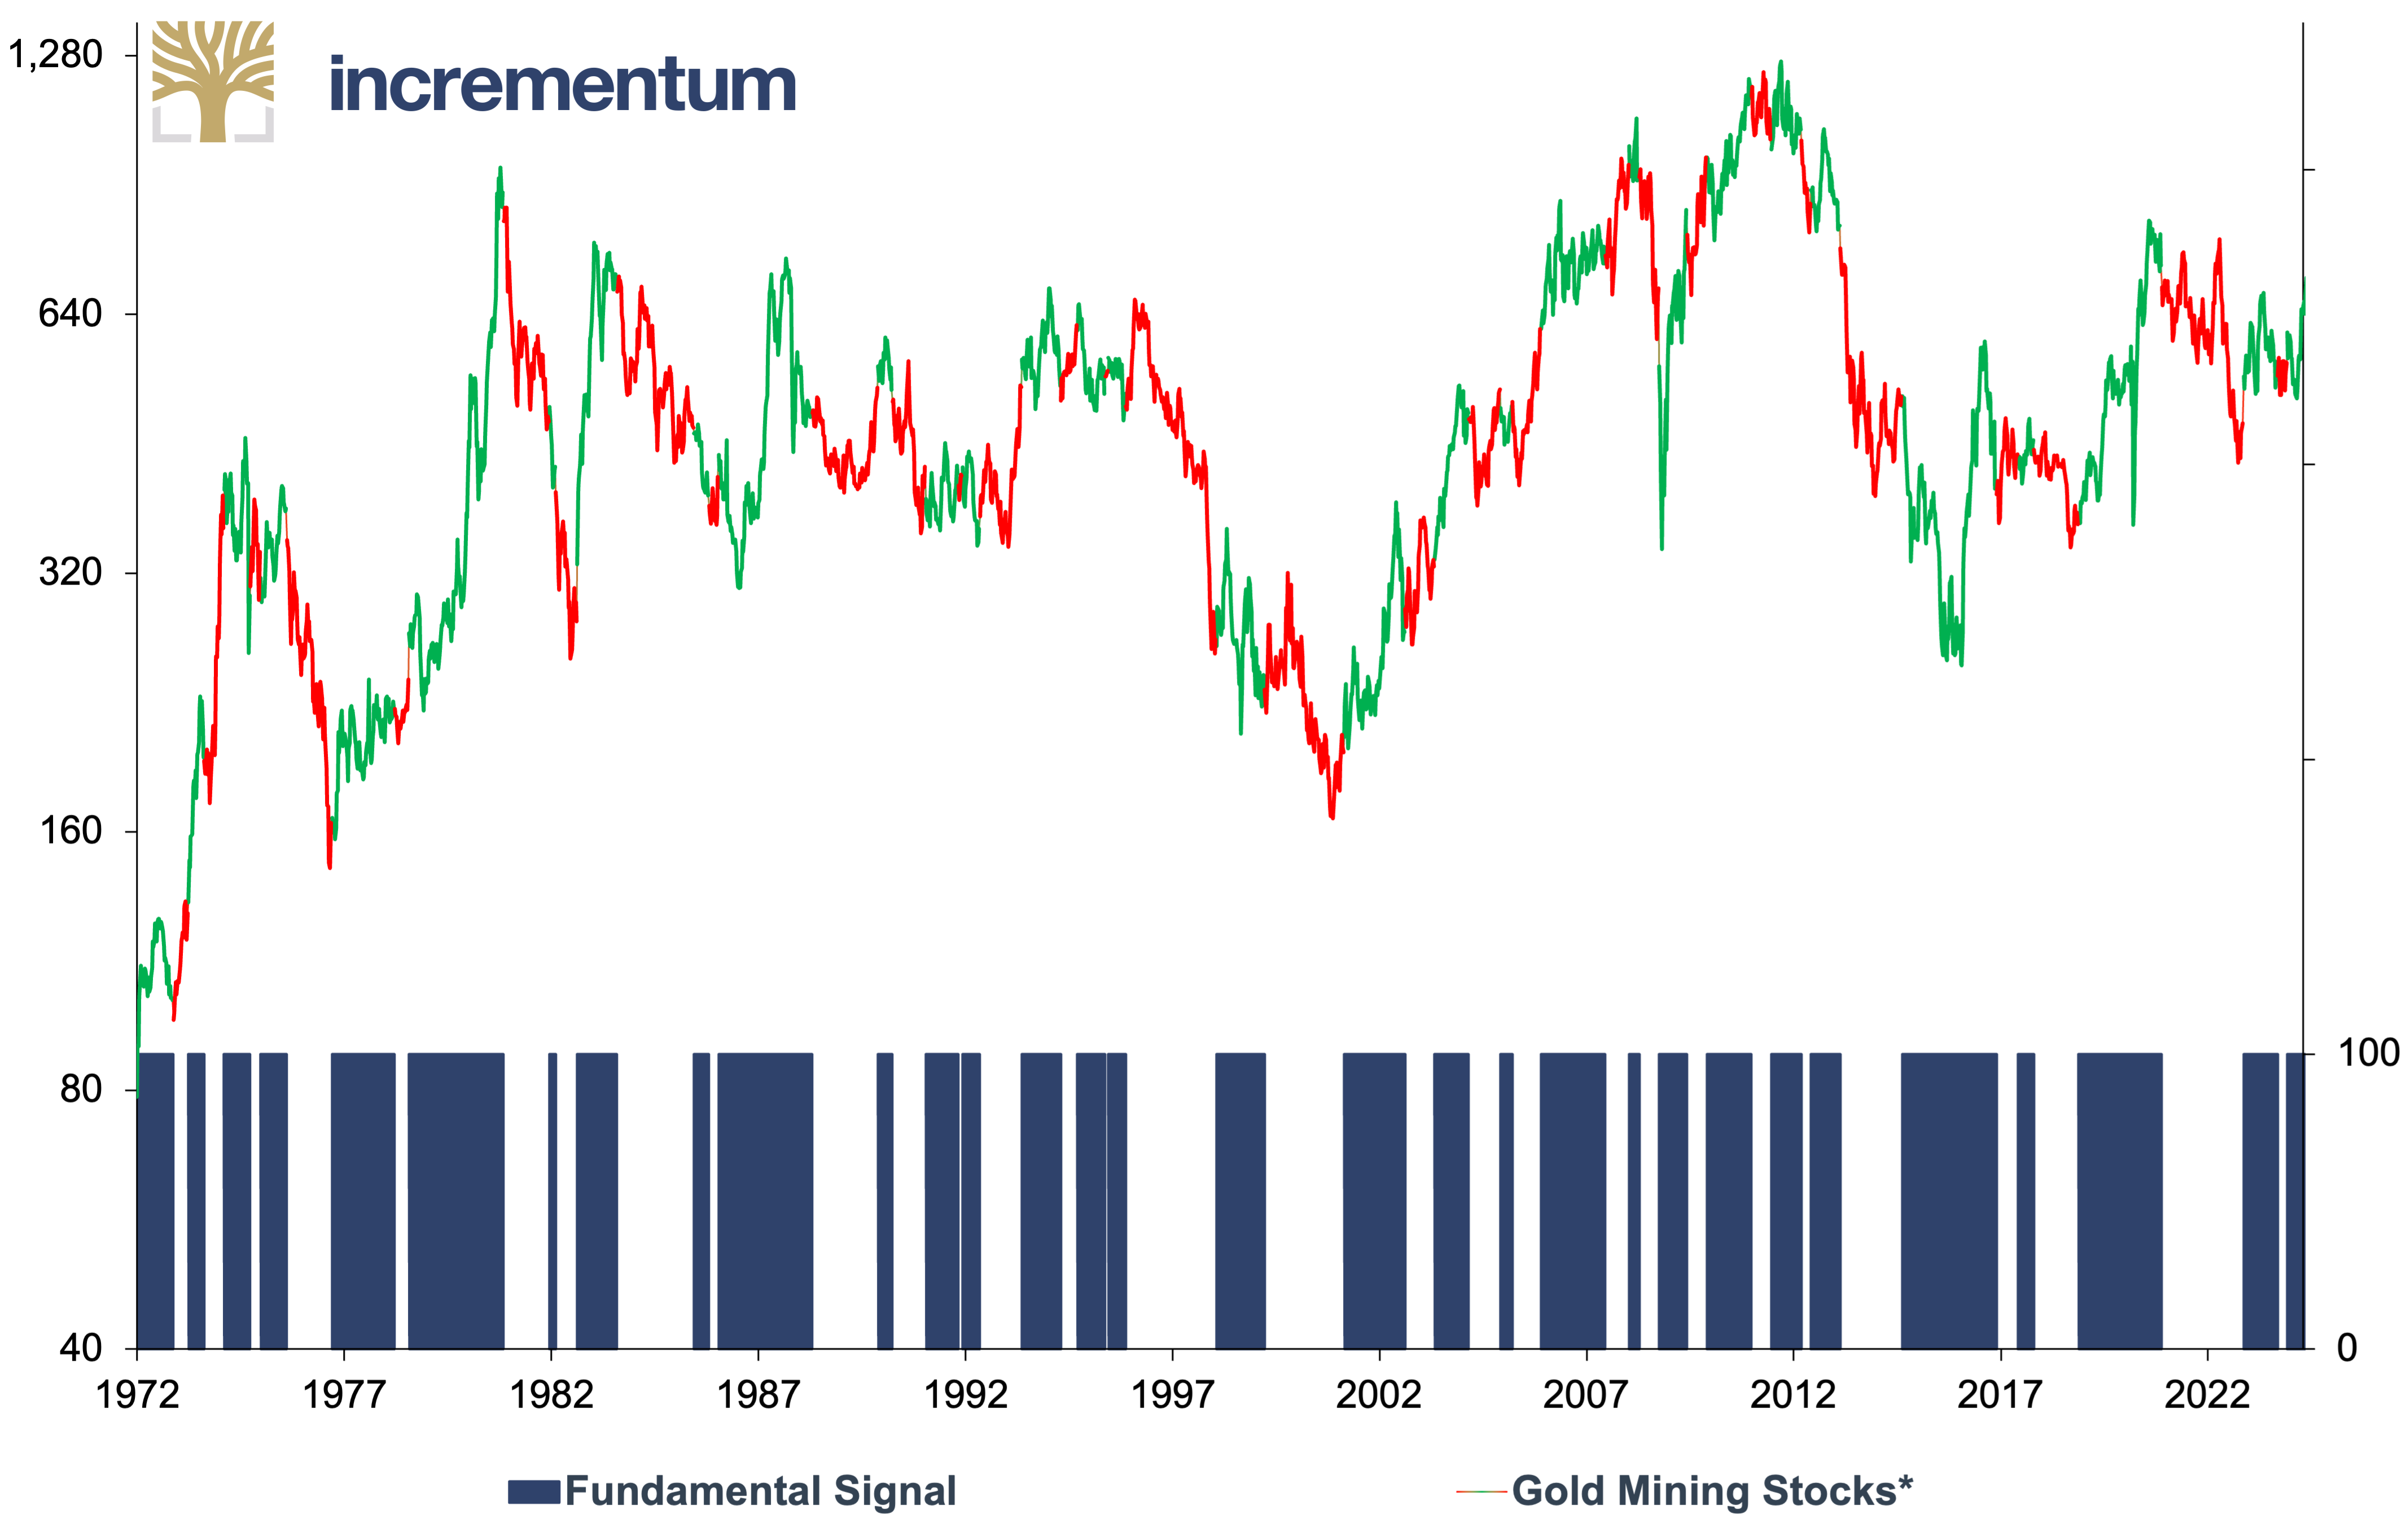
Source: LSEG, Incrementum AG
*BGMI = 01/1972–06/2006, GDX = 06/2006–
Interpretation
The combination of the two sub-signals cycle signal and fundamental signal results in the Incrementum Active Aurum signal, which has three different variations:
- Offensive: Both sub-signals indicate buy.
- Neutral: The two sub-signals give divergent orientations.
- Defensive: Both sub-signals indicate sell.
Gold Mining Stocks* (log), in USD, and Incrementum Active Aurum Signal, 01/1972–04/2025
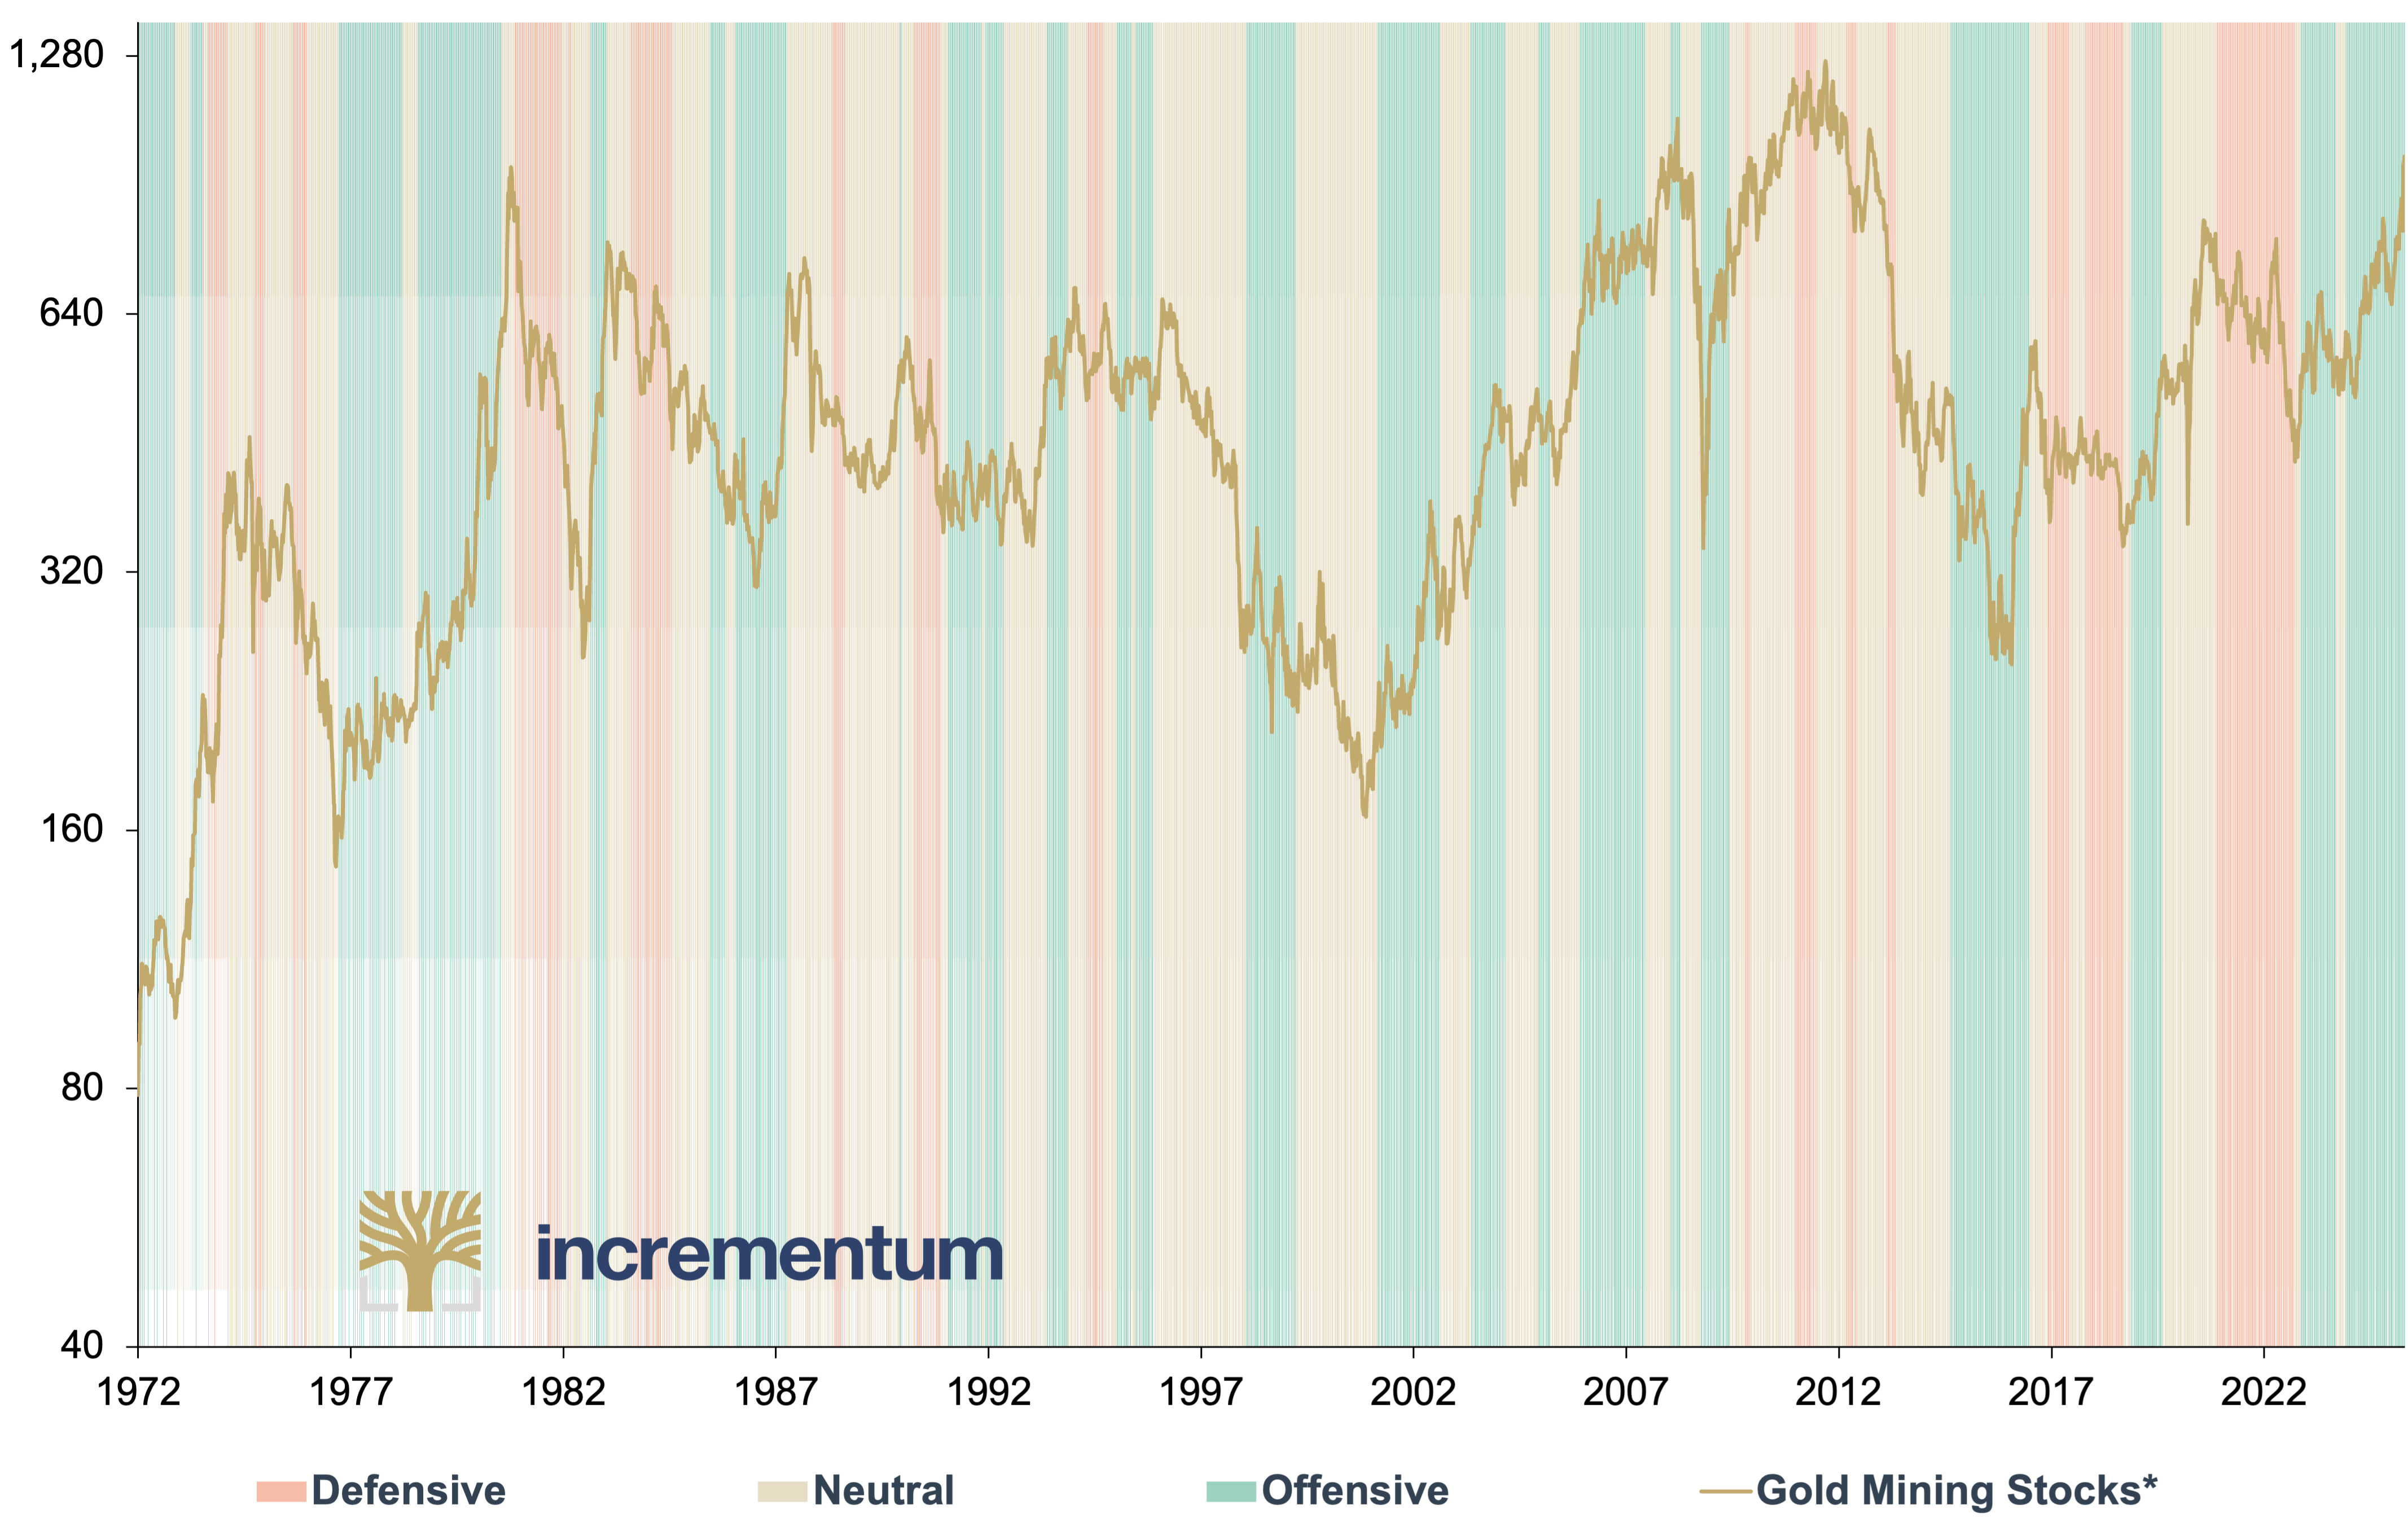
Source: LSEG, Incrementum AG
*BGMI = 01/1972–06/2006, GDX = 06/2006–
Backtesting properties
In the backtest since 1971, the Incrementum Active Aurum Signal shows an average of 1.5 signal changes per year. We interpret this value as positive.
A simple backtest strategy using the Incrementum Active Aurum signal can be implemented by investing 100% in gold mining stocks in the case of an offensive signal, 50% in the case of a neutral signal and 0% in the case of a defensive signal. We have used the Barron’s Gold Mining Index (BGMI) as an investment instrument for the backtest from 1971 to 2005 and the VanEck Gold Miners UCITS ETF (GDX) from 2006 onwards. While the BGMI is the oldest gold mining share index worldwide, the GDX is an investment vehicle in the gold mining sector in which the vast majority of investors can invest globally.
The central question now is: How does the performance of an active gold mining stock strategy using our Incrementum Active Aurum Gold Signal compare to a passive strategy, i.e., a strategy in which one is always 100% invested in gold mining stocks? The results speak for themselves.
Performance Comparison: Active vs. Passive Gold Mining Stocks Strategy*, in USD, 100 = 07/1971, 07/1971–04/2025
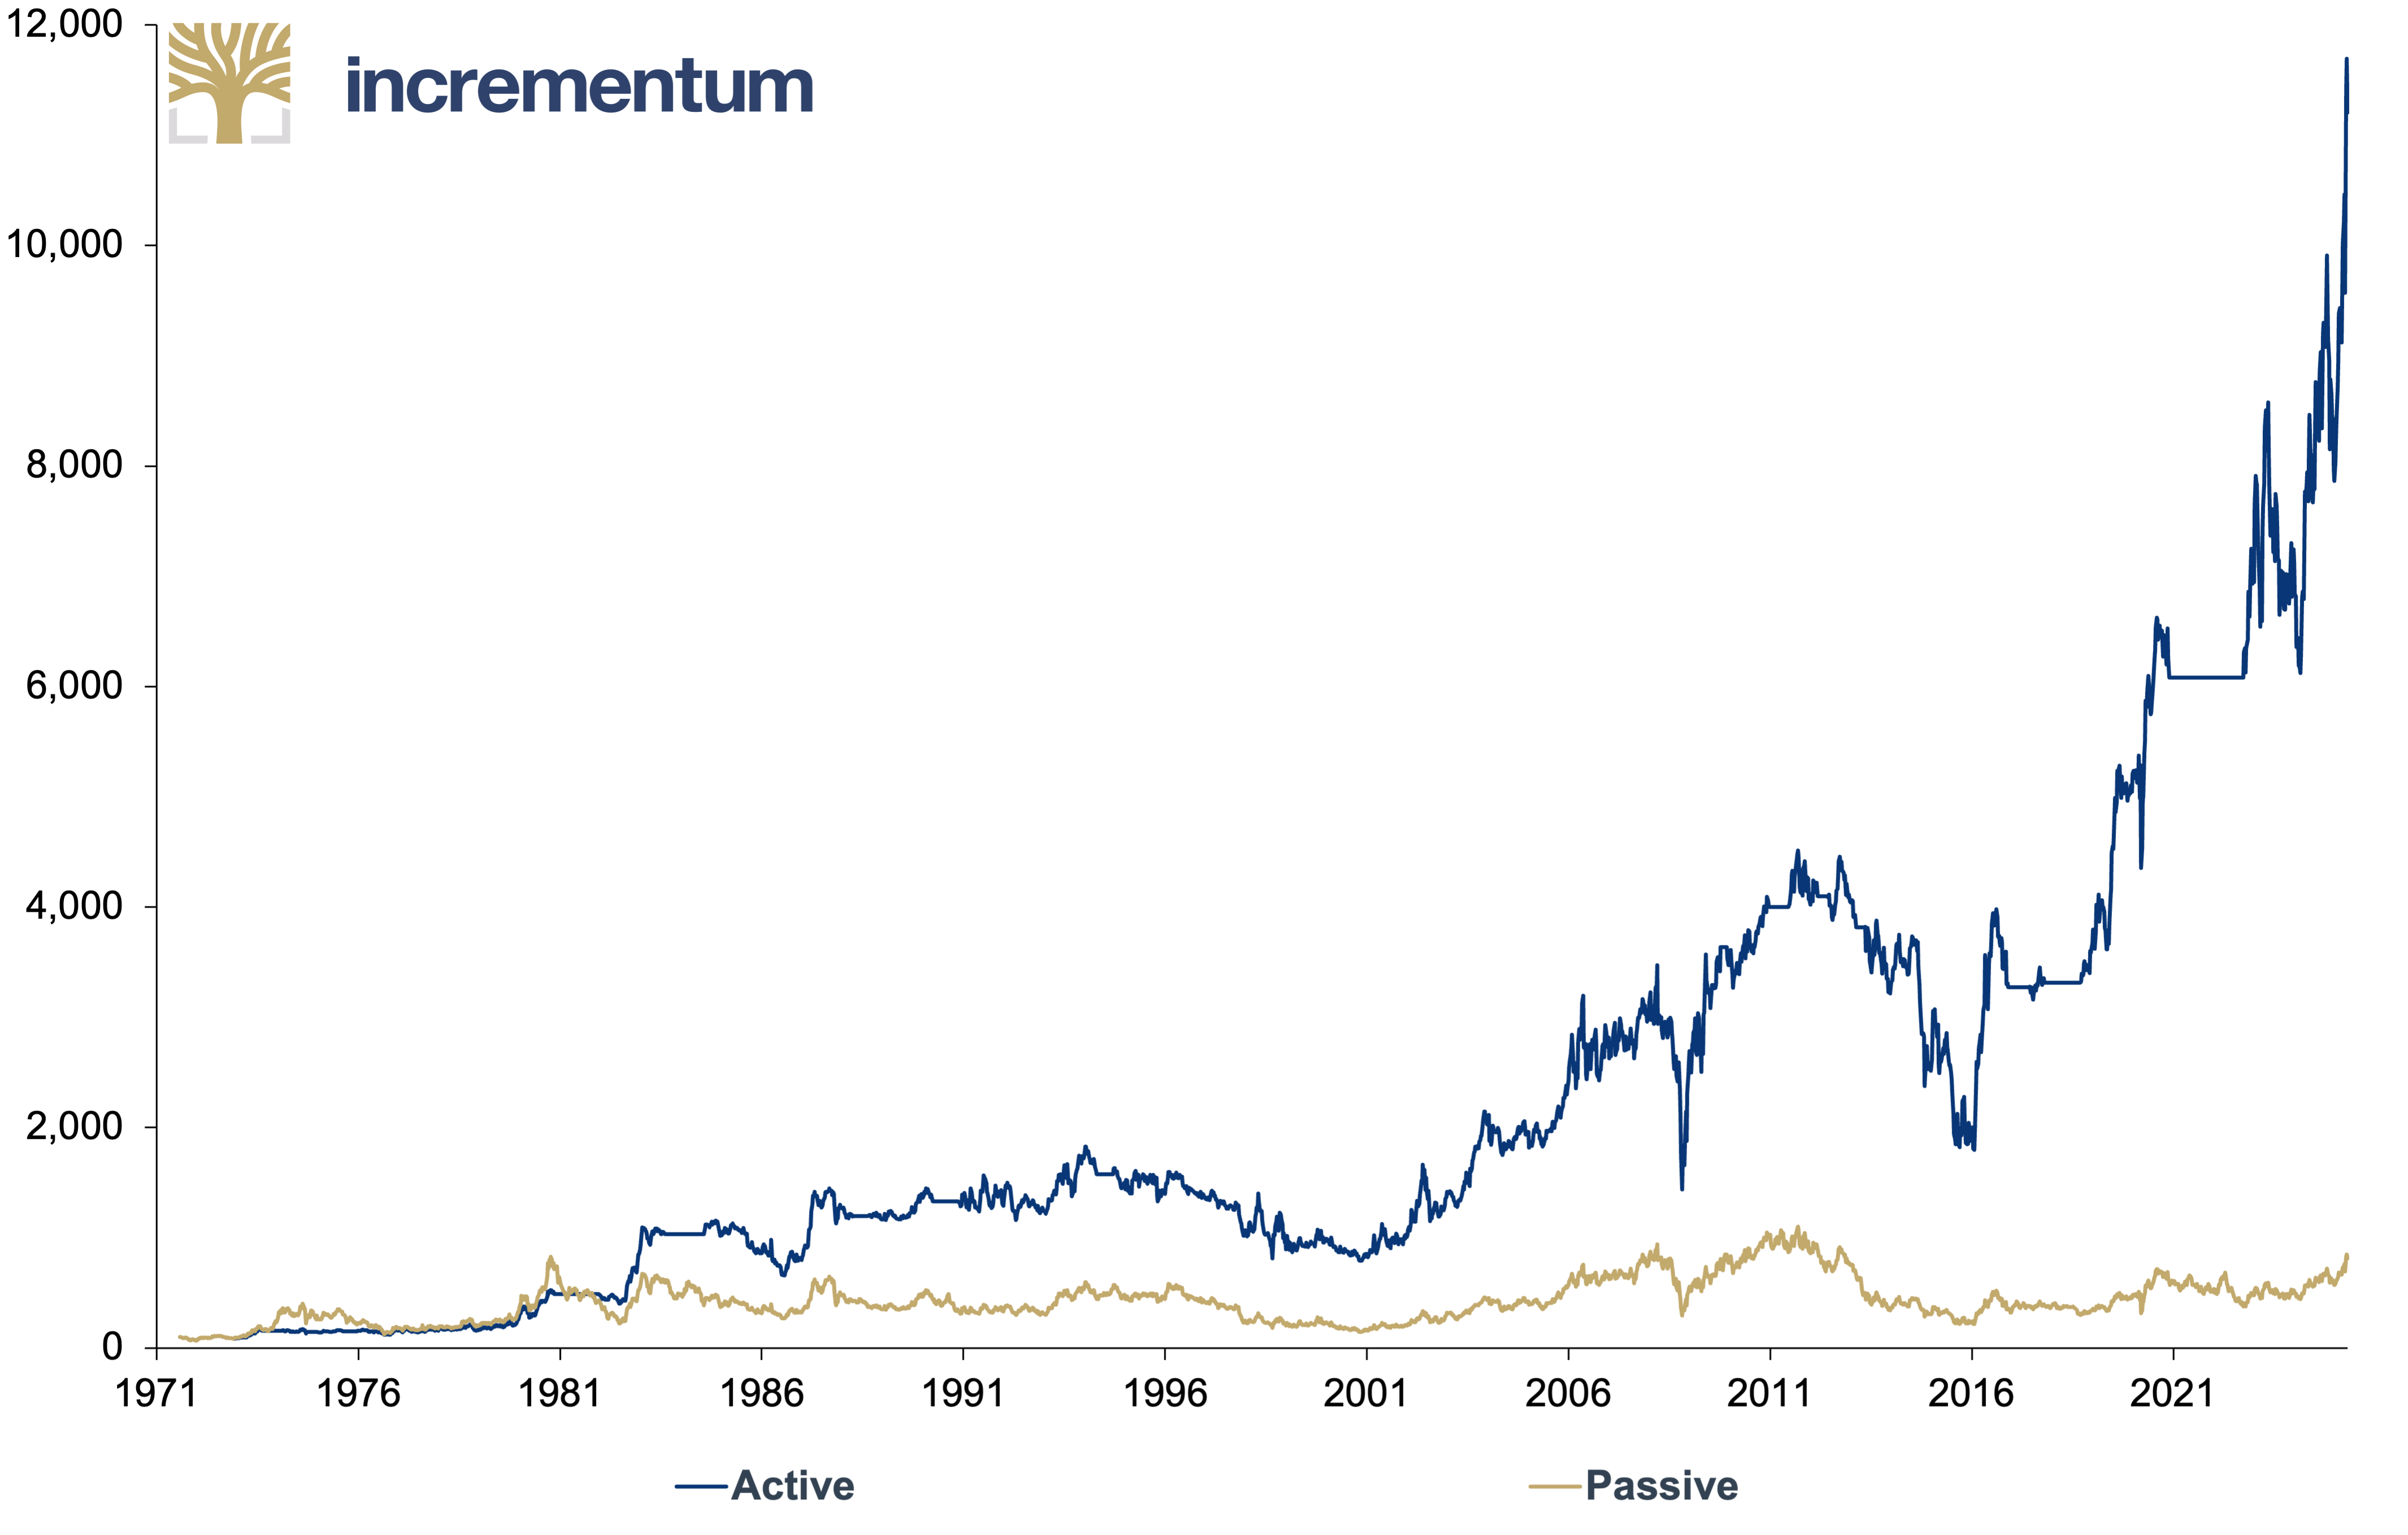
Source: LSEG, Incrementum AG
*BGMI = 01/1972–06/2006, GDX = 06/2006–
While a passive strategy has achieved around 716% since 1971 (CAGR of 3.98%), the active mining stock strategy has gained over 11,000% (CAGR of 9.17%). In this context, it is positive to note that the excess return was not achieved due to a period-dependent outperformance in a short period but consistently over the entire period. Therefore, the relative performance backtest results are independent of the time period.
Excess Return Active vs. Passive (lhs), and Gold Mining Stocks* (rhs, log), in USD, 07/1971–04/2025
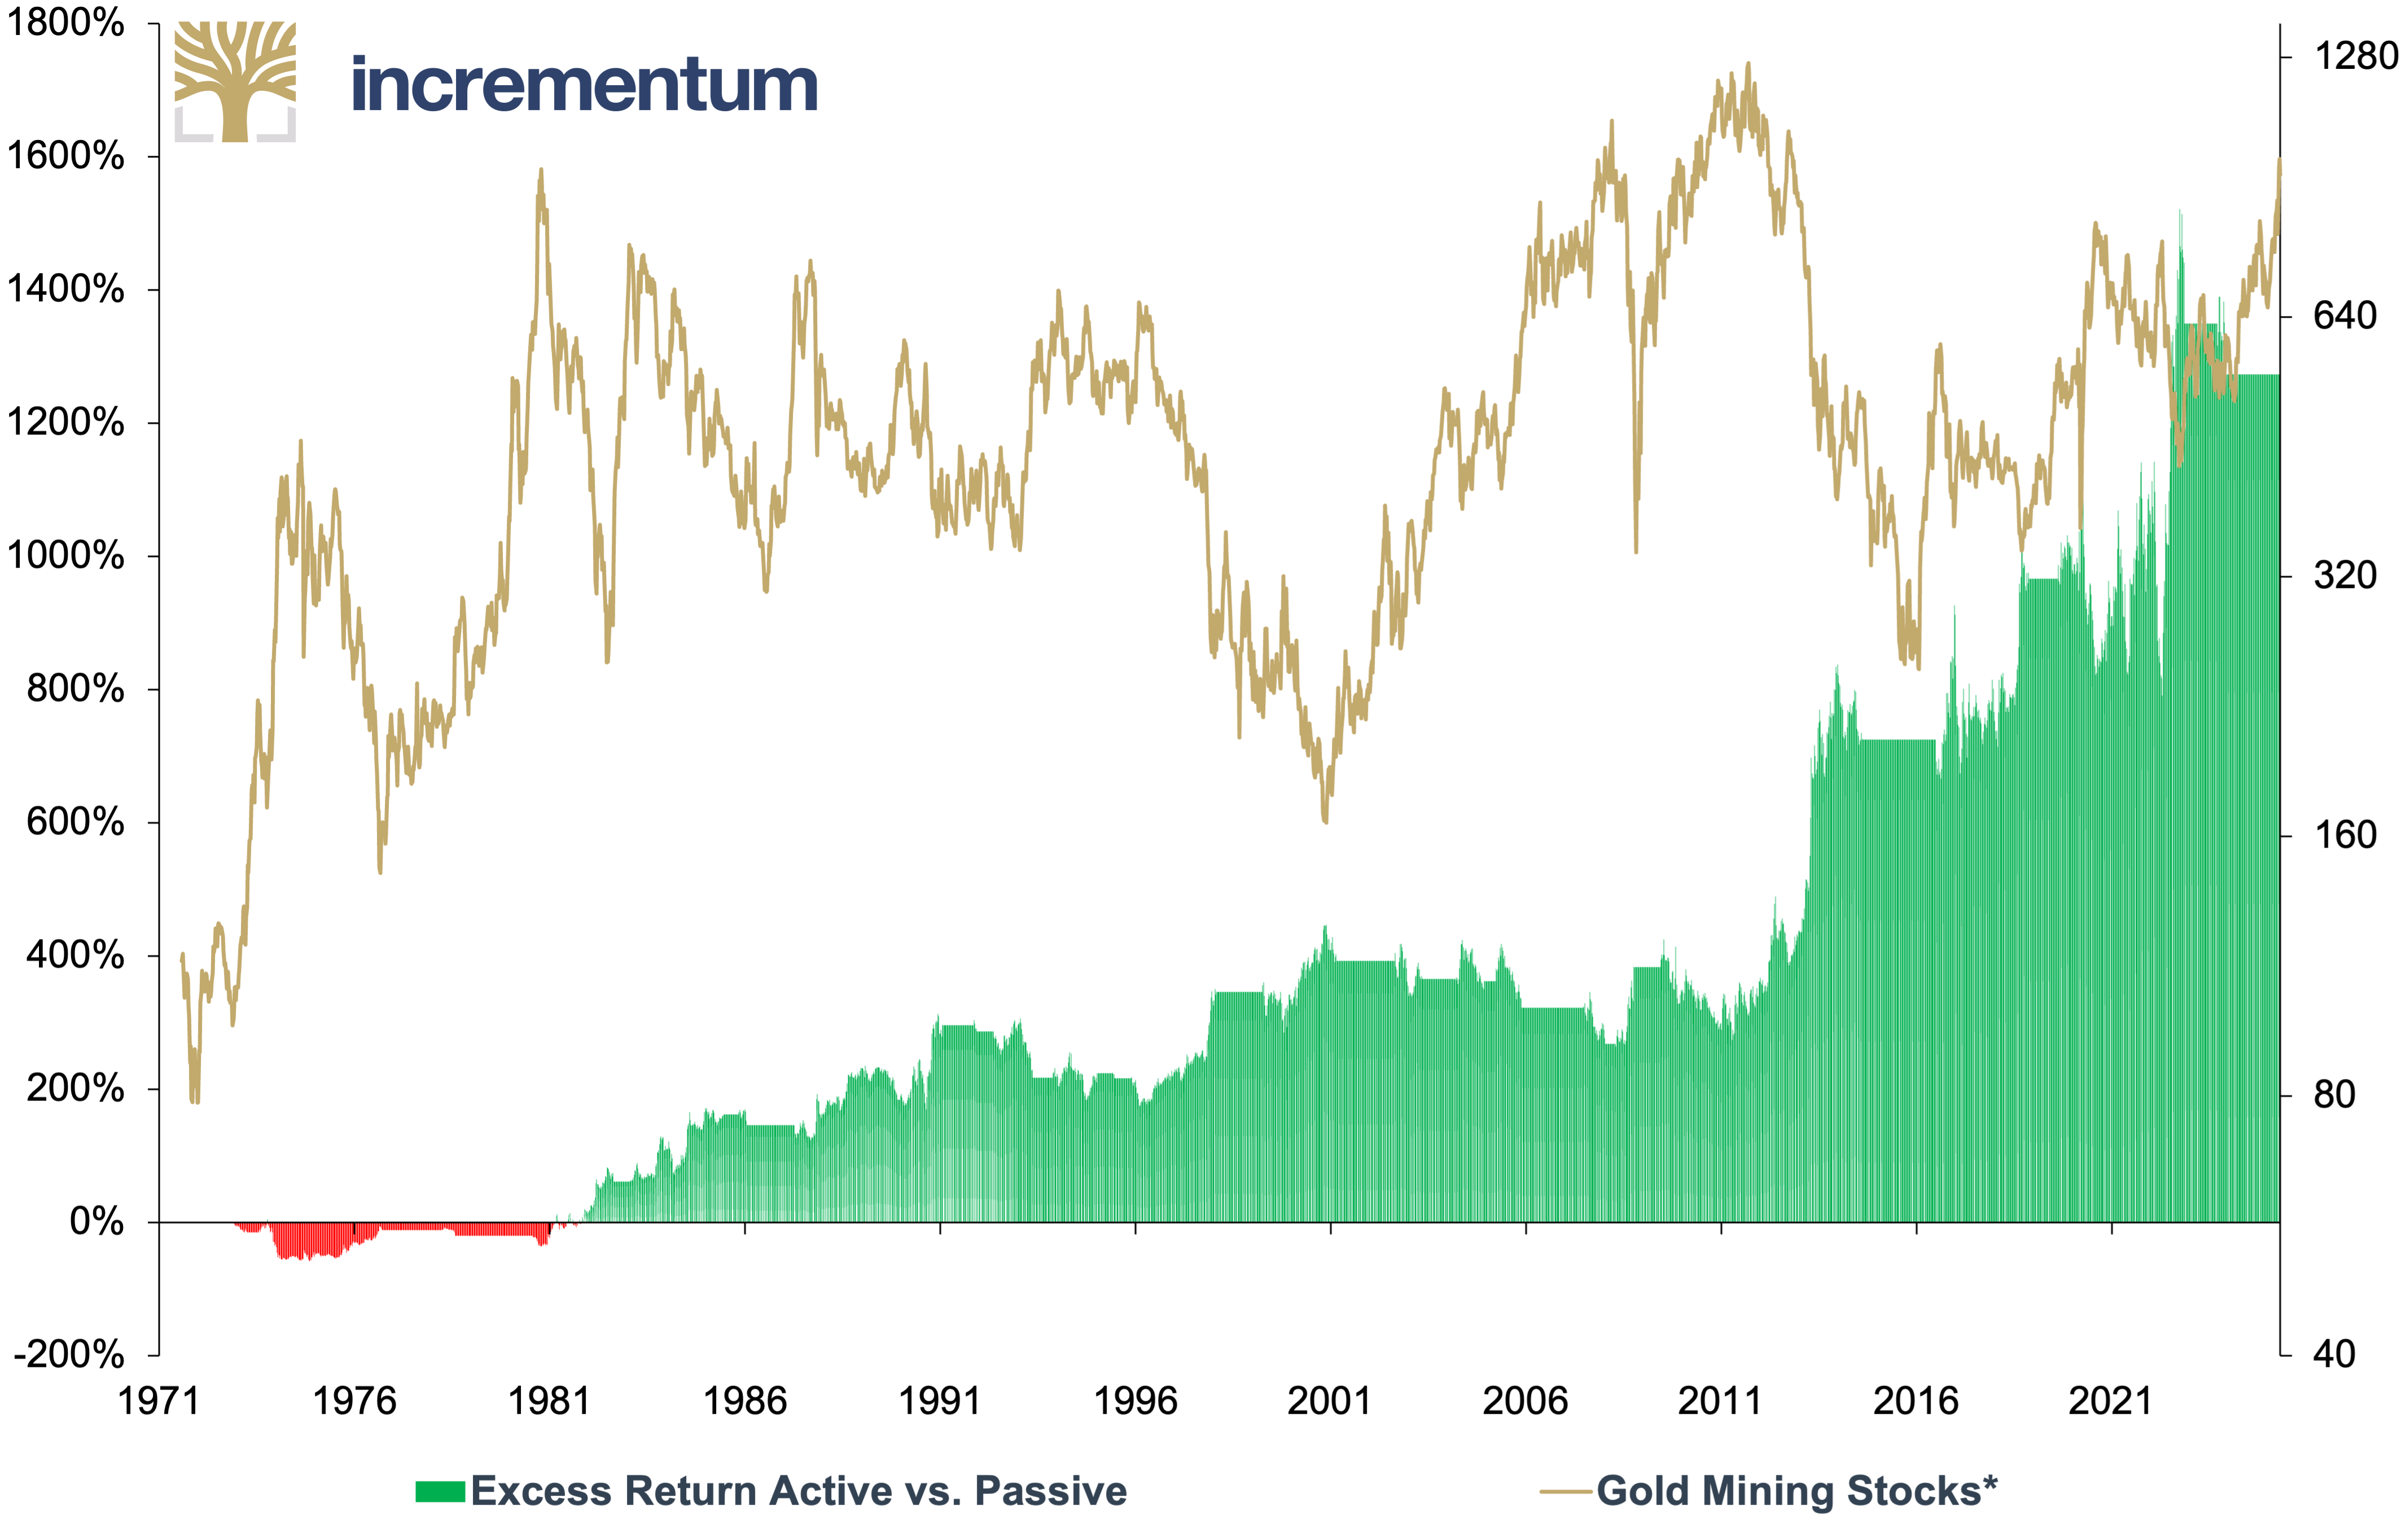
Source: LSEG, Incrementum AG
*BGMI = 01/1972–06/2006, GDX = 06/2006–
Previously, we made it clear that investing in gold mining stocks may be a deterrent for many investors due to their pronounced volatility. It is important to look at performance as part of the backtest and to analyze key risk figures and volatility.
The following chart illustrates the drawdown comparison between passive and active mining strategies using the Incrementum Active Aurum signal. The result is clear: the active strategy recorded significantly lower drawdowns. In addition, the annualized volatility of the active strategy is 26.19%, which is more than ten percentage points lower than the volatility of a passive strategy (36.76%).
Drawdown Comparison: Active vs. Passive Gold Mining Stocks Strategy*, 07/1971–04/2025
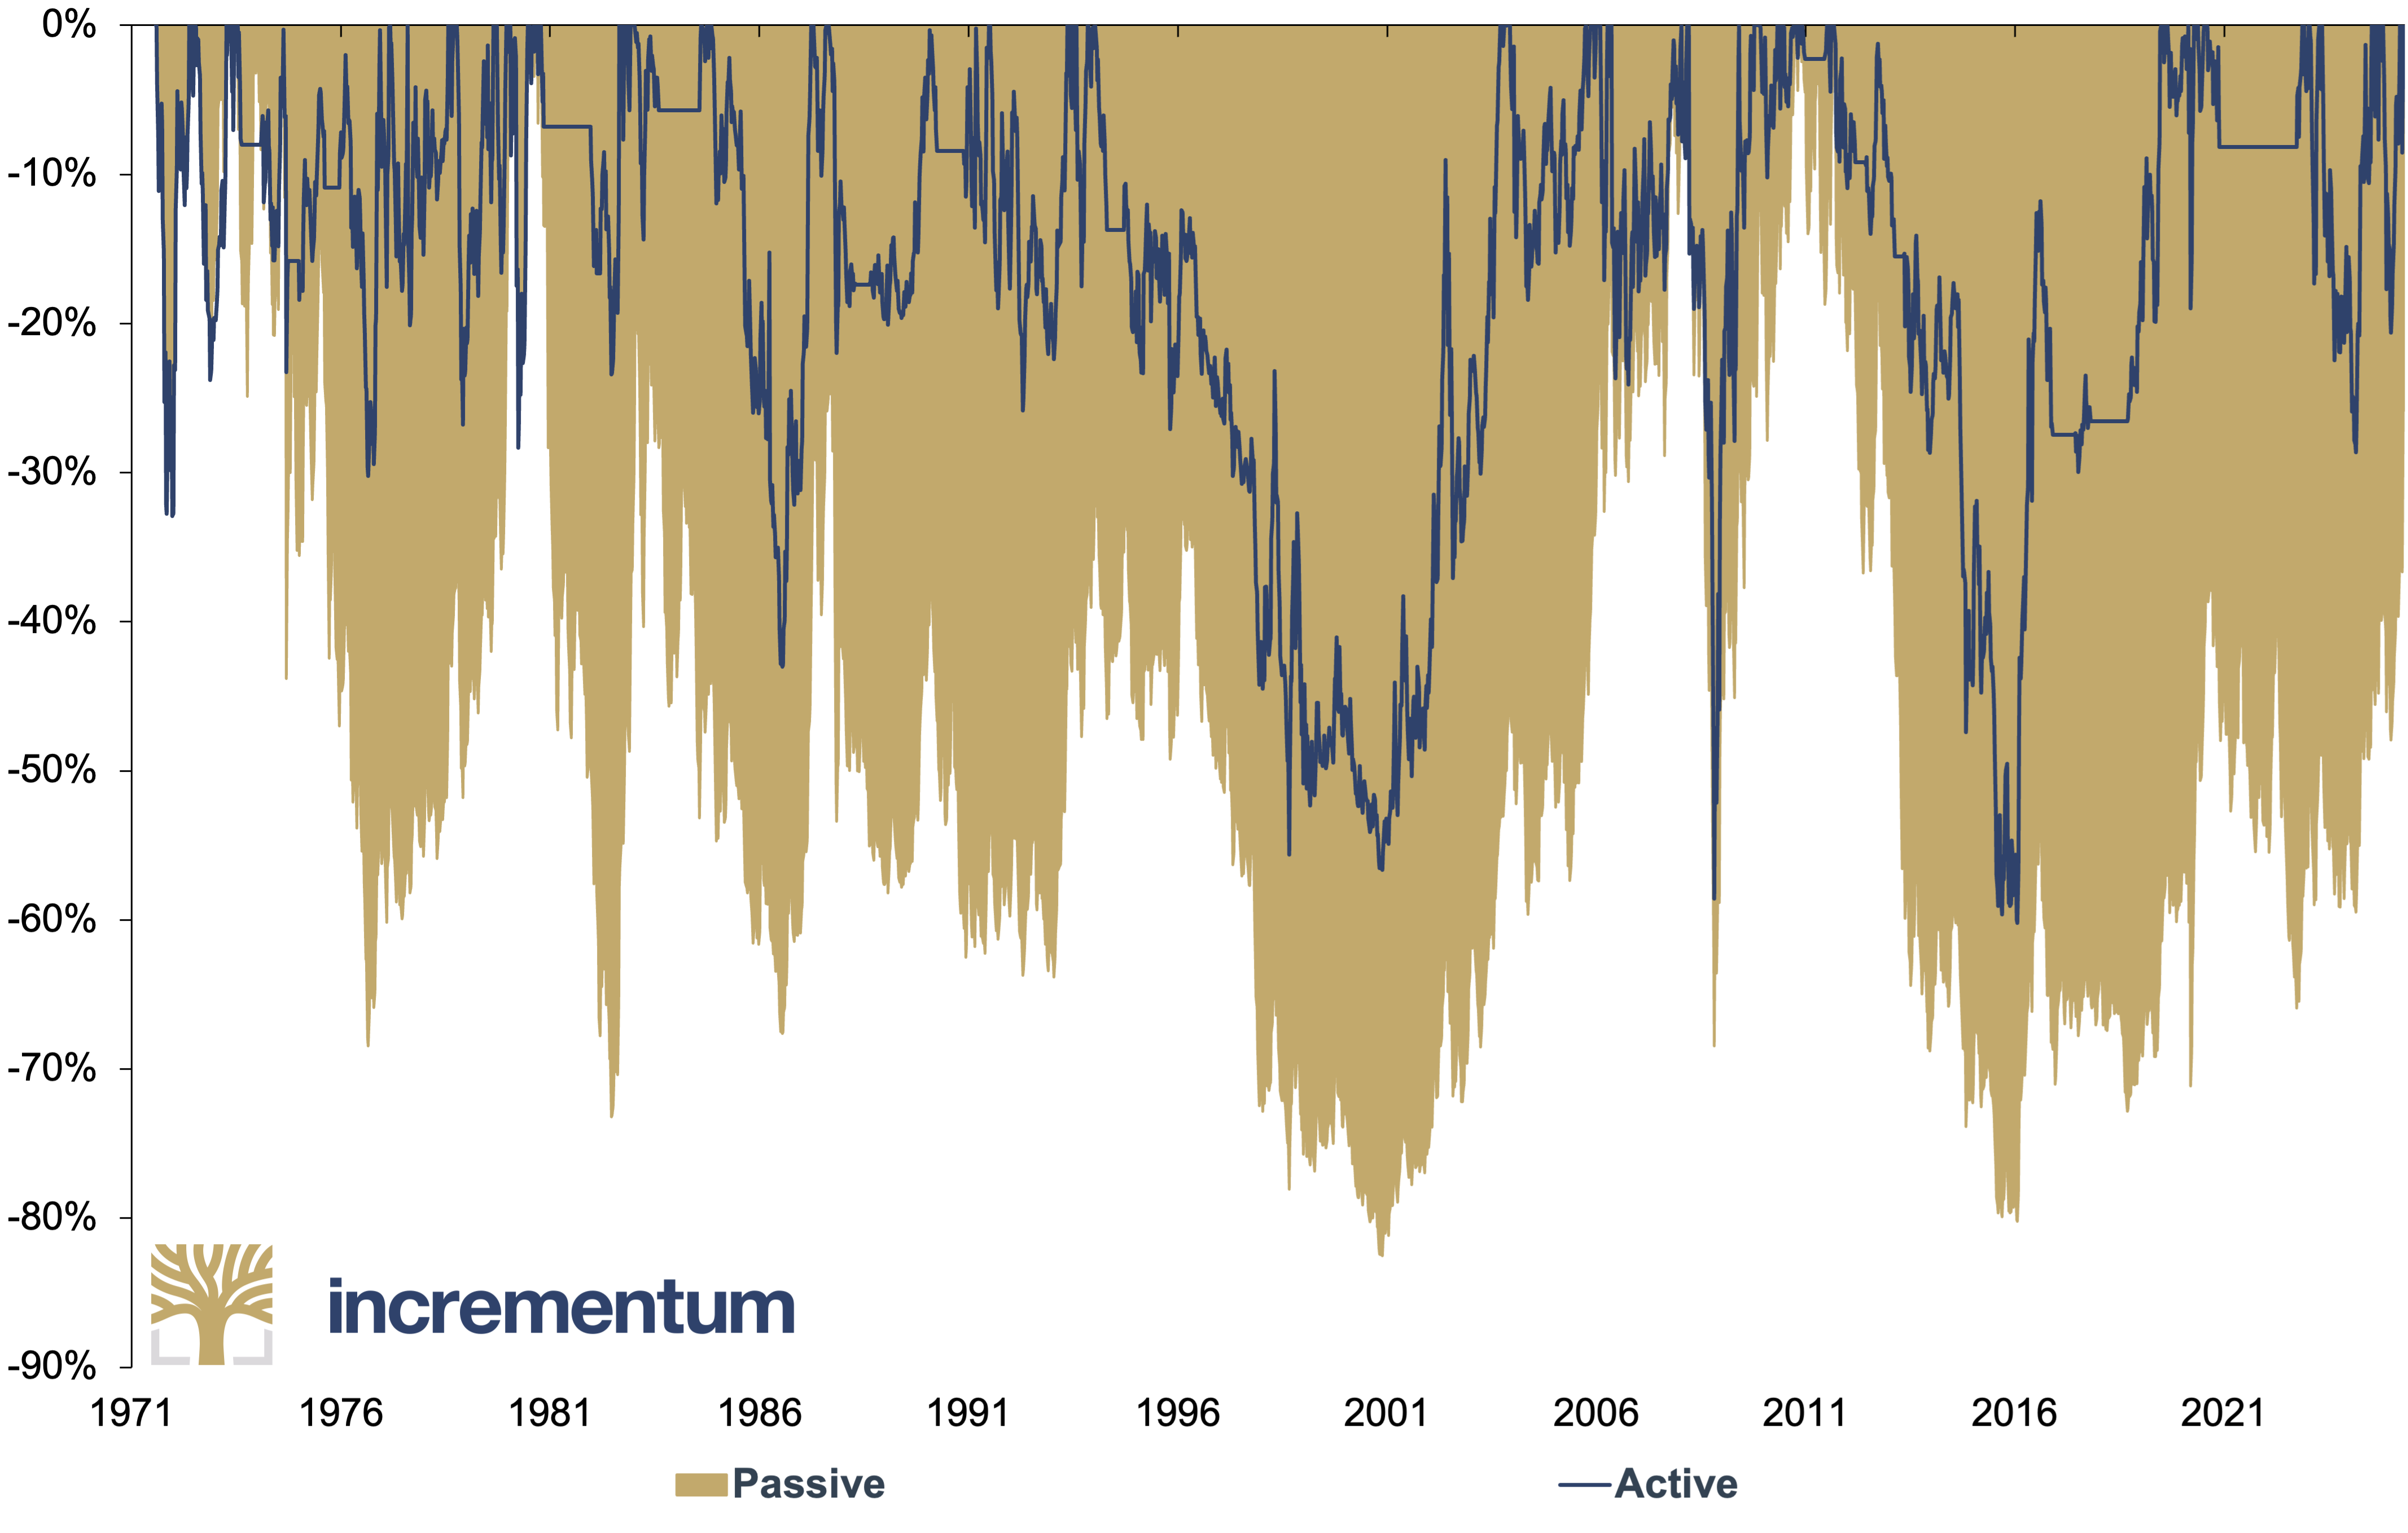
Source: LSEG, Incrementum AG
*BGMI = 01/1972–06/2006, GDX = 06/2006–
The results thus suggest that an active strategy supported by the Incrementum Active Aurum signal is superior to a passive strategy in terms of both performance and risk characteristics.
The signal enables an investment process that considers long-term market cycles and short-term volatility to better adapt the portfolio to changing market conditions. In the backtest, the Incrementum Active Aurum signal demonstrates significant outperformance relative to a passive mining stock strategy. This is illustrated by the following table, which lists both performance and risk figures.
Passive vs. Active Gold Mining Stock Strategies, in USD, 07/1971–04/2025
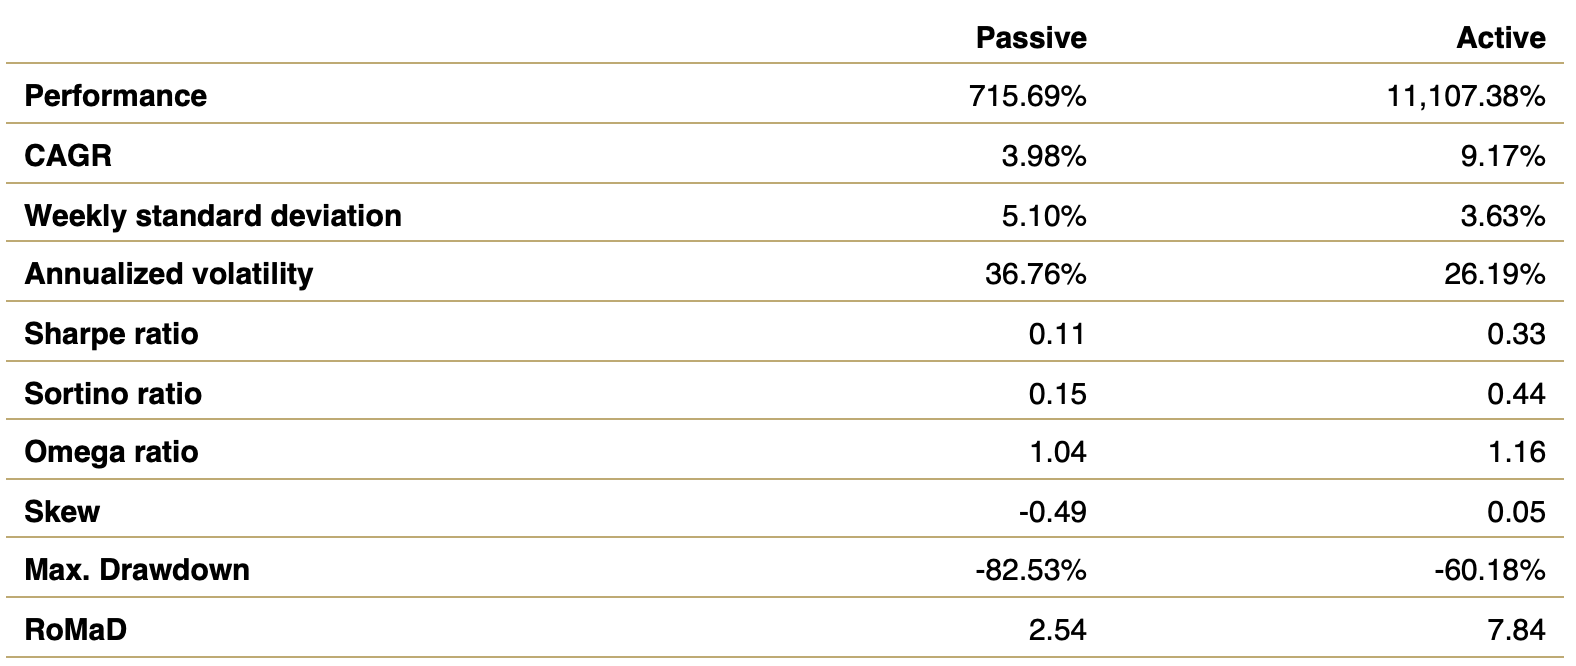
Source: LSEG, Incrementum AG
The Big Long on Gold: Mining Shares as a Strategic Lever
Having established the rationale for the active timing of mining shares, let us now look at prevailing valuations in the gold mining sector.
History has repeatedly demonstrated that tactical exposures to gold shares have delivered significant alpha during Federal Reserve easing cycles or equity market declines. Given that we are in the early stages of an easing cycle and anticipate heightened volatility and structural headwinds across U.S. equity markets in 2025, we view gold mining stocks as well-positioned for a sustained phase of relative outperformance.
Historical performance
In the following table, we present annual performances of spot gold, measured in US dollars, the Arca Gold Miners Index (GDM), the S&P 500, and the DXY, as well as annual averages for CPI, 10-year Treasury yields, and Federal Reserve funds. We have selected these series to identify which economic variables have been most correlated to the performance of gold and gold equities. For the record, we use the GDM as our proxy for gold equities because GDM is the index on which the popular VanEck Gold Miners ETF (GDX) is based.
Performance of Various Investments and Macroeconomic Indicators, 2000–2025 YTD
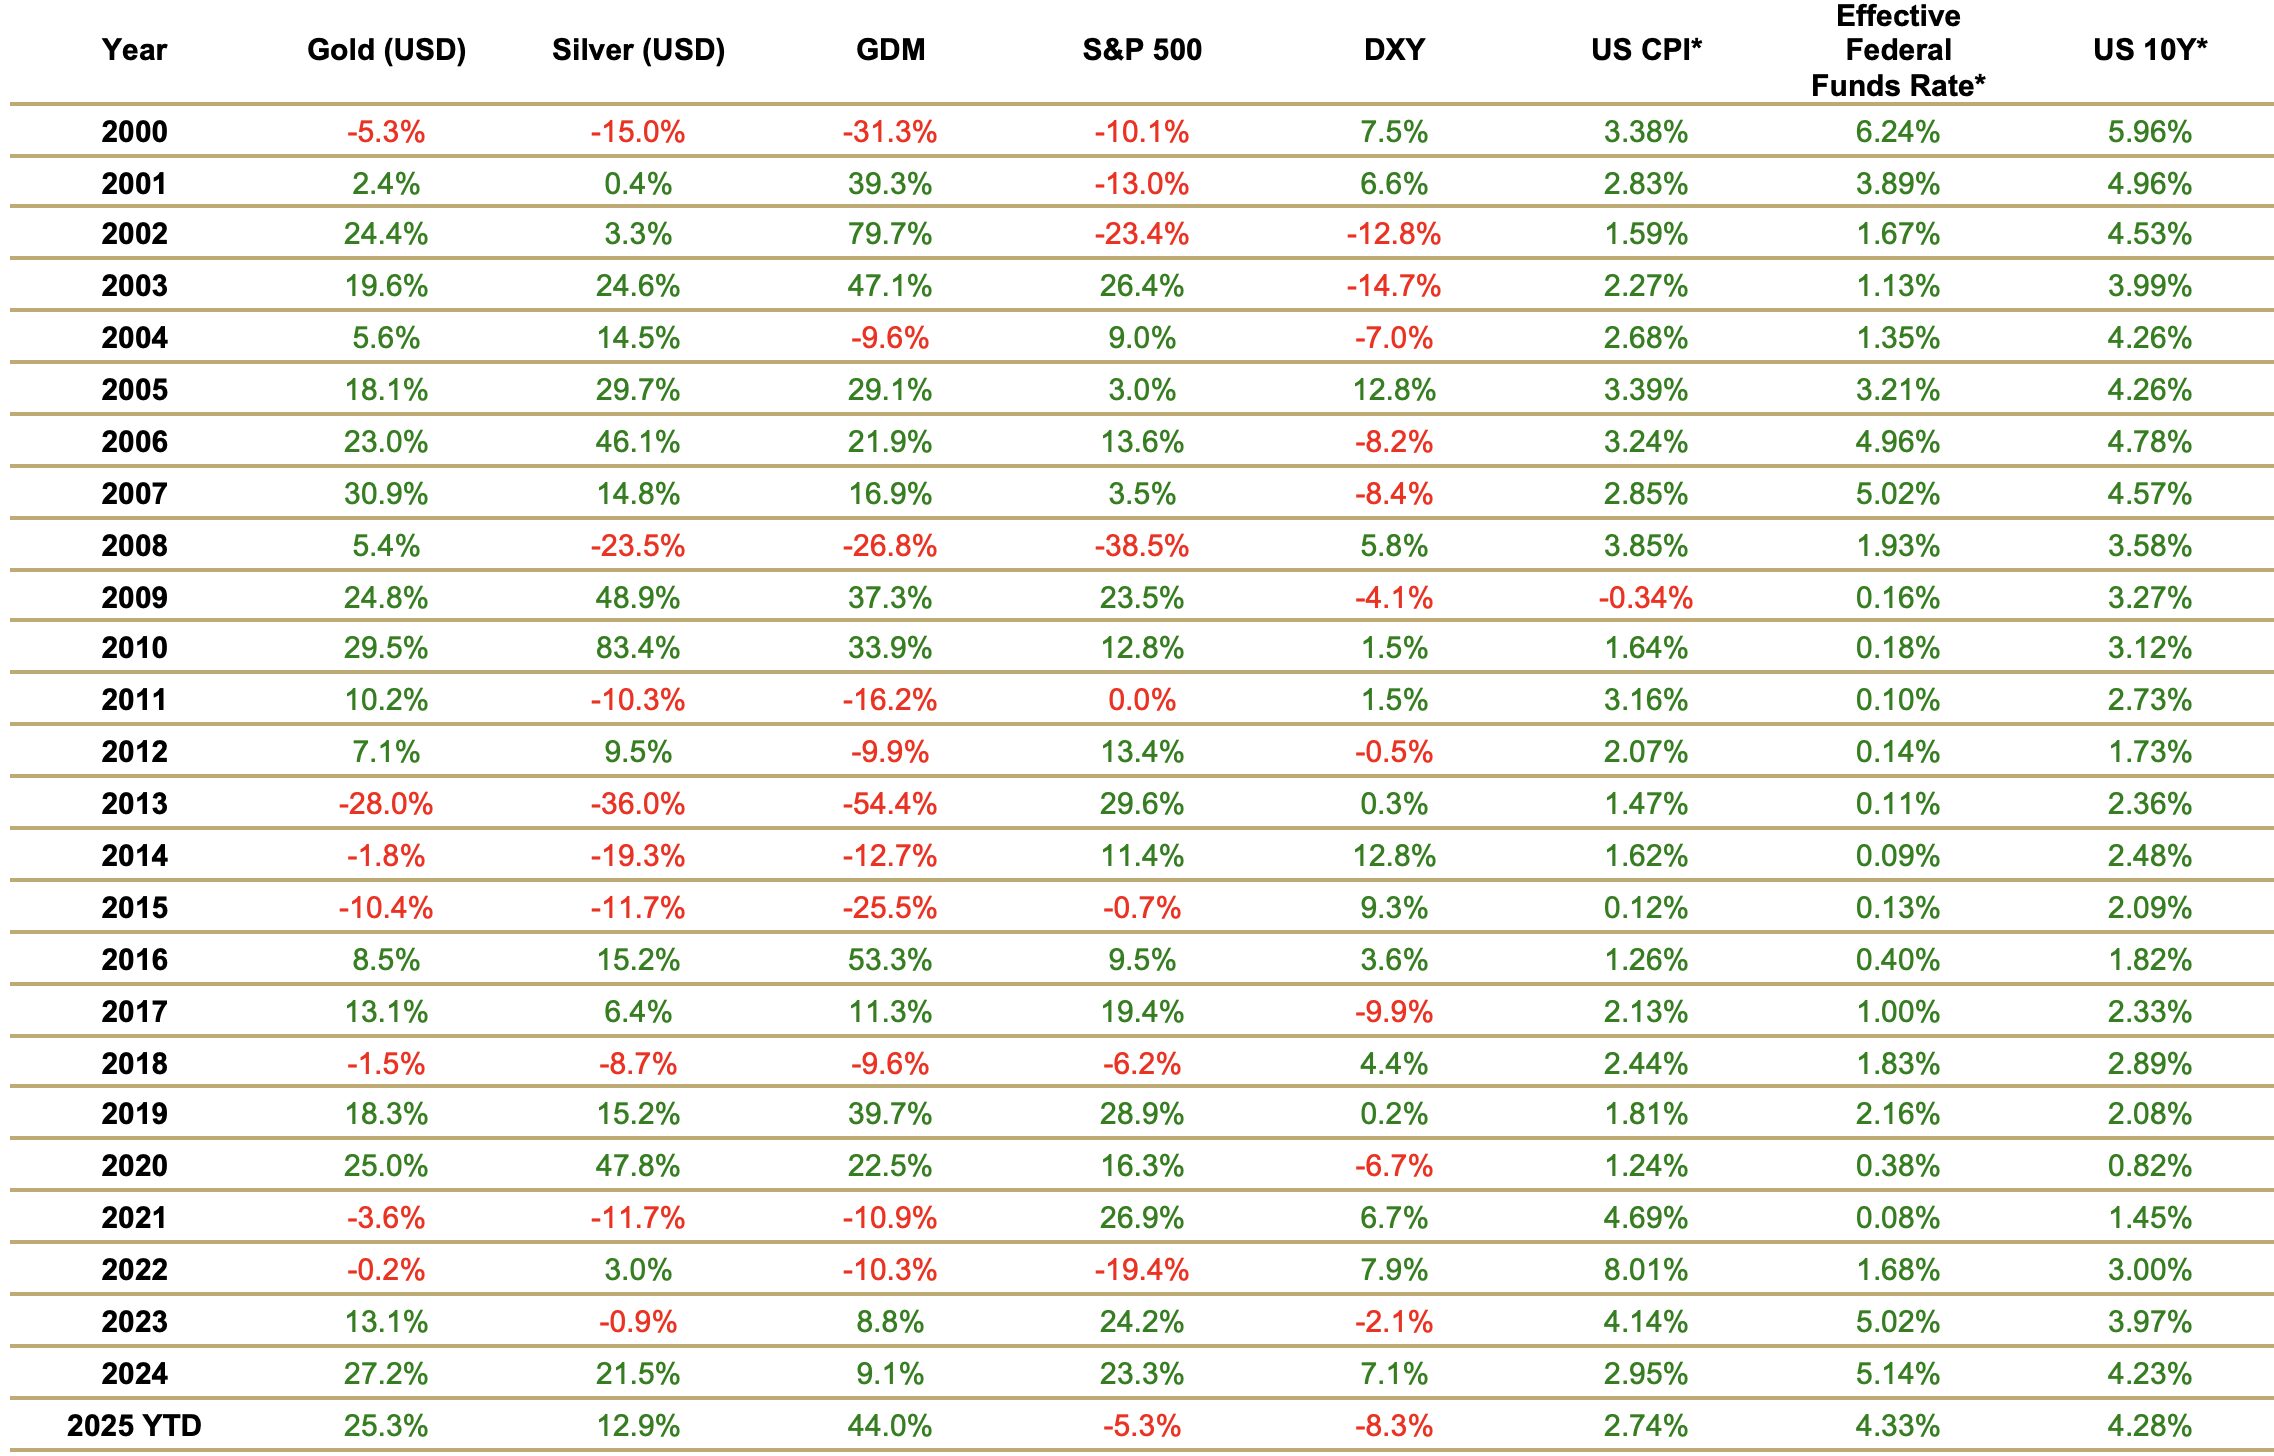
Source: LSEG (per 30/04/2025), Incrementum AG
*Annual Average
These statistics yield a few objective conclusions about the performance of gold and gold shares. Concerning gold, the data support the view that while gold prices can correlate to economic variables such as Federal Reserve funds, 10-year yields, and CPI over short periods, these correlations generally break down over the long run. Additionally, these figures corroborate the contention that gold’s negative correlation to the US dollar is its sole correlation, which tends to hold up over the long term. With respect to gold equities, this historical data confirms that the primary driver of gold share performance is the underlying performance of spot gold.
Gold shares and their inverse correlation to the S&P 500
On a more subjective level, we offer a few observations about the long-term performance of gold equities. First, the GDM Index (+768%) has substantially outperformed the S&P 500 Index (+566%) since 2001. Second, it is interesting to note that the GDM and S&P 500 have displayed a negative correlation for much of this time span. Indeed, the negative correlation between gold equities and broad equities is perhaps the most underappreciated aspect of gold shares’ investment utility.
Over the past decade, central bank liquidity has made it somewhat difficult for stocks to decline. However, on the few occasions when stocks have suffered significant drawdowns, gold shares have provided reliable portfolio protection.
- During the “long way from neutral” Q4 2018 market selloff (9/20/2018–12/24/2018), the S&P 500 declined 19.78%, while the GDM increased 11.37%, a 31.15% differential.
- Similarly, during the first 11 weeks of the 2022 stock market slide (12/28/2021–4/18/2022), the S&P 500 declined 8.25% while the GDM increased 29.83%, a 38.08% differential.
- And during the March 2020 Covid collapse (3/4/2020–3/23/2020), the S&P 500 declined 28.52% and the GDM declined 24.53%, but by 8/5/2020 the GDM had rallied 102.76% while the S&P 500 had only increased 48.73%, a 46.71% aggregate differential.
- And most recently, through 4/30/25, the S&P 500 had declined 9.36%, while the GDM Index had increased 17.25%, a 26.61% differential.
To us, the inverse-performance potential of gold equities is eminently logical. When market caps of stocks like Nvidia fluctuate hundreds of billions of dollars per day, digging the earth’s crust for four parts per billion element is unlikely to draw a big crowd. On the other hand, as the market declines of Q4/2018, March 2020, and Q1 2025 demonstrated, when stocks do go down, they tend to go down hard these days.
Gold shares during Federal Reserve pivots
Moreover, gold shares have historically proven to be one of the best-performing asset classes during the early phases of a Federal Reserve pivot to an easing posture.
By way of example, there have been five prominent Federal Reserve policy shifts toward an easing posture since 2000. Below, we outline comparative performance statistics for the S&P 500, spot gold, and the GDM immediately following these Federal Reserve policy changes. The outperformance of gold shares has been nothing short of spectacular.
- On January 3, 2001, the Federal Reserve responded to the bursting of the dotcom bubble by cutting the federal funds rate from 6.50% to 6.00%, commencing an easing cycle that would take rates down to 1.00%. During the following 17 months through 5/28/2002, the S&P 500 declined 18.76%, spot gold rose 20.92%, and the GDM soared 177.87%.
- On November 25, 2008, in response to the spiraling GFC, then Federal Reserve Chair Ben Bernanke finally embraced the nuclear option of quantitative easing and launched QE1. During the following 12 months (through 12/2/09), the S&P 500 increased 32.76%, spot gold rose 47.90%, and GDM climbed 122.32%.
- On January 19, 2016, in an effort to quell global market stress triggered by the Federal Reserve’s 12/16/2016 liftoff, Janet Yellen signaled a pause in rate hikes. Ultimately, the Federal Reserve did not attempt a second hike until 12 months later. During the seven months following Chair Yellen’s mea culpa, i.e., through 8/12/2016, the S&P 500 rose 17.59% and spot gold 22.86%, while GDM exploded 147.36%.
- On December 19, 2018, Chair Powell (defiantly) hiked rates 25 basis points to 2.50%, predicted two 2019 hikes, and declared Federal Reserve balance sheet runoff was “on autopilot,” “working well,” and “not subject to review.” Within days, market reaction – and pressure from President Trump – was so severe that the Federal Reserve executed one of its sharpest monetary policy U-turns in history. The Federal Reserve abandoned rate hikes in early January 2019, shut down QT by June 2019, and cut rates by July 2019. During the nine months following Chair Powell’s fateful hike, i.e. through 9/4/2019, the S&P 500 rose 18.87%, spot gold rose 24.89%, and GDM increased 54.59%.
- On March 16, 2020, the Powell Federal Reserve responded to the unfolding Covid crisis by cutting Federal Reserve funds by 100 basis points, from 1.25% to 0.25%. During the next five months through 8/5/2020, the S&P 500 rose 40.42% and spot gold 34.61%, while GDM soared 104.30%.
Importantly, these time frames have been tailored to present gold equity performance in its strongest light. While it is impossible to predict how gold shares will perform during future Federal Reserve easing cycles, the fact remains that gold equities have historically proven to be a potent tactical investment during the early stages of a Federal Reserve pivot to an easing posture.
HUI, in USD (lhs), and Federal Funds Rate (rhs), 01/2000–04/2025
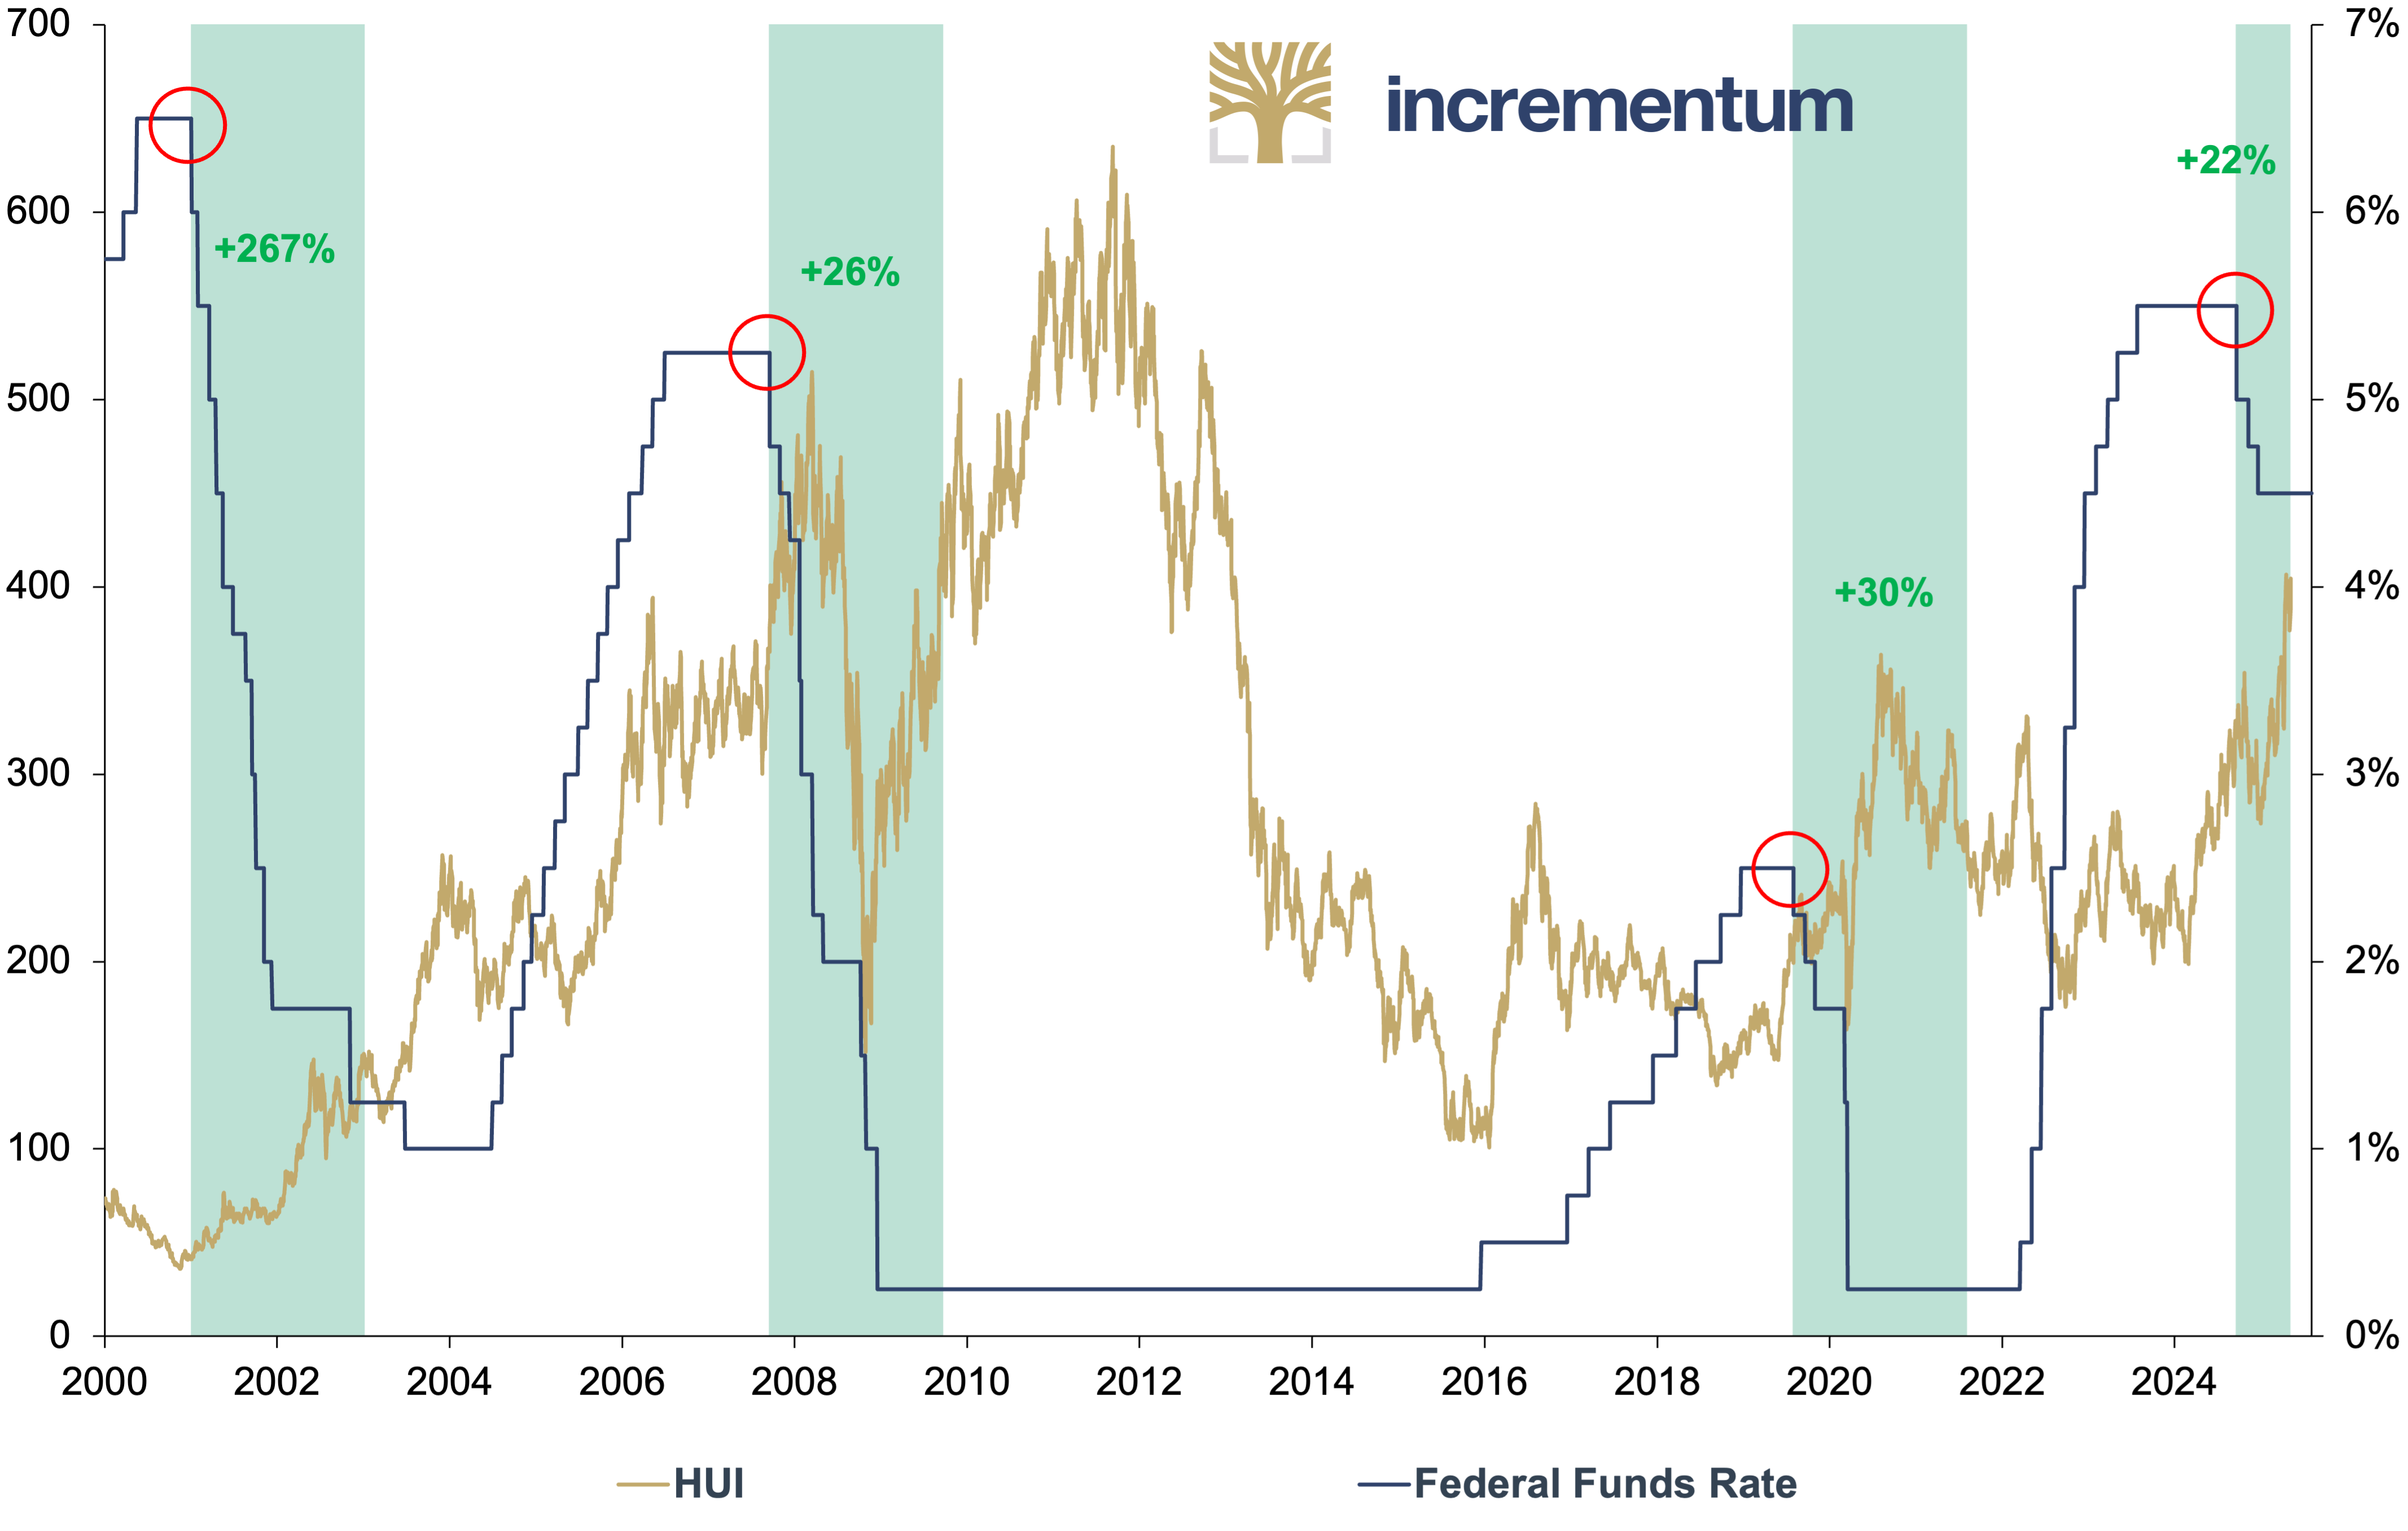
Source: LSEG, Incrementum AG
Looking ahead, the Federal Reserve initiated a rate-cutting cycle at its September 2024 FOMC meeting, which now stands at 100 basis points. During the seven-plus subsequent months through April 2025, the S&P 500 had declined 1.16%, while the GDM had increased 24.43%. The alpha generated by gold shares comes in bursts, but when prudently deployed, it can dramatically alter long-term portfolio returns.
Capital discipline and profitability
Today’s gold mining industry still fights lingering perceptions of poor financial discipline and limited profitability. Dating back to industry write-downs in the early 2010s, this reputation for capital mismanagement is no longer warranted.[2] Capital discipline has become a primary focus of the contemporary gold mining industry. From the rigor of long-term stress testing to the transparency of fully loaded cost reporting, industry financial controls have taken enormous strides in the past decade.
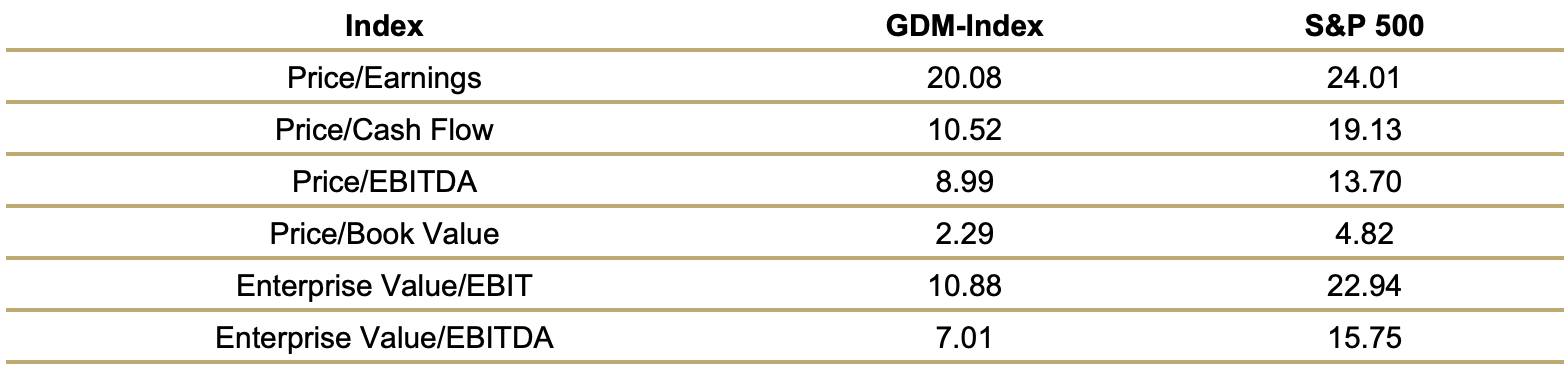
Similarly, it is important not to confuse frequent capital market financings with poor capital management. As long as management is executing and milestones are met, capital intensity should not be interpreted as heightened investment risk. All in all, financial discipline in the gold mining industry far exceeds consensus perception. In fact, as demonstrated by the Q1/2025 financial metrics in the following table, the capital and leverage ratios of companies in the GDM compare quite favorably to the S&P 500.
Debt Ratios: GDM Index and S&P 500, Q1/2025
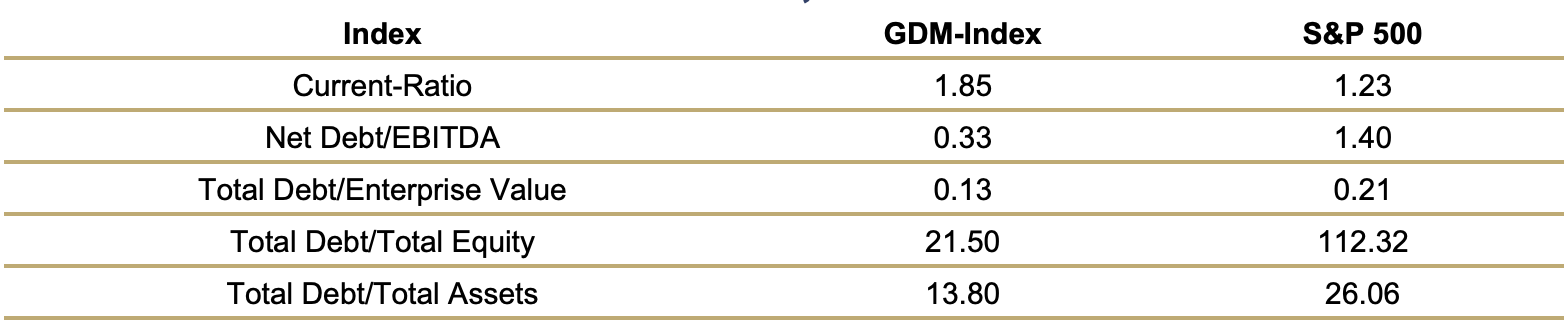
Source: Bloomberg, Incrementum AG
Over the years, the capital intensity and operational complexity of gold mining have earned the industry a reputation for challenging profitability. However, due to improved management and capital discipline, today’s gold mining industry is far more profitable than commonly perceived. In fact, gold mining companies enjoy profit margins that compare quite favorably to those of the S&P 500.
Profitability Ratios: GDM Index and S&P 500, Q1/2025
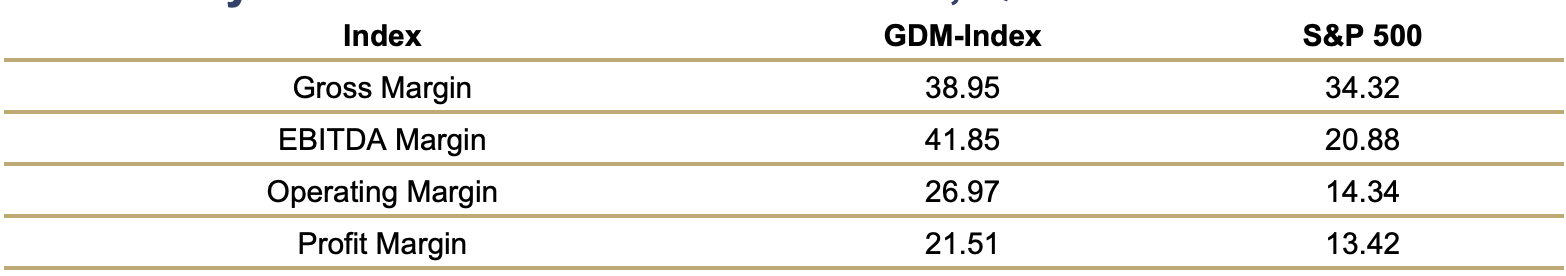
Source: Bloomberg, Incrementum AG
Historically cheap
Gold shares are historically cheap, whether measured against net asset value, production, reserves or book value. We find it baffling that gold equities are trading at their deepest discount to the gold price since the early stages of the post-2000 runup. In the chart below, Scotiabank graphs the average and weighted average discounts of producers in the Scotiabank universe for gold since 2008.
Average and Weighted Average Share Price of Gold Producers, in % of Gold (lhs) and Gold (rhs), in USD, 01/2008–04/2025
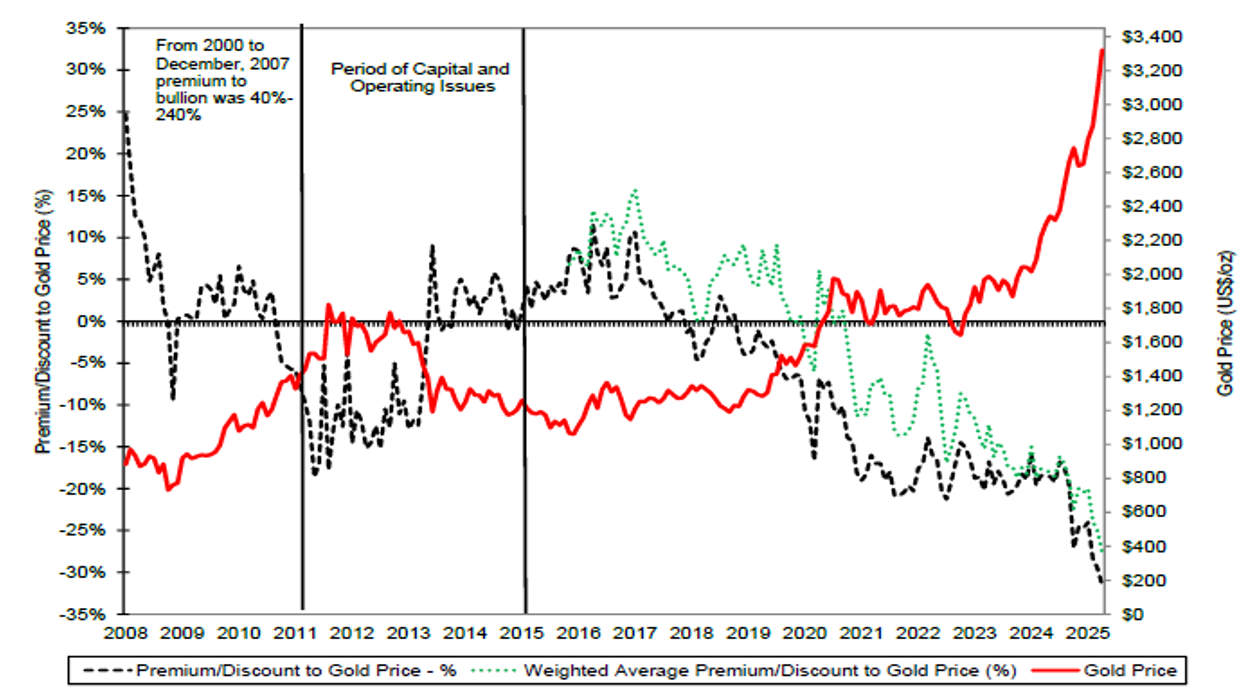
Source: Scotiabank
To investors comfortable with the Magnificent 7 market dynamics, the intrinsic value of gold producers may hold limited appeal. But for investors concerned about stretched equity valuations, approaching recession, or systemic liquidity challenges, the opportunity to purchase high-quality mining assets at such a steep discount to a gold price poised for significant gains is a golden investment opportunity. It is no coincidence that high-profile contrarian investors, such as Elliott Management’s Paul Singer, are emerging in the gold sector.
Outlook
During 2024, the S&P 500 increased 25%, bringing its two-year return to a gaudy 57.8% and marking just the fourth occasion in 150 years the Index posted 20%+ gains in consecutive years. In retrospect, 2024’s equity rally was driven by three developments: the Fed’s easing pivot, AI exuberance, and optimism over Trump’s pro-growth agenda. Currently, each of these fundamentals is undergoing a downshift.
We believe US equities are due for a rough ride for the remainder of 2025. With gold setting all-time highs, we expect generalist investors to gravitate to the safety of hard assets and the earnings leverage of gold miners. As shown in the table, once investors begin searching for attractive sectors outside the Magnificent 7, they are likely to be surprised by how attractive gold share valuations have become.
Valuation Ratios: GDM Index and S&P 500, Q1/2025
Source: Bloomberg, Incrementum AG
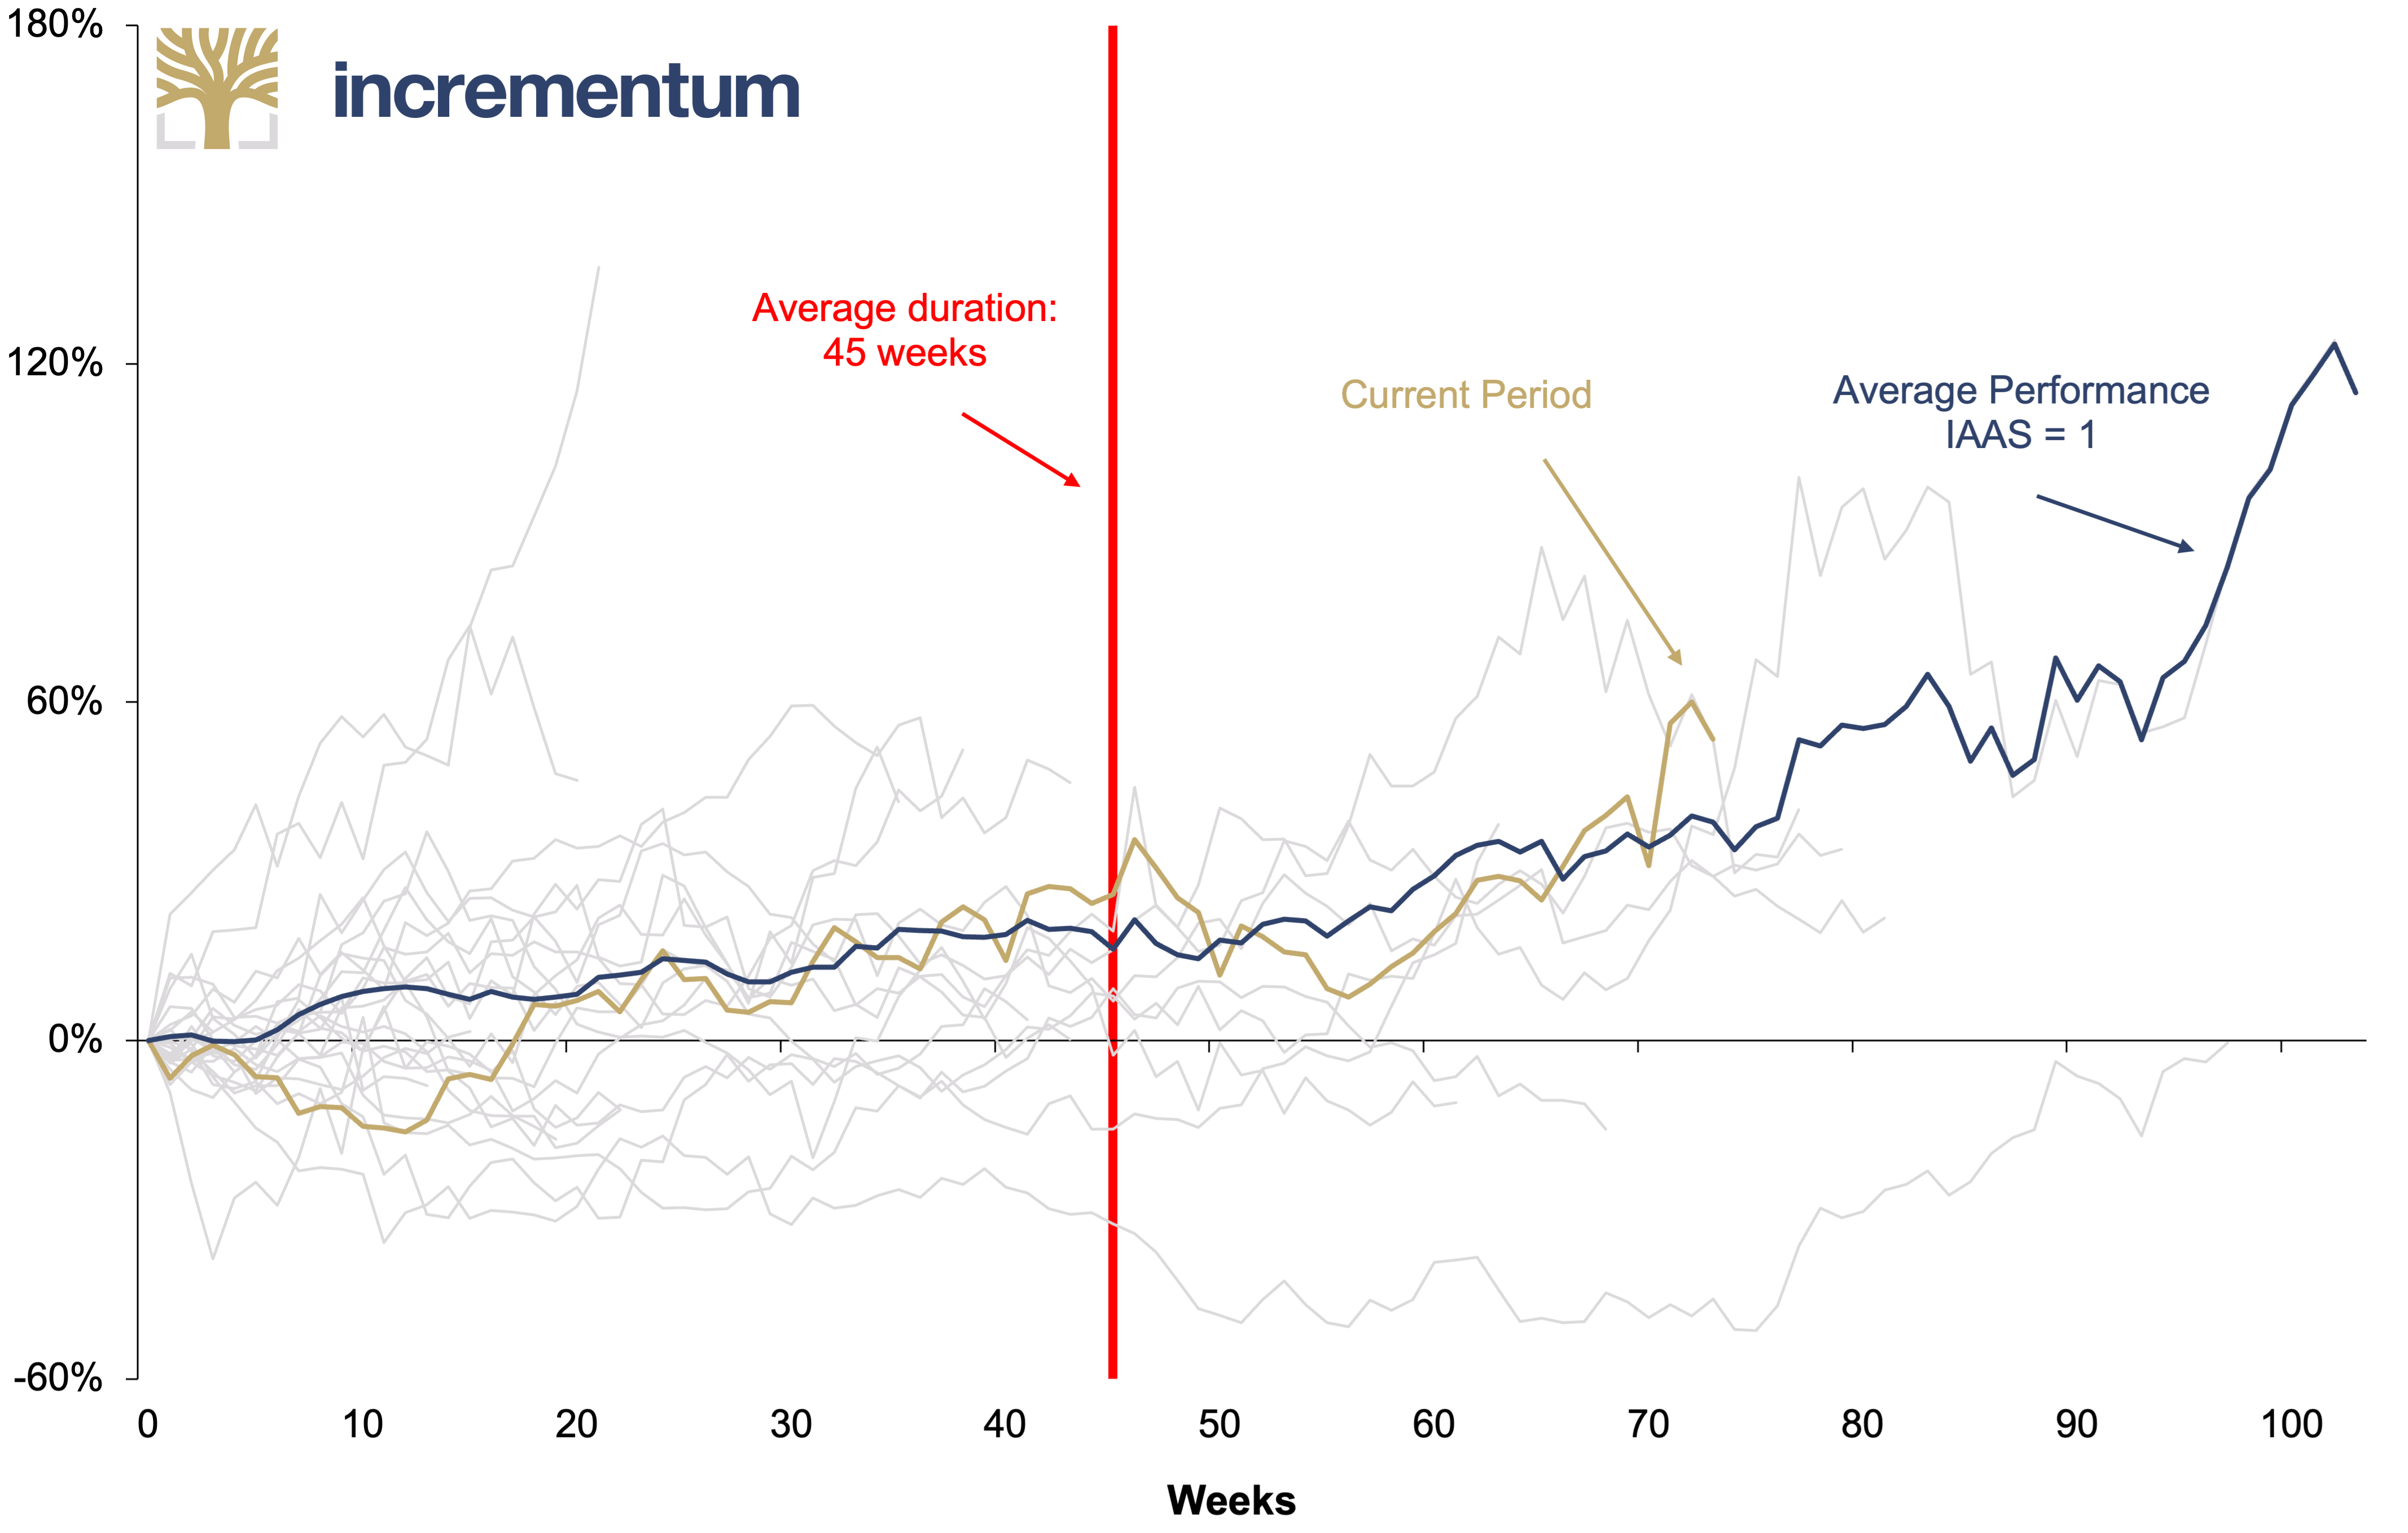
The time may have finally come for gold mining stocks, as indicated by the Incrementum Active Aurum Signal. Since December 2023, it has been recommending an offensive positioning. Compared to past periods of offensive signal phases, we are already in an advanced stage. Historically, the average performance during these phases has been 23% over a 45-week span. Currently, with a performance of 53% over 74 weeks, we are already exceeding these averages. Nevertheless, the intact offensive signal still points to further upside potential in the ongoing cycle.
Gold Mining Stocks Performance*, if Incrementum Active Aurum Signal = 1, in USD, 08/1971–04/2025
Source: LSEG, Incrementum AG
*BGMI = 01/1971–06/2006, GDX = 06/2006–
The last interest rate hike cycle had a significant impact on investors’ risk tolerance. The wheat was separated from the chaff. A slightly increasing risk appetite is evident in the following chart. Since 2024, junior miners (GDXJ) have been gradually showing renewed relative strength compared to the seniors (GDX).
GDXJ/GDX Ratio, 01/2010–04/2025
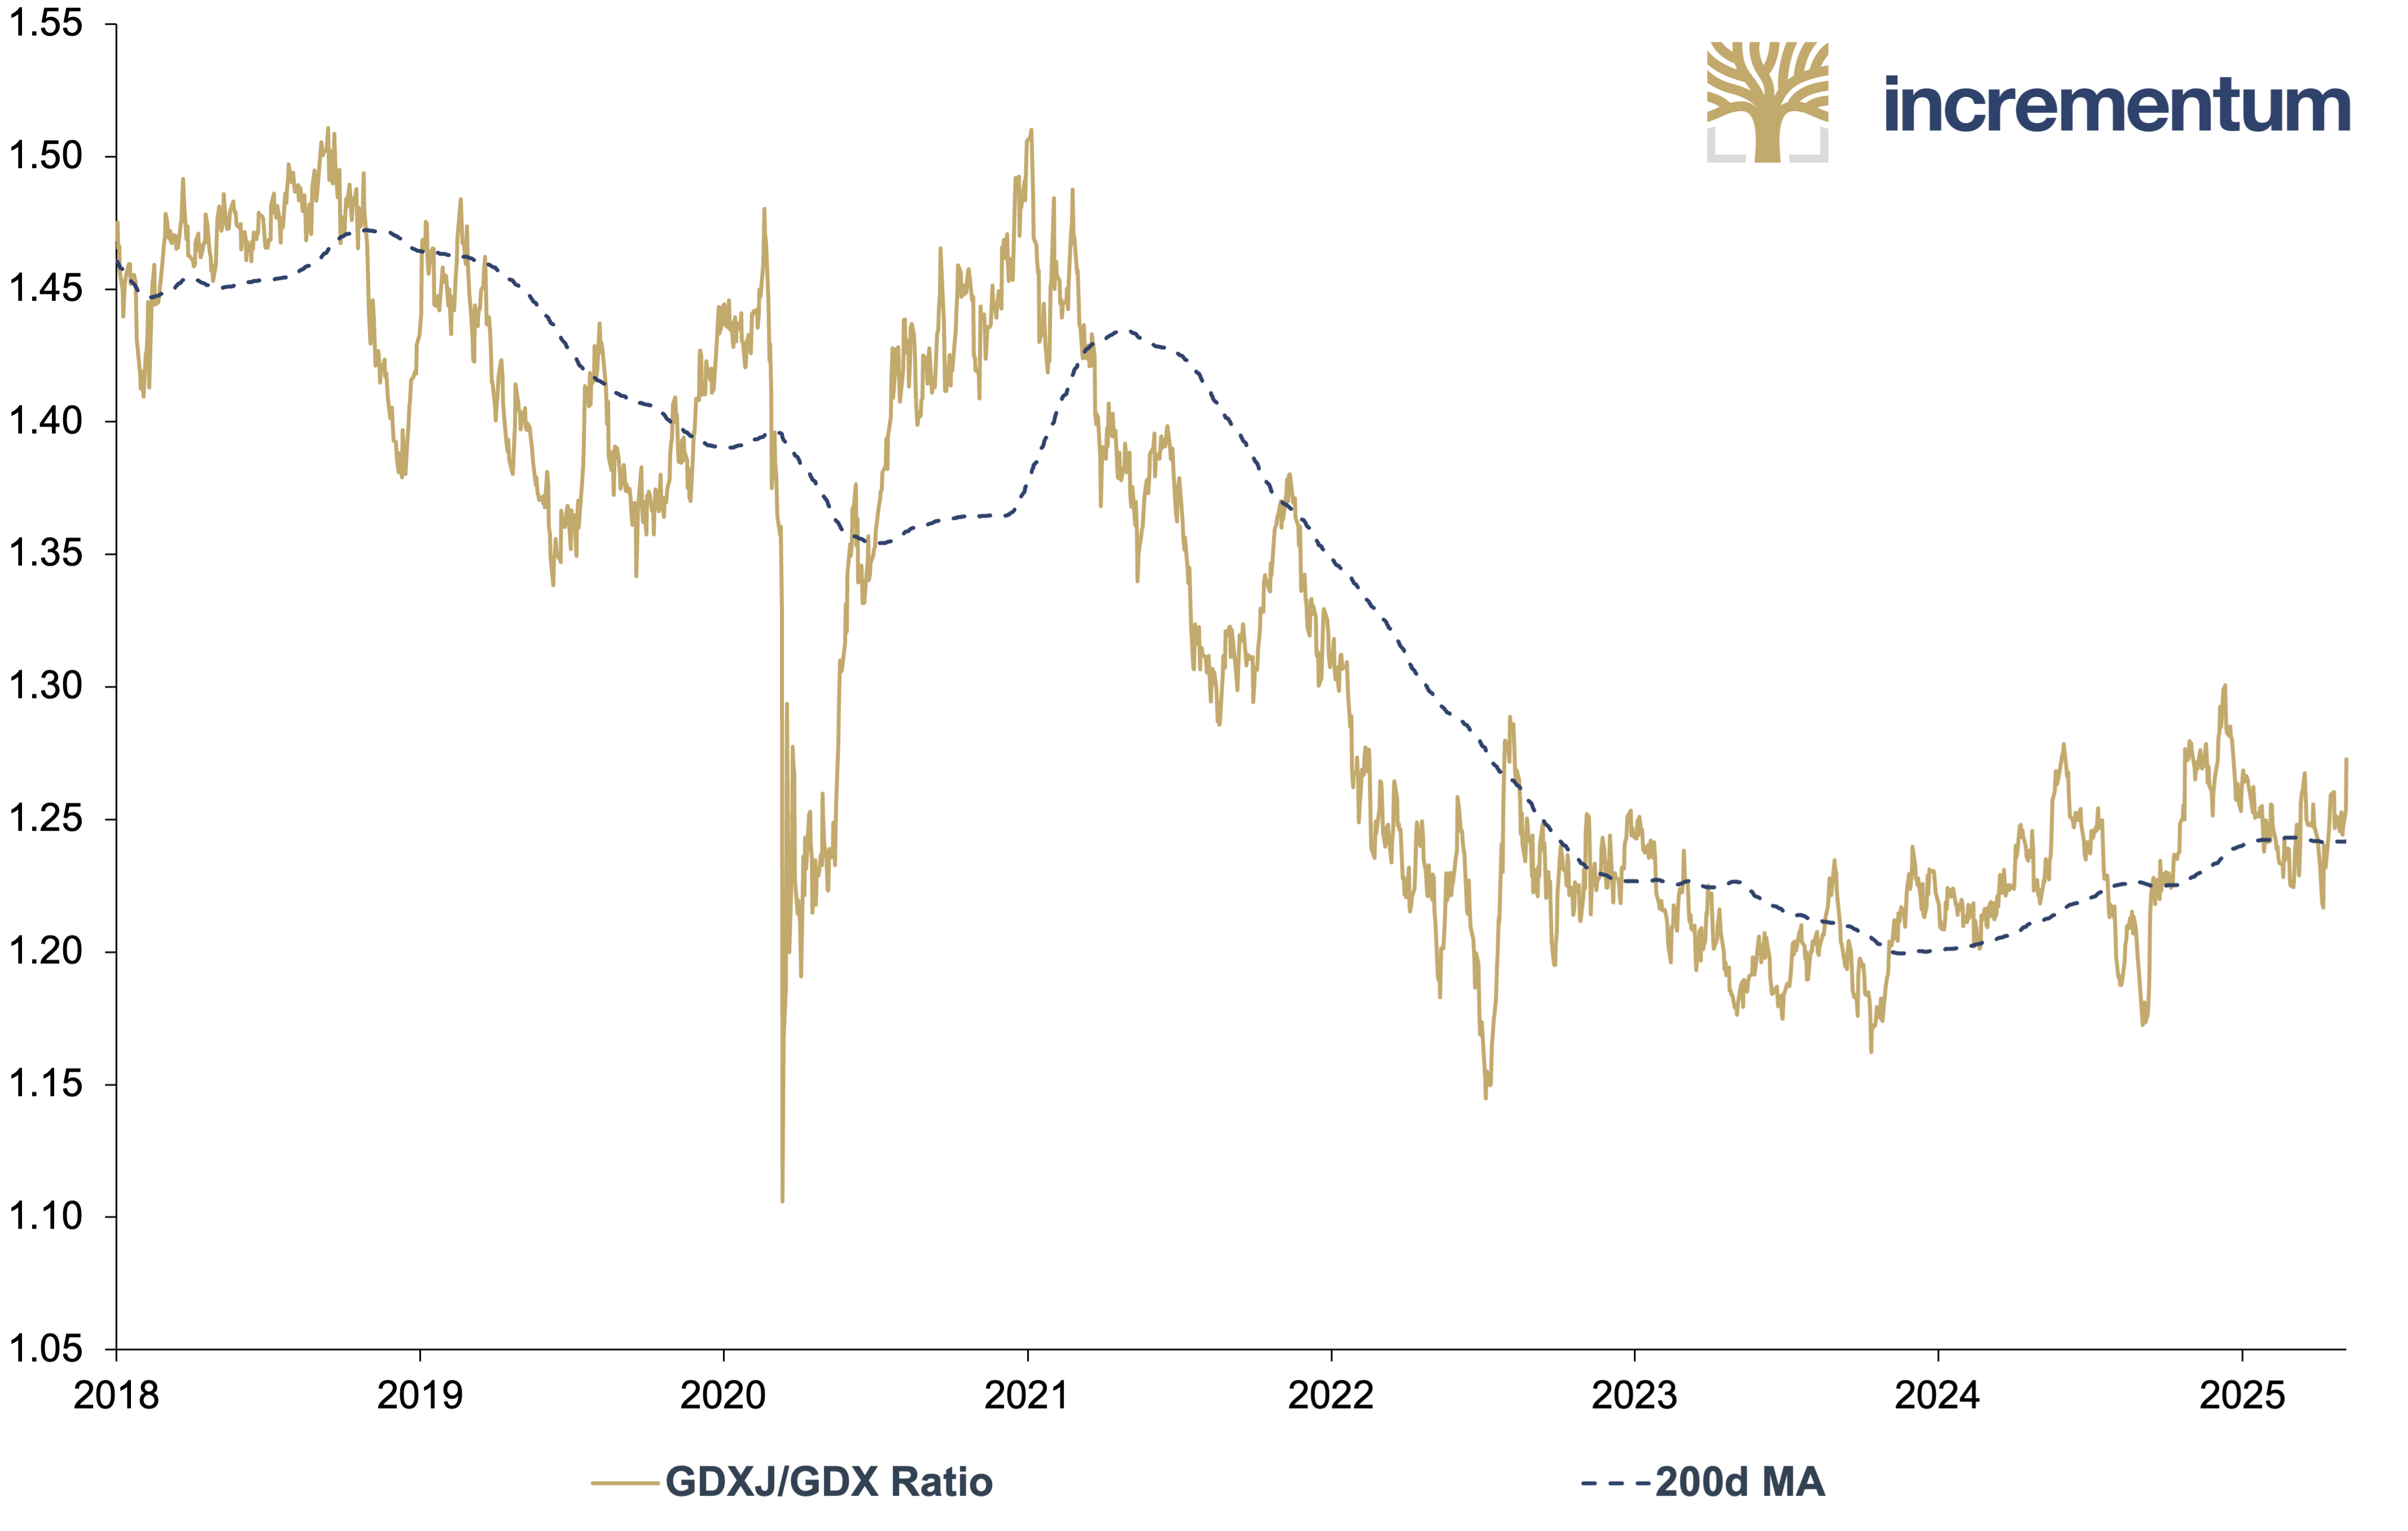
Source: LSEG, Incrementum AG
The S&P 500/GDX ratio chart indicates that, after years of the S&P 500 outperforming gold miners, the trend is now reversing. The repeated rounding tops since 2015, with the latest forming between 2023 and 2025, suggest a maturing shift in relative strength toward miners. The recent drop below the 200-day moving average reinforces the view that gold miners are entering a phase of renewed outperformance relative to the broader equity market. This potential inflection point reflects both mean reversion and broader macro shifts, positioning gold mining stocks as increasingly attractive compared to general equities.
S&P 500/GDX Ratio, 01/2007–04/2025
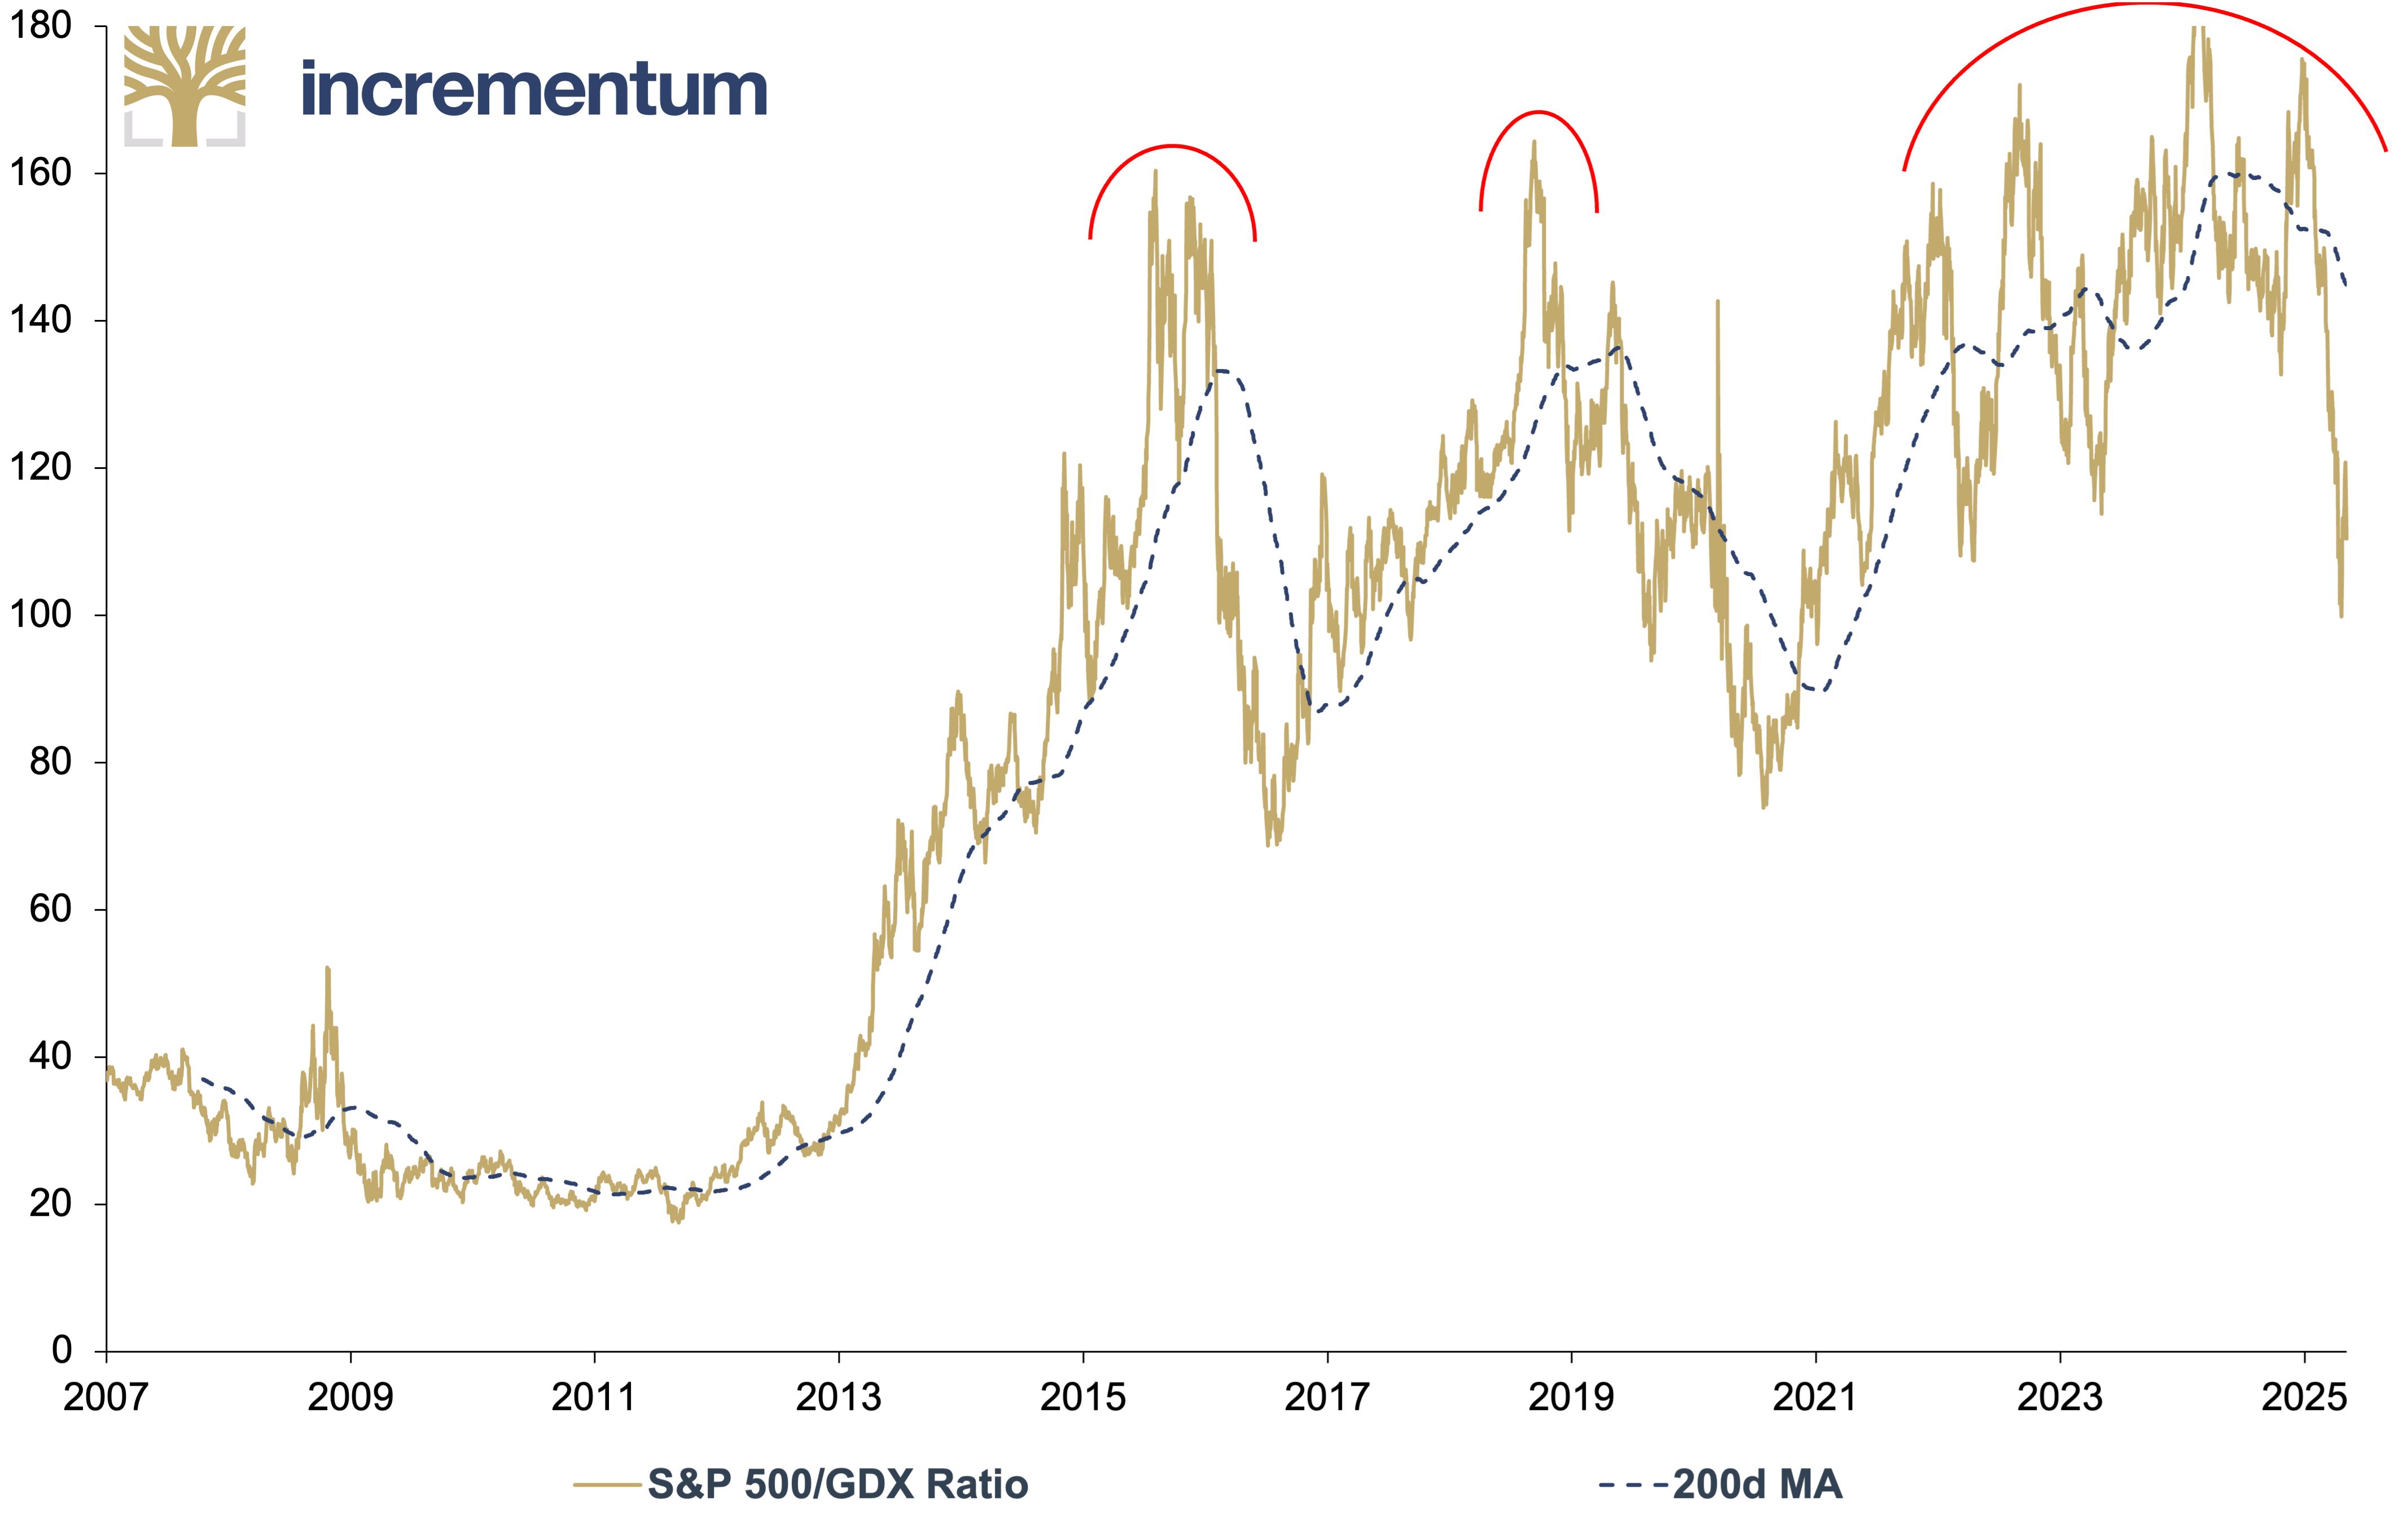
Source: Crescat Capital, Tavi Costa, LSEG, Incrementum AG
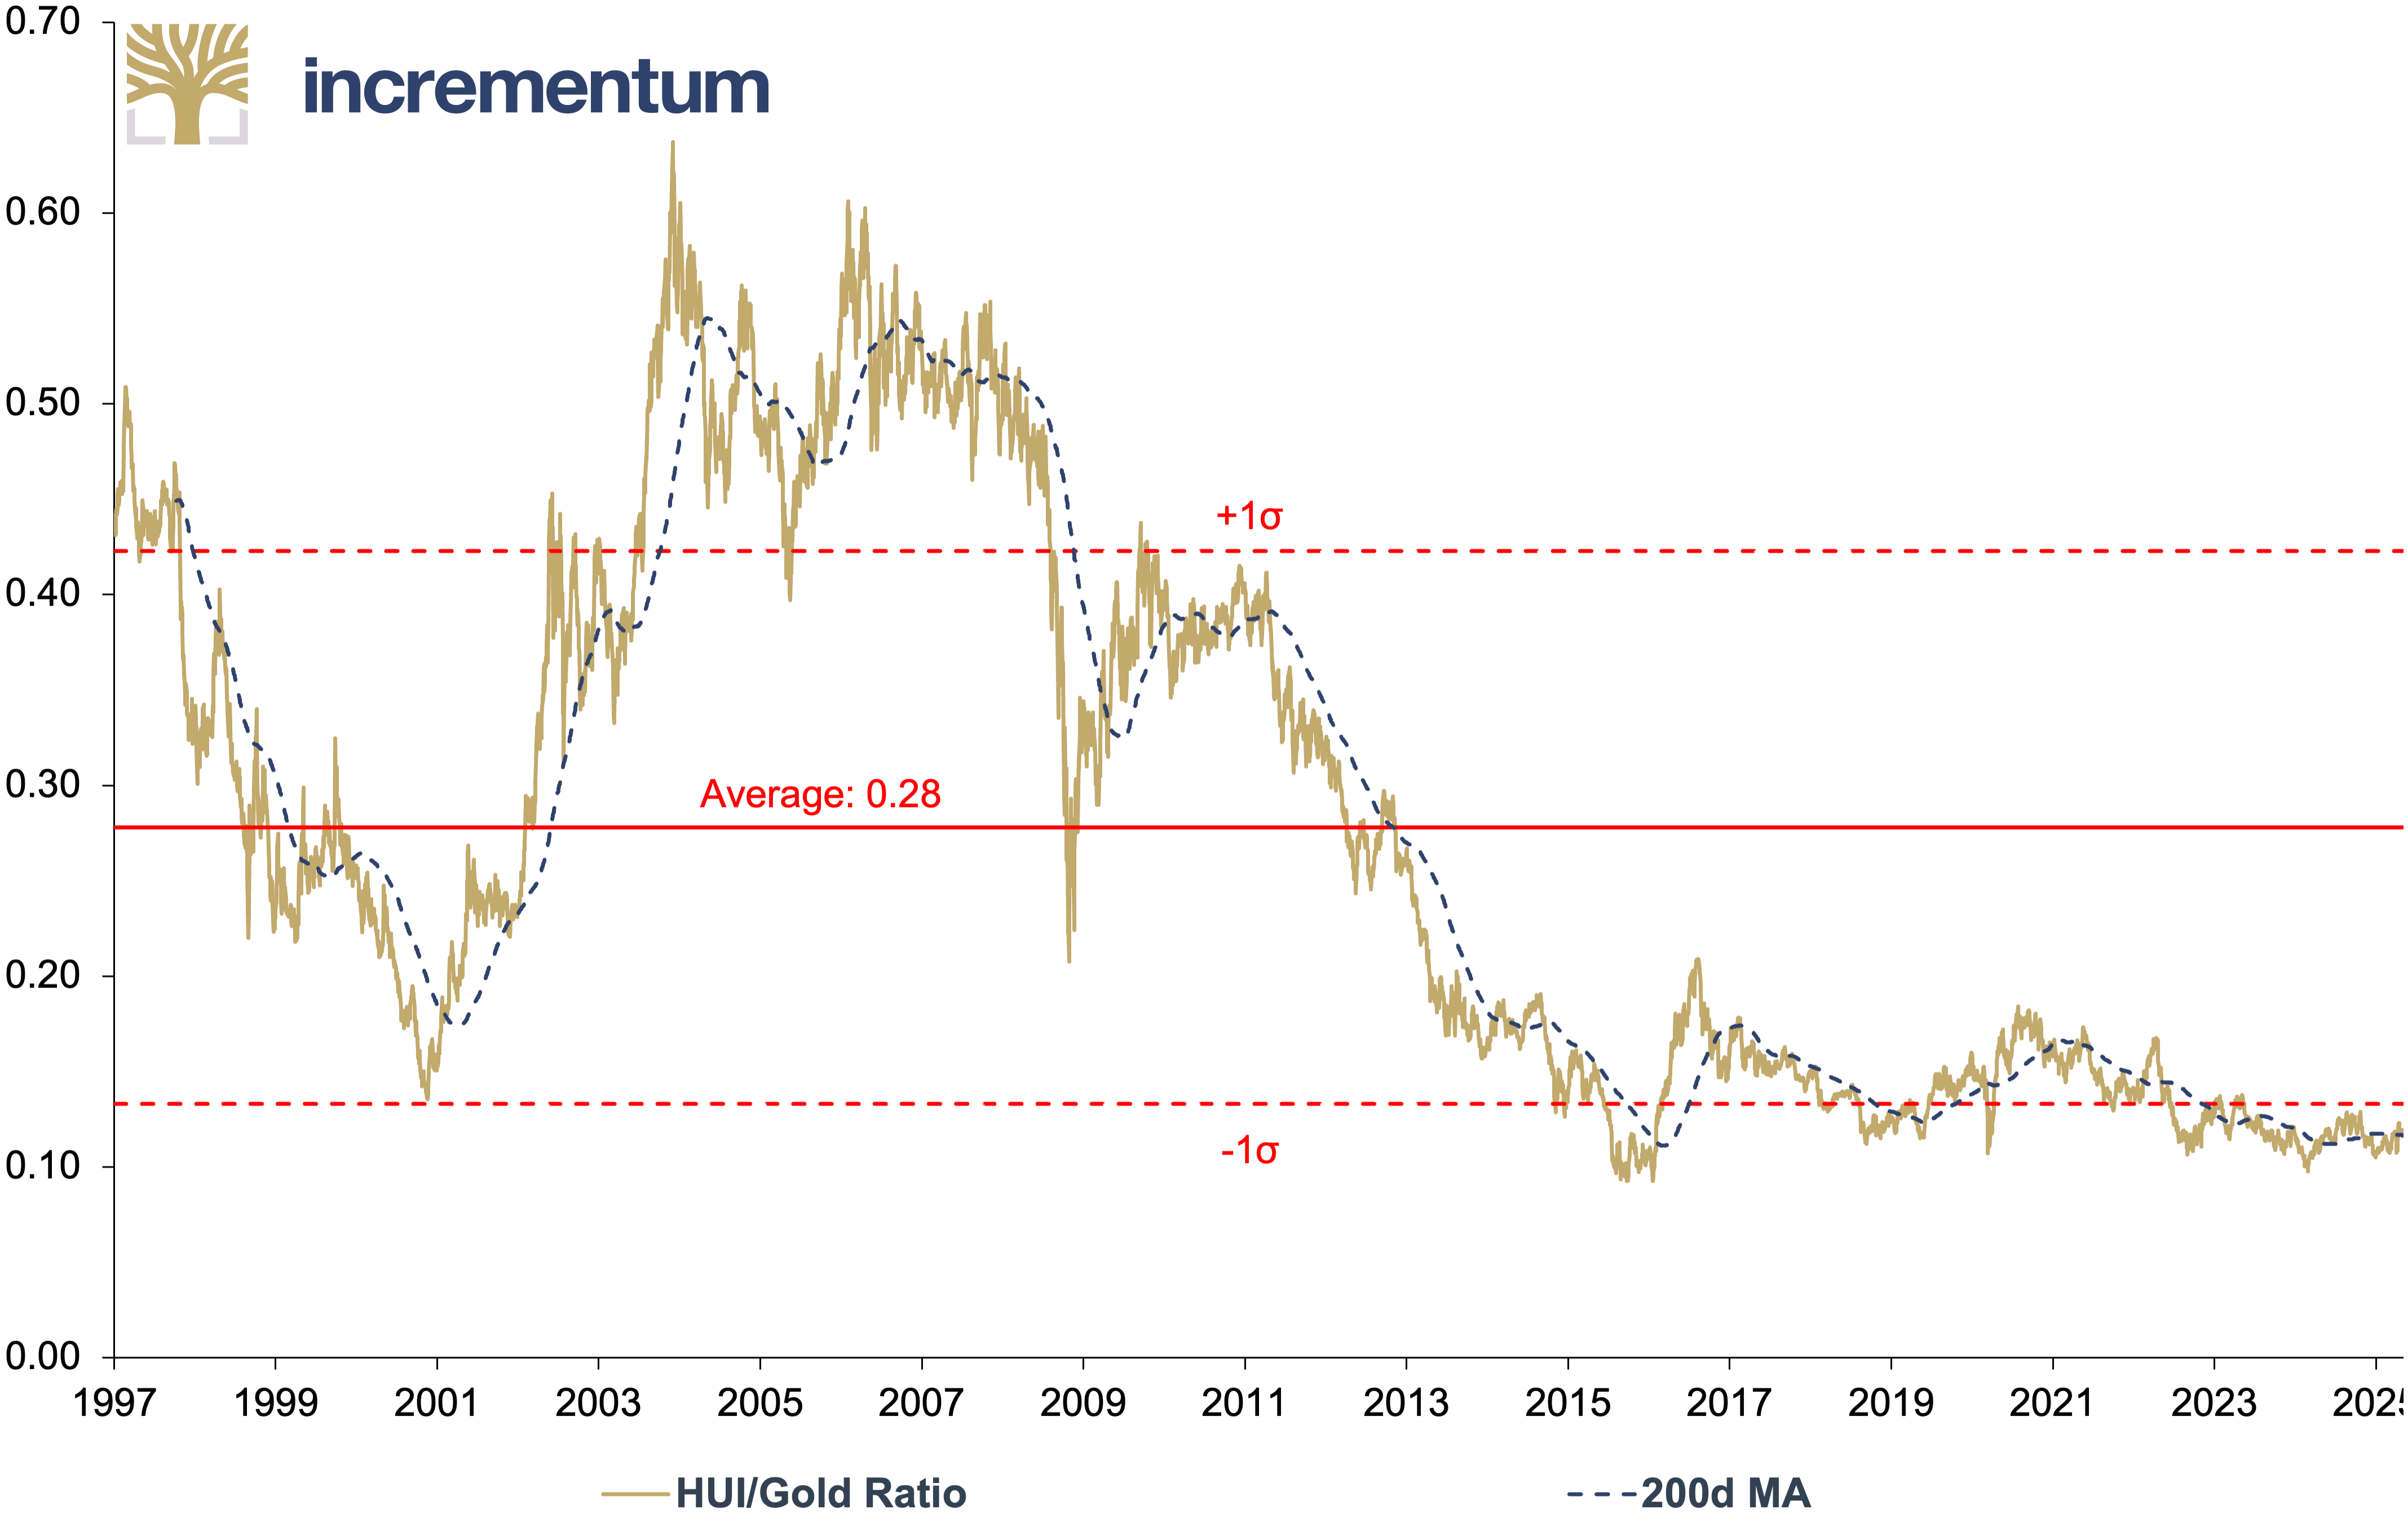
A brief final look at the relative valuation of mining stocks compared to gold. In bull markets, gold mining stocks tend to trade at a premium to the price of gold. The HUI/Gold ratio indicates that, for years, gold mining stocks have been trading one standard deviation below the mean. Based on this indicator as well, gold mining stocks appear to be glaringly undervalued.
HUI/Gold Ratio, 01/1997–04/2025
Source: LSEG, Incrementum AG
The gold mining sector continues to struggle with a reputation for poor financial discipline, a perception rooted in the wave of industry write-downs in the early 2010s. We believe this reputation is no longer justified. Particularly among the leading management teams, there is now a strong focus on conservative financial practices. The sector has clearly learned from past mistakes. Yet, broader groups of investors have yet to fully recognize the sector’s value proposition. What matters most to us is that the sector is generating significant free cash flow (FCF).
To fully harness the investment utility of gold equities, investors must look past trading volatility in recognition of the value-creation opportunity mine development brings to the secular trend of rising gold prices. All things considered, building and operating gold mines is one of the longest-duration endeavors on the planet. It is somewhat incongruous that equities of such long-term assets are tossed around so ficklely by fluctuating economic data. Employing Warren Buffett’s moat analogy, we would suggest there are few businesses as immune to competition as a well-operated gold mine on a world-class deposit. As long as management is executing and milestones are met, volatility in gold shares is a nuisance that should not be confused with elevated risk.
Despite the largely positive developments we have described above, a few sectors are still underweighted by the investment community more than the mining sector. This is reflected in the sector’s almost dwarfed market capitalization. In this respect, we expect mining stocks – and their shareholders – to reap a rich harvest over the next few years after a grueling dry spell. However, it is now up to the sector to deliver on the promises made in recent years and build new investor confidence.
Market Capitalization, in USD bn, 04/2024
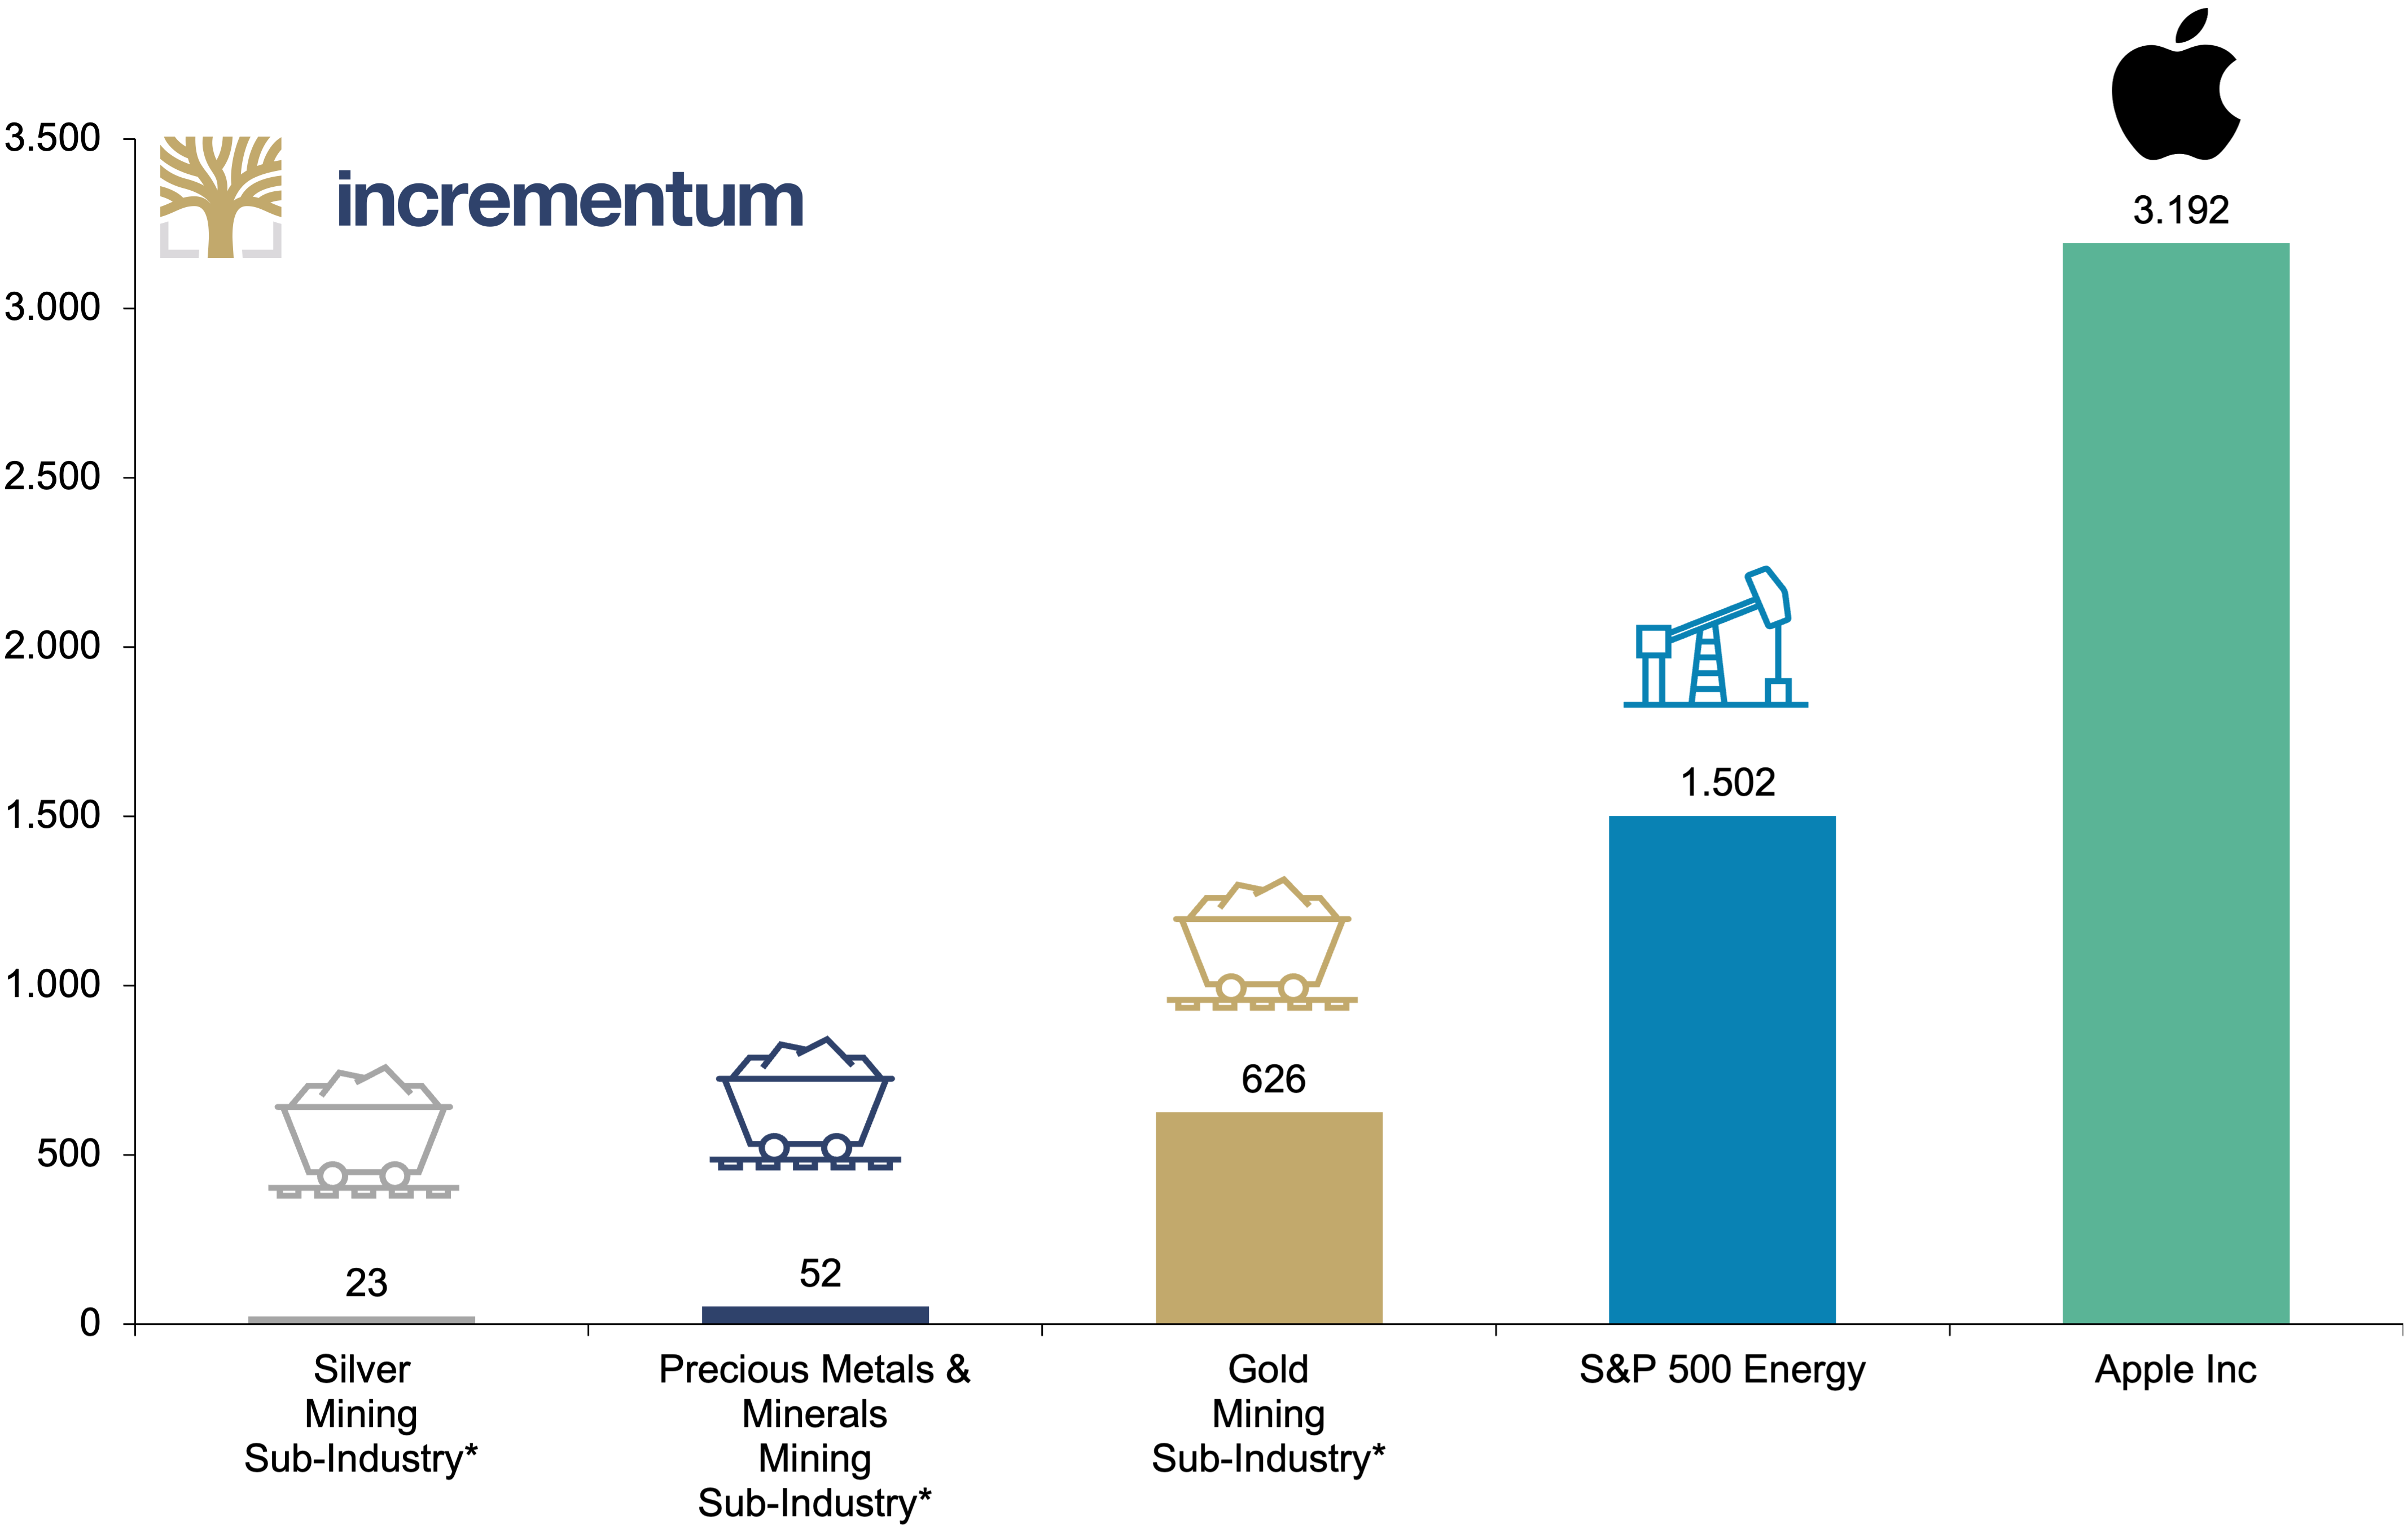
Source: LSEG, Incrementum AG
*GICS classification (Global Industry Classification Standard)
[1] See “Royalty & Streaming Companies: An Excellent Way of Investing in Gold,” In Gold We Trust report 2022
[2] See chapter “Gold Miners’ Puzzle in This Market Cycle: To Grow or to Save?” in this In Gold We Trust report