1970s, 2000s, 2020s...: A déjà vu in two acts – Act Two
The chase is better than the catch.
H.P. Baxxter
- Golden prospects for a continuation of the bull market: numerous enantiodromic developments are creating an environment that favors gold – characterized by uncertainty, volatility and a loss of confidence. What is becoming a stress test for the classic 60/40 portfolio is the ideal stage for gold’s relative strength.
- A look back at history highlights the potential of the coming years: in both the 1970s and the 2000s, the gold price multiplied after the first half of the decade.
- Performance gold in the form of silver and gold mining stocks could benefit disproportionately in the wake of gold and become The Big Long of the second half of the decade alongside gold.
- The moderate performance of the commodities sector so far in the current decade opens up scope, especially if structural bottlenecks, geopolitical fragmentation, and investment restraint come to a head.
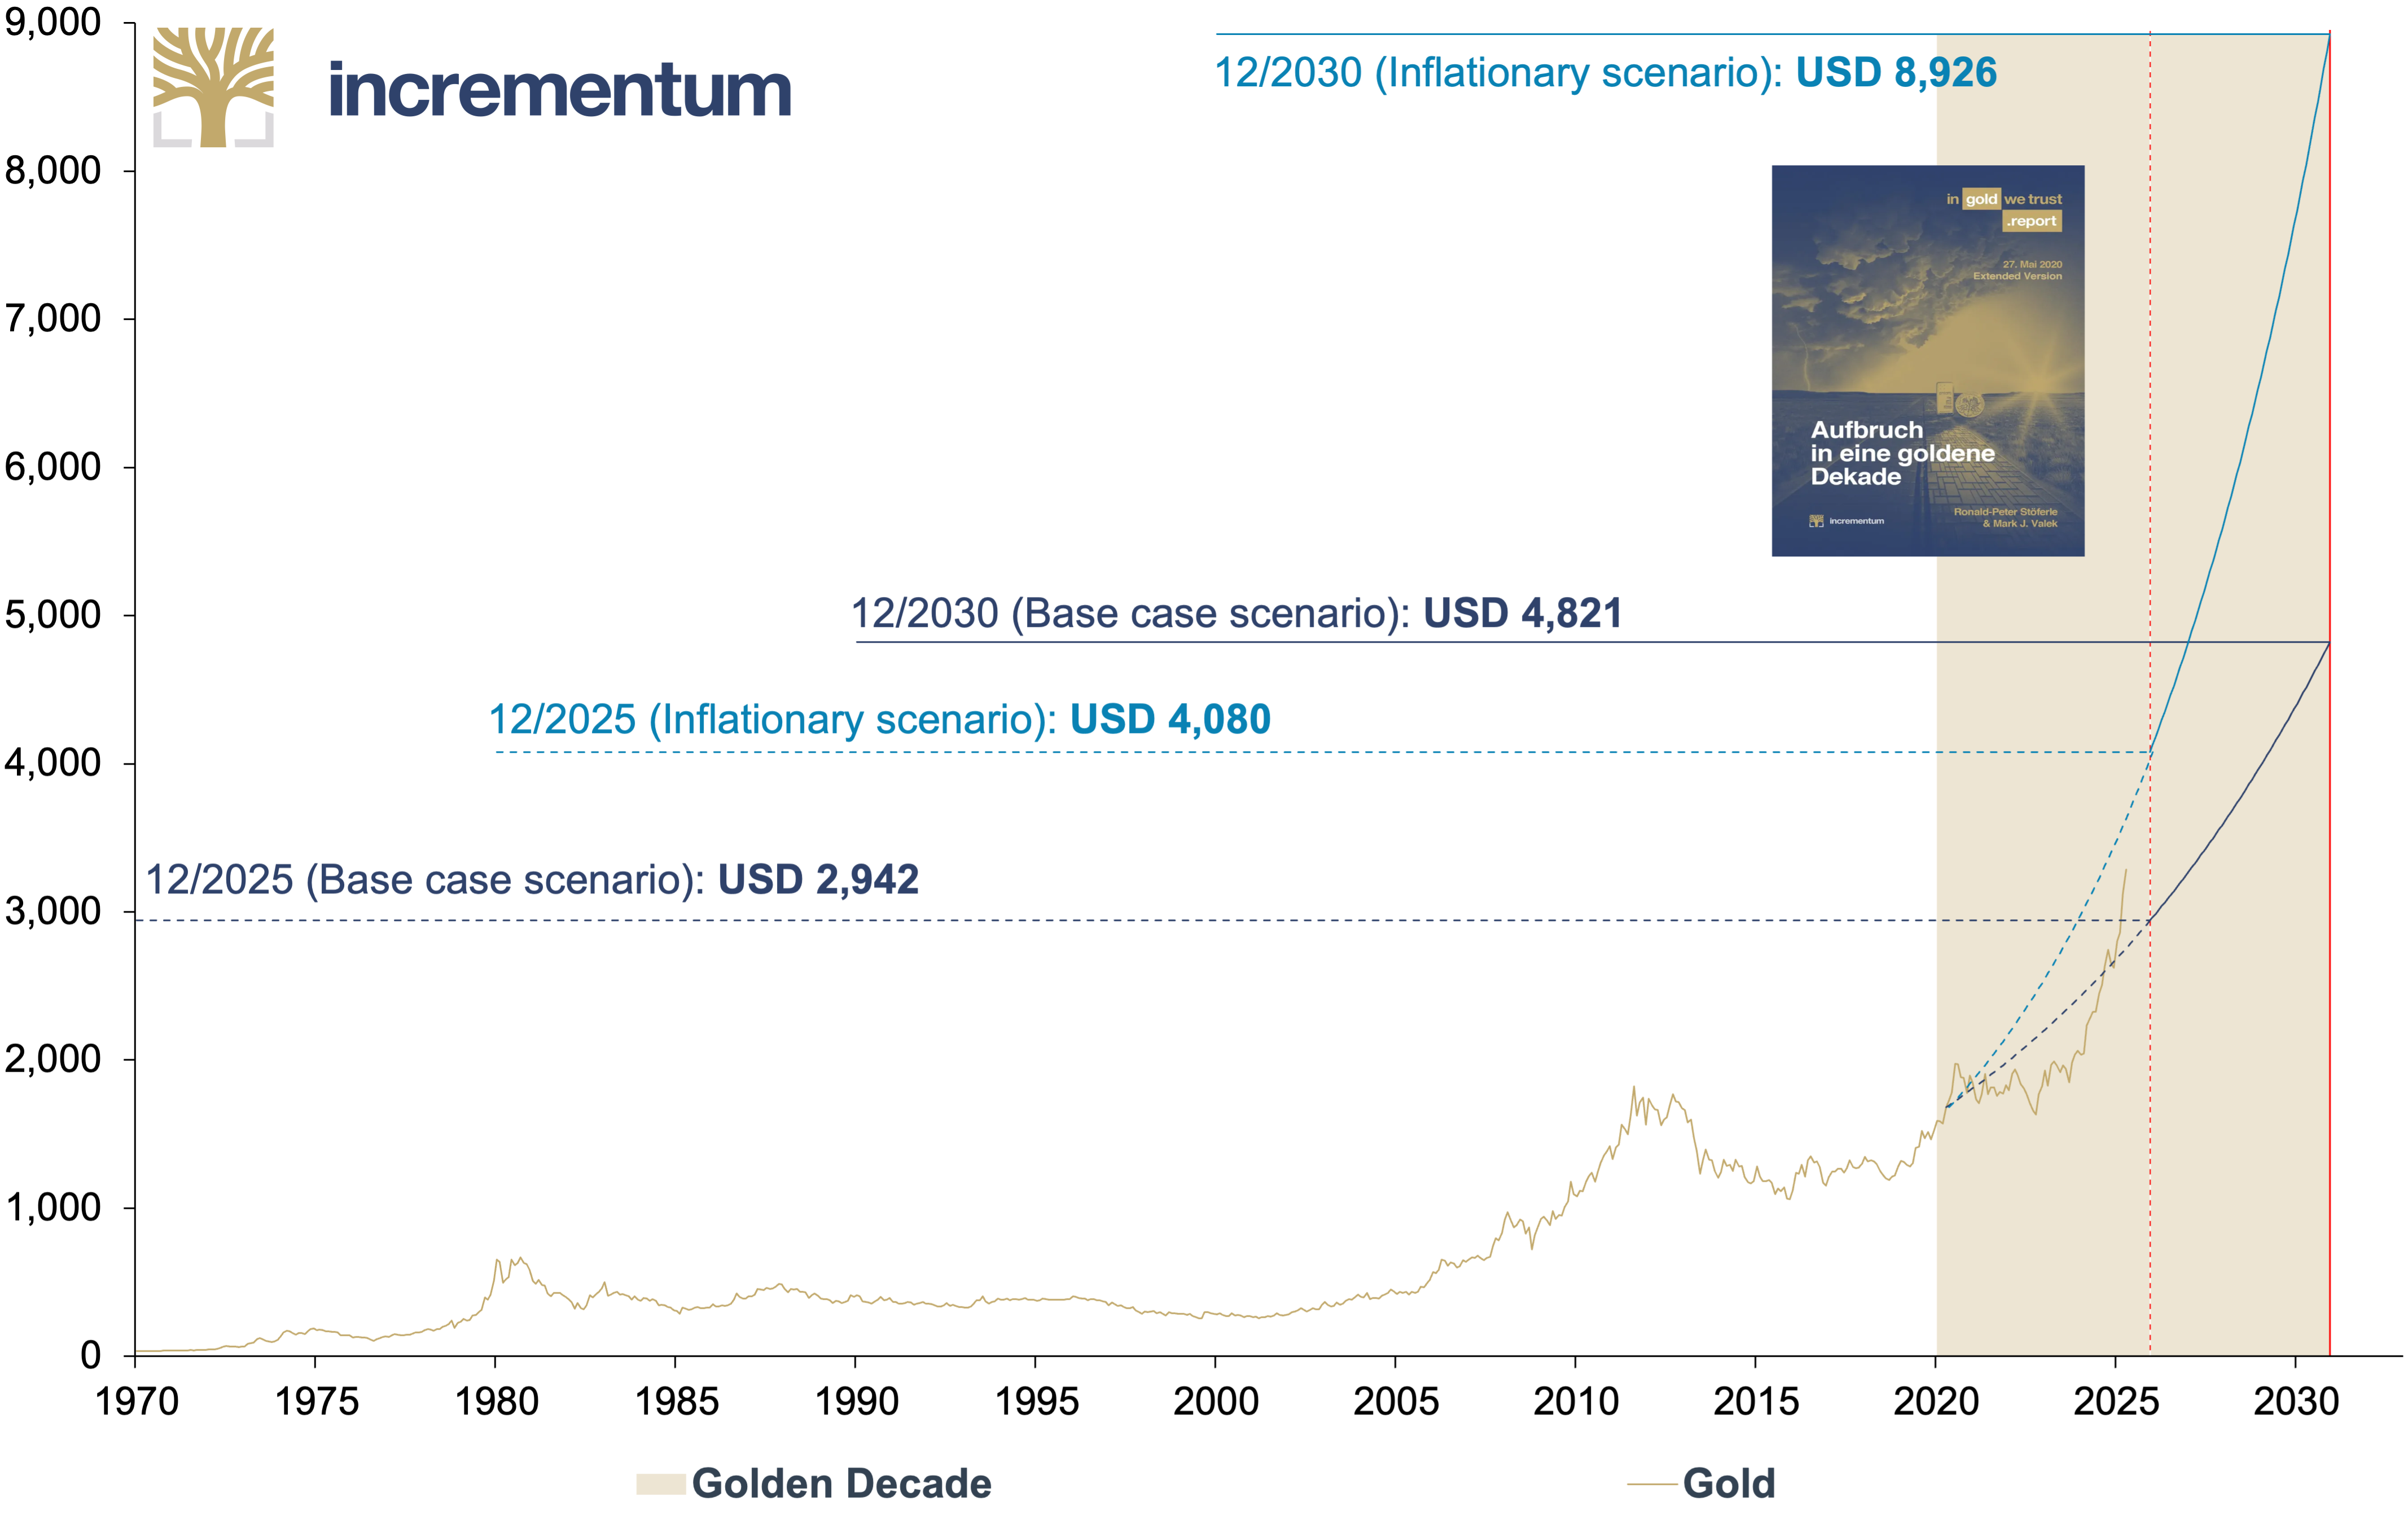
- Following the recent rally, the decade-end target of USD 4,800 in the base scenario announced in 2020 is rapidly approaching. Depending on macroeconomic developments, the gold price is likely to settle in a corridor between USD 4,800 and USD 8,900 – the inflationary scenario – by the end of the decade.
- The new 60/40 portfolio has significantly outperformed the old 60/40 portfolio since the publication of last year’s In Gold We Trust report. Current conditions suggest that this trend is likely to continue in the future.
The Enantiodromic Moment of Gold
History teaches us with a quiet but insistent voice: Where extremes prevail, the potential for reversal grows. States that are overstretched or exhausted tip over into their opposite. This principle, known by Heraclitus as enantiodromia, can be seen today as if through a magnifying glass in numerous political, social, and economic developments. We are witnessing the turning of an old script into a new chapter.
Globalization, once the unstoppable pulse of the world economy, is increasingly being overshadowed by the beat of protectionism. A prime example is the new US customs regulations introduced by the Trump administration, which are causing great unease in trade policy.
According to the Yale Budget Lab, the average tariff rate on US imports is expected to reach 27% (pre-substitution rate as of April 9), a level last seen over 100 years ago. However, the calculations should be treated with caution, as neither a withdrawal of the announced and delayed tariffs nor the introduction of new trade barriers can be ruled out. The post-substitution rate, i.e., the rate that would be realized after estimated substitution effects, is 18.54% as of April 9, according to calculations by the Yale Budget Lab.
Average US Tariff Rate on Total Imports and Dutiable Imports, 1790–2025e*
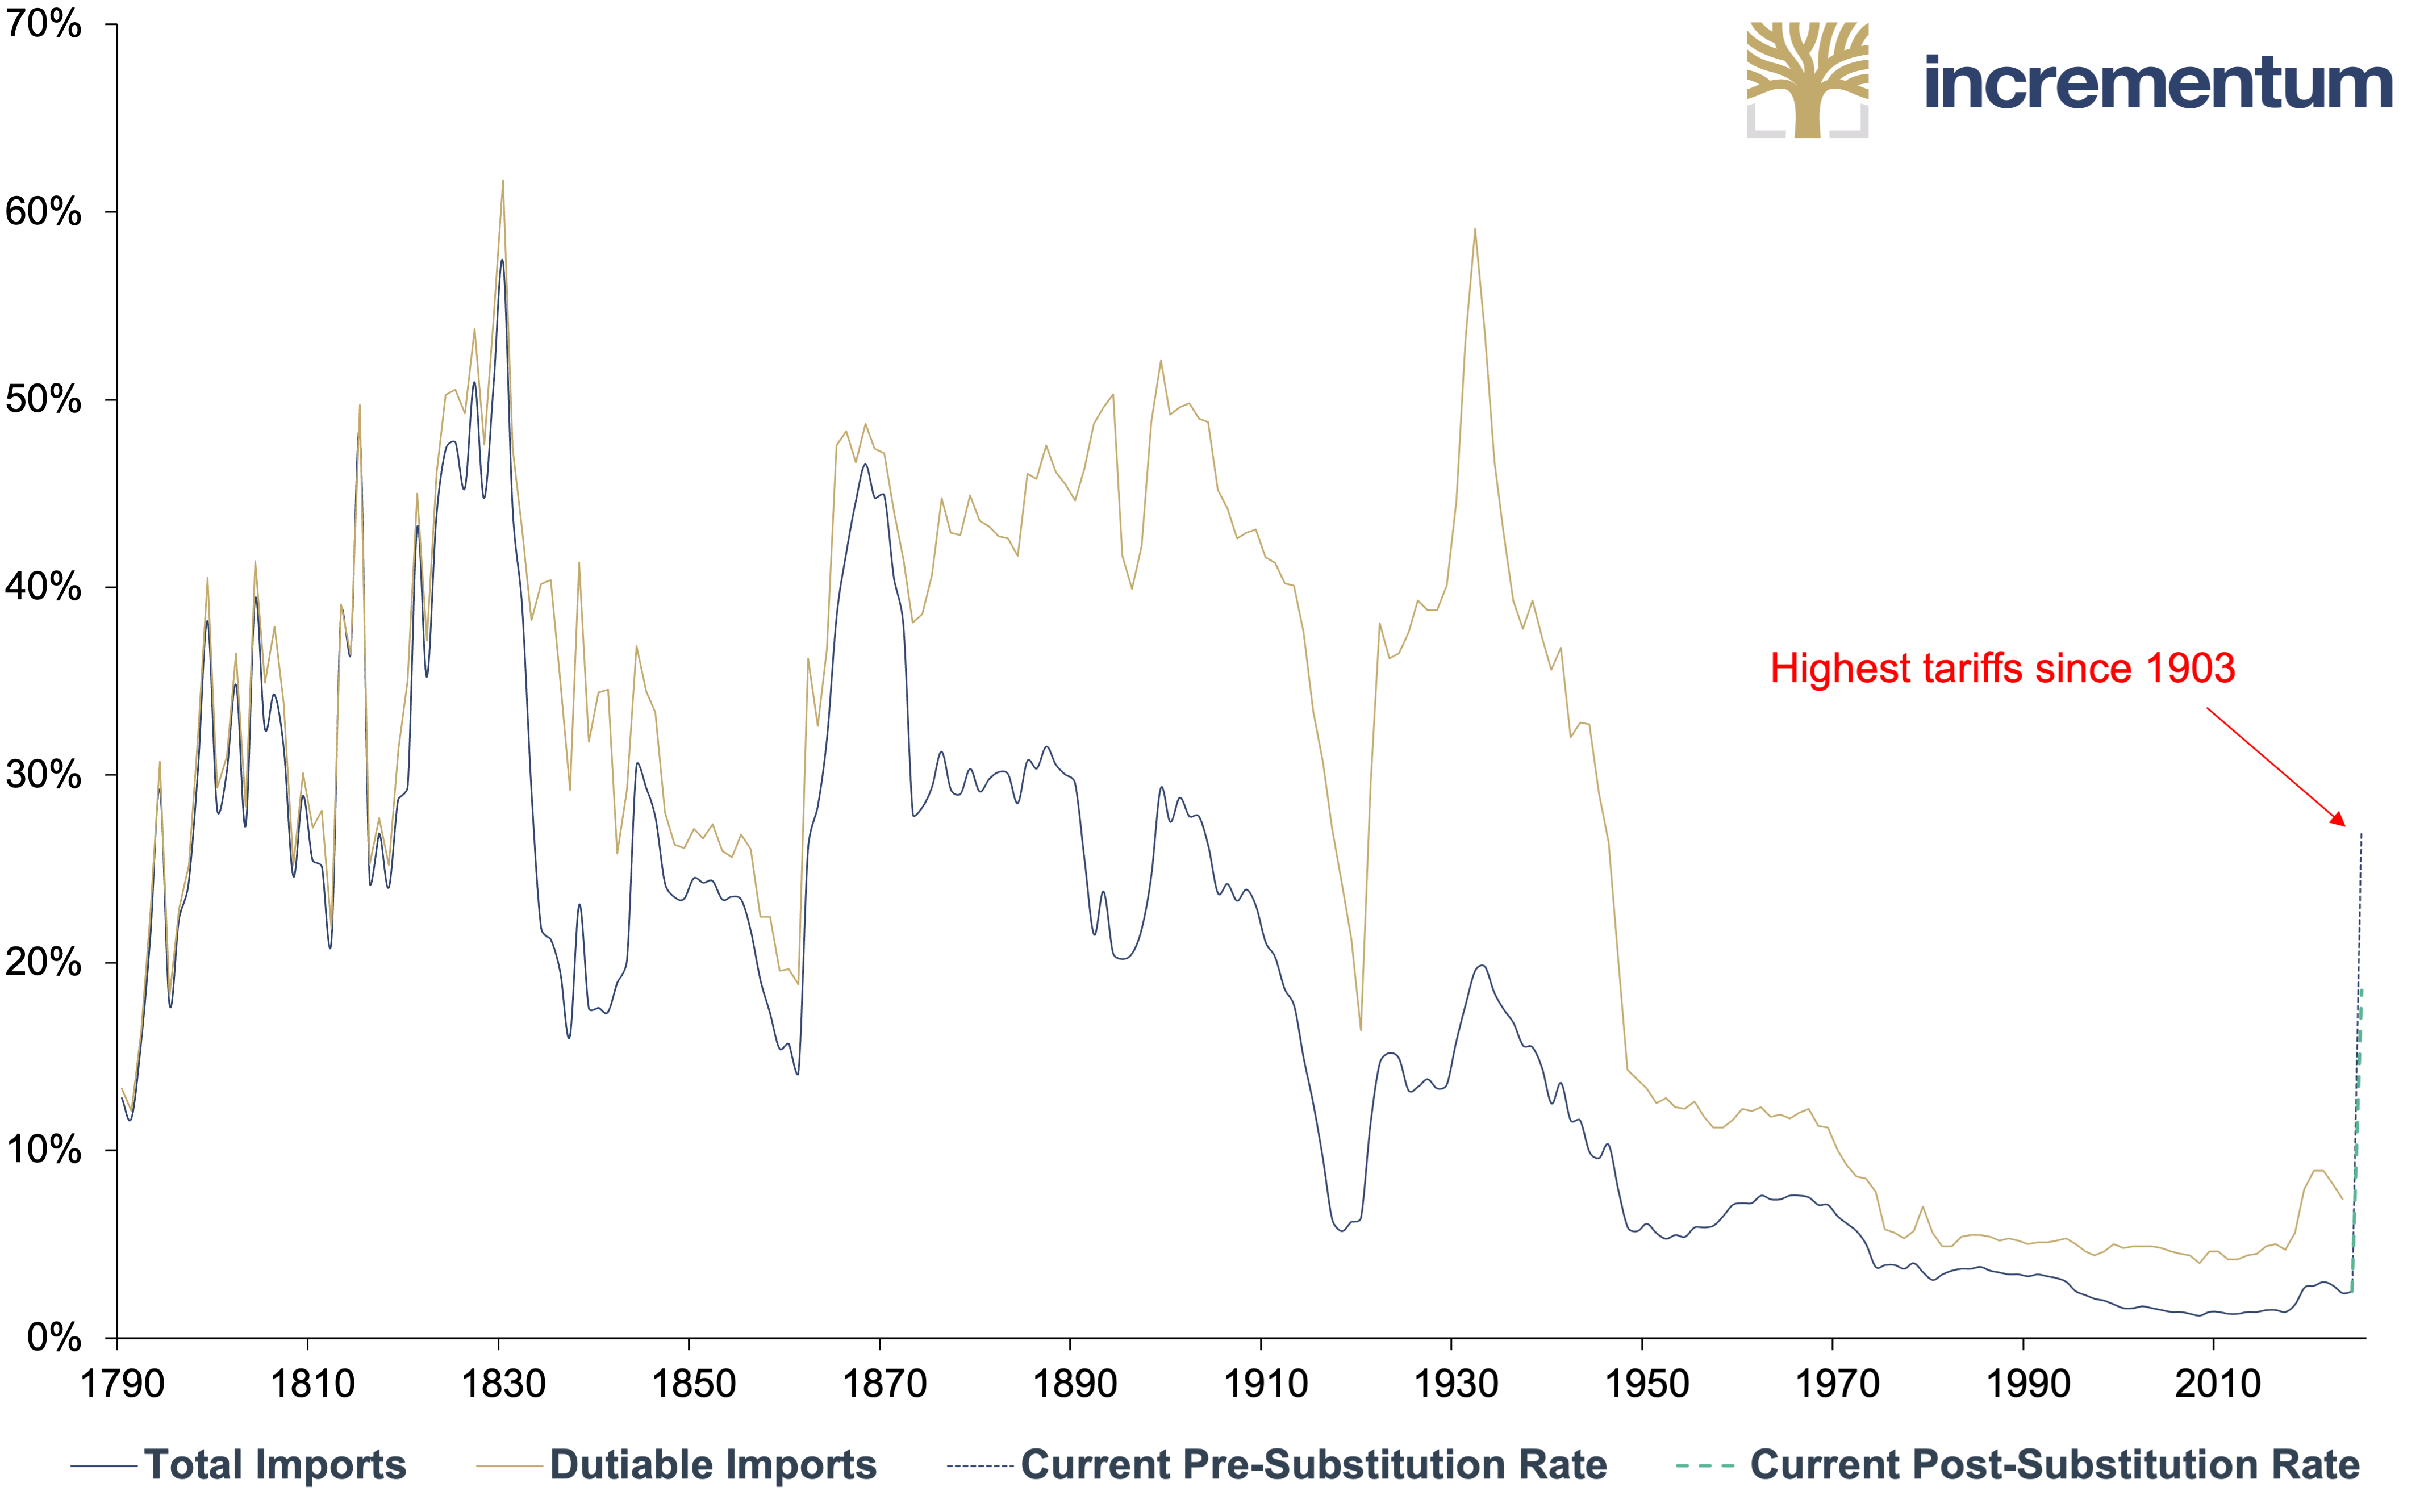
Source: Douglas A. Irwin, Tax Foundation, Yale University The Budget Lab, Incrementum AG
*Forecast for 2025 takes into account the tariffs announced until April 9.
At the same time, it should be noted that the US was one of the Western countries with the lowest average import tariffs until recently. In this respect, the reorientation of trade policy can be interpreted at first glance, at least in part, as an attempt at a reciprocal policy. However, this idea is only partially effective: The new measures overshoot the mark and are not based on the actual tariff rates of other nations, but take the US trade deficit as the political benchmark. Reciprocity thus becomes less of a balanced mechanism and more of a justification for a far-reaching, structurally more aggressive trade policy.
Average Tariff Rates of the USA and Its Top 15 Trading Partners, 2024
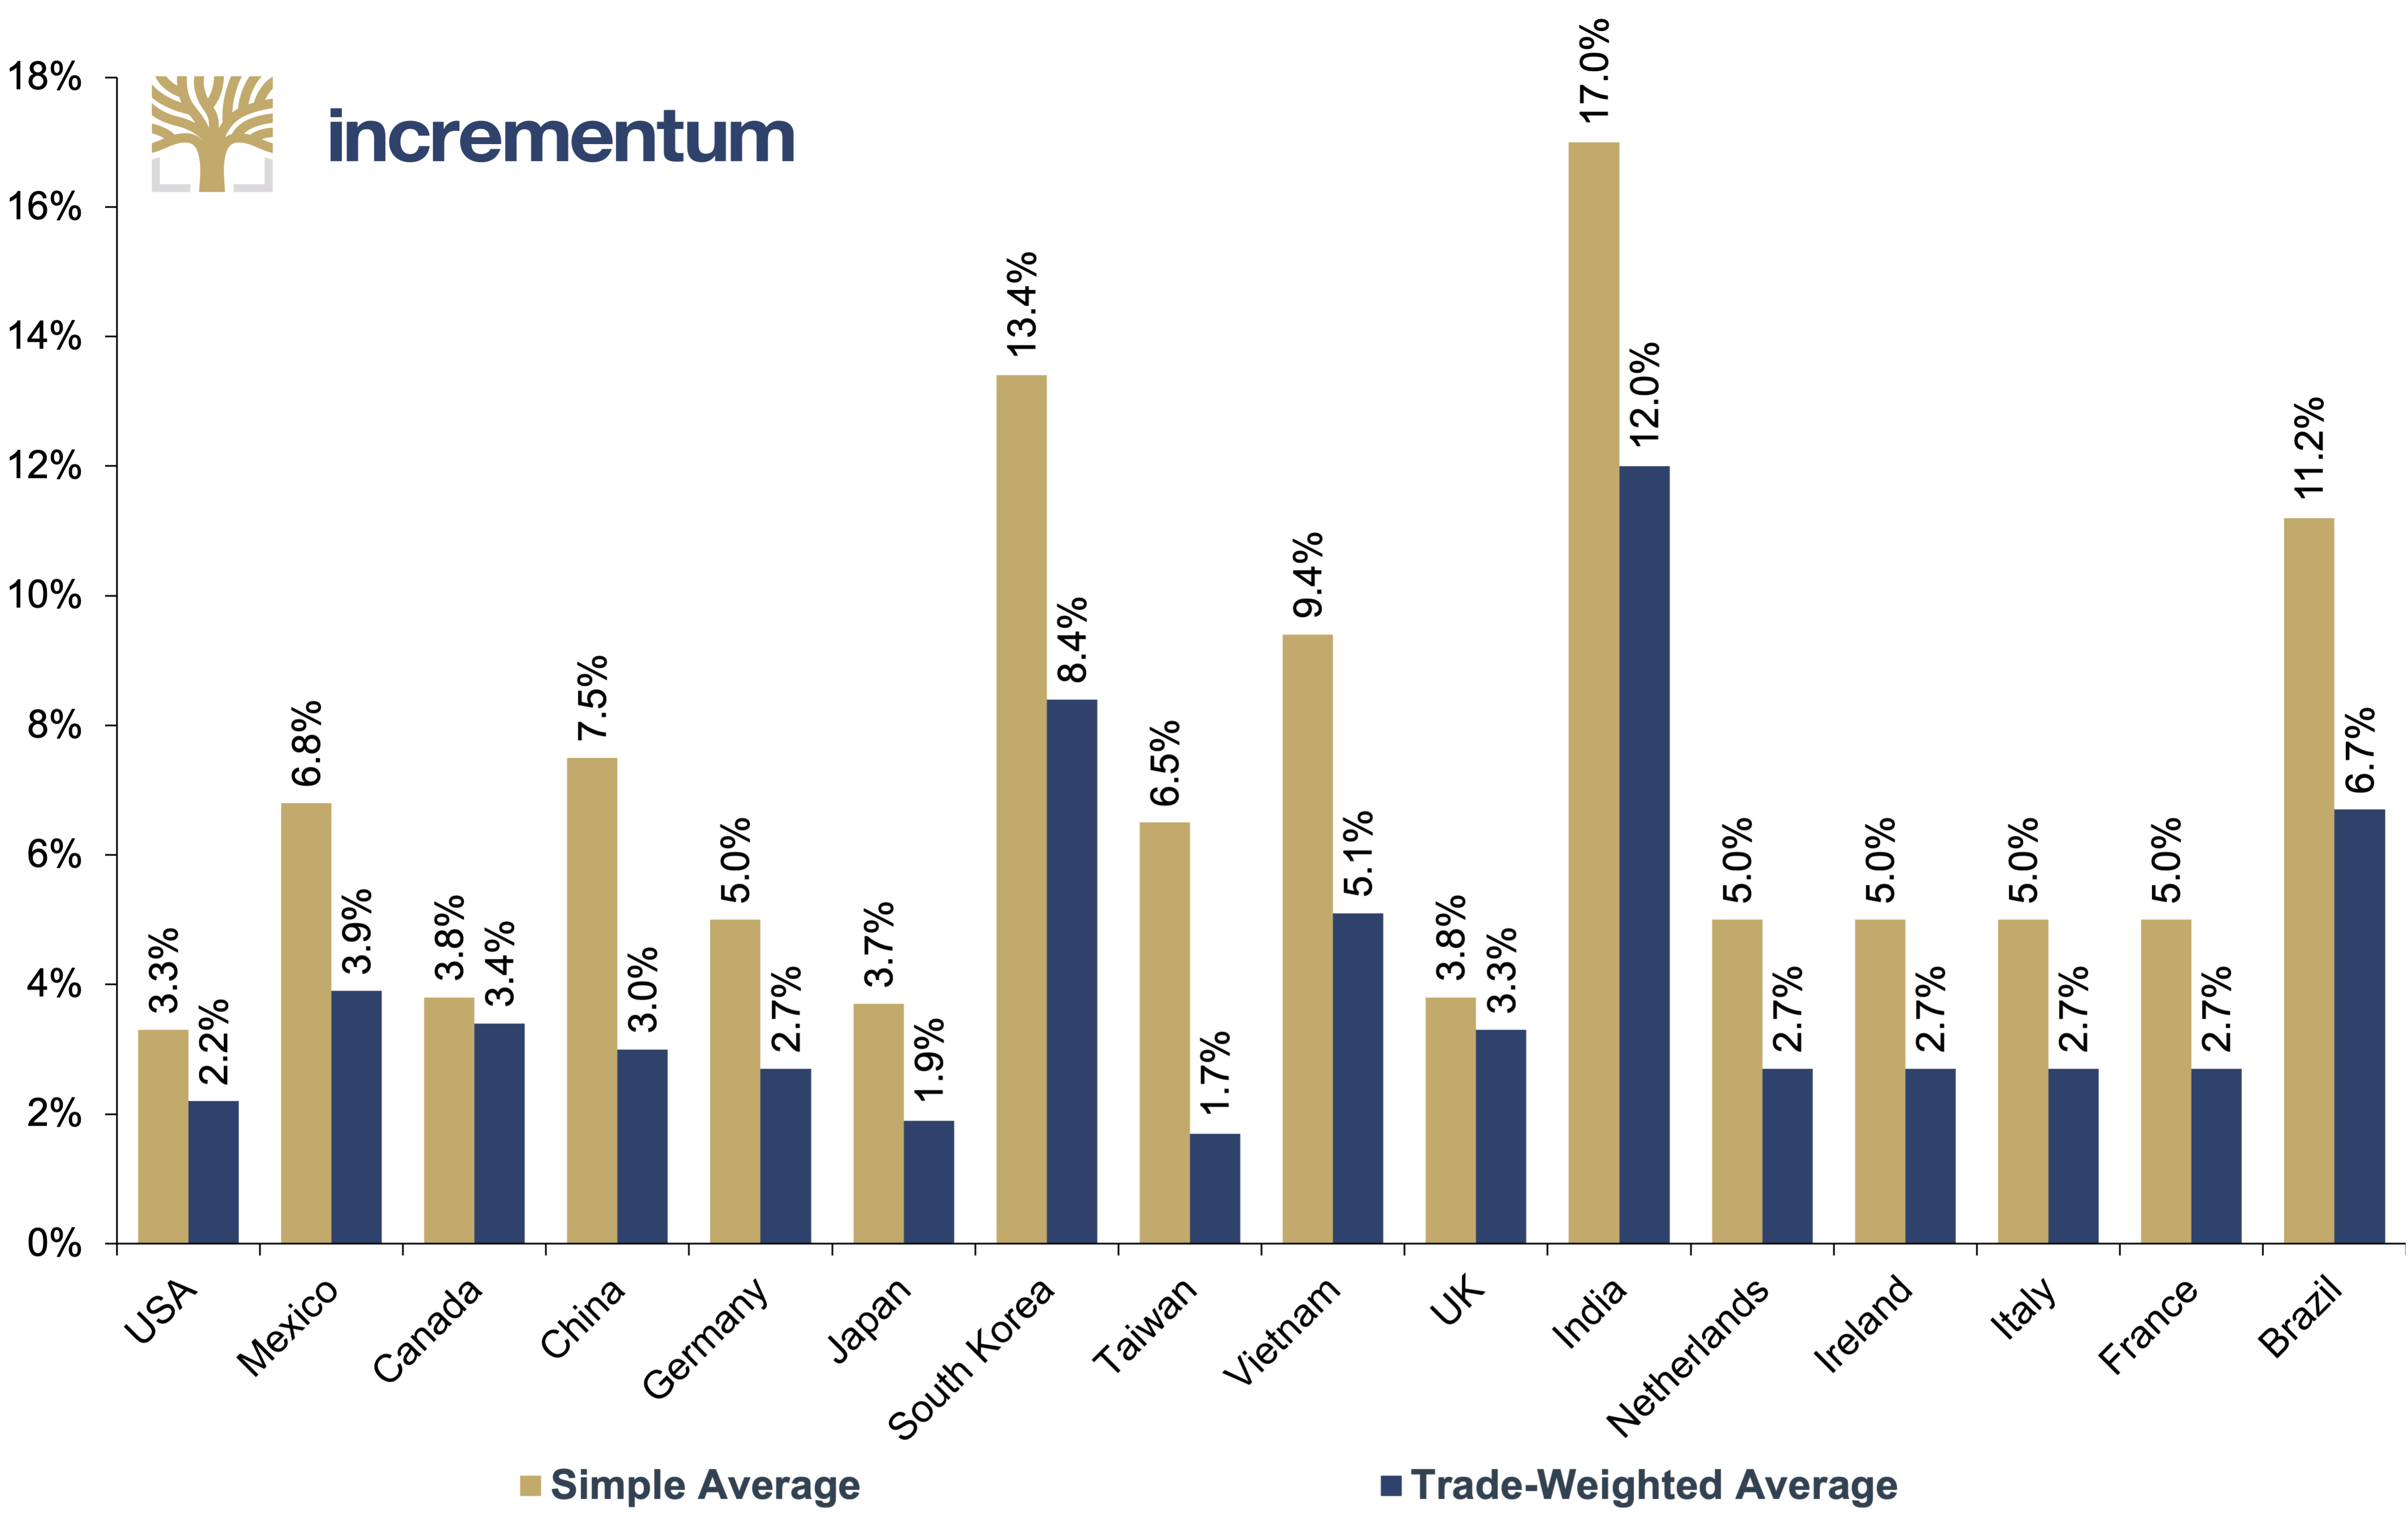
Source: David Lawder, WTO, Incrementum AG
The chart shows that, before Liberation Day on April 2, US import tariffs on the 15 largest trading partners were generally lower than the tariffs those countries imposed on US goods, both on a simple average (3.3%) and trade-weighted average (2.2%) basis. Thus, on average, the USA was more open to imports than most other major economies. It is important to note that these are the tariff rates under the most-favored-nation clause — that is, the regular WTO tariff rates — not the actual bilateral tariffs. In cases where free trade agreements existed, such as with Canada and Mexico, tariffs were effectively zero for the covered product groups.
The macroeconomic climate is about to change profoundly, while the fear of deflation that has lingered like a shadow over decades of monetary policy is giving way to the reality of new inflationary volatility, even in otherwise structurally deflation-plagued Japan.
CPI Japan, yoy%, 01/2000–03/2025
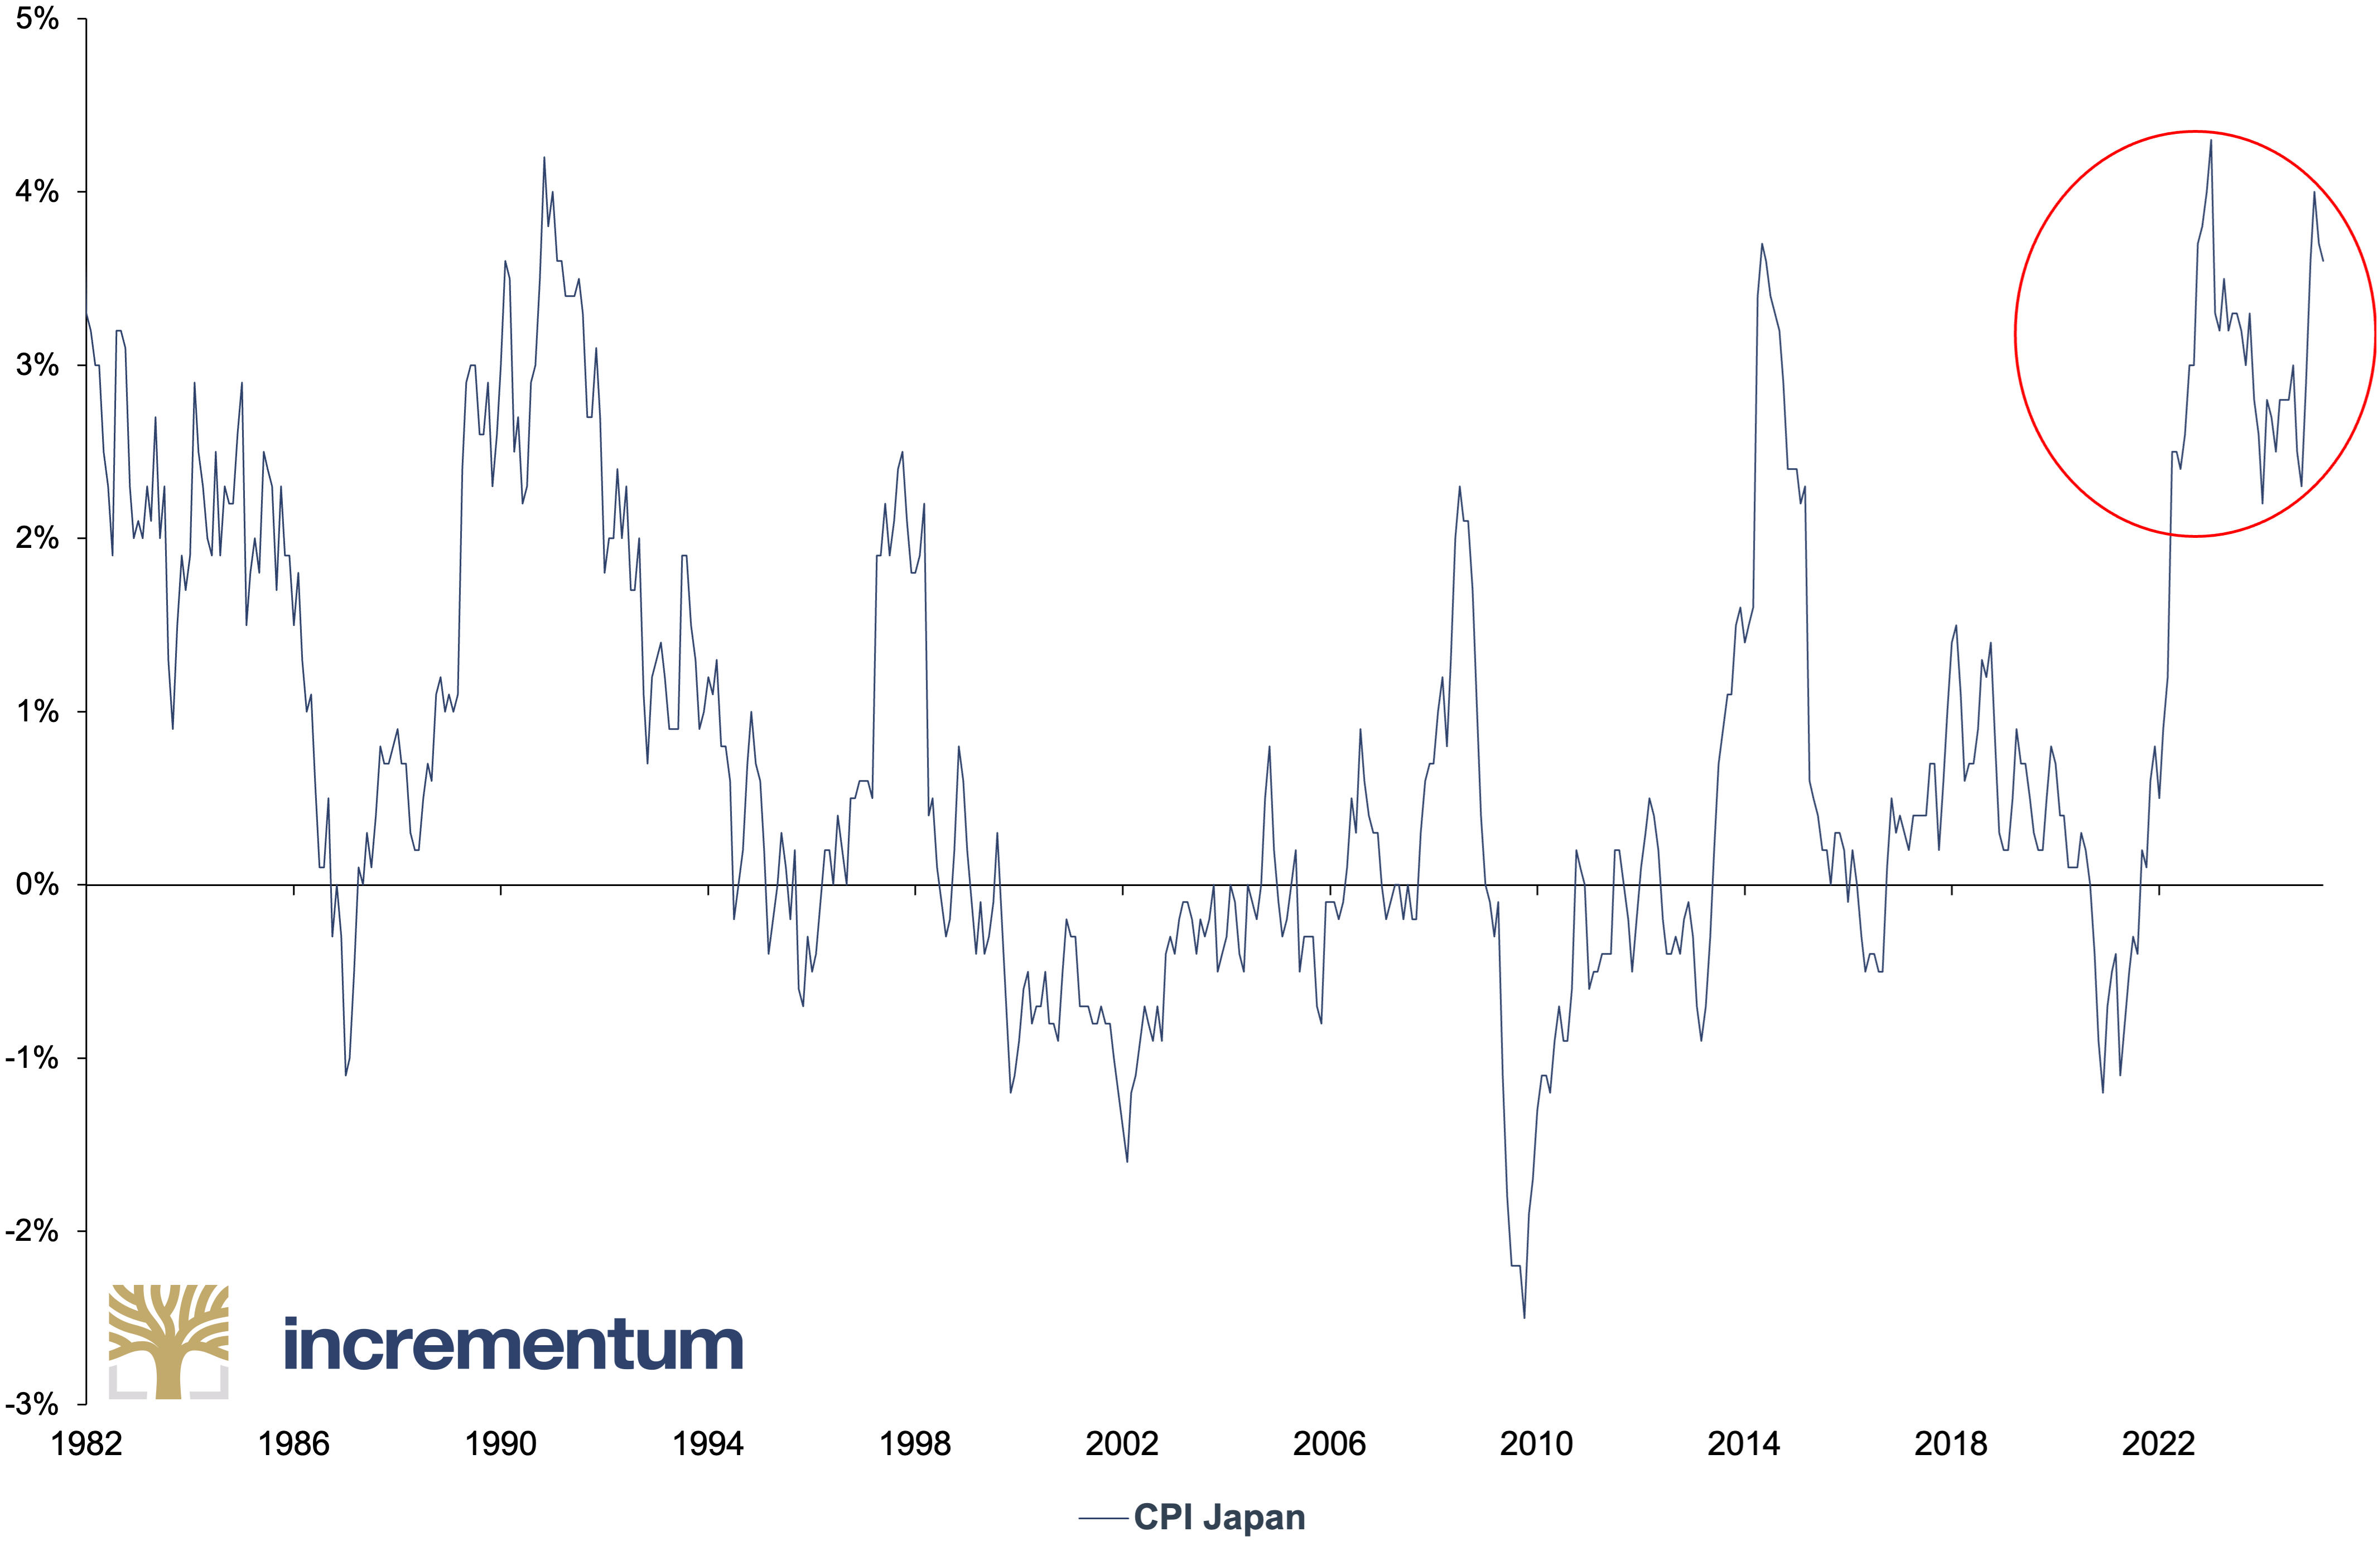
Source: LSEG, Incrementum AG
Not only the level but also the duration of inflation is historic. For 36 consecutive months, Japan’s CPI inflation rate has hovered above the 2% mark – the most–extended phase in over 40 years.
The financial and monetary structure is not unaffected by self-regulating exhaustion. Where centralization and regulation have long dominated, the pendulum is now swinging towards decentralization. This can be seen in the digital revolution of Bitcoin & Co. and political debates about national sovereignty and the streamlining of the state apparatus. The most prominent example of this development is the newly created Department of Government Efficiency (DOGE), whose aim is to reduce bureaucracy in the US significantly. A look at Argentina demonstrates that this change in political attitude is not limited to the US: President Javier Milei is pursuing a similar course, albeit with much tighter reins and more ideologically uncompromising rhetoric. And since the formation of its new government, even Austria has had its DOGE father, so to speak, in Sepp Schellhorn, who, as Secretary of State, is supposed to shrink the bureaucracy single-handedly. However, it can be assumed that the success of this project will be like that of a sunlight diet undertaken by The Notorious B.I.G.
Enantiodromia is unfolding its peculiar drama on the financial markets. Markets go through extreme boom-bust cycles – from overvalued tech stocks to neglected commodities. Periods of sluggish volatility are followed by phases in which geopolitical tensions and inflation fears take over. The zero interest rate policy era, fueled by seemingly inexhaustible liquidity, is over. Instead, we have recently experienced one of US history’s most rapid interest rate turnaround cycles.
Fed Rate Hike Cycles, Federal Funds Rate, 1967–2023
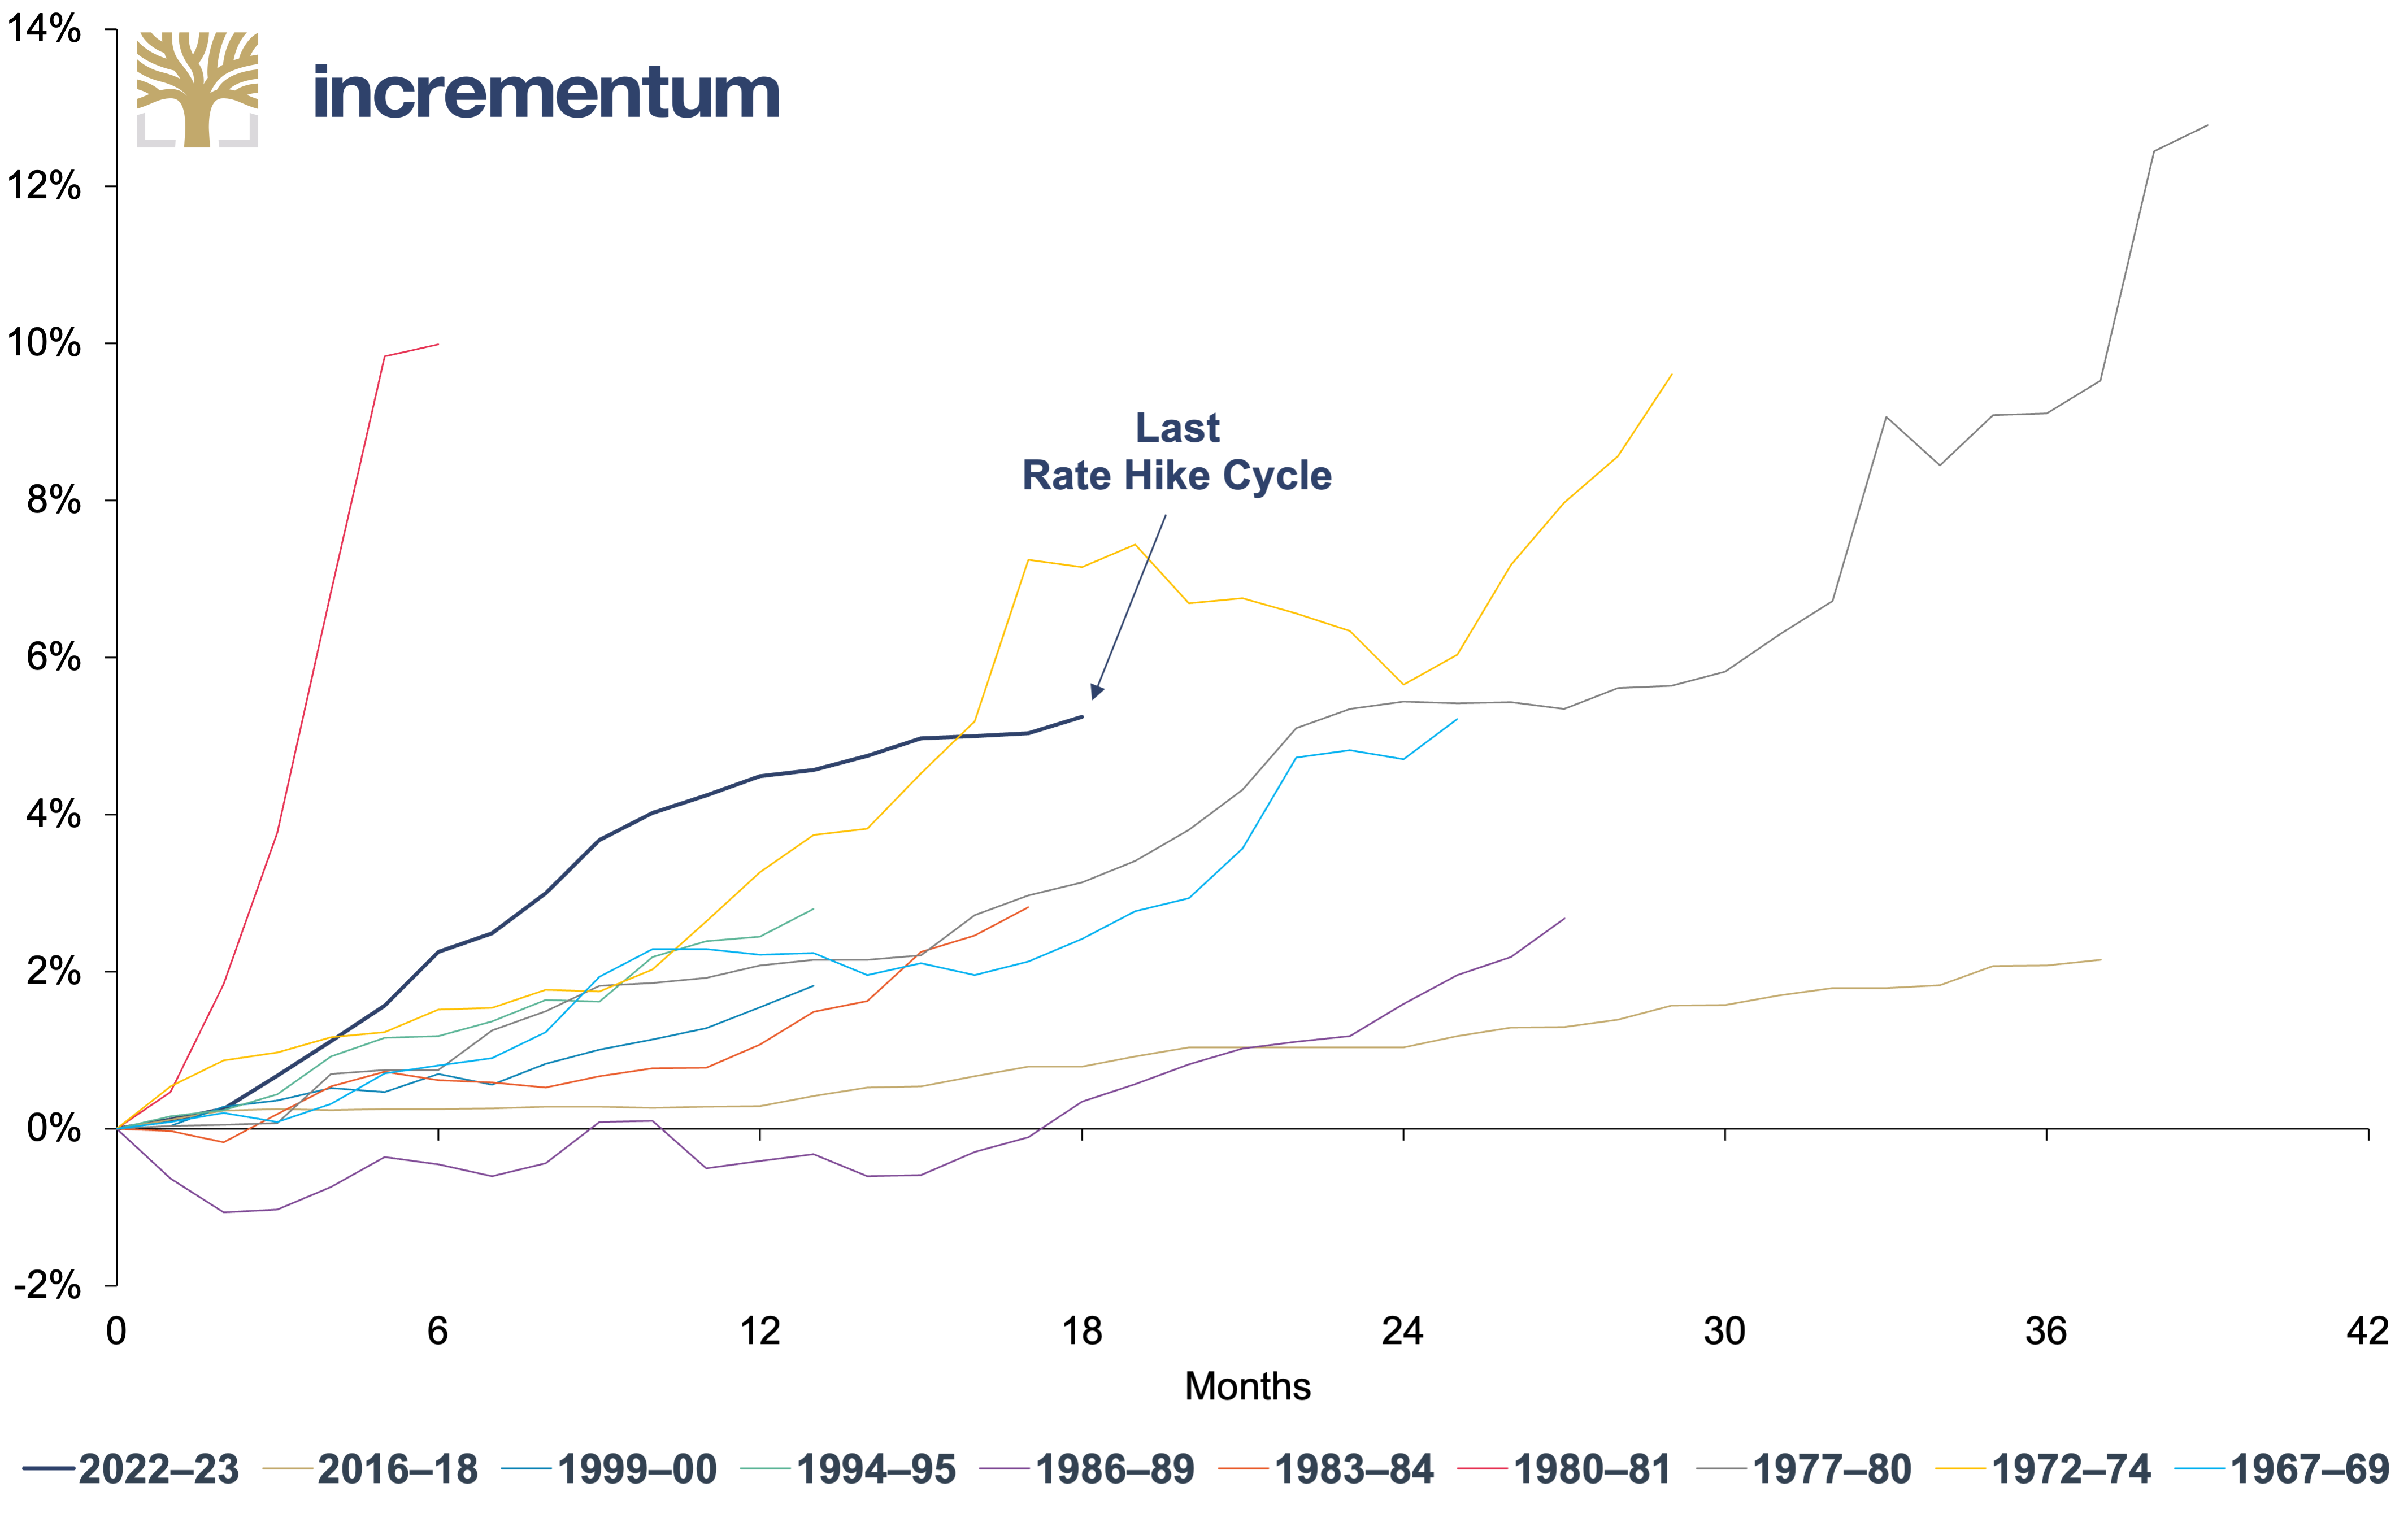
Source: LSEG, Incrementum AG
While central banks are experimenting with multipolar currency architectures, the longing for stability is growing. Decades of trust in paper money are being visibly eroded. And so, a commodity that had supposedly fallen out of time is coming back into the light and experiencing its own enantiodromic moment: gold. From a “non-interest-bearing relic” to the ultimate store of value for investors and institutions in a world reorganizing itself or at least trying to.
Under the Spell of Uncertainty
The multitude of enantiodromic developments creates an environment that is particularly favorable to gold, as the current climate is one thing above all: uncertain. Inflation fears, an exploding debt burden due to fiscal carelessness, persistent geopolitical tensions, and the regularly recurring fear of a recession create a climate tantamount to a super-GAU for traditional assets. Not so for gold. What represents a stress test for the classic 60/40 portfolio is the ideal stage for gold.
It is hardly surprising, or at least it shouldn’t be, that gold has become the leading asset among the major asset classes this decade. Since 2020, when we postulated “The Dawning of a Golden Decade”, gold has not only outperformed tangible assets such as real estate and the broad commodities market, but also US government bonds and US equities, even after considering dividends.
Gold, S&P 500 TR, BCOM TR, US 20Y Index TR, and US National Home Price Index, in USD, 100 = 31.12.2019, 01/2020–04/2025
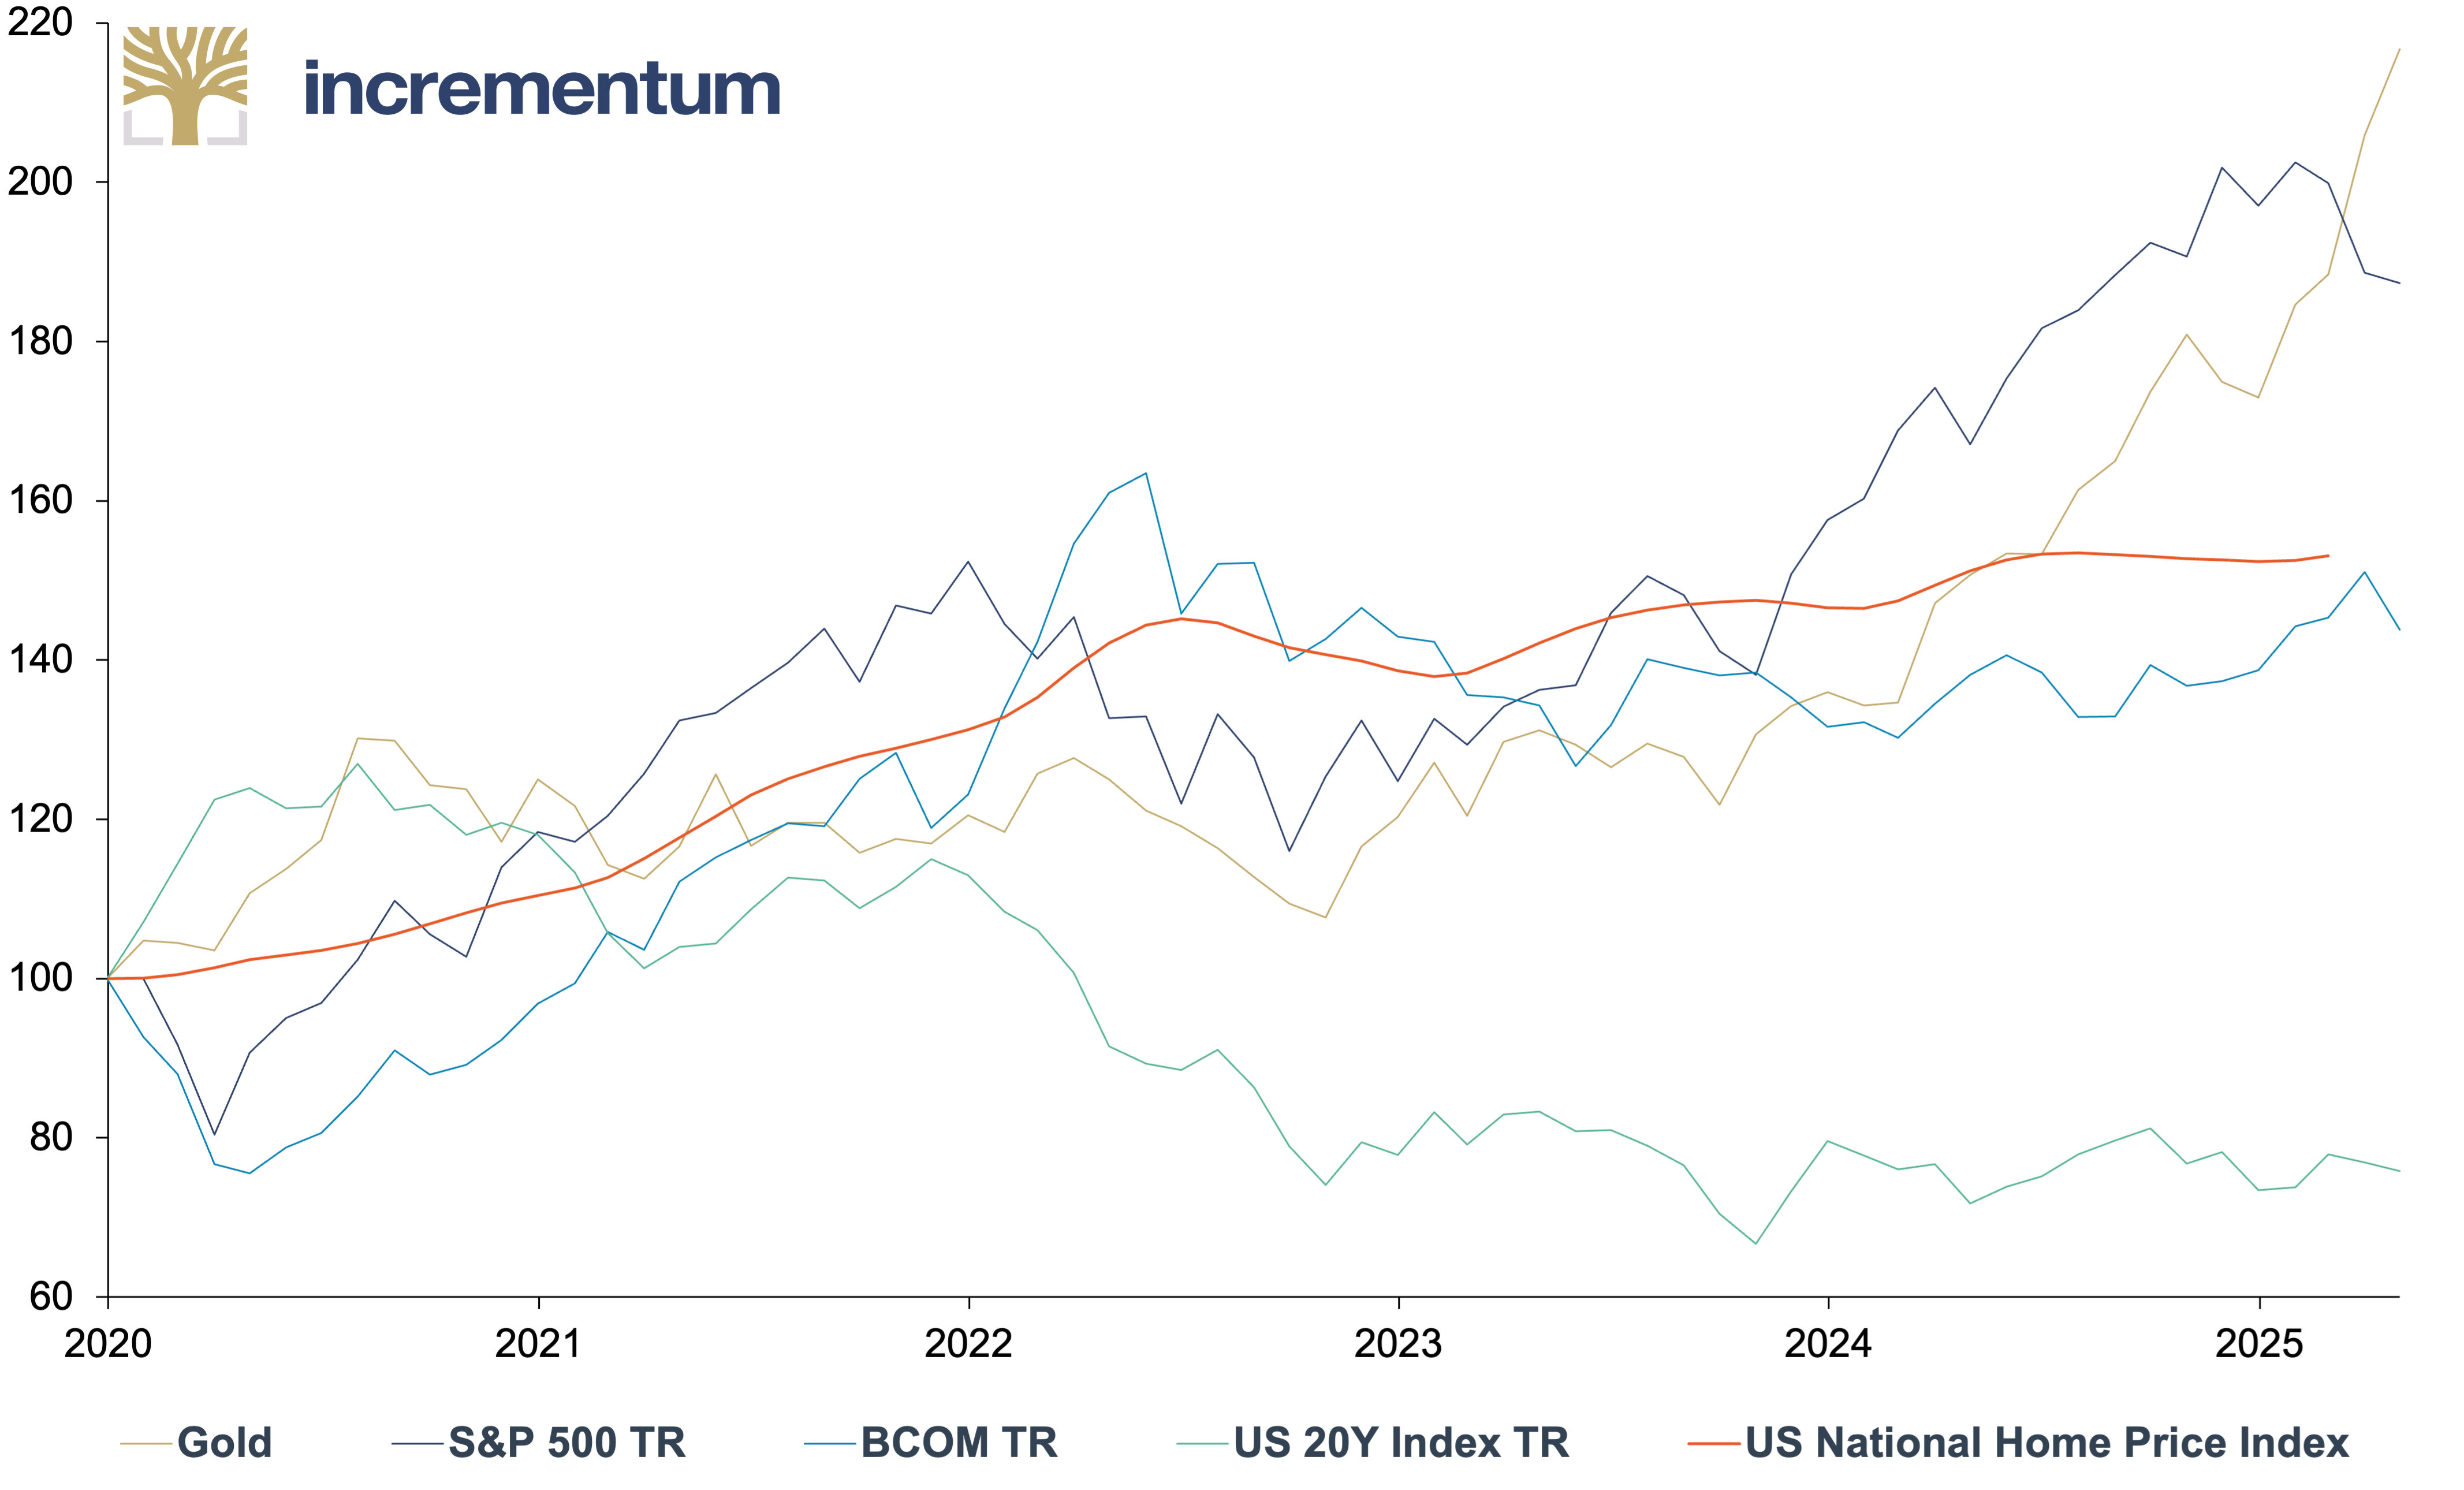
Source: LSEG, Incrementum AG
Nevertheless, this has caught many market participants on the wrong foot. Even the price performance of the past 12 months surprised many institutional investors. A look at the World Bank Group’s forecasts in its publication of the “Commodity Markets Outlook in April 2024” underlines this: An average gold price of just USD 2,100 was expected for 2024, with a decline to USD 2,050 in 2025. In retrospect, the gold price expectations were as realistic as the budget plan for constructing the new Berlin Airport.
The Economic Policy Uncertainty Index and the Geopolitical Risk Index provide a reliable measure of global economic and geopolitical uncertainty. The combination of both indicators makes it clear that the current market environment is characterized by an exceptionally high level of uncertainty, driven by economic and geopolitical factors.
Global Economic Policy Uncertainty Index, and Geopolitical Risk Index, 100 = 01/1997 (log), 01/1997–03/2025
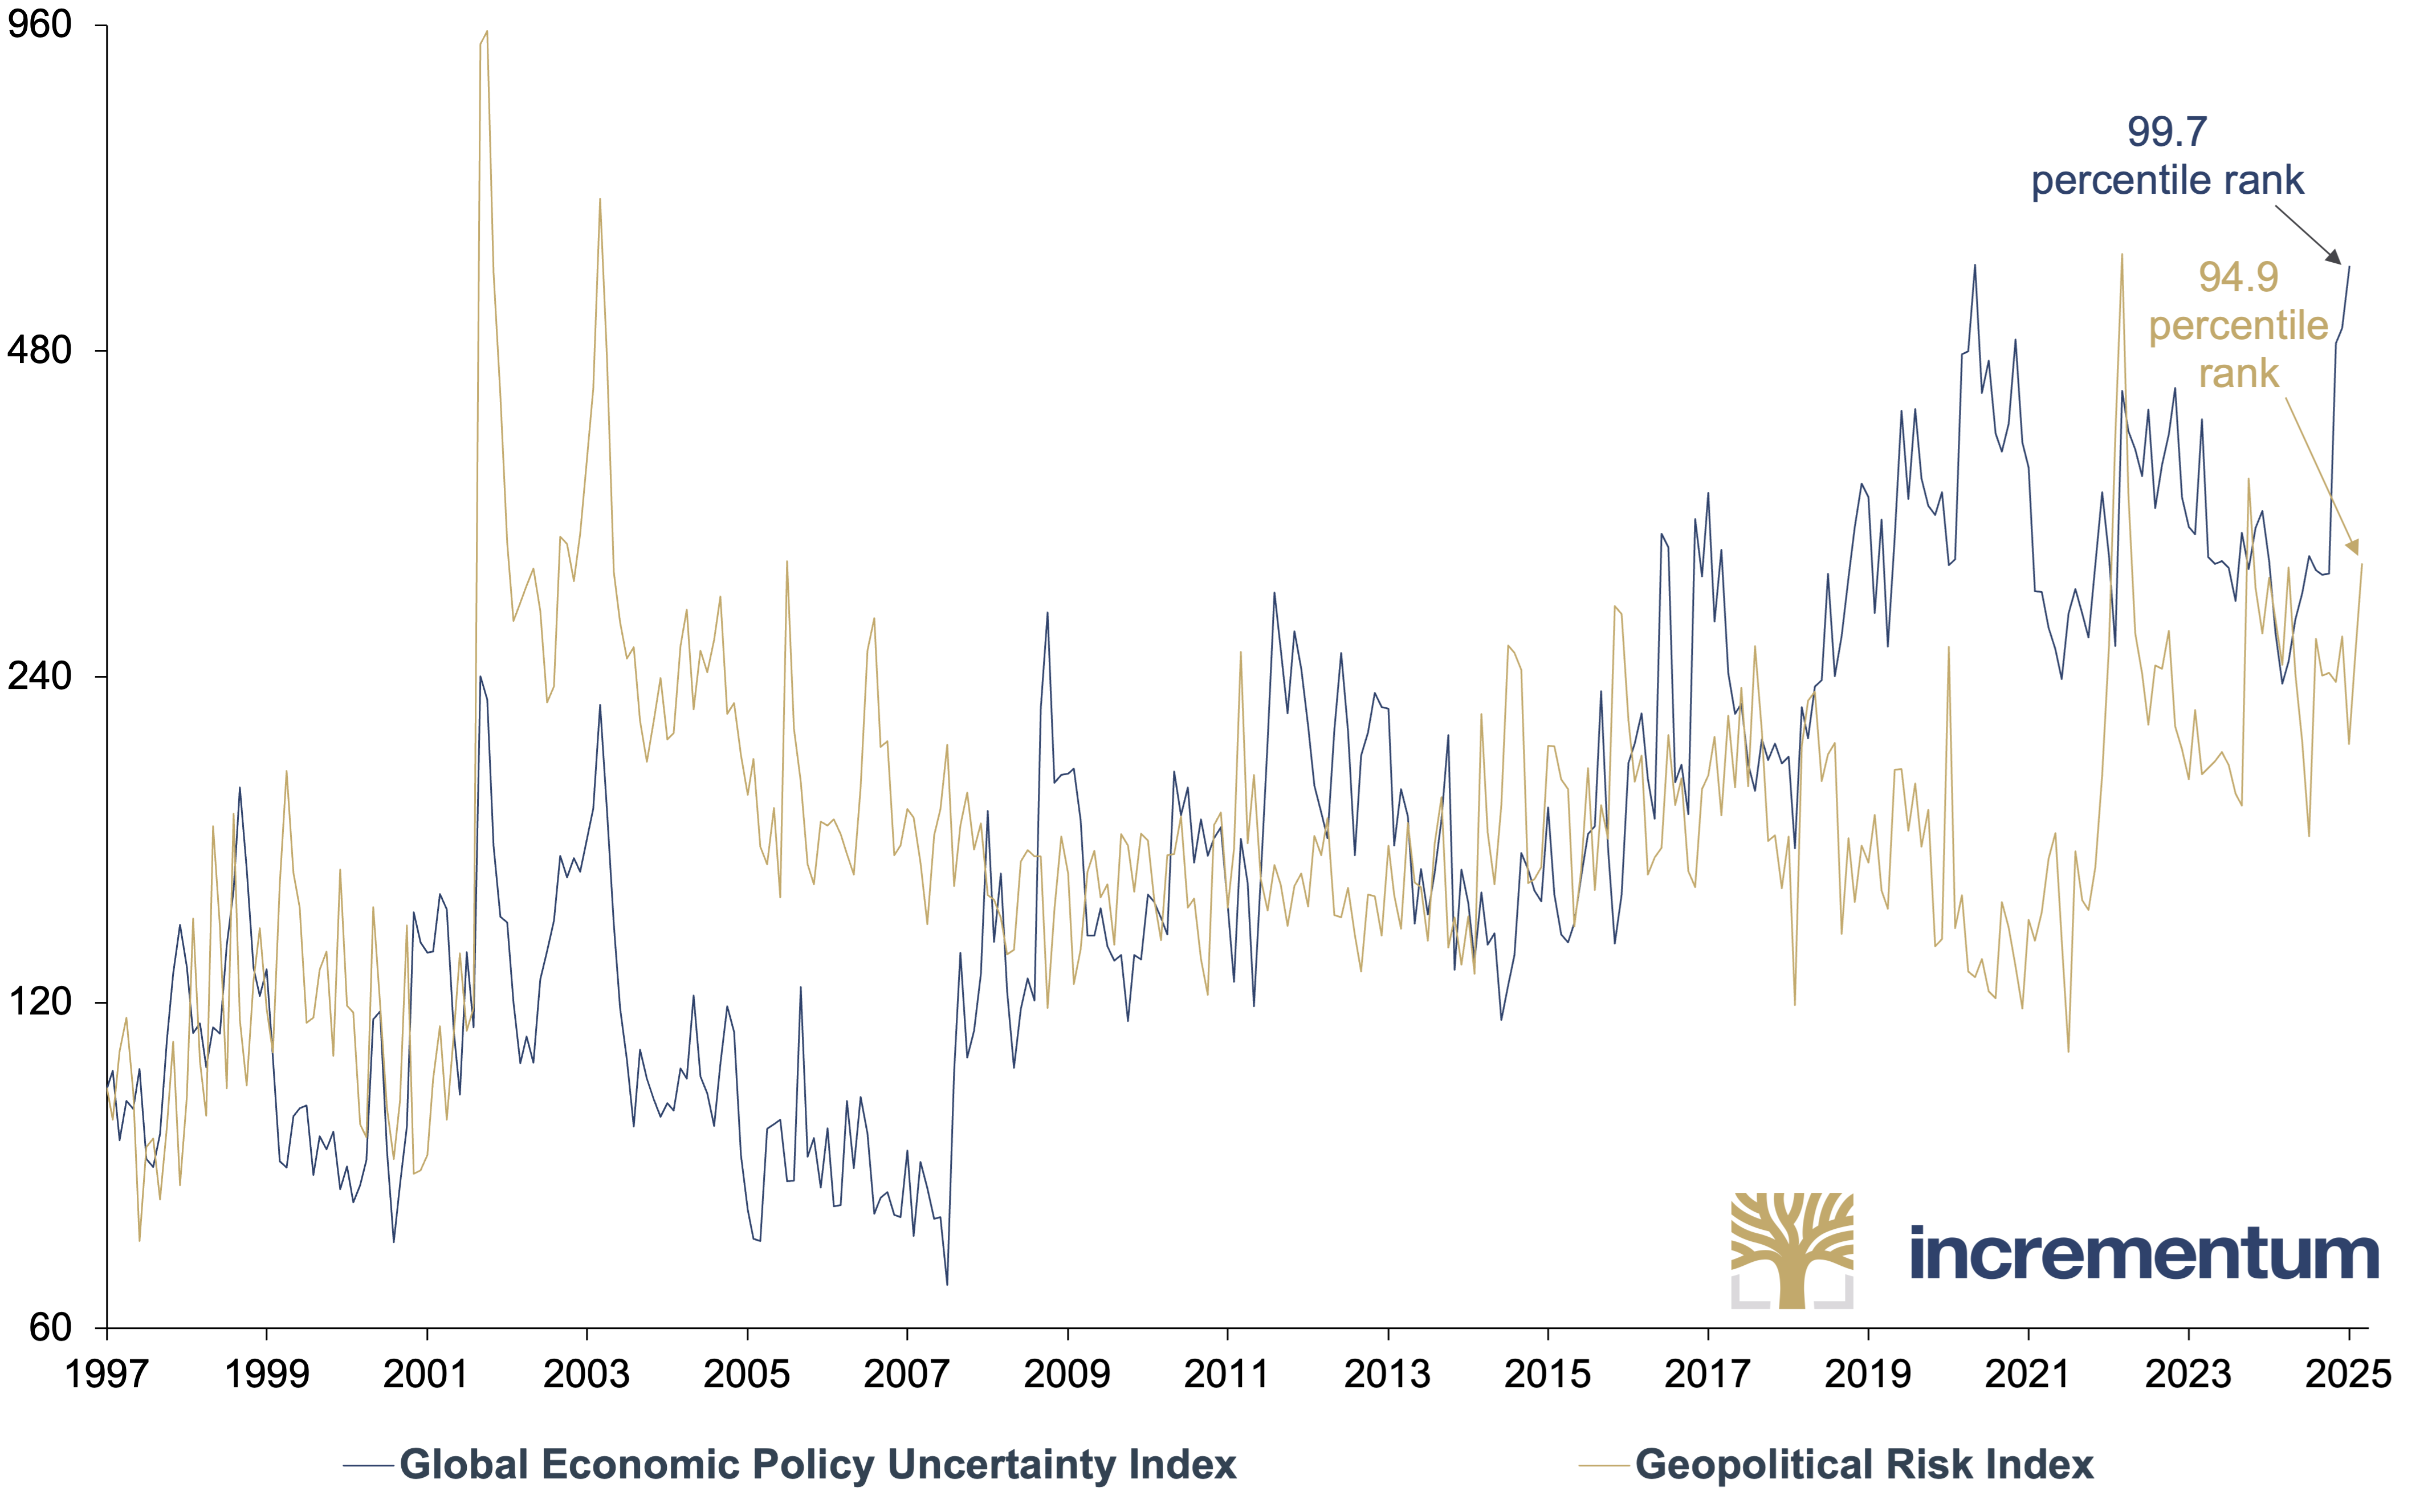
Source: Economic Policy Uncertainty, Incrementum AG
Monetary exodus
Enantiodromia threatens to become a systemic stress test in a system that has long relied on permanently low interest rates and constant liquidity. Recent data from the University of Michigan shows that consumers’ inflation expectations for March 2026 have risen to 6.5%, a marked increase compared to 2.8% at the end of 2025. Long-term expectations for the next five years climbed to 4.4%, the highest level since the early 1990s.
US Median Inflation Expectations over 1 and 5 Years, 01/2010–04/2025
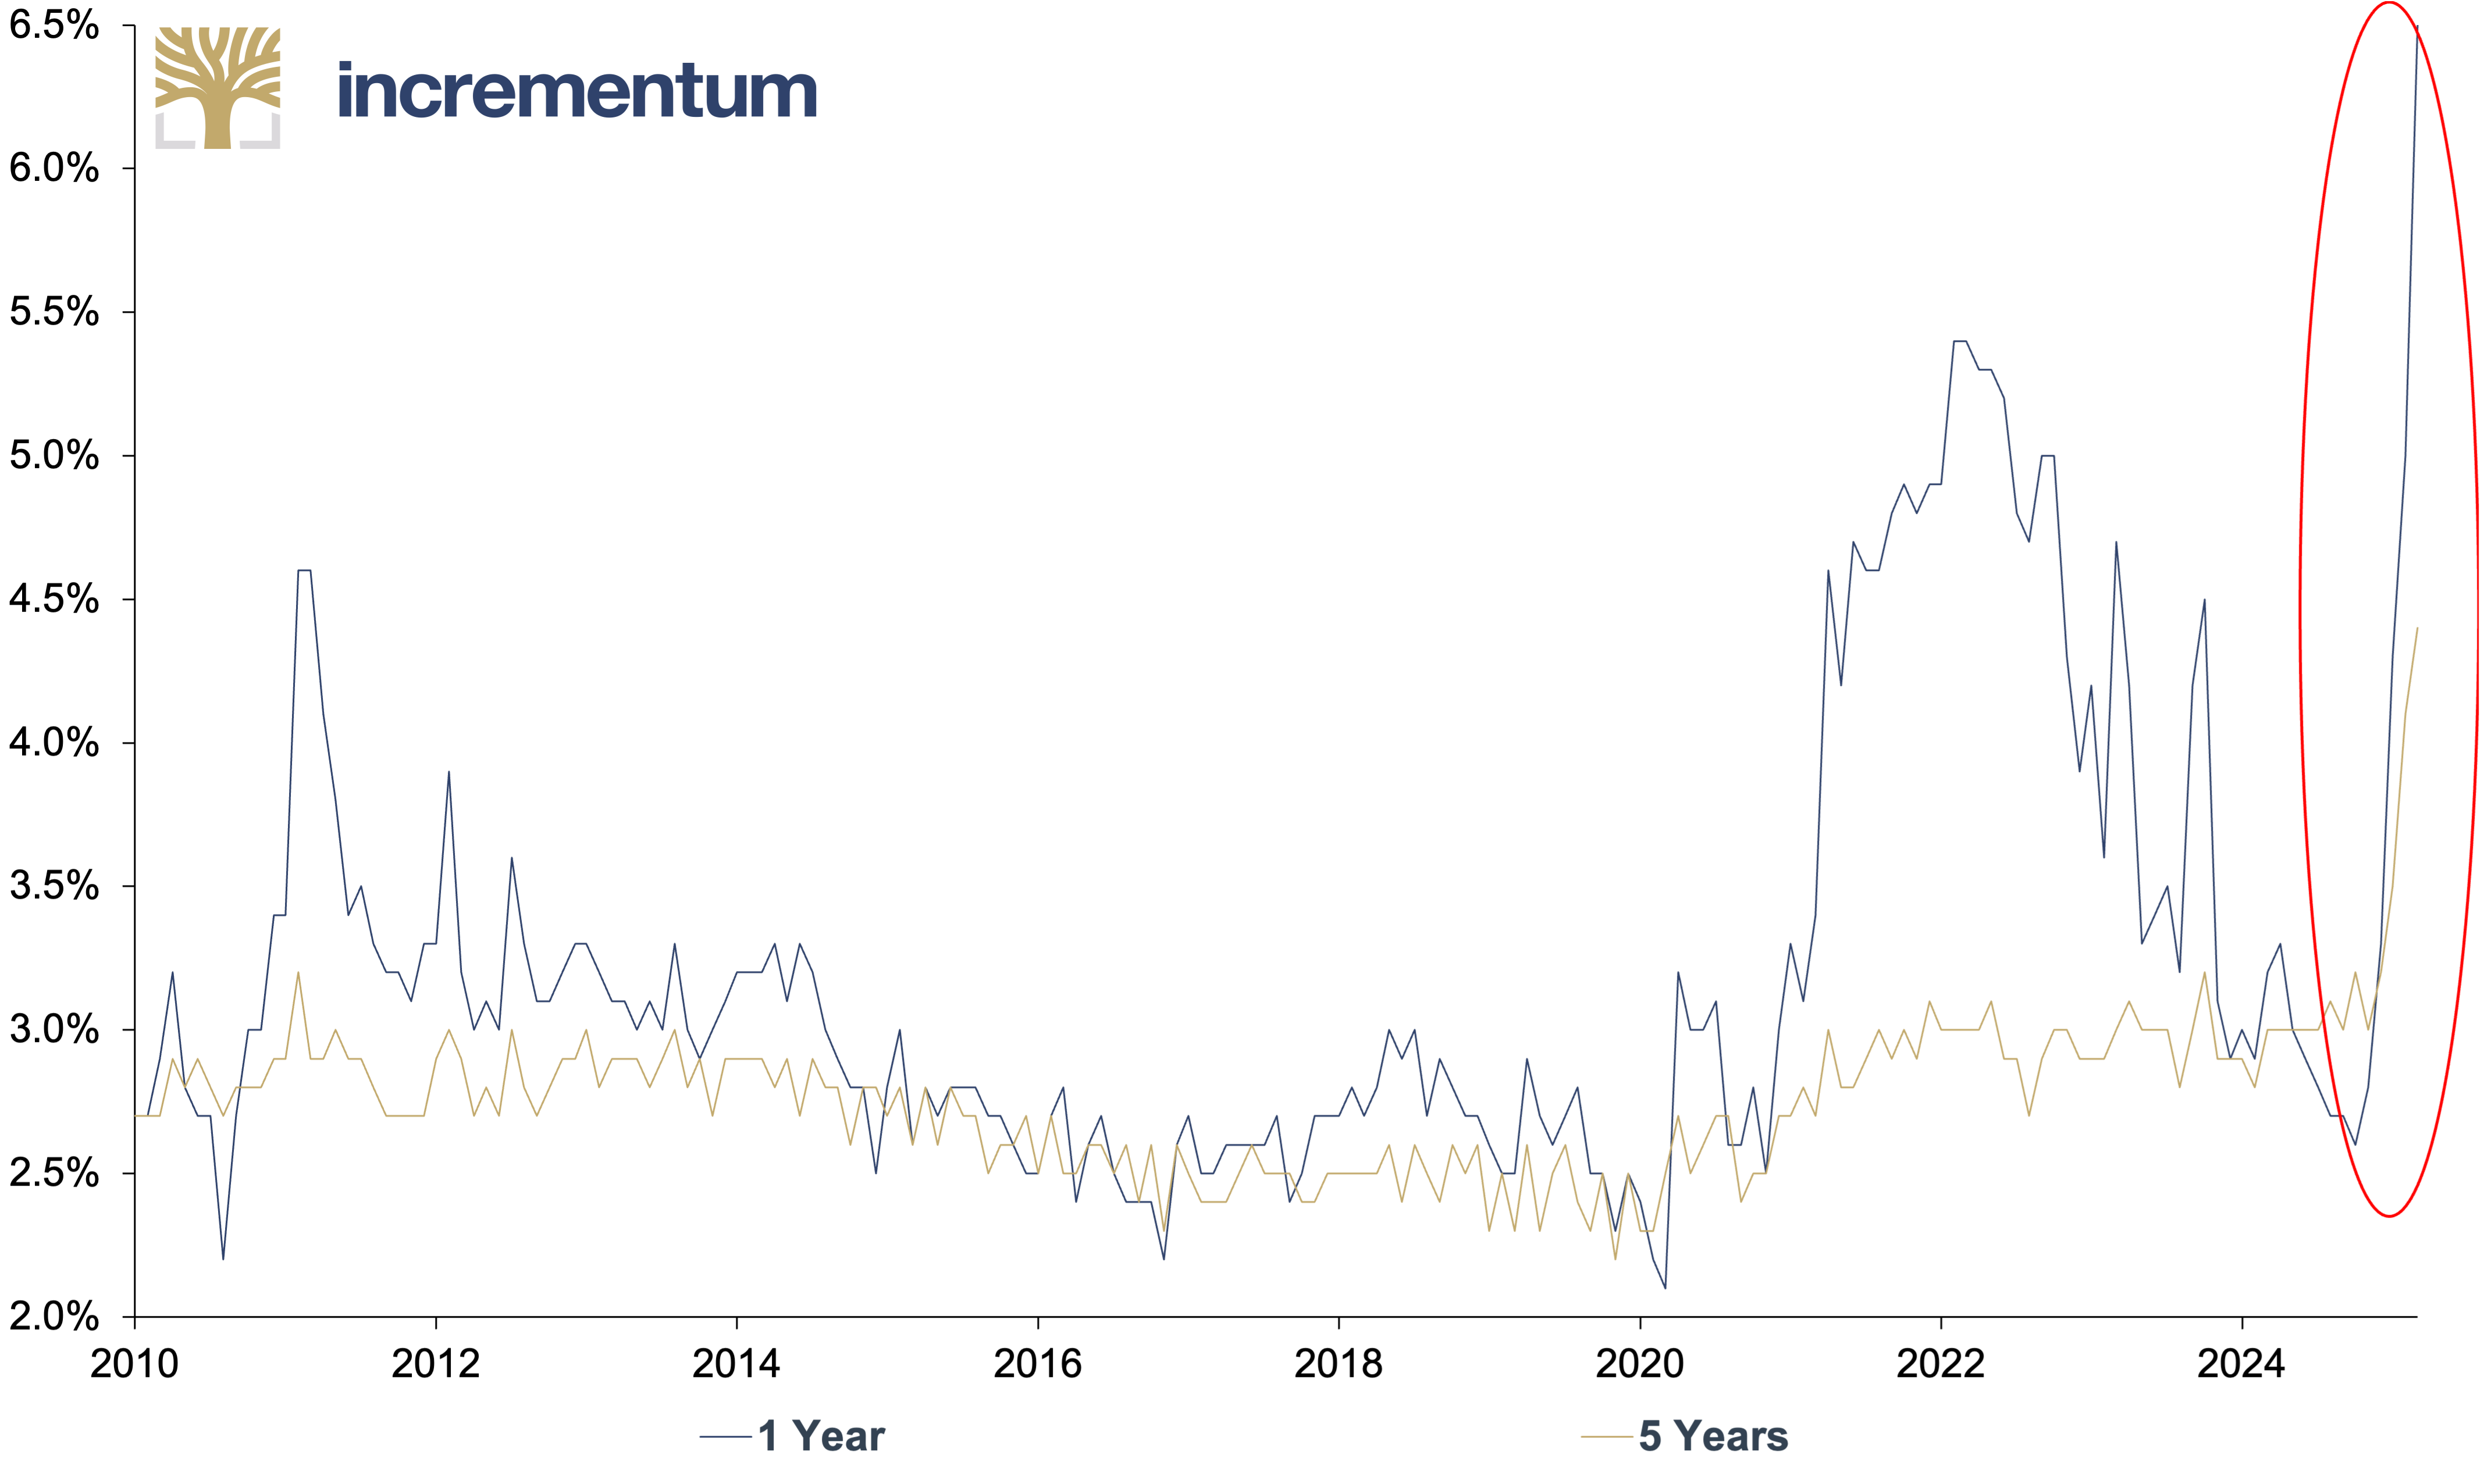
Source: LSEG, Incrementum AG
Even if forecasts and survey figures on macroeconomic indicators should always be interpreted with a certain degree of caution, a clear picture is emerging: The perception of currency devaluation and the associated uncertainty are deeply rooted in the collective consciousness and are therefore likely to have a significant influence on financial decisions, particularly on investment.
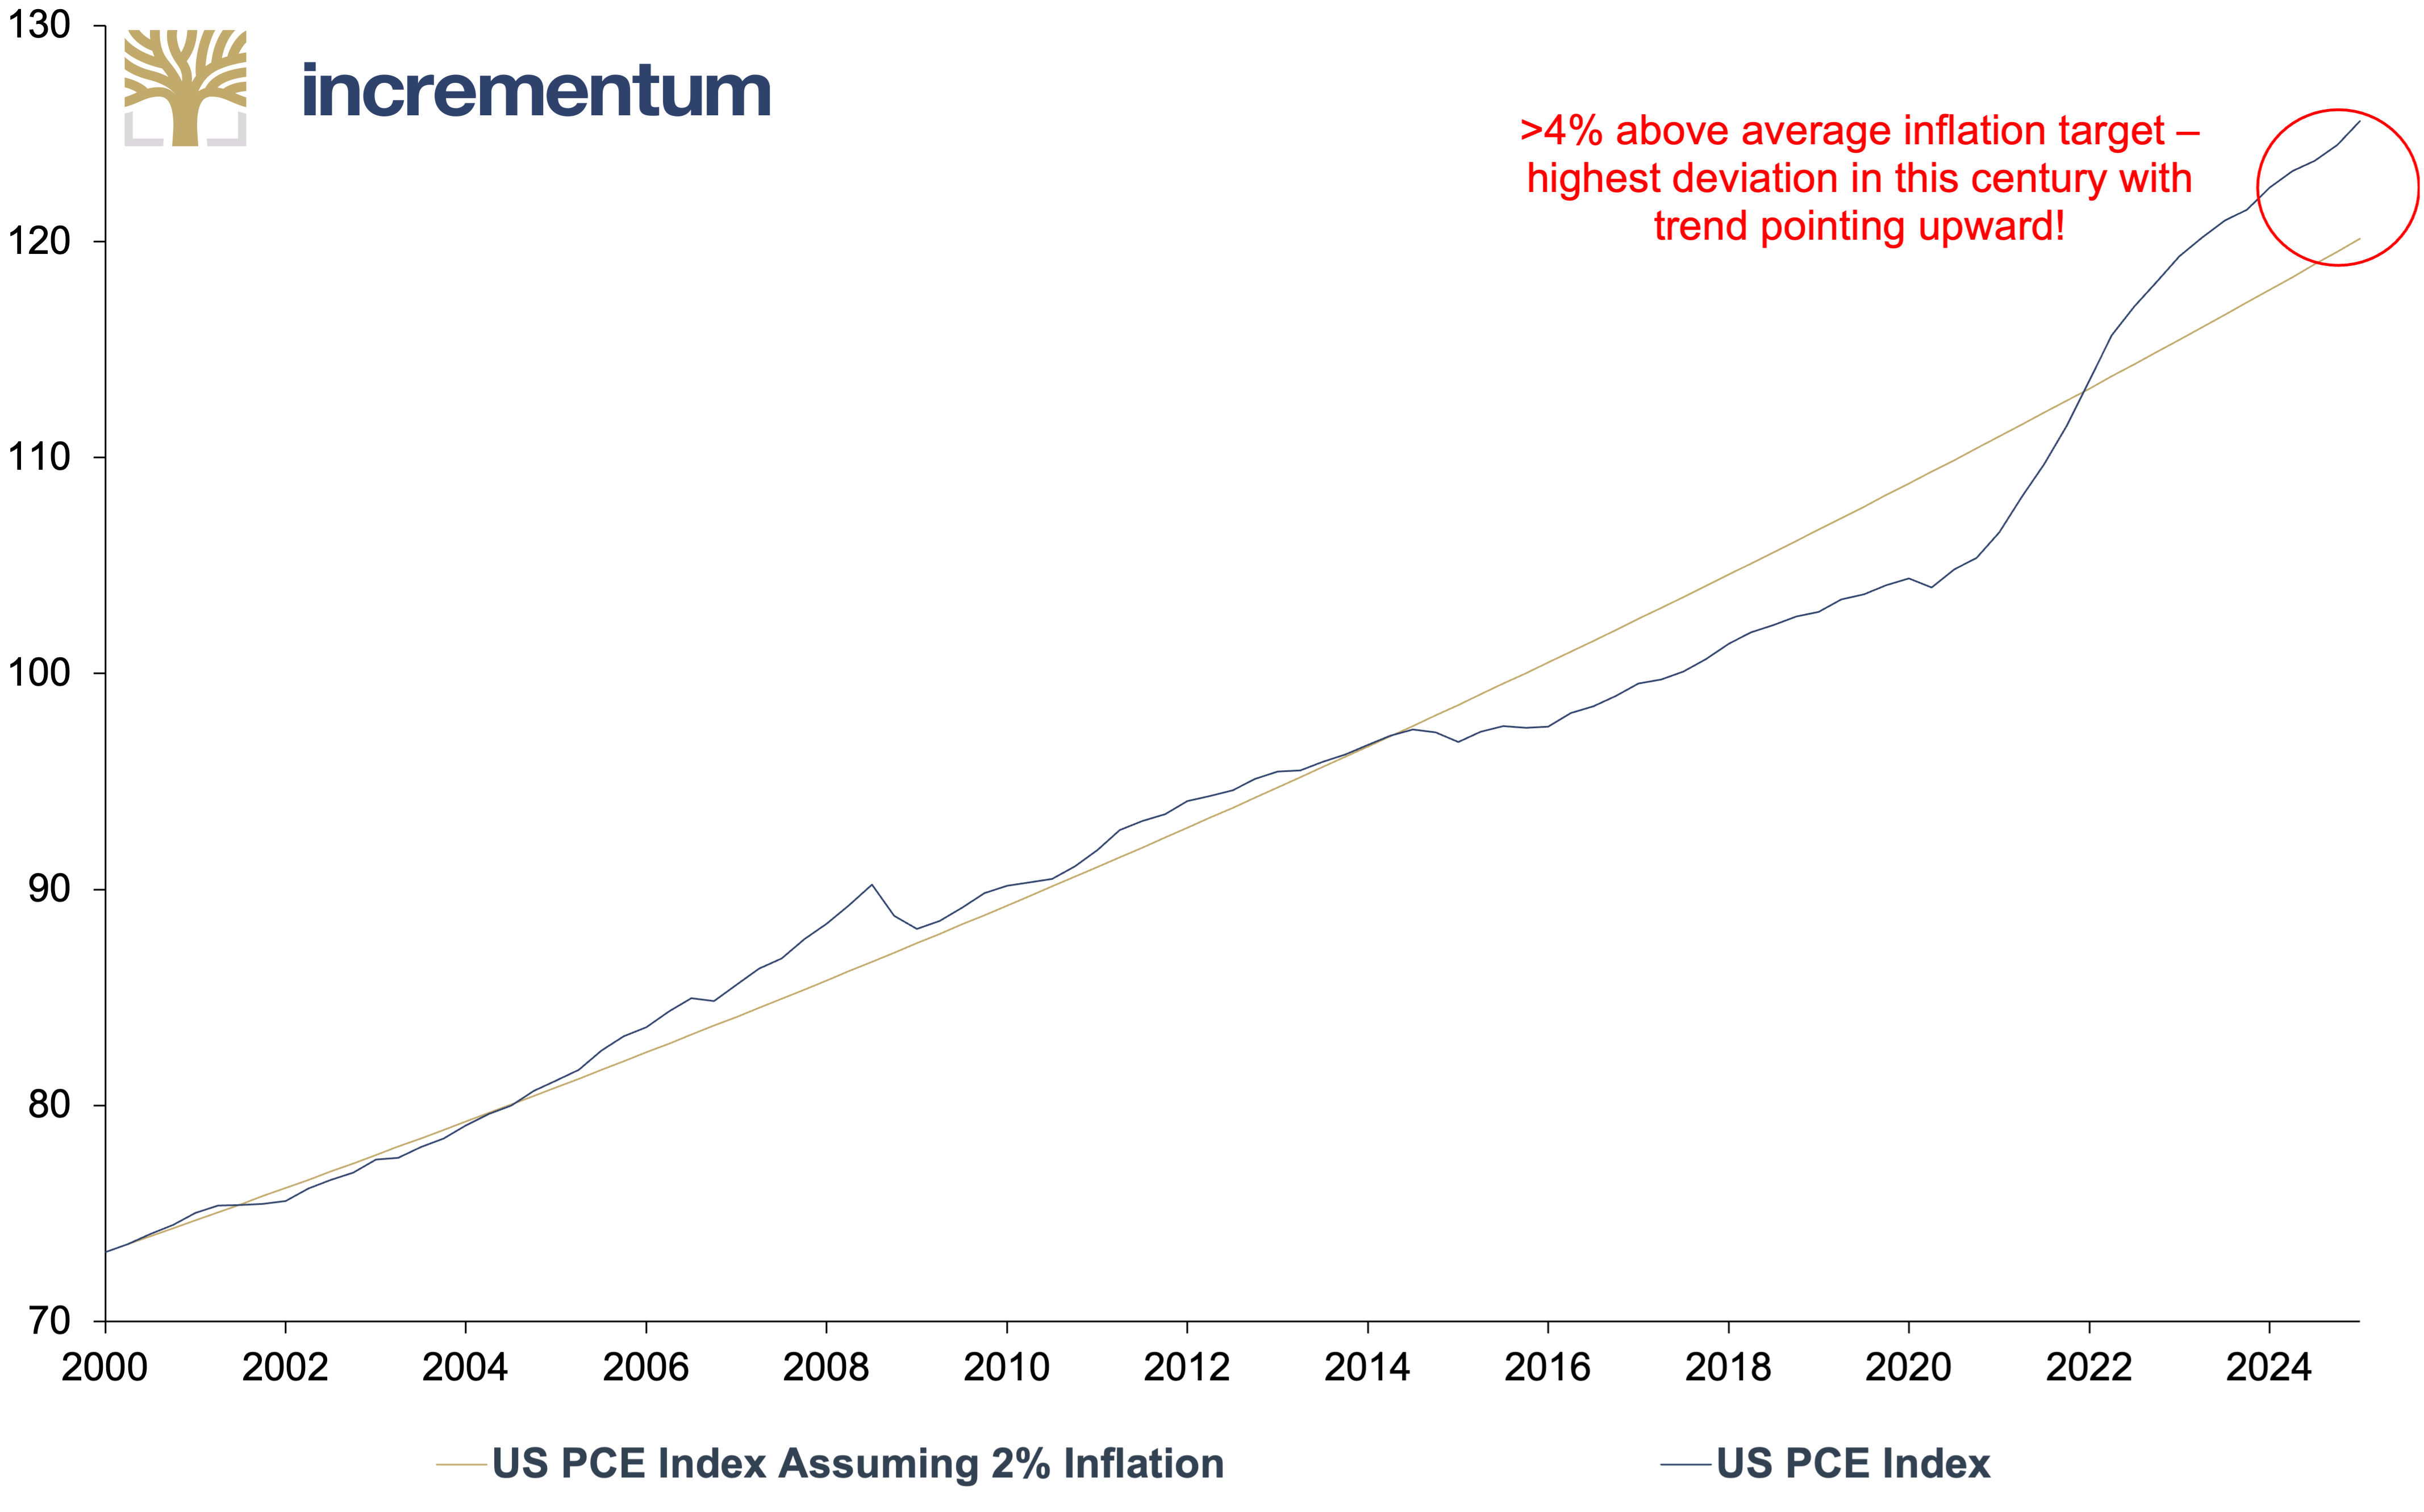
Despite interim interest rate hikes, the Federal Reserve has not yet succeeded in anchoring the inflation target of 2% in the long term. Over the long term, the PCE inflation path is currently above the average target of 2% set by the Federal Reserve. This puts the central bank in an awkward position: The attempt to ensure stability over the years through cheap money now results in its opposite.
US PCE Index Assuming Target Average of 2% Inflation, and US PCE Index, Q1/2000–Q1/2025
Source: LSEG, Incrementum AG
At the same time, the US national debt is reaching new record highs. At the beginning of March 2025, it amounted to USD 36.56trn or around 124% of GDP. The rapid growth in debt is significantly increasing the federal budget interest burden. For the 2024 financial year, interest payments amounted to around USD 1.1trn, around 16% of total government spending.
These developments pressure the Federal Reserve to adjust its monetary policy. Rising inflation expectations could limit the scope for interest rate cuts, while the high debt burden limits the scope for fiscal policy action. At the same time, Donald Trump, a president who is a proponent of low interest rates and a weak US dollar, is sitting in the White House and regularly trying to interfere in the independent decision-making process by any means necessary.
One thing is sure: The monetary exodus has begun. Not as a panic flight, but as a rational march, borne by the realization that systems cannot resist their internal equilibrium forever. Those who recognize the wind before the storm breaks can set their sails in good times: in the direction of stability, in the direction of substance, in the direction of gold.
New playbook meets old playbook
For a long time, the gold market followed an almost mechanical logic: If real interest rates fell, the gold price rose; if interest rates rose, the gold price came under pressure. This “old playbook” shaped the behavior of Western financial investors for decades. What is currently emerging on the gold market goes beyond these linear relationships. We described the fundamental changes in the In Gold We Trust report 2024 as “The New Gold Playbook”, which is increasingly complementing the old one, but not replacing it.
Driven by the expectation of falling real interest rates and growing geopolitical uncertainty, capital flows from Western financial investors into physical gold, ETFs, and futures positions are increasing significantly again. After years of restraint, the institutional West is beginning to rethink and expand its strategic gold allocation.
The latest data from the World Gold Council shows that ETF inflows in Q3/2024 turned net positive again for the first time since Q1/2022. This shows a clear upward trend in aggregate net inflows from central bank demand, which has recently been driven primarily by demand from Asian central banks, and Western-dominated ETF demand.
Central Bank, ETF, and Net Gold Flows, in Tonnes, Q1/2010–Q1/2025
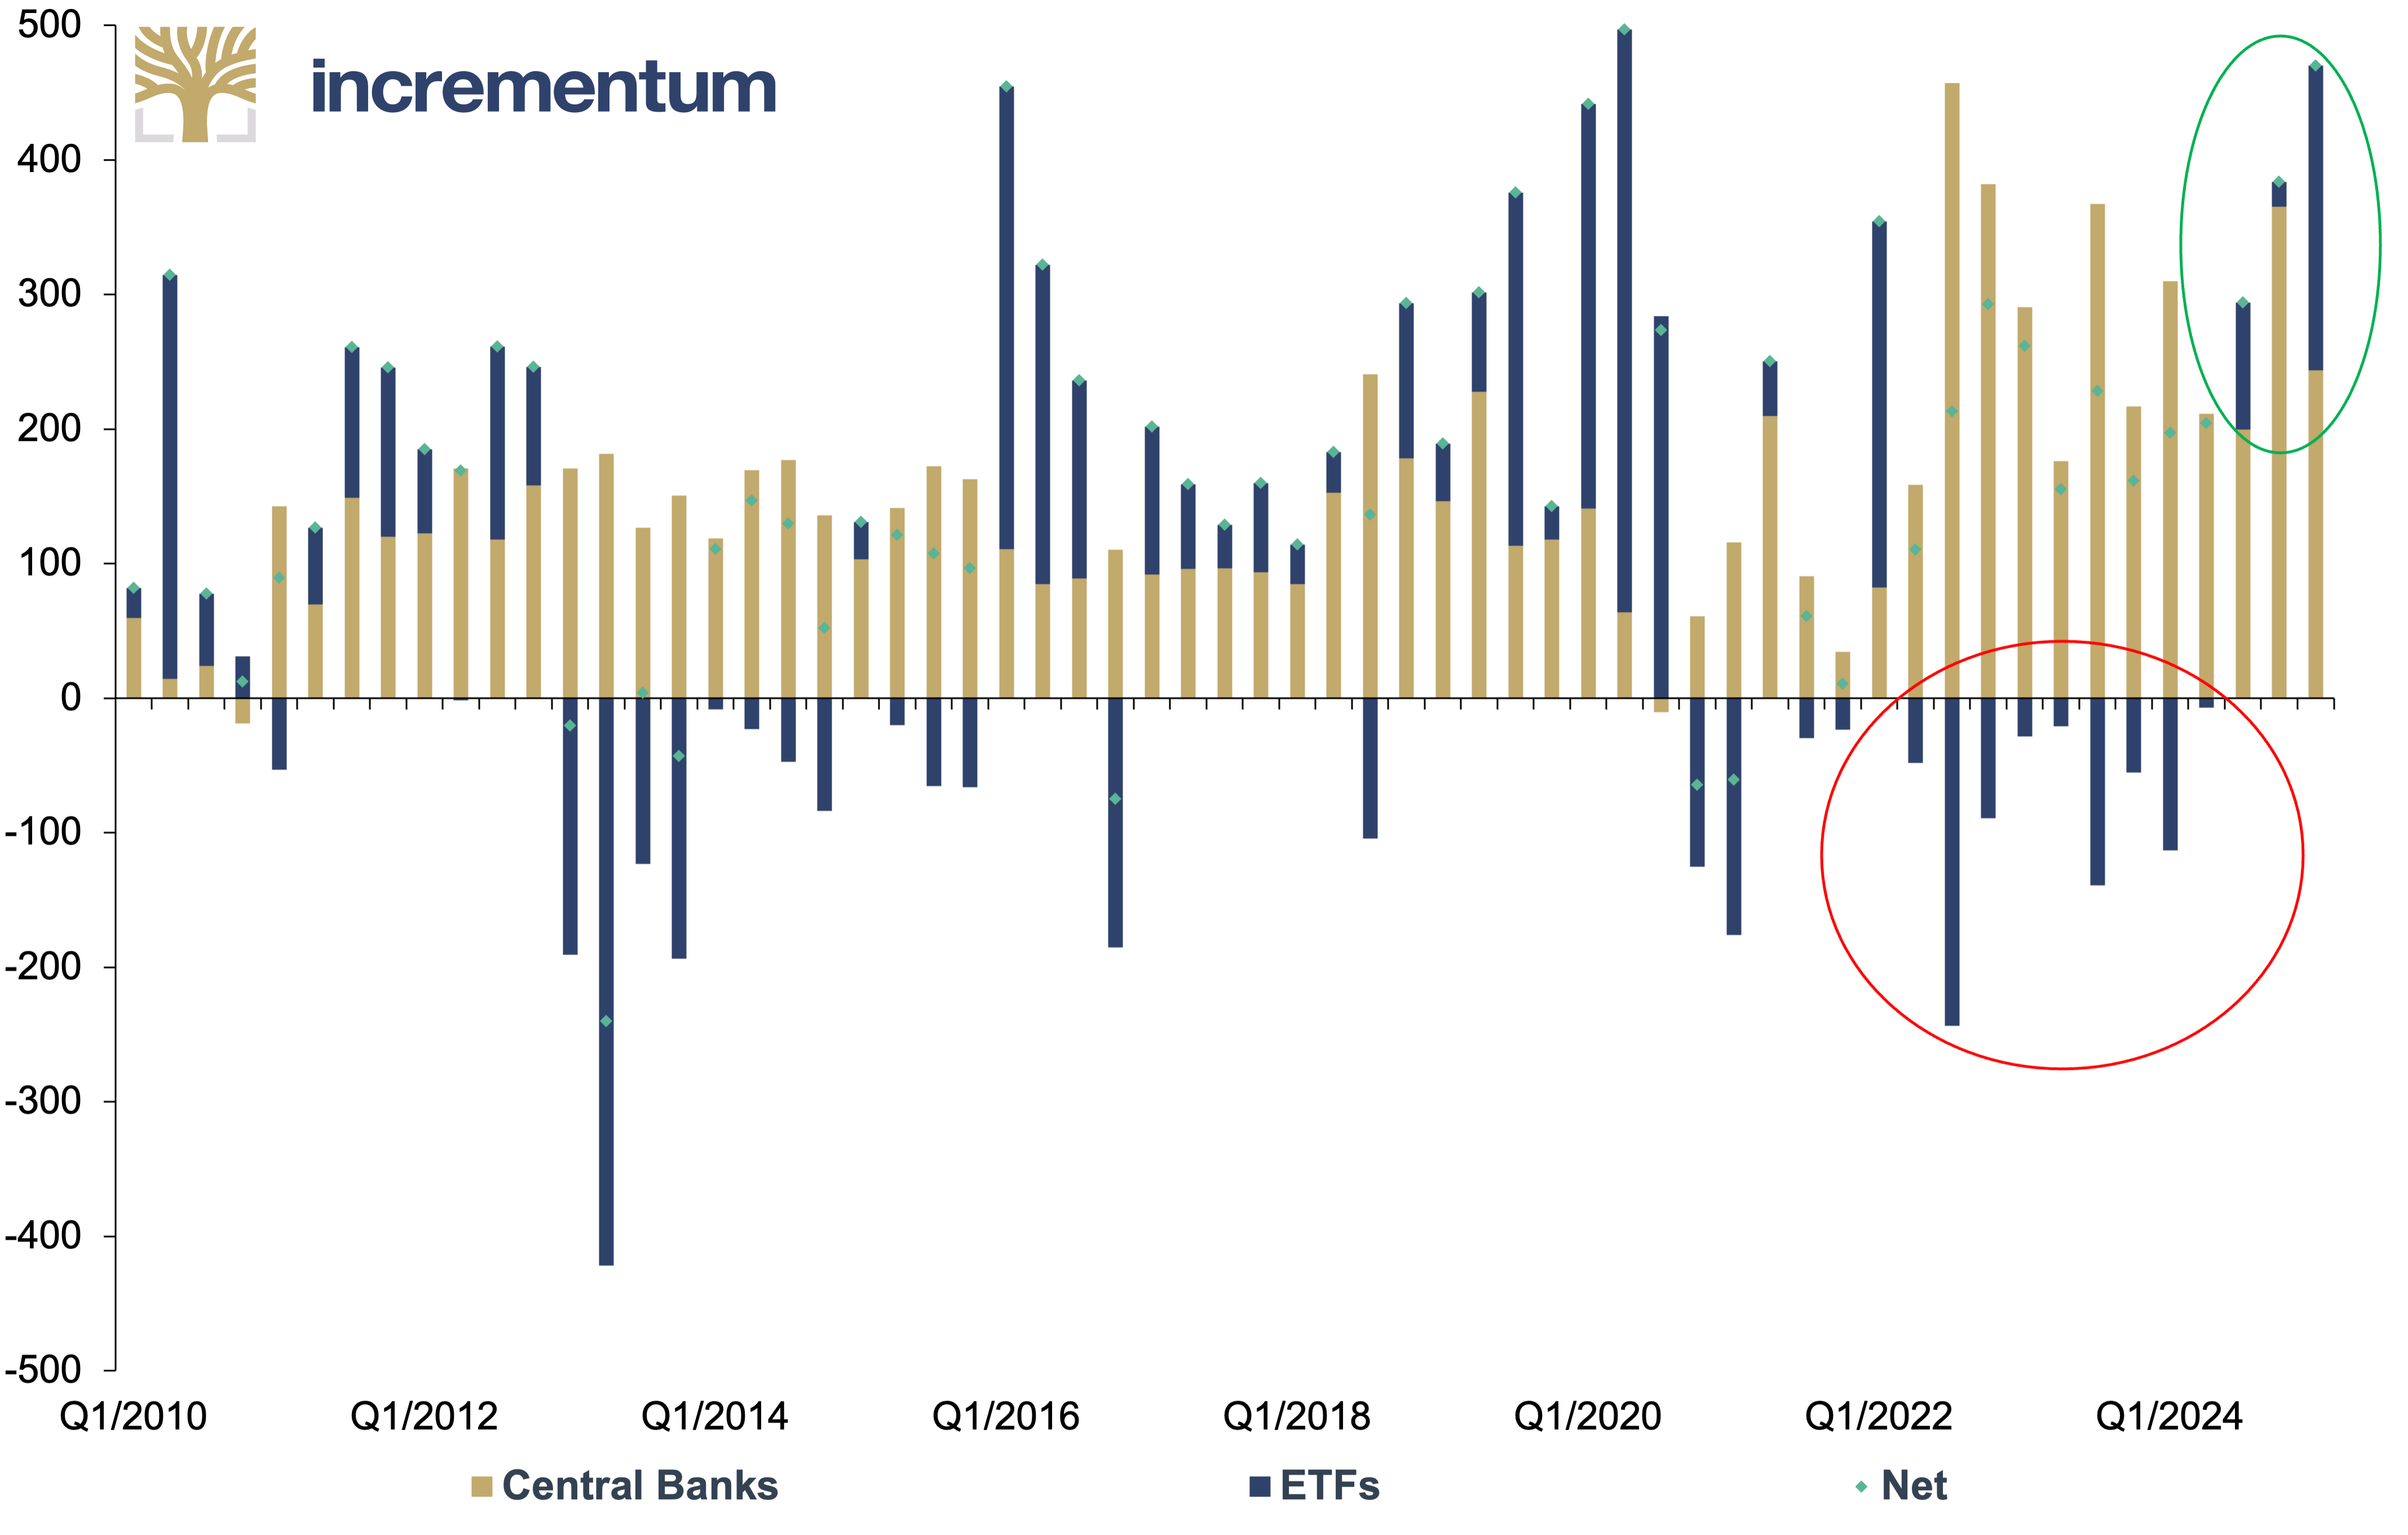
Source: WGC, Incrementum AG
Coupled with the continued steady demand for gold from the East, which we described as one of the key factors in our In Gold We Trust report 2024, the return of Western gold investors should make the demand side as lively as the front row of a Taylor Swift concert in the future, even if the gold market tends to be less about glitter and fangirls and more about sterile central bankers and grey-templed asset managers.
Gold at USD 4,800 – Destiny or Illusion?
History is repeating itself – at least in part. This news should currently delight gold investors: It is a déjà vu of a golden decade like the ones we experienced in the 1970s and 2000s. Back in 2020, at the beginning of the current decade, we pointed out the increasing signs that gold could once again be on the verge of a structural upswing, when we wrote in “The Dawning of a Golden Decade”:
As unpleasant as the dynamics in general are, the conditions for gold could not be better, given massively overindebted economies, which, as a last resort, use the devaluation of their currencies to finance their deficits. For these and a number of other reasons, we take a broad view and foresee “The Dawning of a Golden Decade”.
Now, halfway through the 2020s, our assessment has proved correct. Since 2020, the price of gold has more than doubled in US dollars and set numerous new all-time highs in all currencies.
Gold, in USD, and New ATH Closes, 01/1970–04/2025
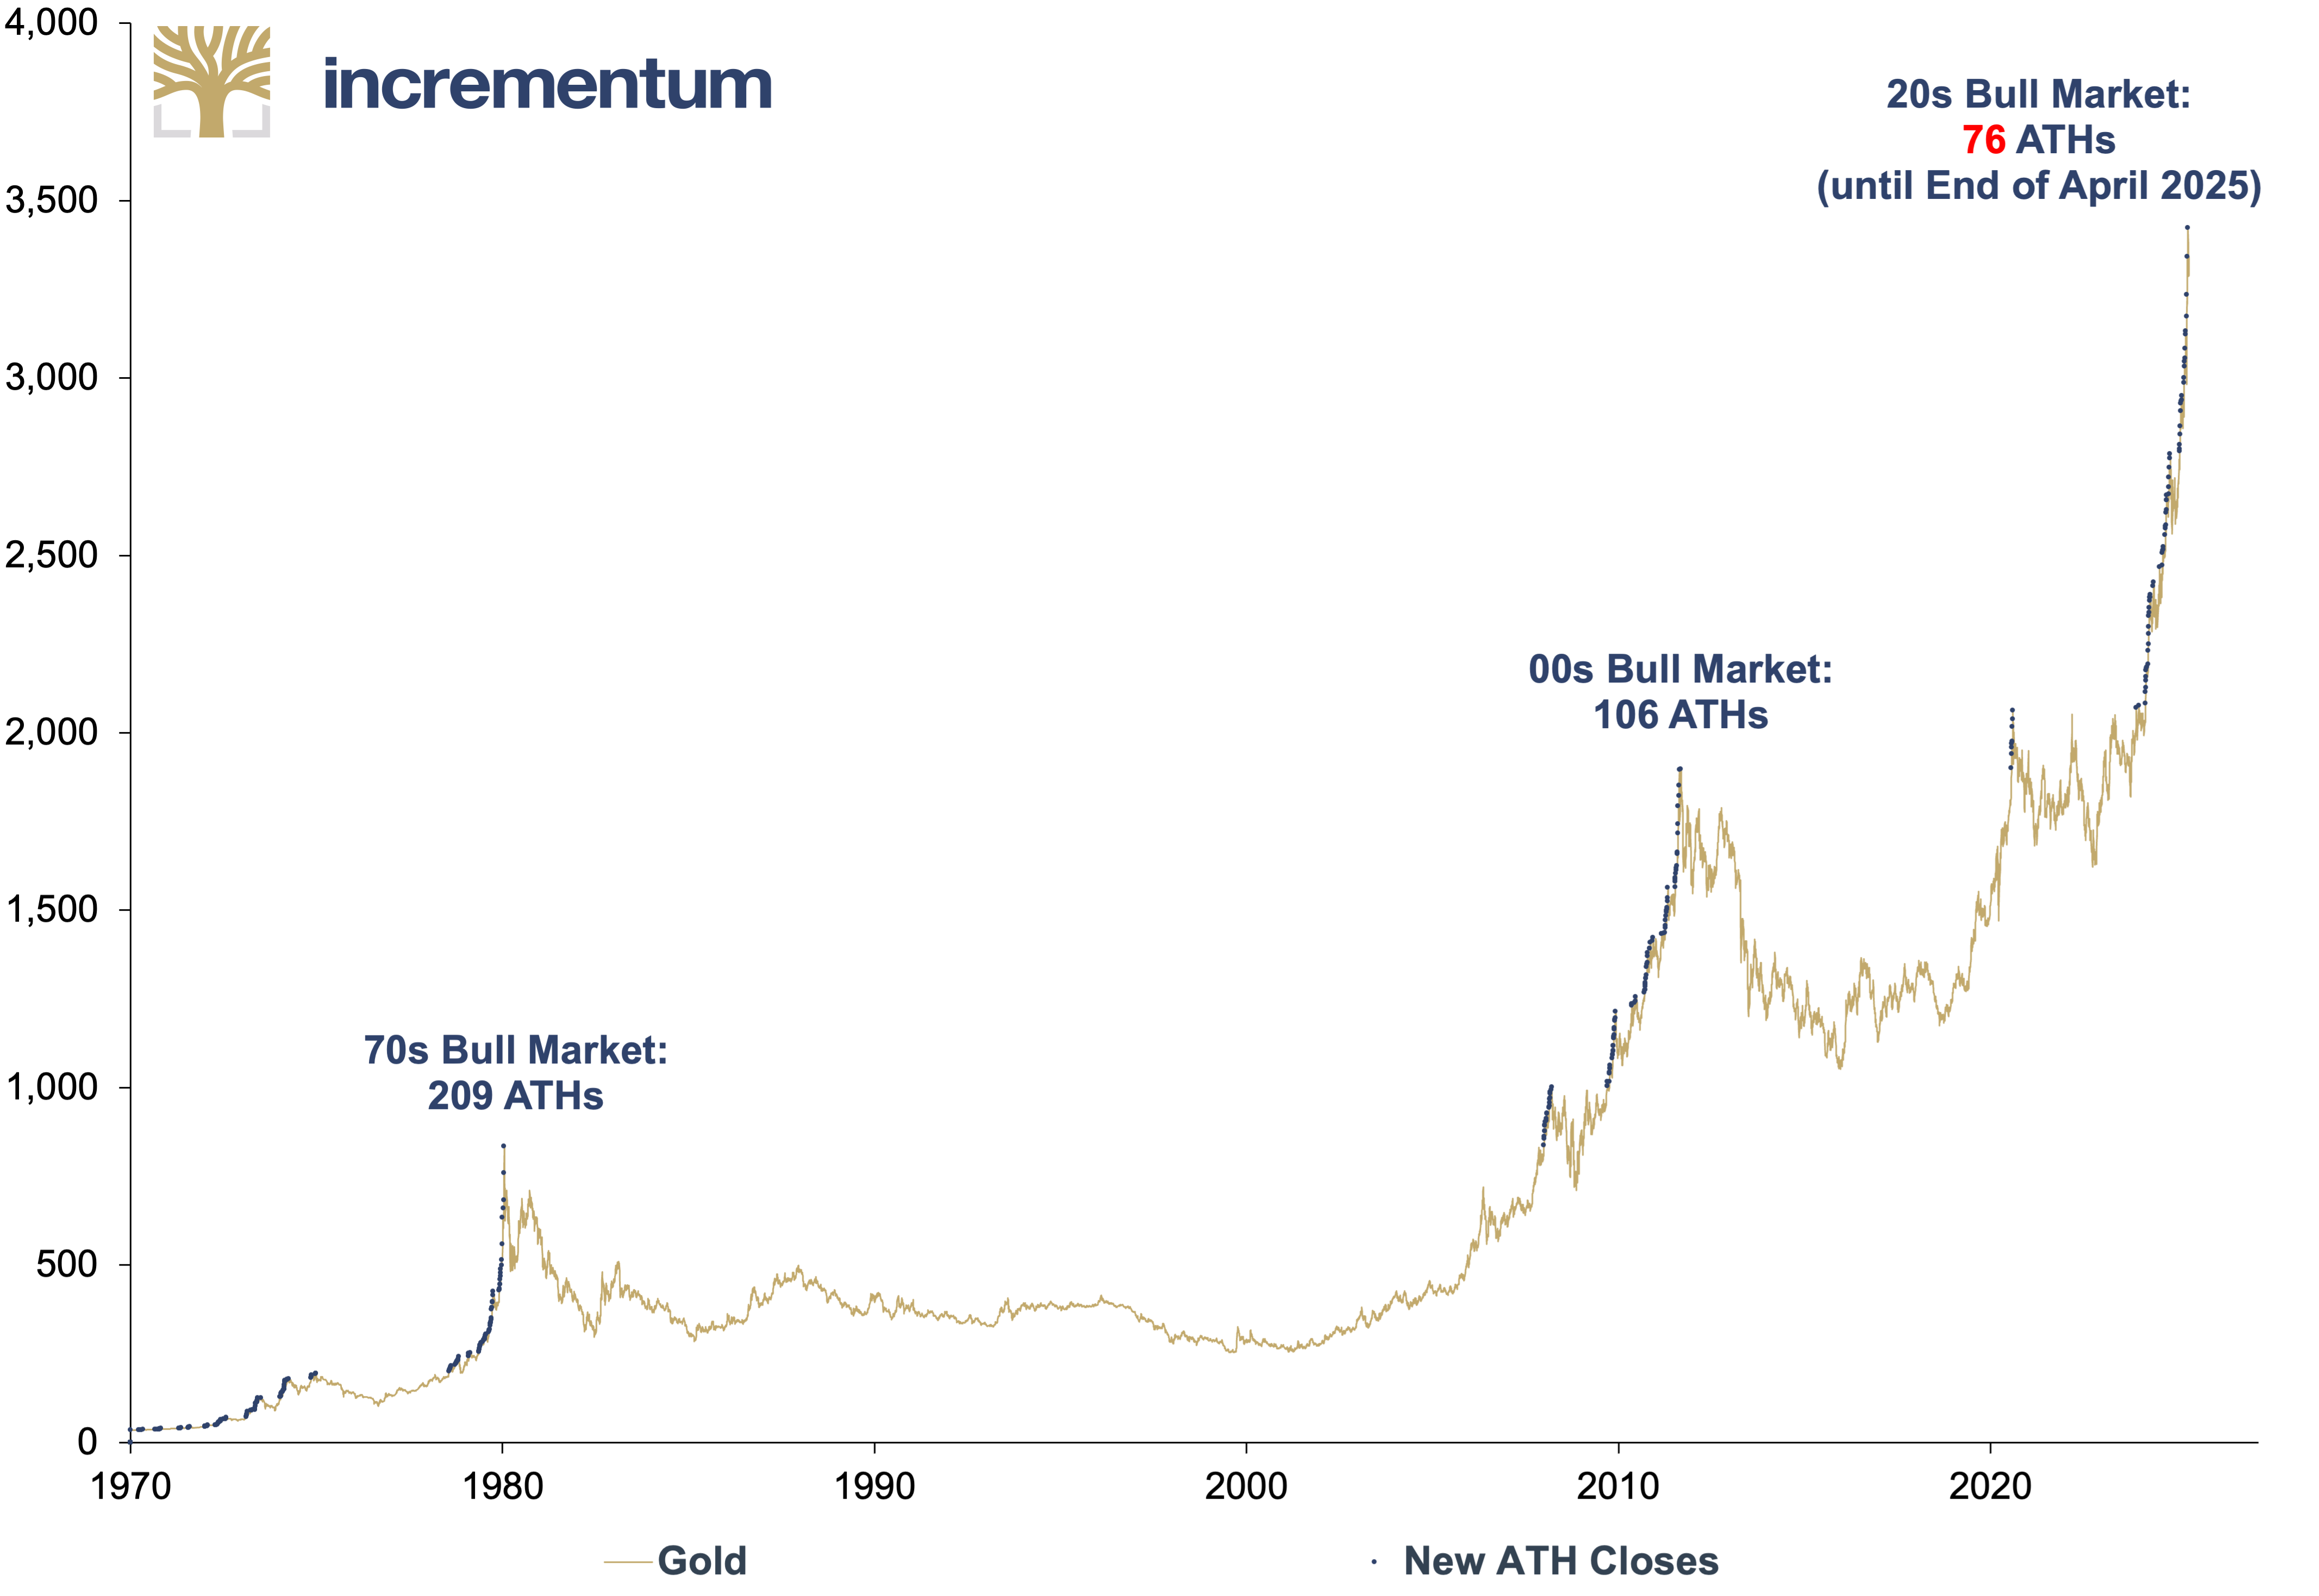
Source: 3Fourteen Research, World Gold Council, LSEG, Incrementum AG
The fact that the current gold bull market may still be far from over can be seen in the chart above, which shows all daily all-time highs for gold in US dollars on a closing price basis. As of April 30, gold has already marked 76 new all-time highs since the beginning of the current golden decade. By comparison, there were 209 new highs in the bull market of the 1970s and 106 in the 2000s. A look at these numbers suggests that the current cycle may still be far from having exhausted its potential.
The market environment and sentiment appear even more favorable today than at the beginning of the decade – a foundation that could pave the way for the second act of this golden chapter. Gold is about to become the strategic Big Long of the coming years. Here, we will try to answer whether this déjà vu will continue and, if so, what gold price can be expected by the end of this golden decade.
We will use our Incrementum Gold Price Model presented in the In Gold We Trust report 2020 “The Dawning of a Golden Decade” as a valuation benchmark and update our base scenario formulated at that time with a target price of USD 4,800 by the end of this decade.
In this analysis, however, we will first look at the past: What parallels and differences can be identified between the gold bull markets of the 1970s and 2000s and the current cycle? What was the economic and political environment like in each case? And how did the gold price develop under comparable conditions? In addition, we examine the dynamics of performance gold, i.e. silver and mining stocks as well as commodities in a decadal comparison to analyze whether they also have the potential to become the Big Longs of the second half of the decade.
Gold bull market: then as now?
Significant macroeconomic developments marked each of the golden decades. Inflation and interest rates, changes in the money supply, and overall economic trends played crucial roles in influencing the gold price. To provide a clear overview, we analyze the five most important macroeconomic factors affecting the gold price: inflation, M2 money supply growth, debt trends, real interest rates, and real GDP growth.
Our analysis focuses on the US, where the best data and statistical comparability are available. Nevertheless, the historical gold bull markets were not limited to the US but had a global impact. In the 1970s, numerous countries suffered from high inflation and currency turbulence. During these years, gold recorded significant price increases in almost all national currencies. The gold boom was also present worldwide during the 2000s, even if the appreciation of the euro, pound sterling, and other currencies was sometimes somewhat dampened by the dollar’s depreciation.
The current bull market fits seamlessly into this pattern: Gold has reached new all-time highs in all currencies. This is a strong indication that the underlying drivers – pandemic, inflation, overindebtedness, and geopolitical tensions – are global in nature and influence the gold price not only regionally but worldwide.
Inflation
The 1970s were characterized by the so-called Great Inflation, a long-lasting phase of high inflation rates. After the first oil price shock in 1973, inflation reached double digits. In the US, it remained above 10% for several years and peaked at 14.8% in March 1980, the highest level in the post-war period.
By contrast, inflation was moderate in the 2000s. Driven by globalization, technological efficiency gains, and disciplined monetary policy, the inflation rate in the US mostly hovered between 2% and 3%. It was not until the commodities boom in the mid-2000s that there was a moderate rise, with inflation reaching its highest level since the 1990s at 5–6% in the summer of 2008. Following the global financial crisis in 2007/08, however, the inflation rate briefly slipped into deflationary territory.
The 2020s saw a comeback of inflation: Initially dismissed as “transitory”, inflation soared to its highest level in 40 years in 2021/22 because of supply chain problems, pandemic-related catch-up effects, and massive stimulus. In the US, inflation reached 9.1% in June 2022, the highest level since 1981. Inflation rates in Europe were even in double digits at times in 2022/23.
Let’s look at the 2020s to date in a decade comparison. A remarkable pattern emerges: Cumulative inflation in the current decade has even exceeded that of the 1970s – the decade that is generally considered to be synonymous with inflation. Halfway through the decade, cumulative inflation is now between the level of the 1970s and that of the 2000s. What is striking is that in both comparison periods, the second half of the decade was more inflationary than the first, whether due to geopolitical shocks, commodity shortages or fiscal stimuli.
US CPI, 100 = Decade Start, 12/1969–03/2025
Source: LSEG, Incrementum AG
While inflation has recently fallen noticeably, core inflation rates remain at stubbornly high levels, raising the question of whether inflation could “seize up” as it did in the 1970s. If this is the case, it would represent a further strong tailwind for gold. Several developments currently suggest that this pattern could repeat itself:
- Geopolitical tensions continue to rise, from ongoing conflicts in Eastern Europe and the Middle East to the growing rivalry between the US and China.
- Reindustrialization and deglobalization are leading to rising production costs and structural supply shortages.
- Wage-price spiral gains momentum: In the US, but also in Europe, wage settlements are rising significantly, while companies are increasingly passing on higher costs.
- Energy prices remain volatile, not least due to a reluctance to invest in the fossil fuel sector and uncertainties in global energy architecture.
- Growth-oriented fiscal policy in many industrialized countries are launching new spending programs despite high debt levels, for example in the defense, energy and social sectors.
- Increasing political pressure is being put on central banks to cut interest rates before inflation is fully contained.
Money supply growth
The development of the money supply and debt is also behind inflation. In the 1970s, the money supply grew significantly, not least due to the financing of the Vietnam War and social programs as well as the move away from the gold standard. Nevertheless, the increases of around 10–12% per year were not as extraordinary as those we saw at the beginning of the 2020s. 2020/21 saw historic records: M2 in the US grew by 27% yoy at times, faster than ever in the inflation-driven 1970s or under QE1–3.
This unprecedented surge in liquidity was not only seen in the US but also in many other countries and laid the foundation for the subsequent wave of inflation. The year 2022 then saw a historic turning point: the US money supply shrank for the first time since the 1950s. Now, at the halfway point of the decade, the cumulative growth in the money supply since 2020 is roughly at the level of the 2000s – despite the massive increase at the beginning.
US M2, 100 = Decade Start, 12/1969–03/2025
Source: LSEG, Incrementum AG
The 2000s initially saw moderate increases in the money supply. It was only with the QE programs after 2008 that money supply growth accelerated somewhat.
Debt development
The 1970s began with comparatively low debt ratios – US government debt was around 35% of GDP. Although high inflation devalued the existing debt in real terms, interest costs rose significantly at the same time. As can be seen in the chart, the debt bomb began to explode in the middle of the decade, when the US government responded with an expansive fiscal policy to stagnating economic growth (stagflation), structurally high unemployment, and rising defense spending under President Carter. The massive interest rate hikes under Paul Volcker to curb inflation contributed to debt expansion through higher financing costs.
US Debt, 100 = Decade Start, 12/1969–03/2025
Source: LSEG, Incrementum AG
In the 2000s, on the other hand, debt rose relatively steadily until the global financial crisis of 2007/08, before exploding due to the rescue packages and economic stimulus programs.
In the 2020s, however, we experienced the debt explosion at the beginning of the decade, driven by unprecedented fiscal stimulus in the wake of the COVID-19 pandemic, combined with emergency programs, helicopter money, and massive government spending.
This means that the debt trend in the current decade is already well above the level of the 1970s and 2000s at the respective halfway points. It is also striking that in both previous decades, debt in the second half increased at around twice the rate of the first – is this a pattern that could continue in the current decade?
Real interest rates
In all periods under review, real yields were only just positive or even negative over long periods. In the 1970s, double-digit inflation in the second half of the decade literally ate up the real return on fixed-interest investments. In the 2000s, too, real value growth for savers was extremely meagre – even if moderate inflation rates and a comparatively moderate monetary policy ensured stable conditions for a while, until the 2007/08 global financial crisis.
At the beginning of the current decade, real interest rates were deeply negative – at times between -5% and -7% – because of the wave of inflation coupled with persistently low interest rates. It is not without reason that such an environment is considered “rocket fuel” for gold.
This is also shown in the following chart based on the development of the US real interest rate index, normalized to 100 at the beginning of each decade. In the first half of the 2020s, the real interest rate index fell by around 8%, while real interest rates in the first half of the 1970s and 2000s yielded slightly positive returns. Thus, to date, the current decade marks the most negative real interest rate phase in our historical comparison.
US Real Rate Index, 100 = Decade Start, 12/1969–03/2025
Source: LSEG, Incrementum AG
In the late 1970s, central banks – above all the Fed under Paul Volcker – finally succeeded in raising interest rates well above the rate of inflation. However, this came at the price of a deep recession. In the 2020s, monetary policy leeway is much more limited: The sharp rise in debt and the vulnerability of financial markets make sharp interest rate hikes riskier.
Real GDP growth
The 1970s are regarded as an economically lost decade: Several recessions, high inflation, and structurally weak growth led to the infamous stagflation. Triggers included the oil price shocks in 1973 and 1979, an inefficient supply side, and political uncertainty. Although real GDP grew by 14% in the first half of the decade, it was highly volatile. The second half brought more dynamic development with real growth of 21% – but under considerable inflation and interest rate pressure.
The 2000s began with stable global growth, boosted by technologization, a moderate interest rate policy, and the economic rise of China. The commodities sector flourished, and gold benefited. In the first half of the decade, real US GDP grew by 13%, before the global financial crisis of 2007/08 caused cumulative growth to slump to 5% in the second half.
The 2020s have so far presented a hybrid picture: The pandemic-related slump was followed by a strong recovery thanks to fiscal and monetary stimulus – with overheating effects, supply bottlenecks, and inflationary pressure. There are now increasing signs of a renewed slowdown. Cumulative real GDP growth in the first half of 2025 was 12%, slightly below the level of the two periods we are comparing.
US Real GDP, 100 = Decade Start, Q4/1969–Q1/2025
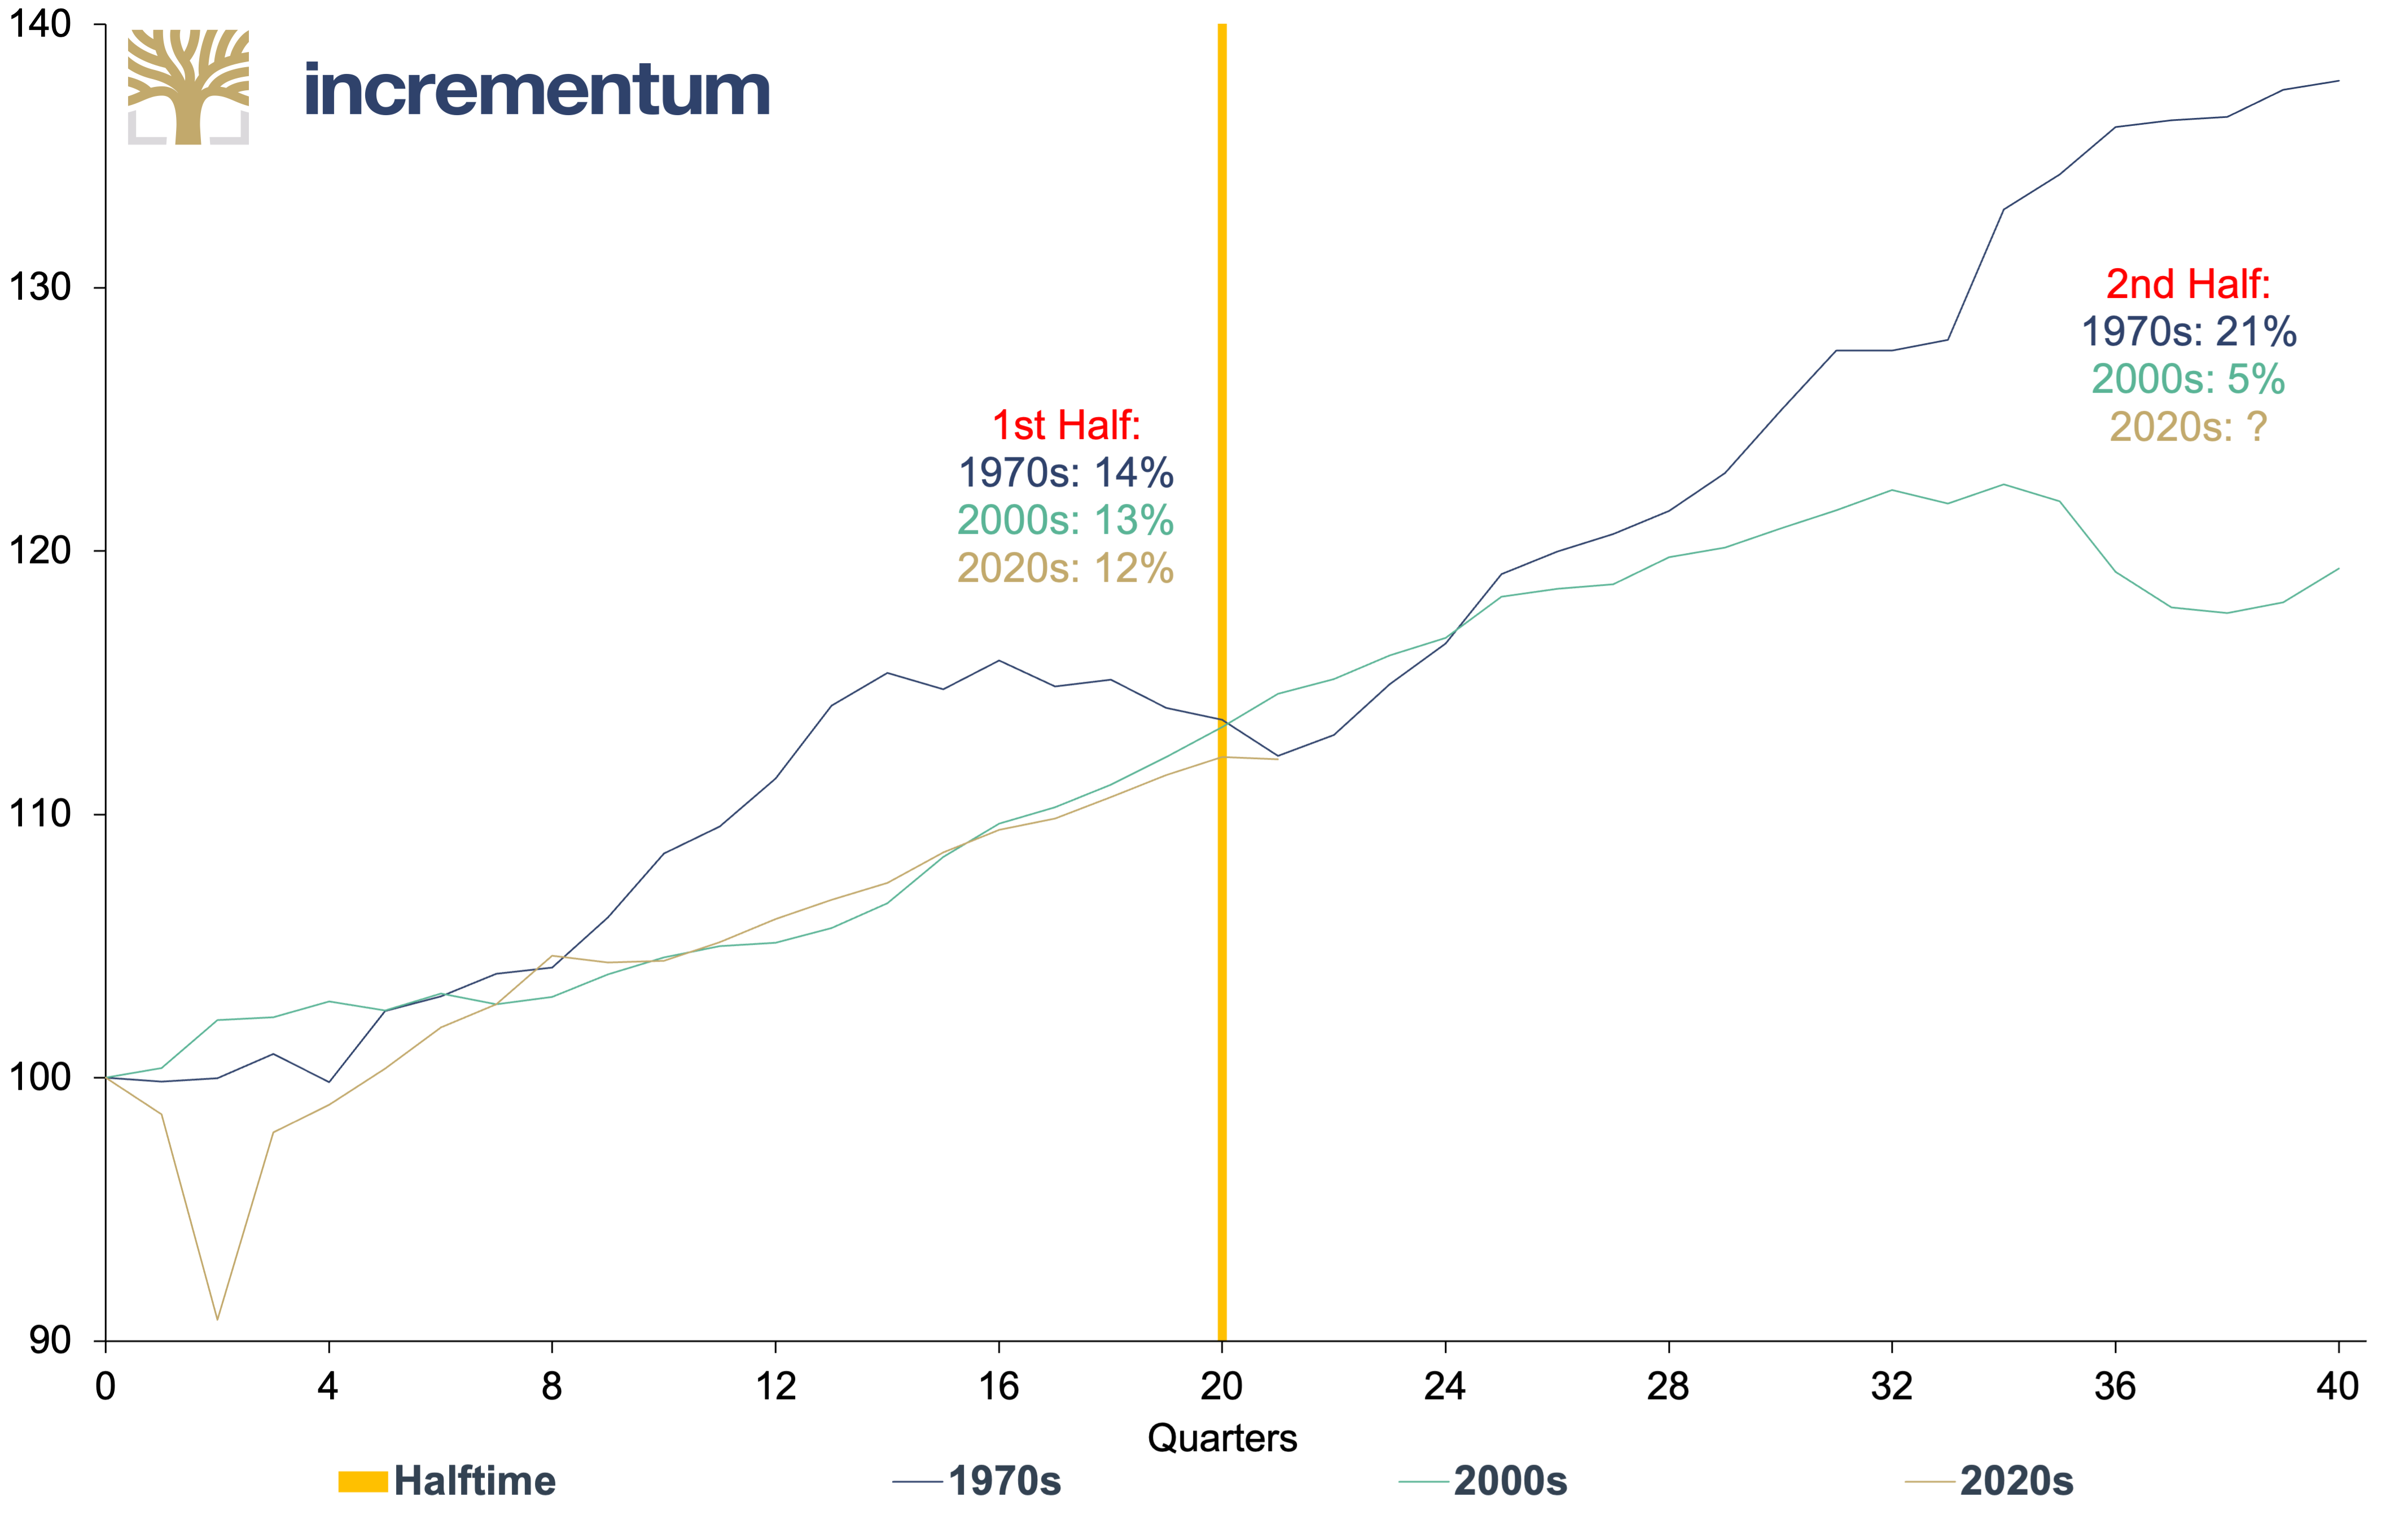
Source: LSEG, Incrementum AG
While the second half of the 1970s and 2000s were characterized by strong economic contrasts – the 1970s with an upswing under inflationary stress, the 2000s with an abrupt crash – it remains to be seen whether the second half of the 2020s will prove stronger or more fragile. The starting position is historically unique: high debt, geopolitical uncertainty, demographic headwinds, and limited monetary policy maneuverability form a tension likely to shape the rest of the decade.
With time: further imprints of three decades
In addition to the classic macroeconomic drivers such as inflation, monetary expansion, debt trends, real interest rates, and economic growth, other structural and psychological factors play a key role in the dynamics of the current gold decade:
- Shocks and crises as catalysts
Every historical gold bull market was accompanied by exogenous shocks that caused gold to appreciate as a crisis currency. In the 1970s, it was the oil price crises, the Vietnam War, and the tensions of the Cold War. The 2000s were marked by the terrorist attacks on September 11 and the global financial crisis. Finally, the 2020s were dominated by the Covid-19 pandemic, the war in Ukraine, and increasing geopolitical fragmentation. A recurring pattern emerged in all of these phases: gold benefited from investors’ uncertainty – the greater the mistrust, the greater the demand for stable stores of value.
- Loss of confidence in the monetary and financial system
A shake-up of confidence in the existing monetary system also accompanied each decade. The 1970s saw the decision to abandon the US dollar-gold peg (1971), combined with political crises of confidence. The 2000s saw bank collapses, the Lehman bankruptcy, and massive rescue packages by central banks – the term helicopter money became socially acceptable. In the 2020s, monetary expansion reached a new level of quality and quantity: massive money printing in peacetime, exploding deficits, and increasing polarization and dysfunctionality of political institutions. In all cases, the need grows for a stable, system-independent reserve: gold.
- Market readiness and investor access
The structure and accessibility of the gold market itself have also changed significantly over the decades, with consequences for market reactions. In the 1970s, after decades of prohibition, the gold market was still young, illiquid and volatile. In the 2000s, gold became increasingly institutionalized, including by introducing ETFs such as the SPDR Gold Shares (from 2004), which resulted in significantly more capital flowing into the market. In the 2020s, gold can be traded around the clock worldwide, via derivatives, online platforms and digital forms of investment. At the same time, it is now competing with Bitcoin, as digital gold, for the role of alternative store of value. This can lead to faster reactions but possibly also to less-explosive price movements than those that were possible in the 1970s.
- Central bank demand
Whereas in previous decades gold often had to rise against the resistance or at least the indifference of central banks, today it is supported by a second buyer front that is politically motivated, strategically oriented, and systemically important. This makes central bank demand one of the key structural differences in the current gold decade. This trend is giving the gold market a new foundation: instead of counter-cyclical selling, we are now seeing strategic accumulation.
- Commodities environment and supercycles
In the past, gold often did not develop in isolation but rather in the context of a broad commodity boom. In the 1970s, not only precious metals but also oil, industrial metals, and agricultural commodities rose significantly, creating a veritable inflation and commodities supercycle. The 2000s were similar, led by the Chinese growth miracle, which caused global demand for commodities to explode. In the 2020s, on the other hand, the picture is mixed. Although there were record prices for energy and metals in 2021/22, demand shocks, geopolitical interventions, and the energy transition have had a dampening effect. However, should a new, structural commodity bull market establish itself – for example due to a supply shortage, investment restraint, or geopolitical stockpiling – this could catapult gold back into an inflation-driven collective rise with other commodities. However, if this fails to materialize, gold may be relatively alone among the hard assets.
The Big Long: Safe-Haven Gold, Performance Gold, or Commodities After All?
After the superb rally of the past twelve months, investors and market participants are increasingly asking the question: “Is it still worth investing in gold, or is it already too late?”
To answer this question, we will compare the current decade’s gold price performance to the major gold bull markets of the 1970s and 2000s. The aim is to classify the performance to date in historical terms and to gain an assessment of the potential that gold could still develop in the second half of the current decade, considering the macroeconomic factors discussed above. Considering these developments, we will broaden our perspective and analyze whether silver, gold mining stocks, and commodities also have the potential to emerge as the Big Long of the second half of the decade.
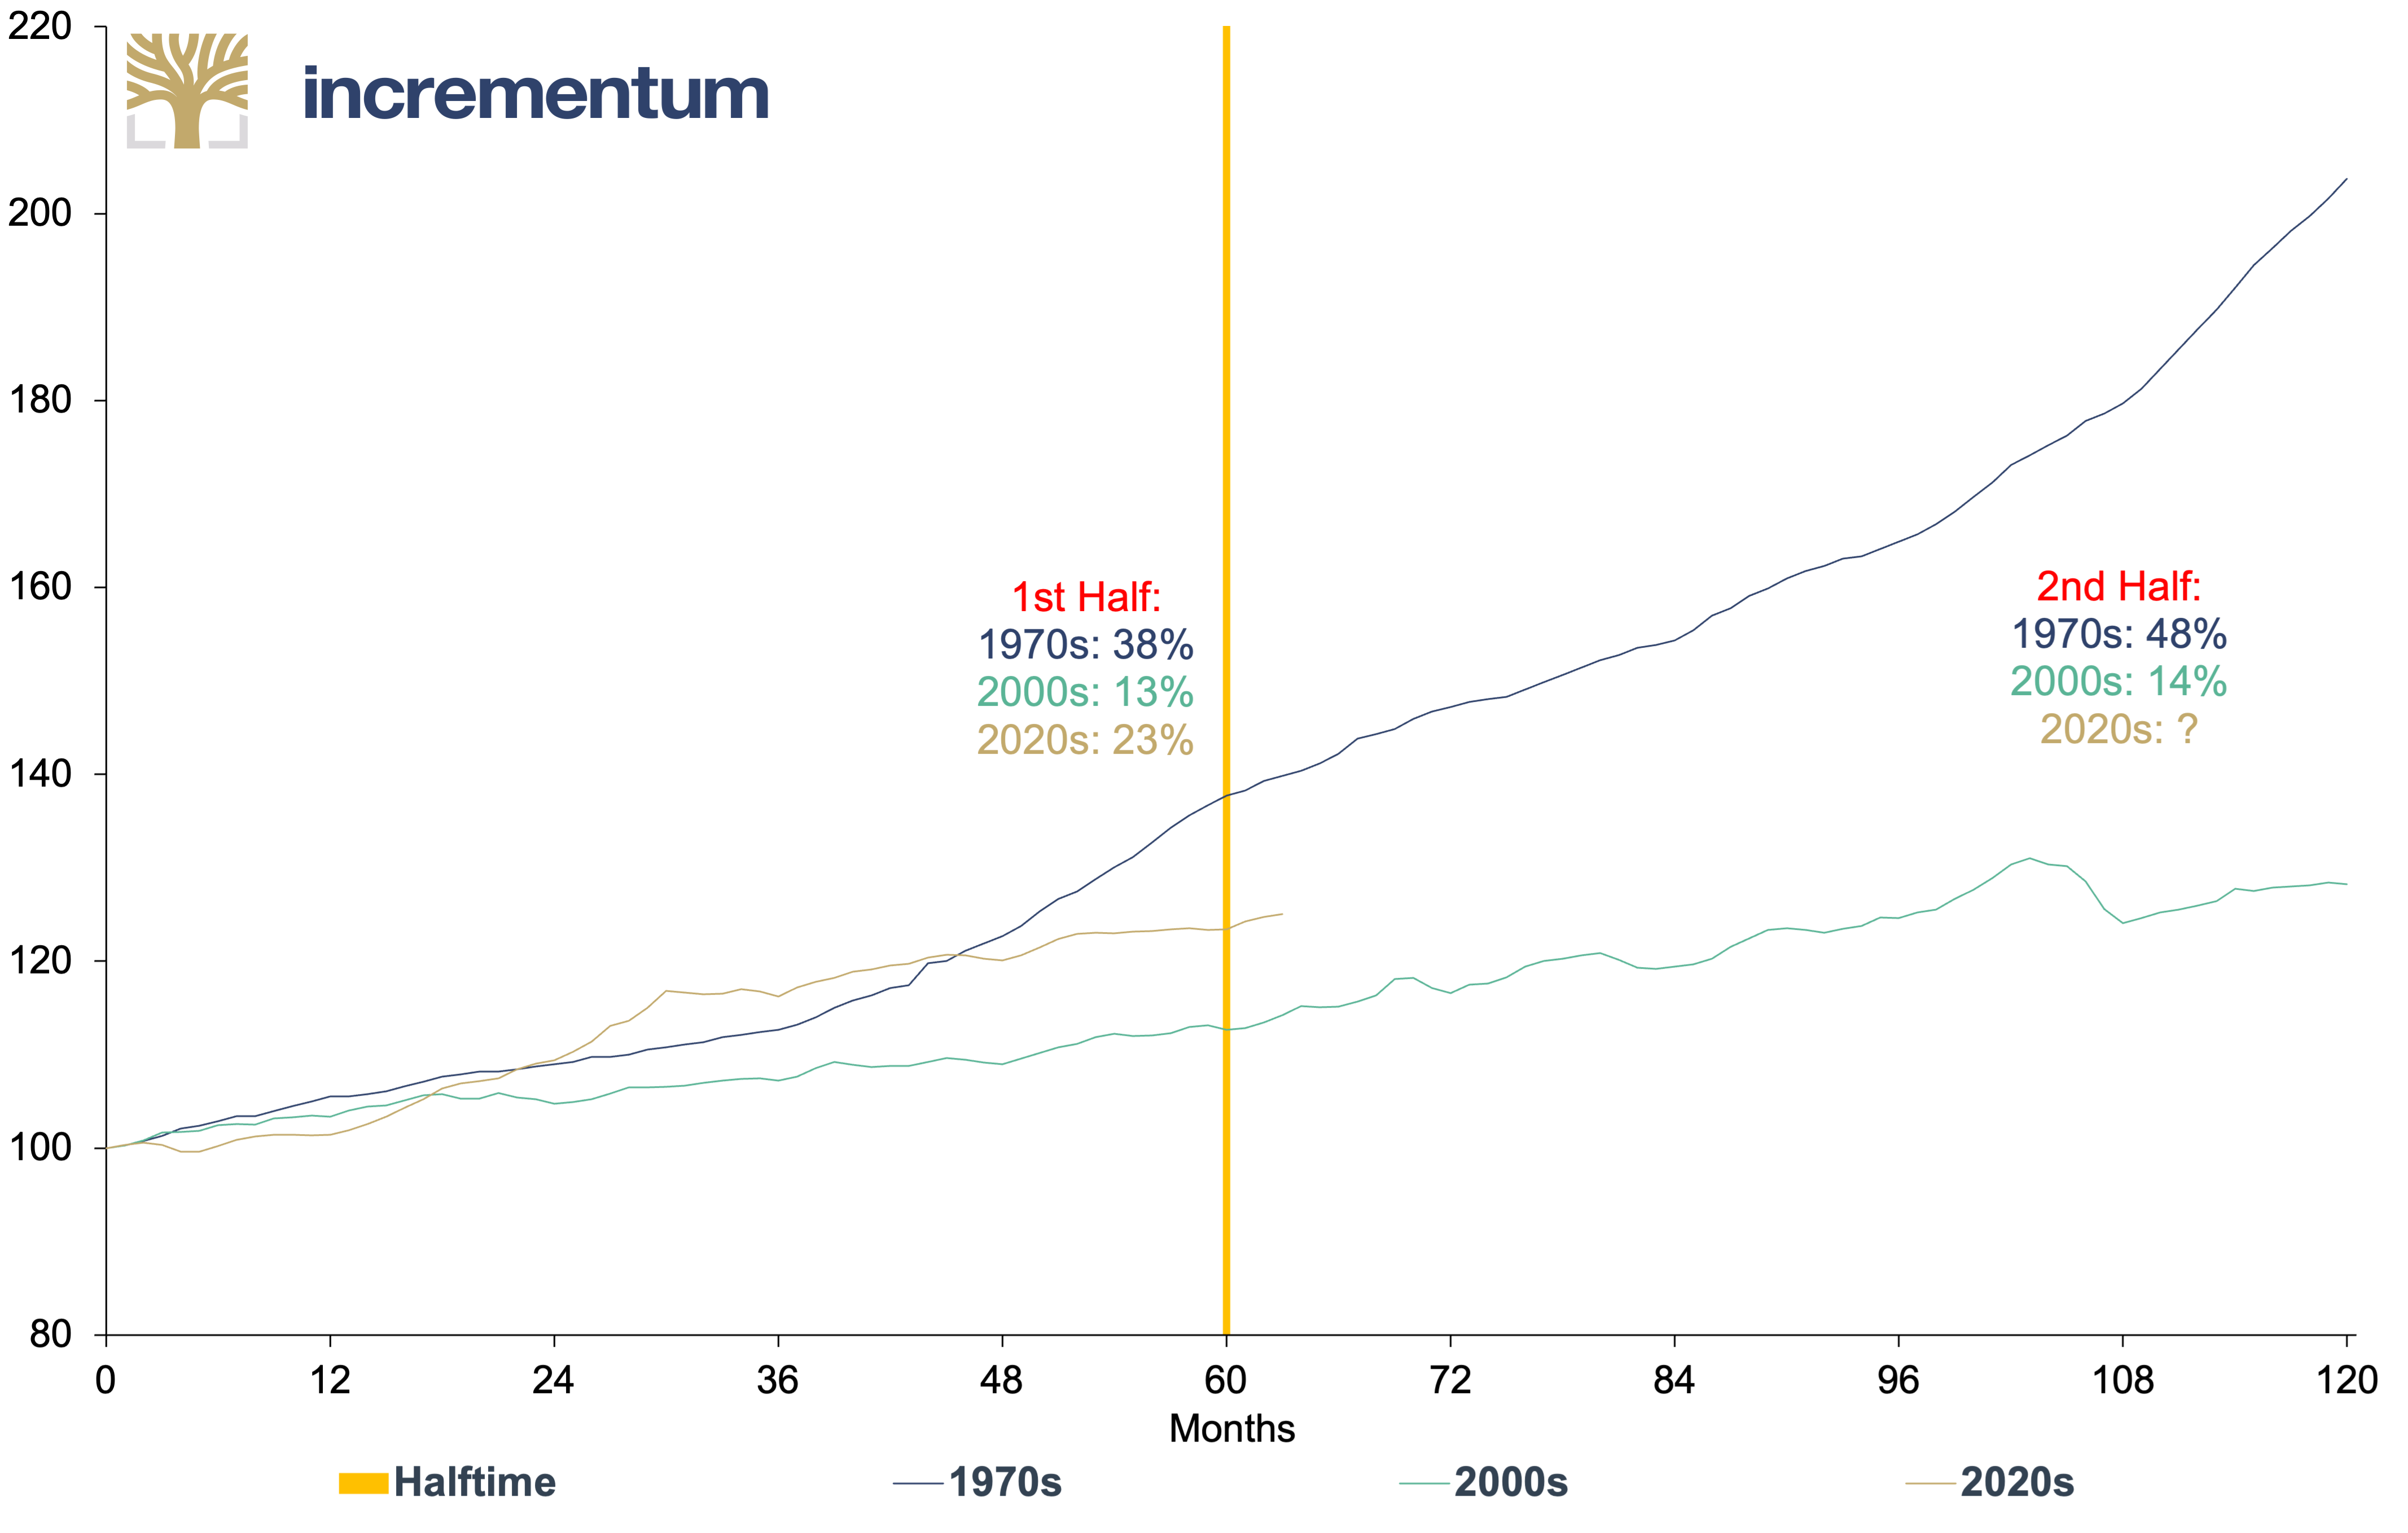
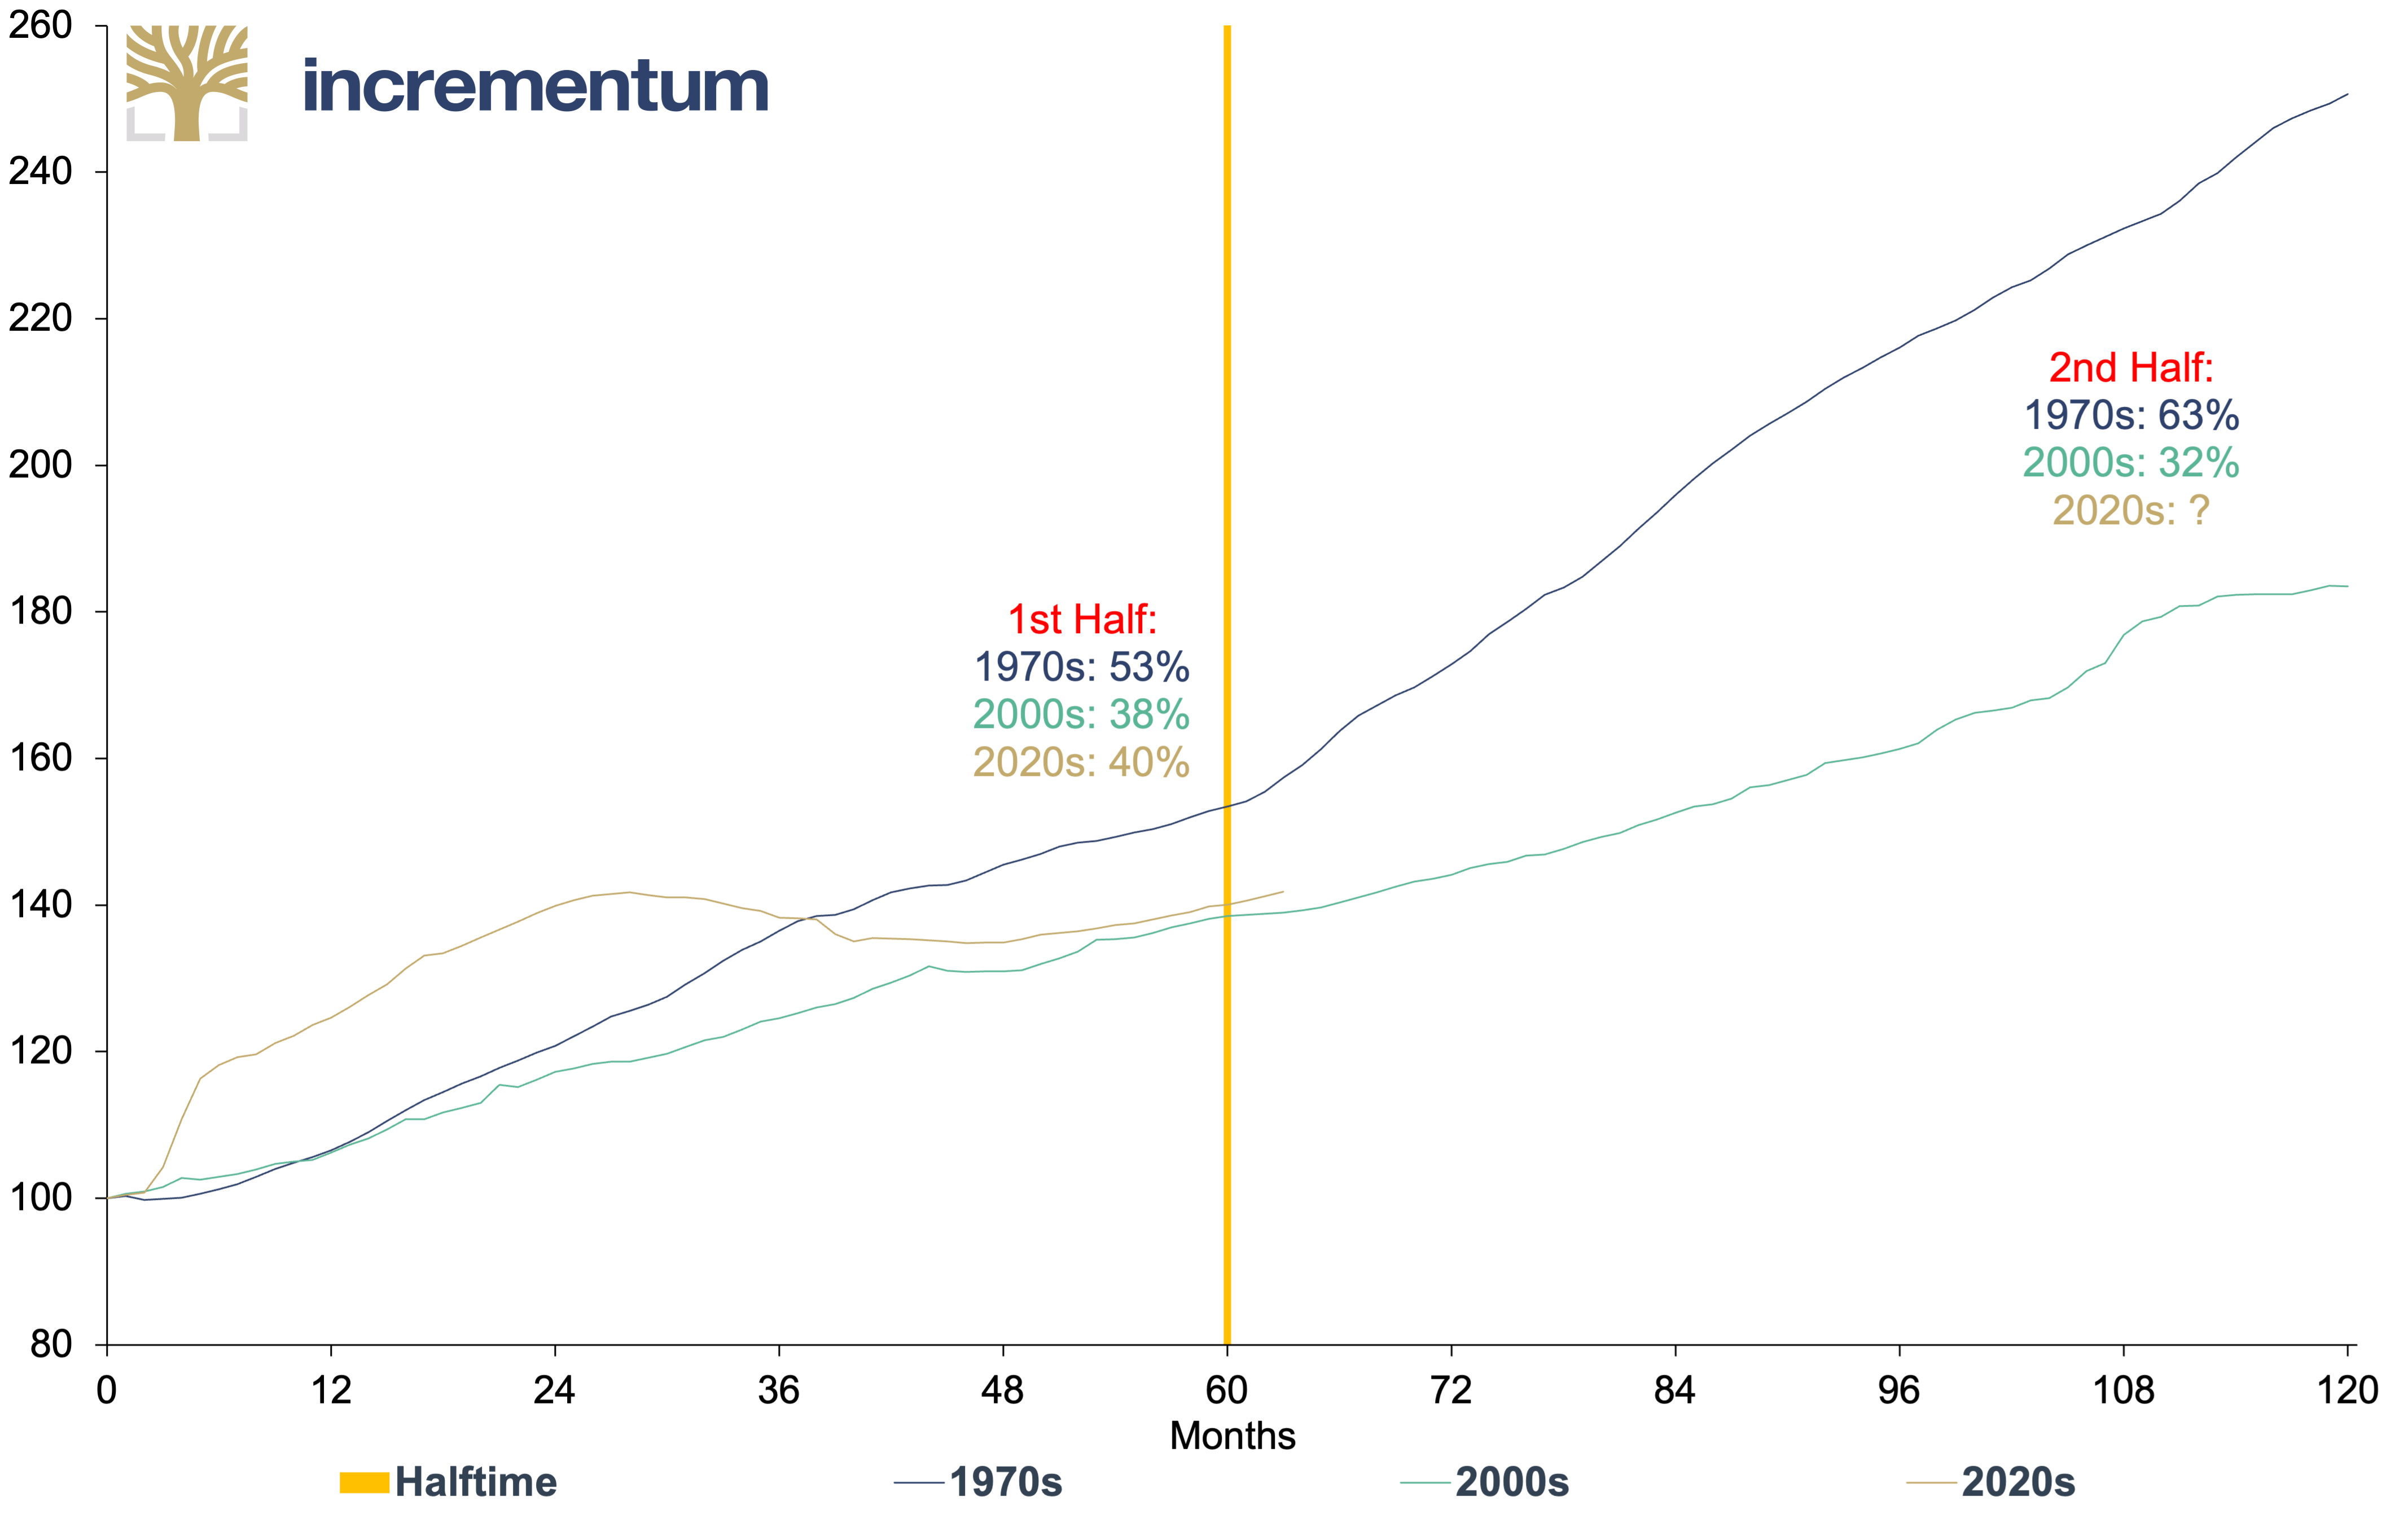
Gold
The dynamics of the first half of the current gold decade are strikingly like those of the 2000s. Nevertheless, the performance of the past five years, at +73%, was significantly higher than the +52% performance at that time. In comparison, the decade’s first half in the 1970s was robust, with an increase of 452%. In addition to a drastic expansion of the money supply and high inflation, this was mainly due to the liberalization of the gold market.
Gold (log), in USD, 100 = Decade Start, 12/1969–04/2025
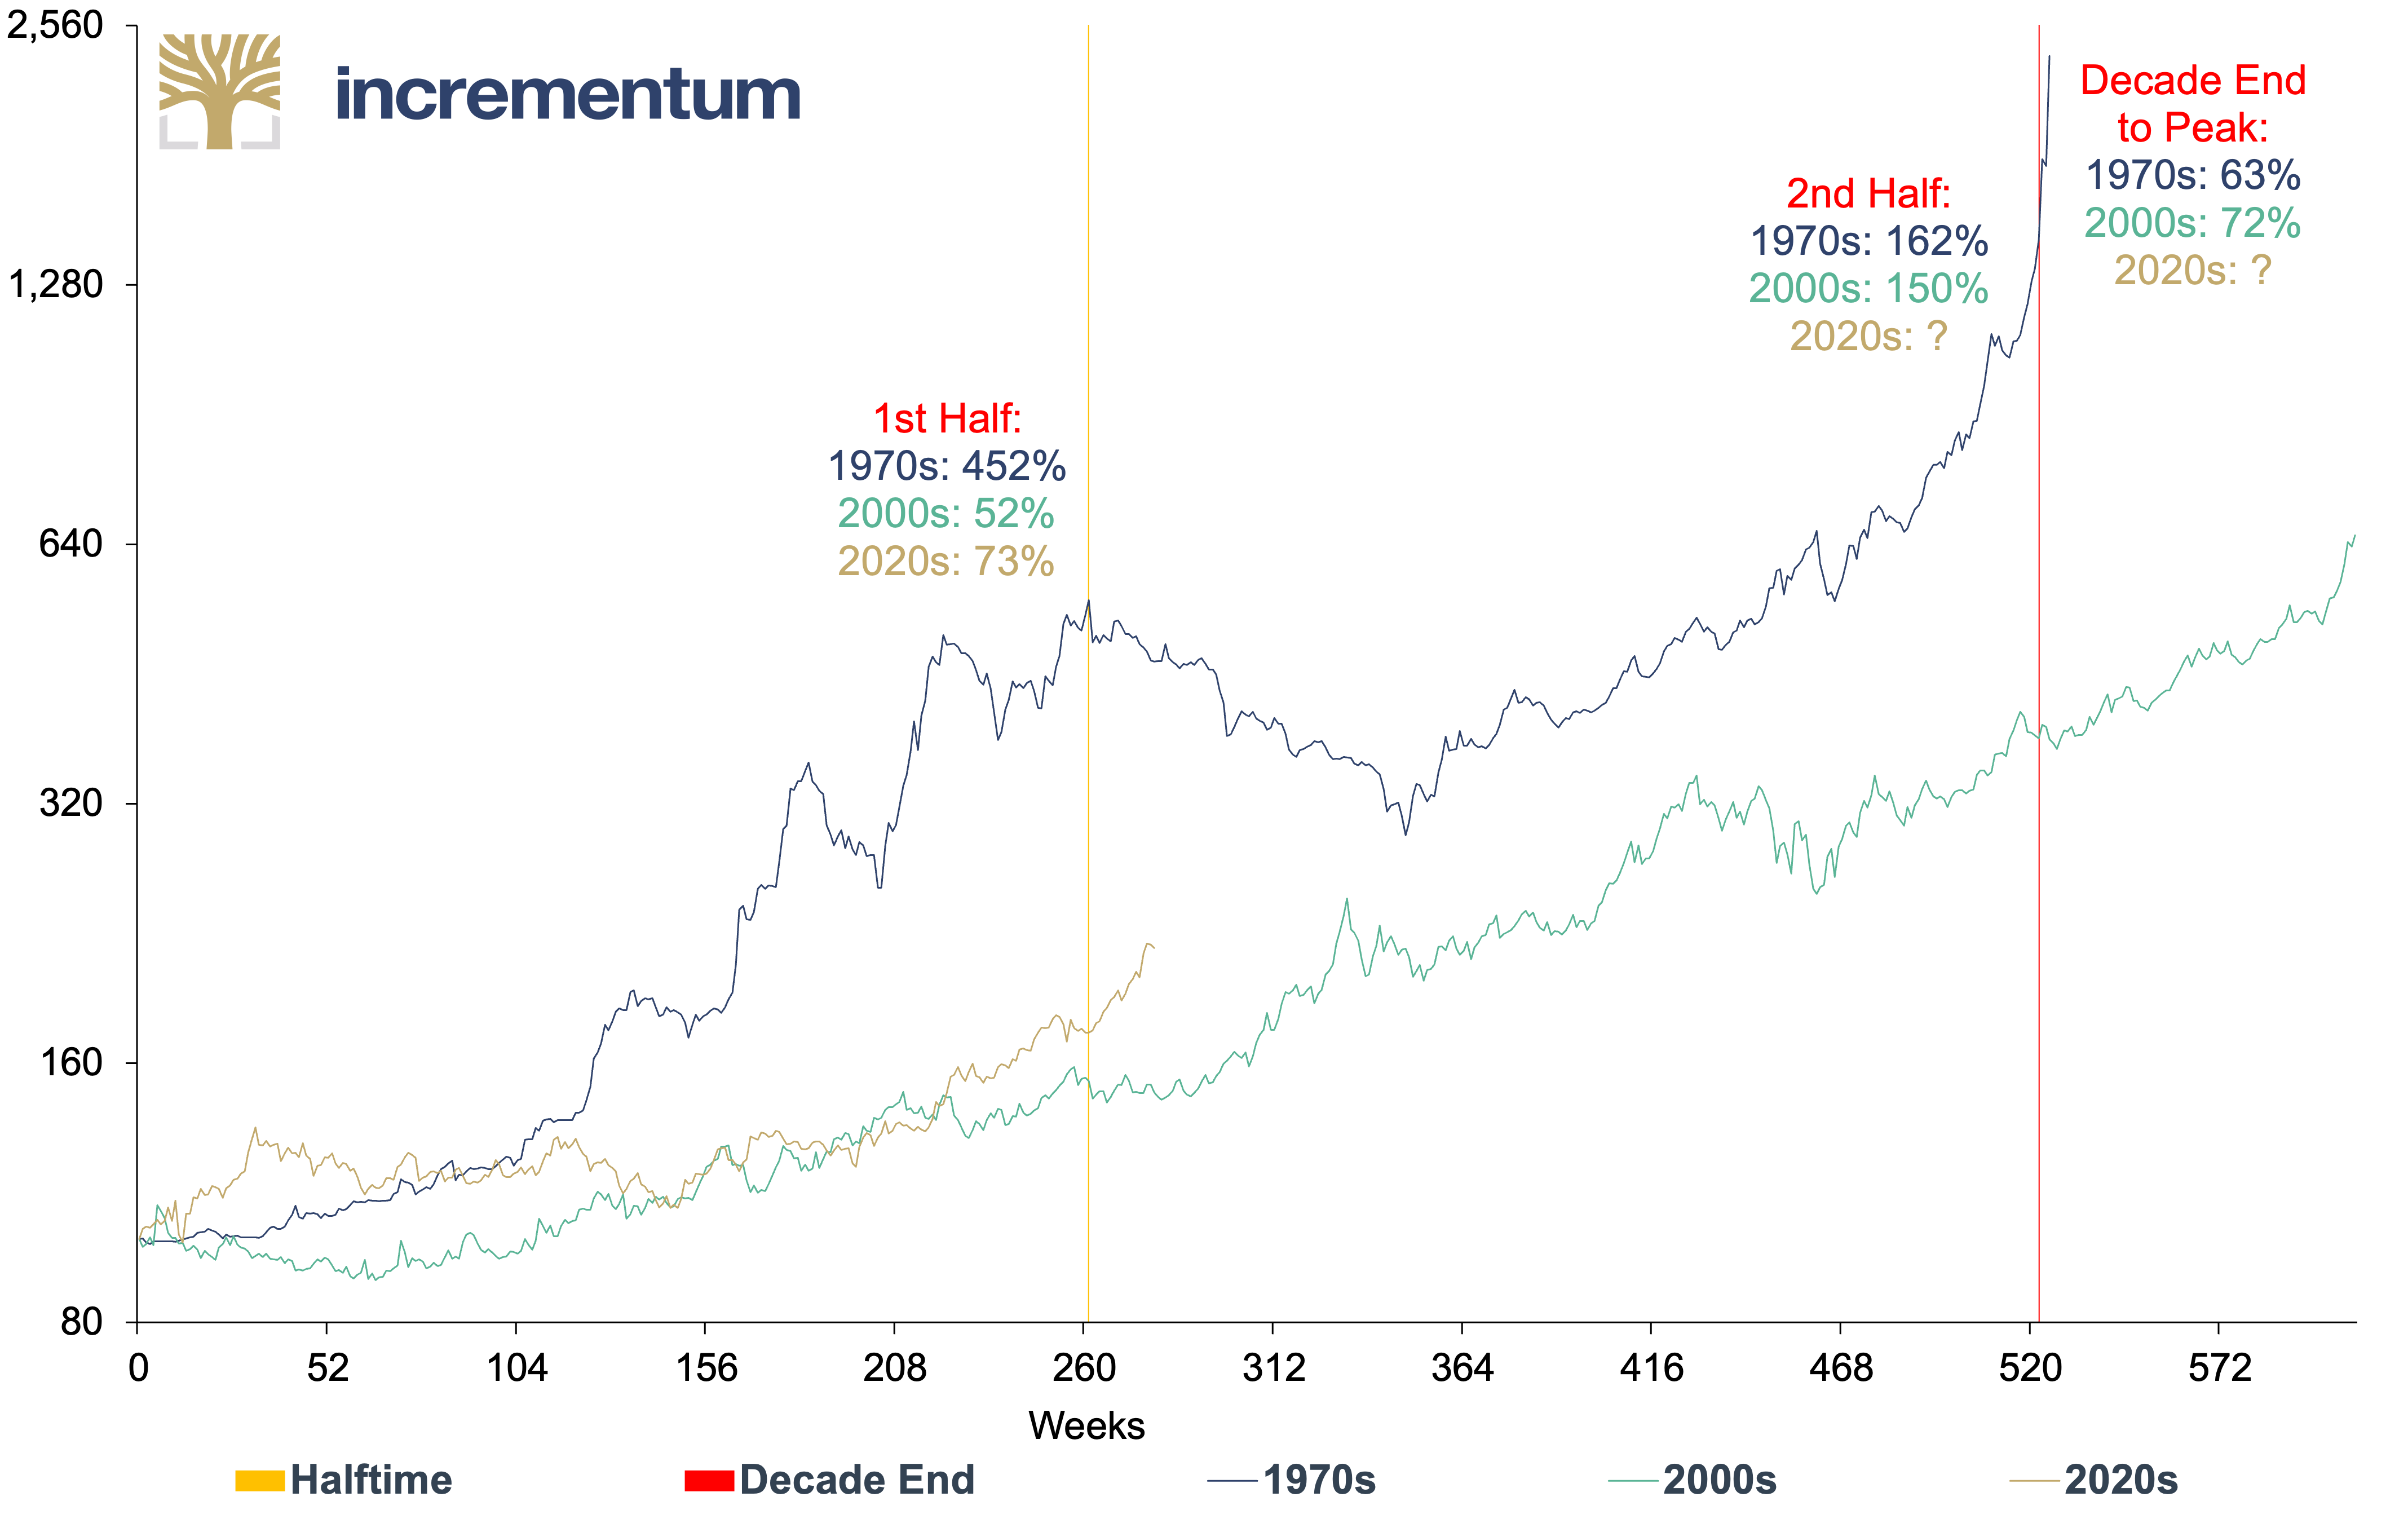
Source: LSEG, Incrementum AG
The second half of the past two gold bull markets showed remarkably similar price dynamics: In the 1970s, the gold price rose by 162%, while in the 2000s it increased by 150%. If the current cycle continues in a similar fashion, the gold price would increase from USD 2,624 at the midpoint of the decade at the end of December 2024 to around USD 6,800 by the end of the decade.
The two previous gold bull markets lasted roughly a decade and ended in a parabolic rise shortly after the end of the decade. Intermediate phases with strong corrections occurred in 1975–76, 2008, and 2021 without breaking the overarching upward trend. In the case of the 1970s bull market, the high was reached just three weeks after the end of the decade. However, these three weeks were quite something, as the gold price rose by 63%. In the bull market of the 2000s, the increase at the end of the decade was even more positive at +72%. However, the 2000s bull market lasted until September 2011. If the gold price shows similar momentum after the end of the 2020s decade, it would rise to over USD 11,000.
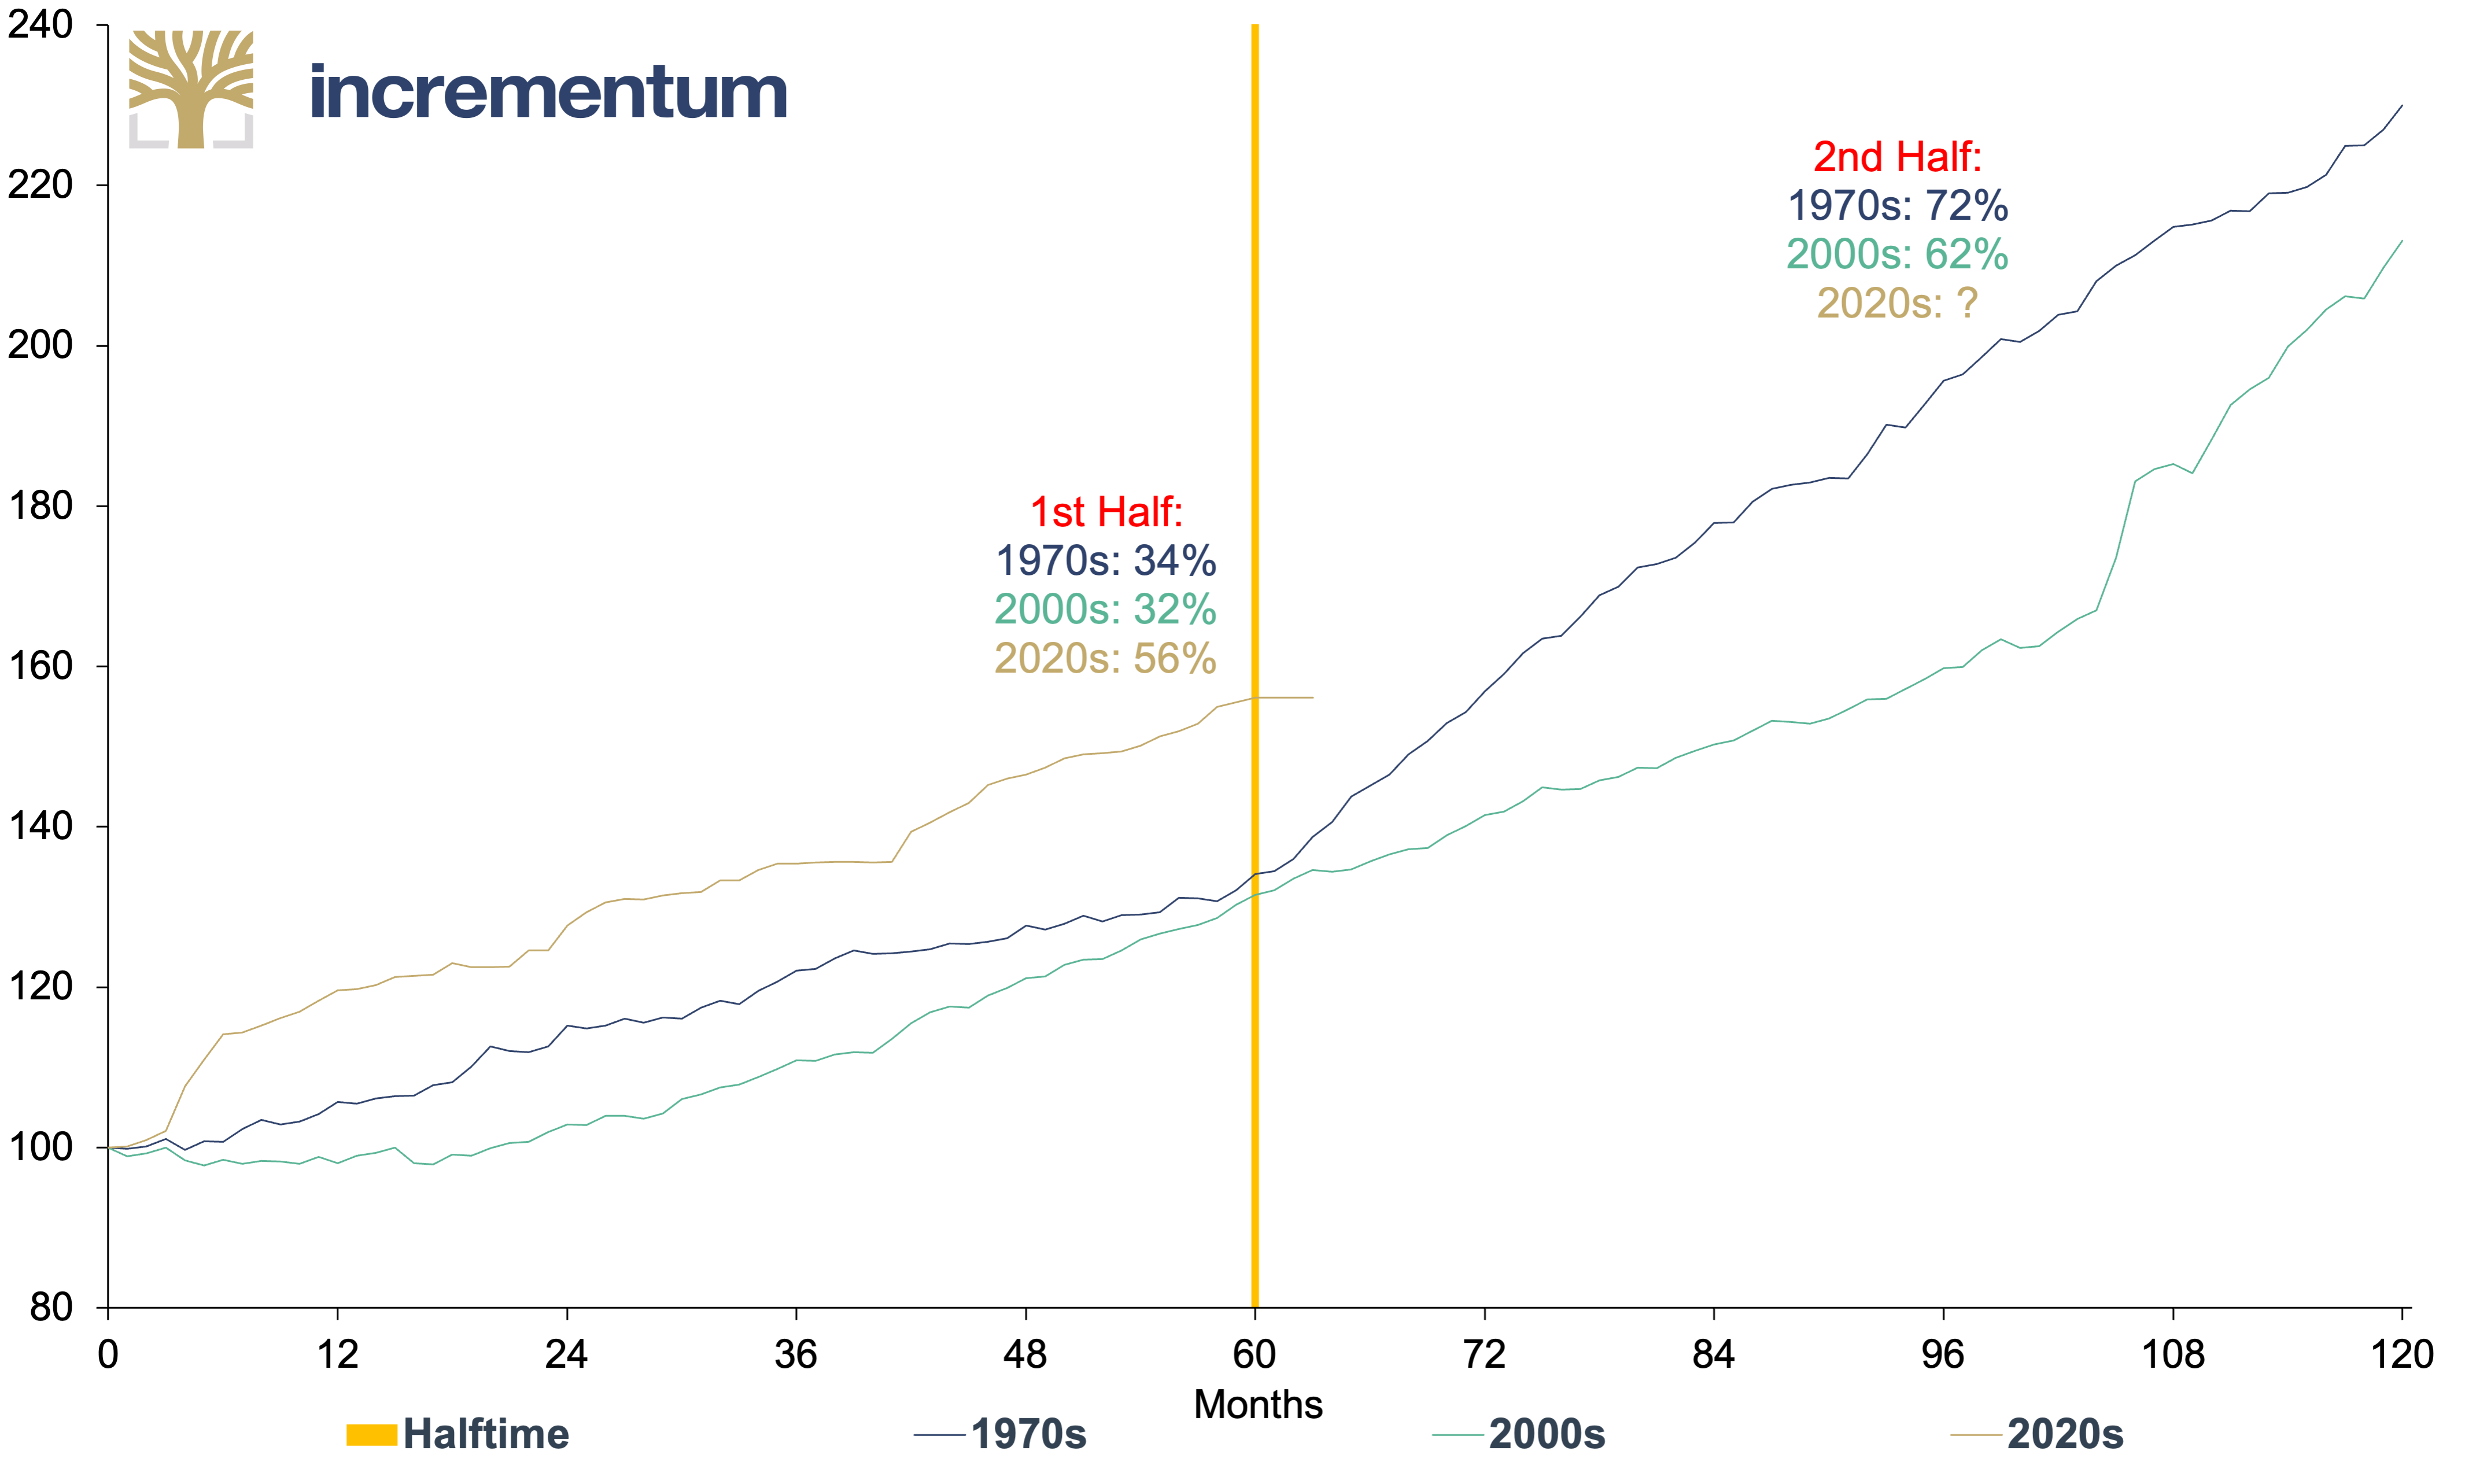
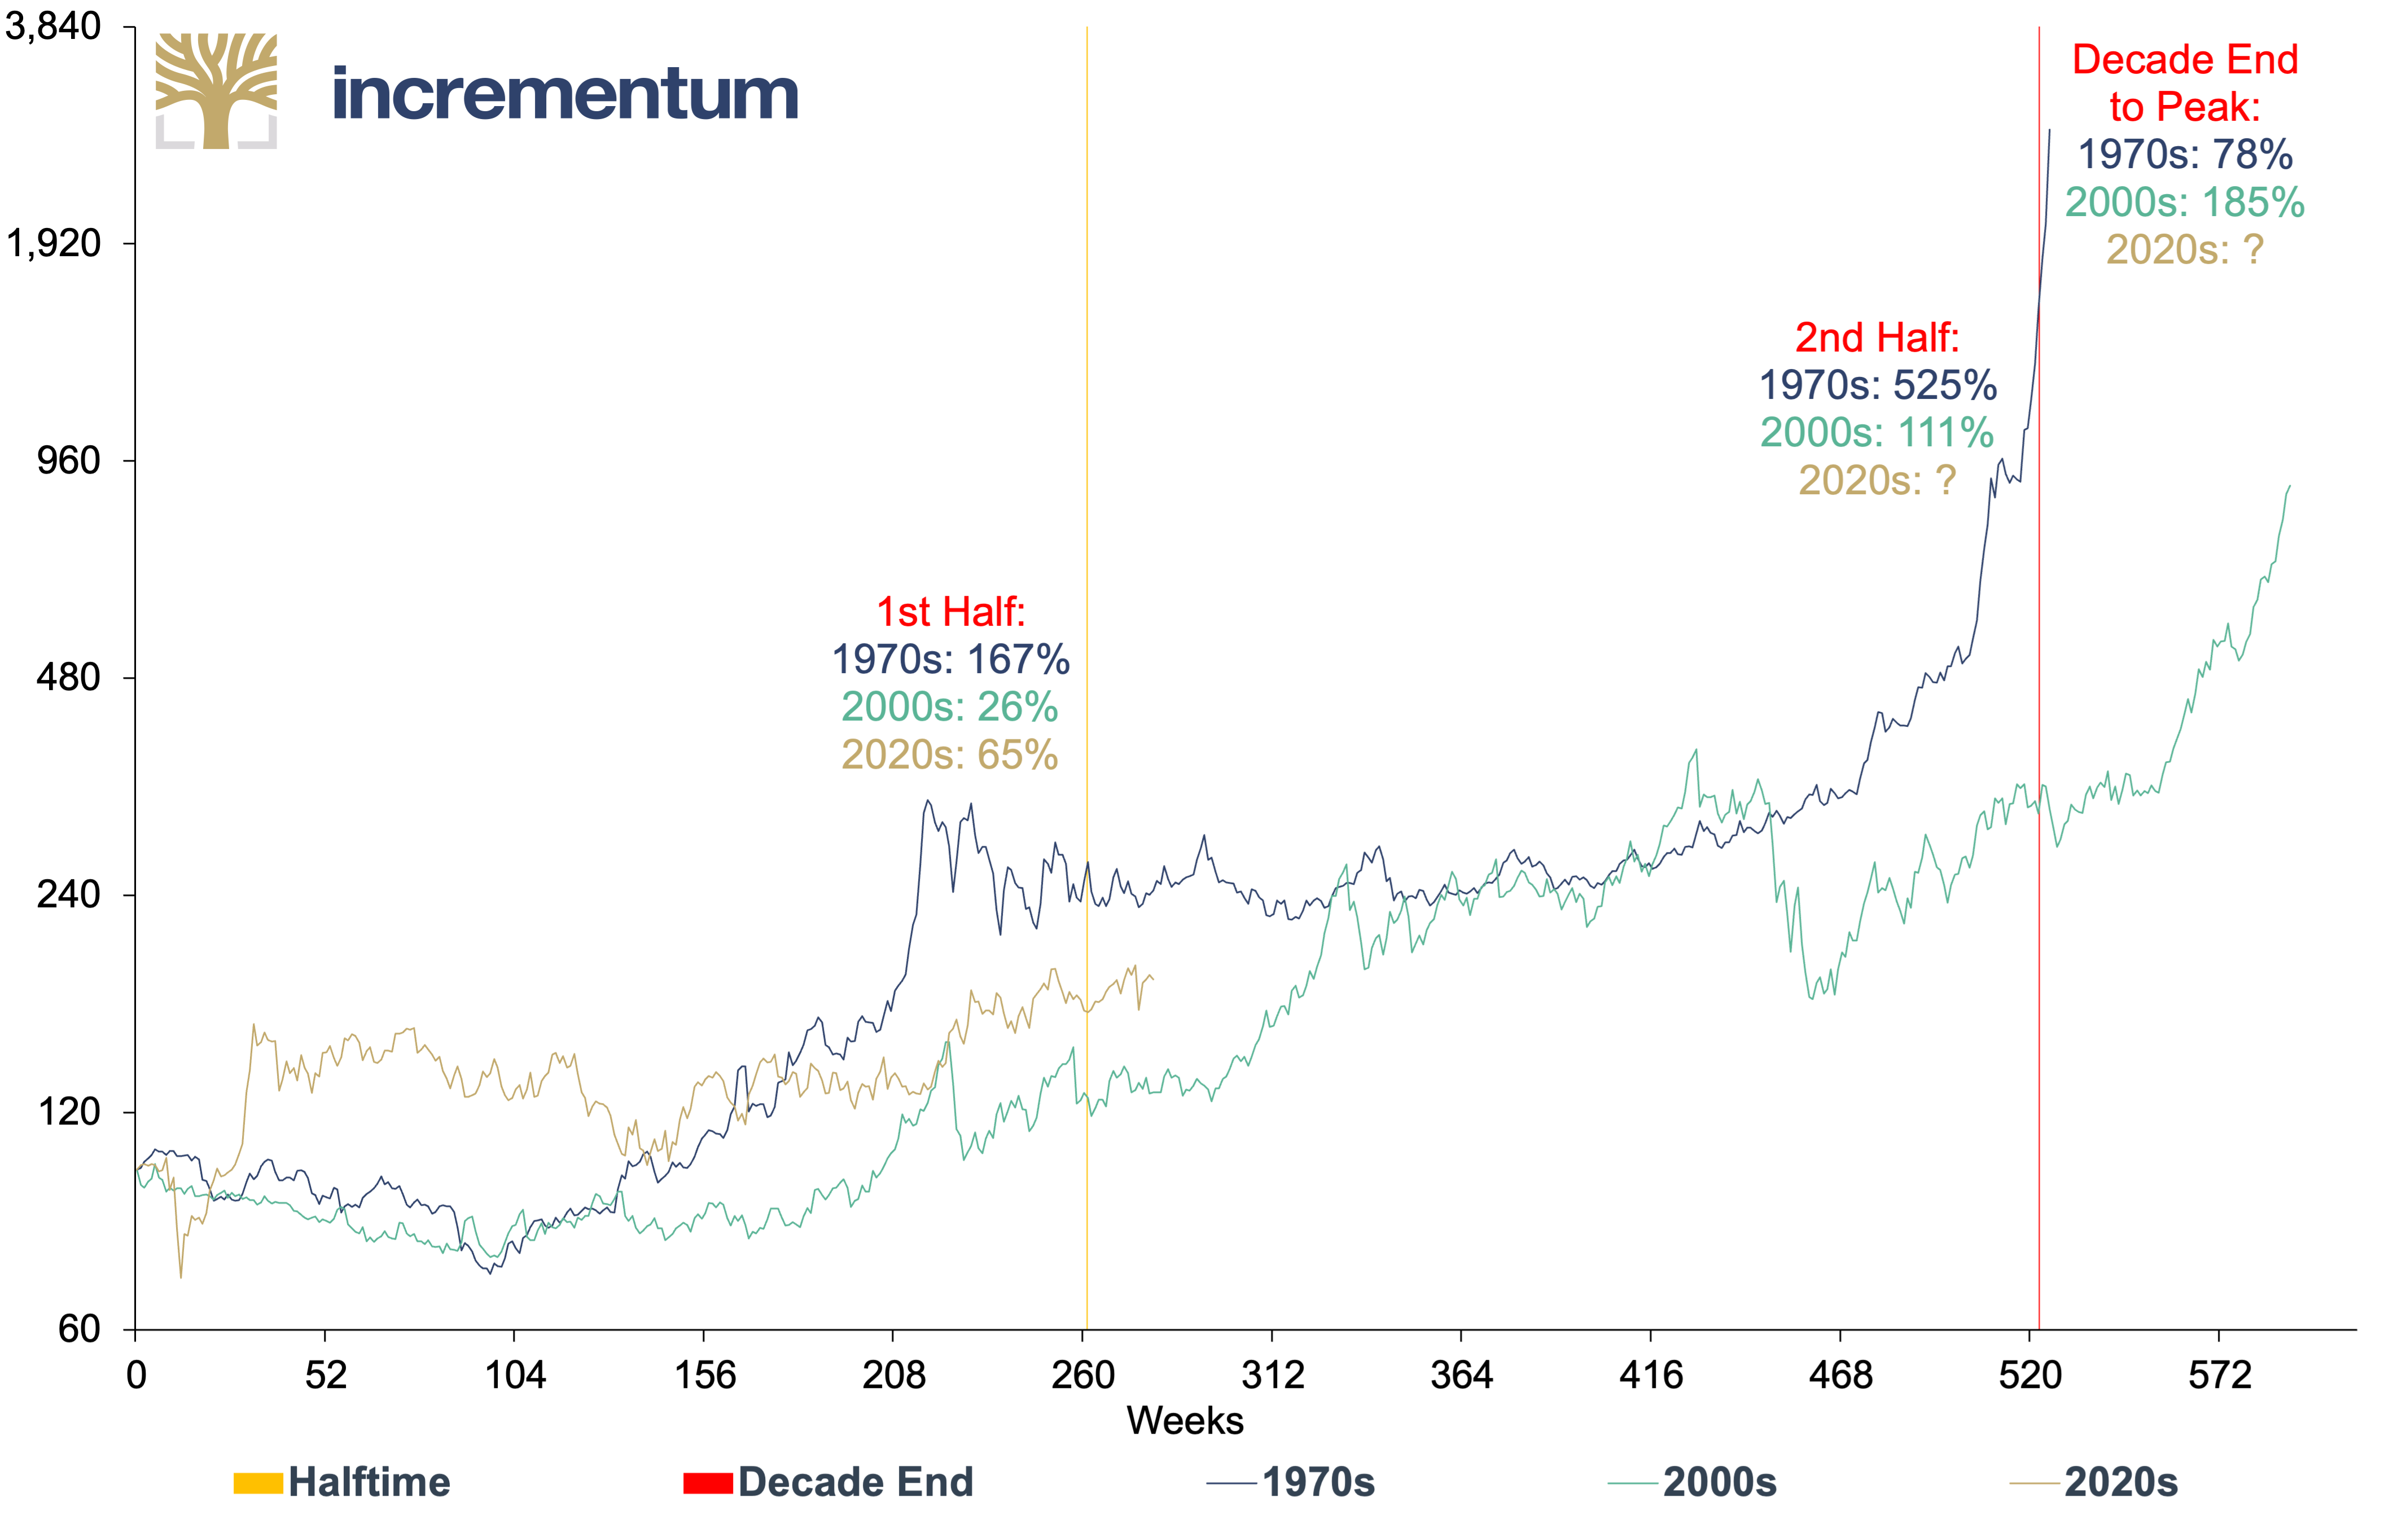
Silver
A look at the silver price trend in the three major gold bull market decades reveals a recurring pattern: The strongest momentum typically unfolds in the second half of the decade, often accompanied by a parabolic finale.
In the first half of the current decade, silver gained 65%, significantly more than in the 2000s (+26%). The dynamic in the 1970s was much more pronounced, with silver rising by 167% in the first five years. This solid but not yet explosive performance left room for a stronger second half. The historical benchmarks underline this perspective: In the second half of the decade, the silver price rose by an impressive 525% in the 1970s and by 111% in the 2000s. Both phases were characterized by a growing fear of inflation, uncertainty about the financial system’s stability, and an increasingly speculative market structure. These conditions can also be found in the current decade.
Silver (log), in USD, 100 = Decade Start, 12/1969–04/2025
Source: LSEG, LBMA, Incrementum AG
It is also worth looking at what happened after the official end of the decade: In the 1970s, silver gained a further 78% in a closing phase that lasted only a few weeks. In the 2000s, there was an increase of 185% after 2010, up to the cyclical high in spring 2011. Such excess movements are typical of late bull market phases and underline silver’s tendency towards extreme swings in a short period.
If the price trend continues along the lines of the 2000s, silver would rise from its mid-term closing price of USD 28.87 to around USD 60 by the end of the decade and thus reach a new all-time high. Including a comparable parabolic final spurt as in 2011, a rise to around USD 170 would be conceivable. If, on the other hand, the much more dynamic course of the 1970s bull market is taken as a guide, the price level of silver would already be around USD 180 at the end of the decade and could climb to around USD 320 by the cycle’s peak. These historical comparative values illustrate the considerable catch-up and break-out potential that silver can develop in an advanced phase of a commodity cycle.
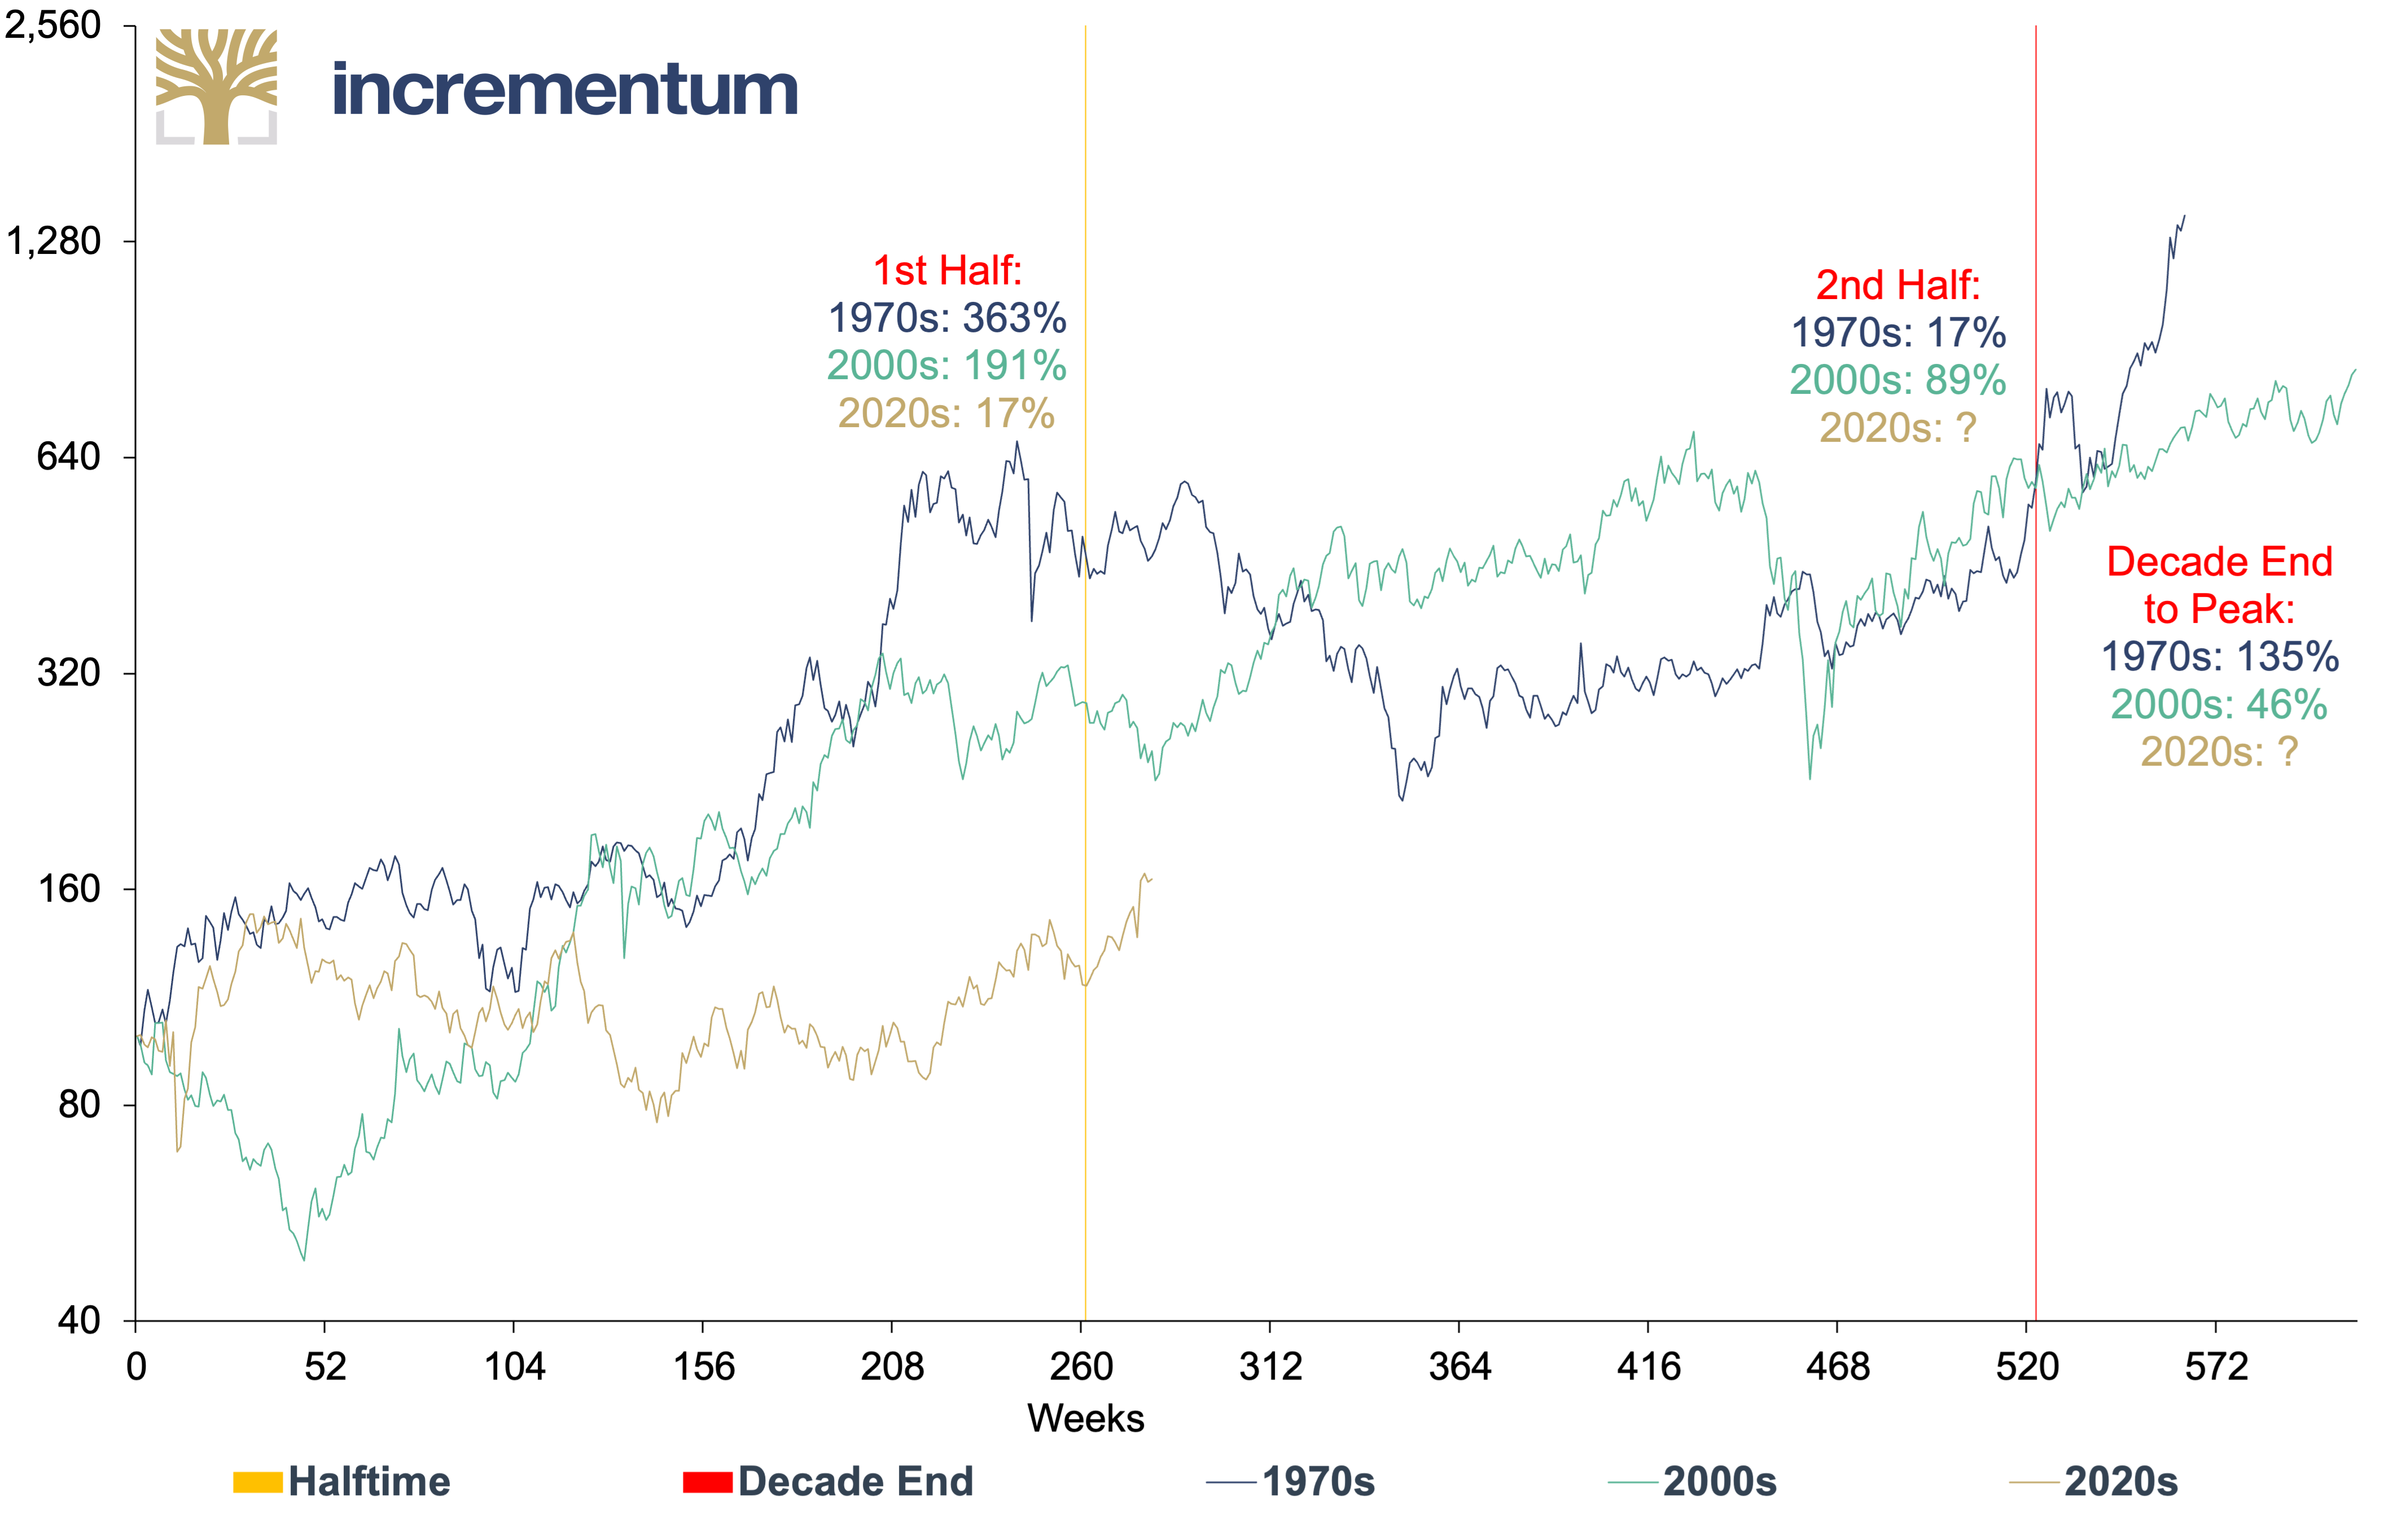
Mining stocks
A look at the performance of gold mining shares over the past three major gold bull market decades shows some very different phases. The first half of the decade in the 1970s was characterized by a veritable price fireworks, with a mining stocks performance of +363%, while they gained +191% in the 2000s. In the current decade, on the other hand, the start has so far been much more subdued: A gain of just 17% has been recorded at the halfway point, which represents a significant underperformance compared to previous cycles.
Gold Mining Stocks* (log), in USD, 100 = Decade Start, 12/1969–04/2025
Source: LSEG, Nick Laird, Incrementum AG
*BGMI 12/1969–05/1996, HUI 05/1996–
In contrast, the second half of the two historical bull markets was less dynamic. In the 1970s, growth was surprisingly low at 17%, while mining stocks gained 89% in the latter half of the 2000s. This shows that a strong first half does not necessarily have to lead to an equally strong continuation, and, conversely, a weak first phase, as is currently the case, can certainly offer scope for catch-up effects.
The final phase after the official end of the decade is particularly striking. In the 1970s, share prices exploded by a further 135%. In the 2000s, they rose by 46%. This shows again that gold mining stocks, which are traditionally seen as a cyclical lever for the gold price, often react with a delay, but then disproportionately so. If the gold price rally continues or even accelerates in the second half of the 2020s, mining stocks could once again become the focus of investors, as in previous cycles, and develop dynamically from their current valuation levels.
Based on the half-decade closing price of the Gold Bugs Index (HUI) of 275, a new all-time high should also emerge for the mining share index at the end of the current bull market. In both historical comparison scenarios, the index level would rise to around 760 at the cycle peak. It is noteworthy that gold mining stocks have lagged significantly behind the developments of the past decades in the first half of the current decade, but also significantly behind gold and silver. This circumstance now opens up considerable catch-up potential for the second half of the cycle. The combination of low initial valuation, relative underperformance, and increasing gold price strength is a powerful lever for mining stocks in the final phase of the bull market.
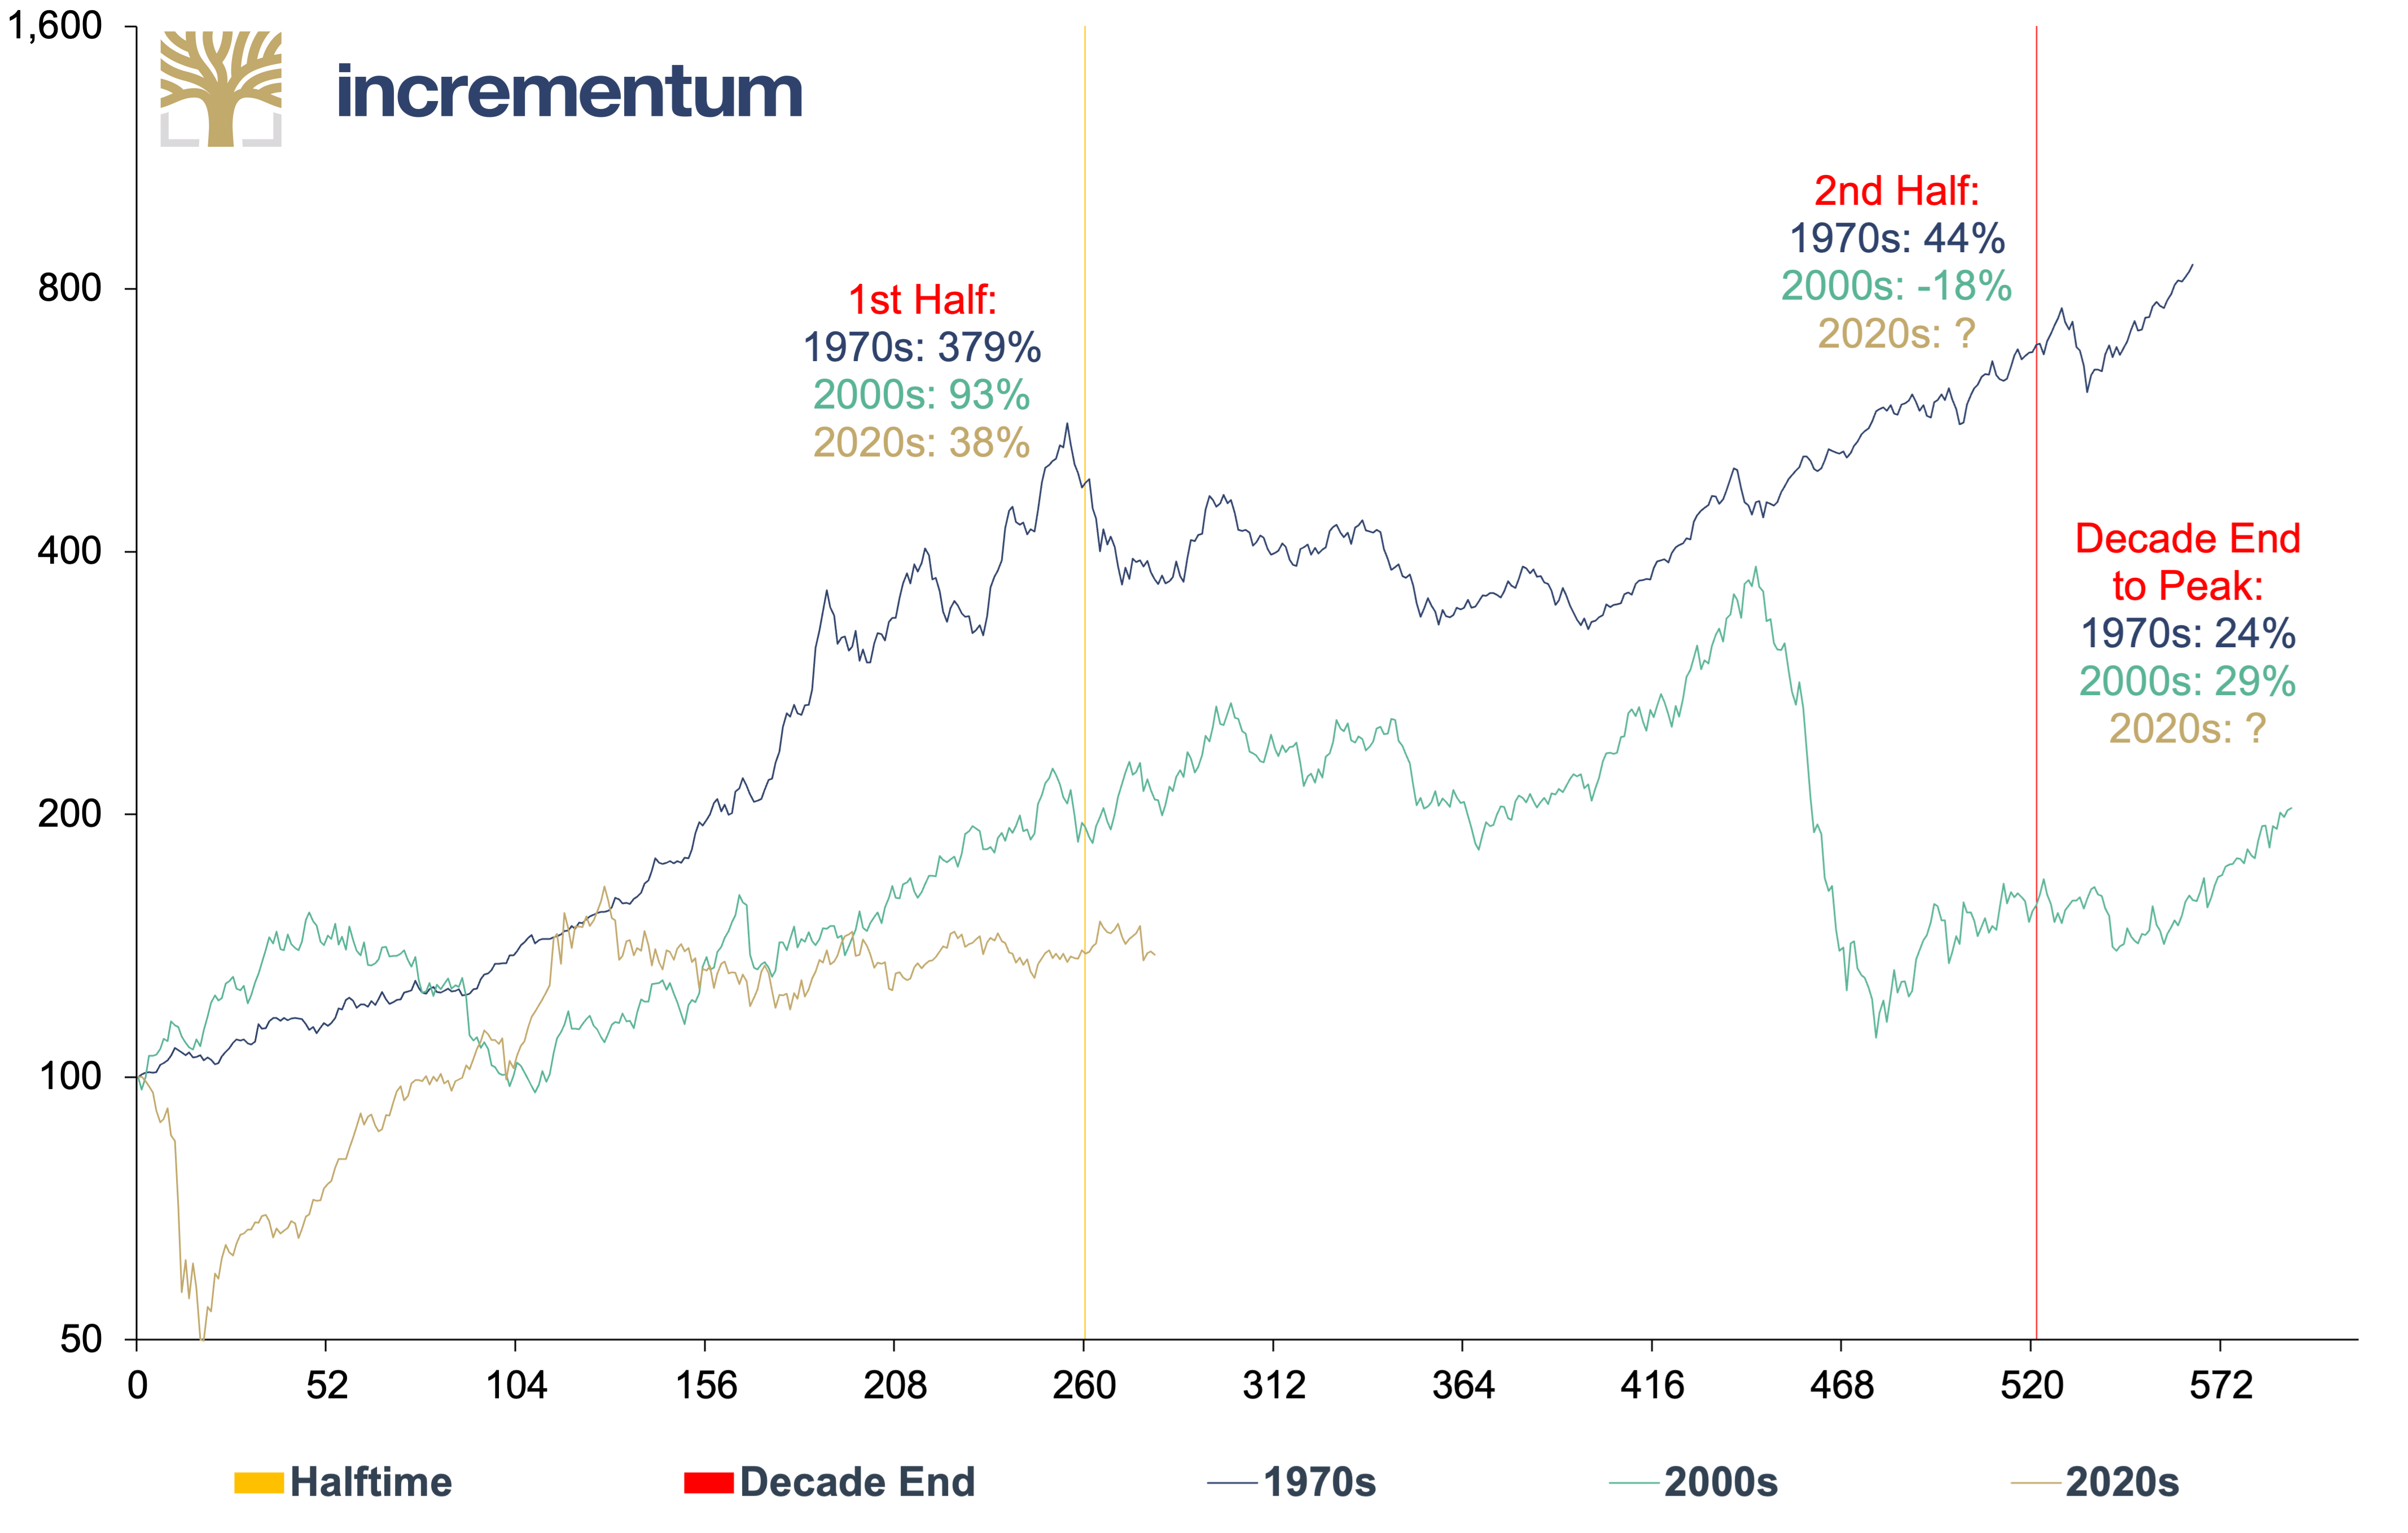
Commodities
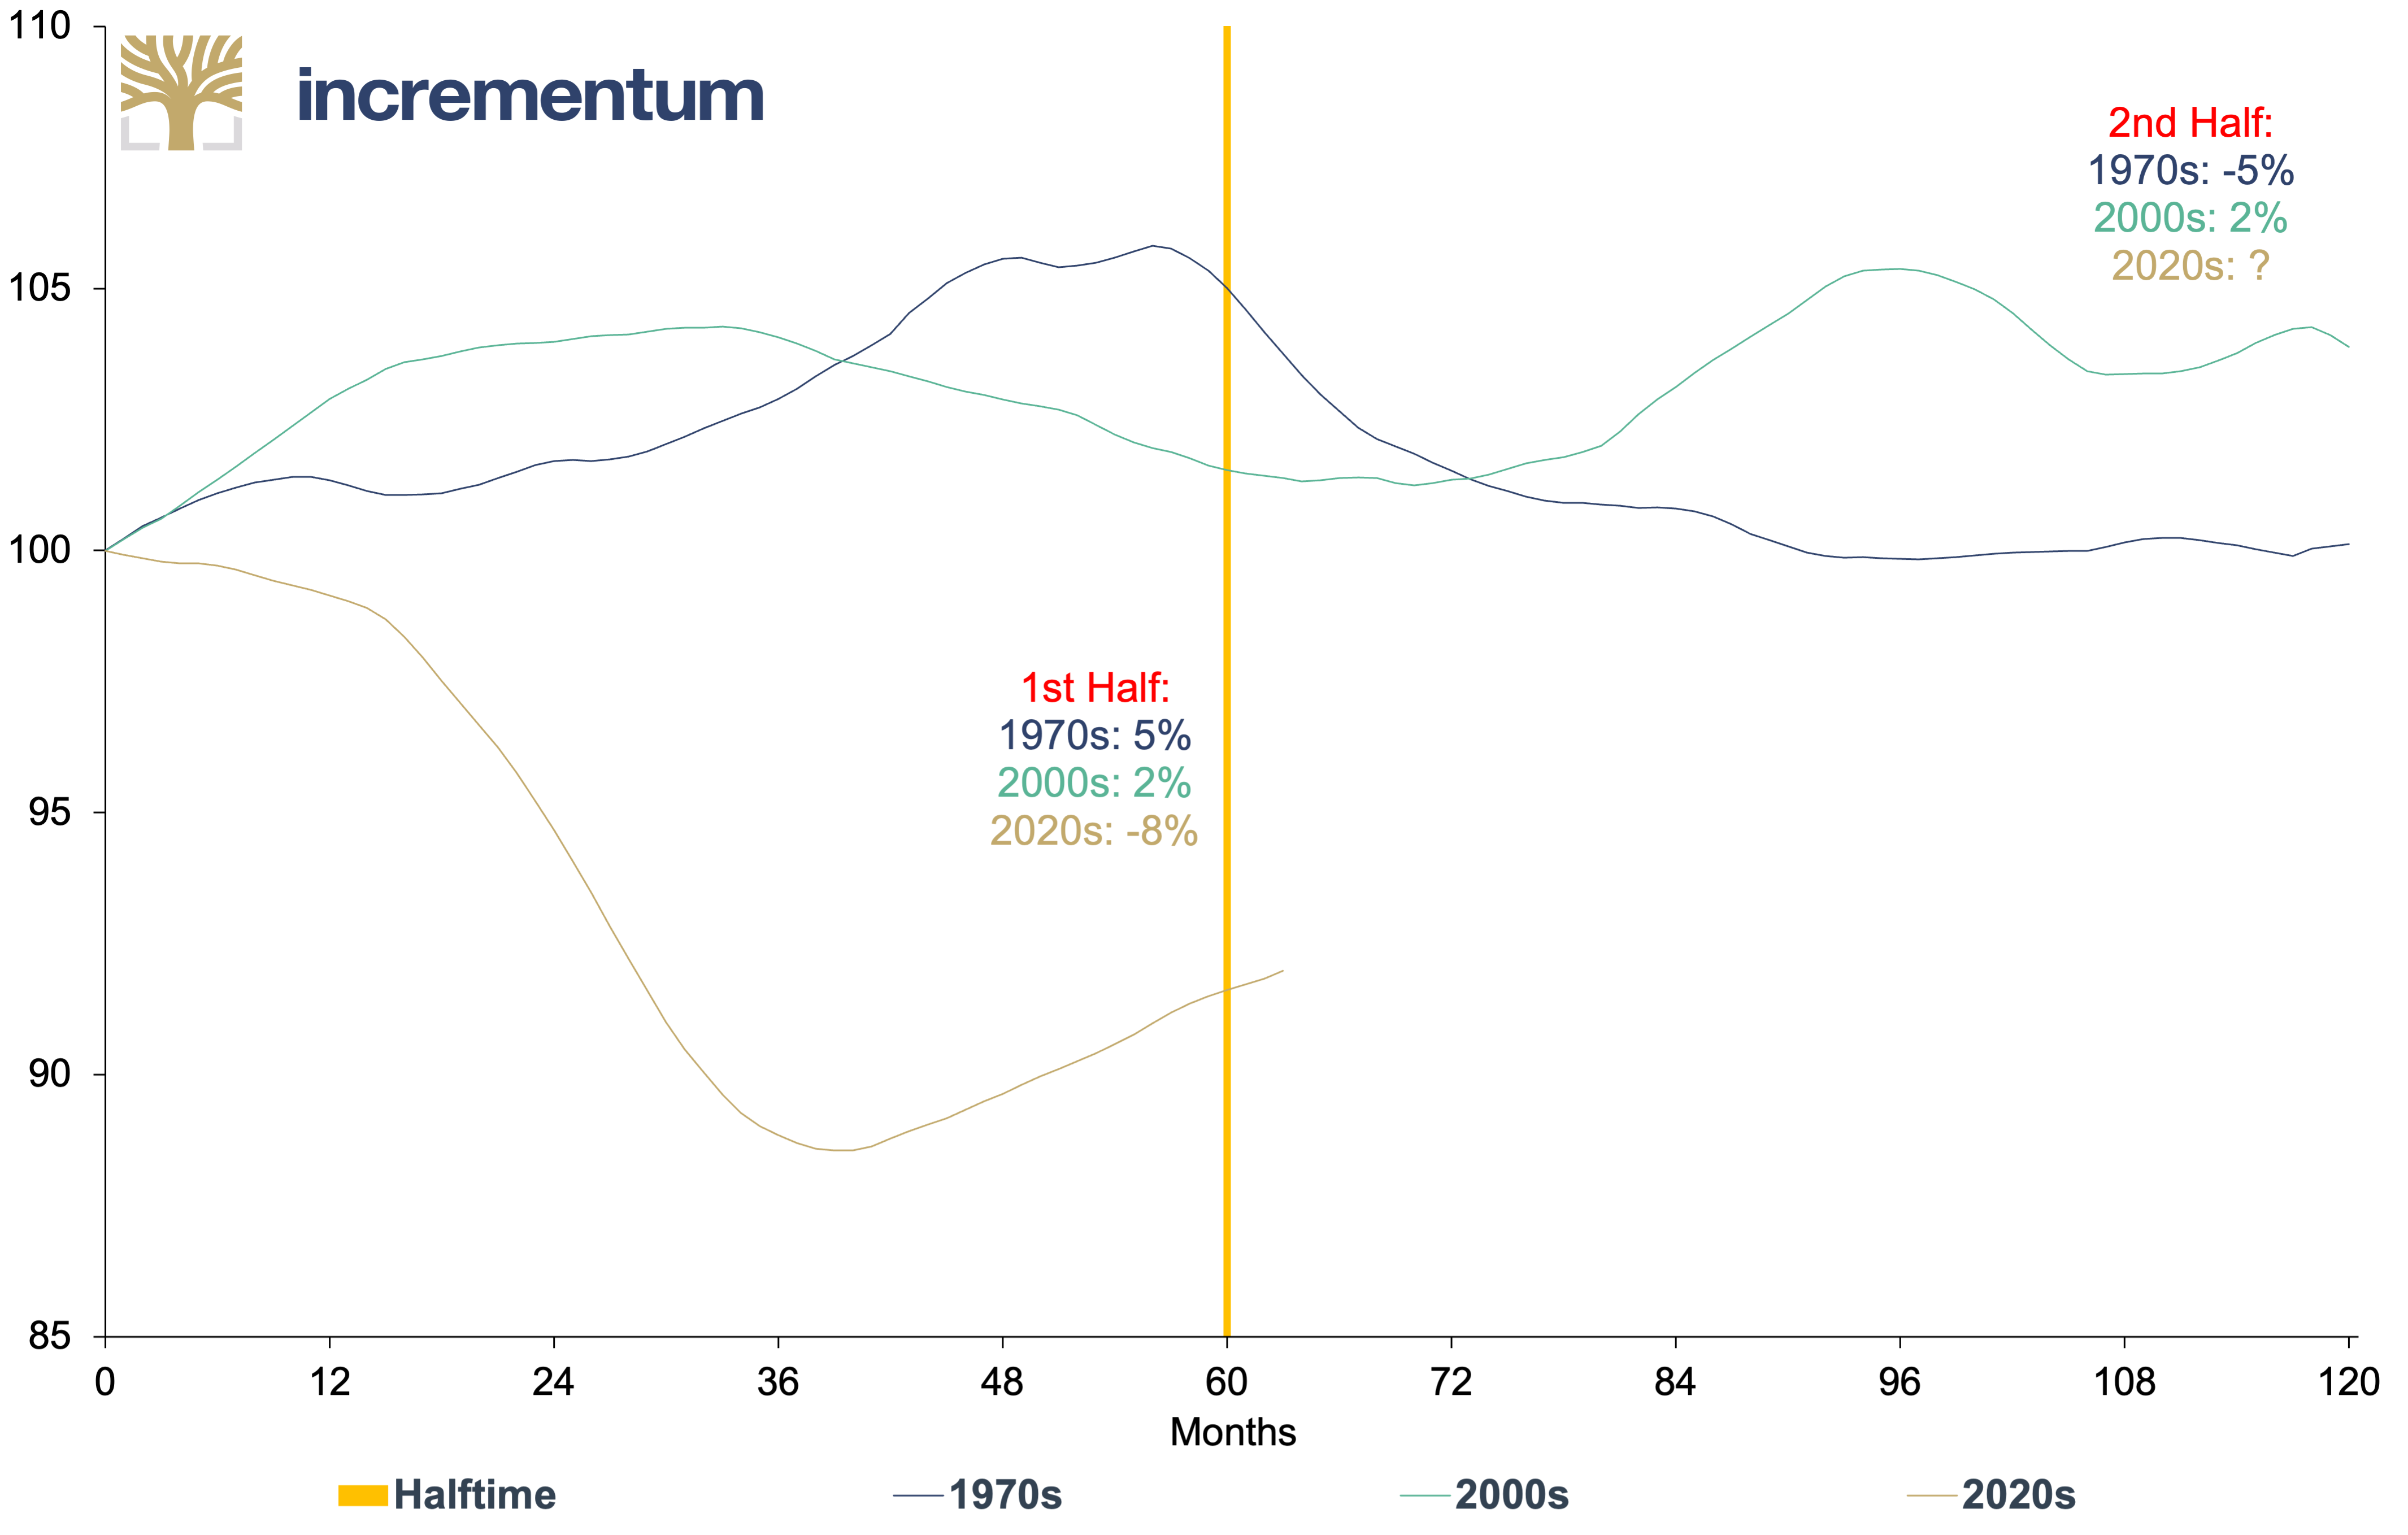
While the 1970s and 2000s saw significant upward phases in commodities, the current cycle has been much more subdued.
Commodities* (log), in USD, 100 = Decade Start, 12/1969–04/2025
Source: LSEG, Incrementum AG
*GSCI Index TR
In the first half of the 1970s, commodities rose by an impressive 379%, driven by oil price shocks, inflationary pressure, and a broad commodity supercycle. In the 2000s, the first half of the decade was also dynamic with growth of 93%, driven by Chinese development, catch-up effects after the dotcom bubble burst, and expansionary monetary policy.
In comparison, the trend in the first half of the 2020s has been much more moderate, with a growth of just 38%. This is a result of the more complex market environment: On the one hand, there were price surges due to the Covid-19 disruptions and the war in Ukraine, while on the other hand, demand concerns, monetary policy tightening, and geopolitical uncertainties had a dampening effect.
The divergence in the second half of the decade is even more striking. While commodities gained a further 44% in the 1970s, the trend in the 2000s was negative at -18%, primarily attributable to the global financial crisis and the subsequent cyclical weakness. The trend in the second half of the current decade remains open so far, but the low starting point certainly indicates potential for a recovery or even a straggler cycle. Even in the final phase after the end of the decade, the swings in commodities were somewhat limited by historical standards: +24% in the 1970s and +29% in the 2000s. In contrast to gold and silver, there was no parabolic closing phase.
Historically, commodities often benefit particularly strongly when an inflation cycle sets in. This is particularly true when supply shocks, geopolitical upheavals, and subdued investment activity coincide. In contrast to gold or silver, however, the commodity complex reacts more differentiated and sector-dependently. The moderate performance in the current decade opens considerable potential, especially if structural bottlenecks and geopolitical fragmentation continue to intensify.
Mid-Term Review of the Proprietary Decade Forecast
Our proprietary Incrementum Gold Price Model, presented in the In Gold We Trust report 2020, “The Dawning of a Golden Decade”, aims to provide a well-founded projection of the gold price until the end of the decade. Five years after the initial forecast, it is time to take stock. In doing so, we look at the development of the gold price to date and the development of the underlying factors to better understand their significance in the current market environment.
The model is based on two key parameters: the money supply (M2) and the so-called implicit gold coverage ratio. As the US dollar continues to be the global reserve currency and thus exerts a significant influence on the gold price, our analysis is based on US data, from which we derive a target price level in US dollars.
Three M2 growth scenarios were modeled for the future development of the money supply. The respective growth rates are based on historical decades and were additionally weighted with probabilities of occurrence:
- high M2 growth rate:
9.7% p.a. (1970s); probability of occurrence: 15%
- low M2 growth rate:
3.9% p.a. (1990s); probability of occurrence 5%
- average M2 growth rate:
6.3% p.a. (2000s); probability of occurrence 80%
M2 Scenarios, in USD bn, 01/1970–12/2029
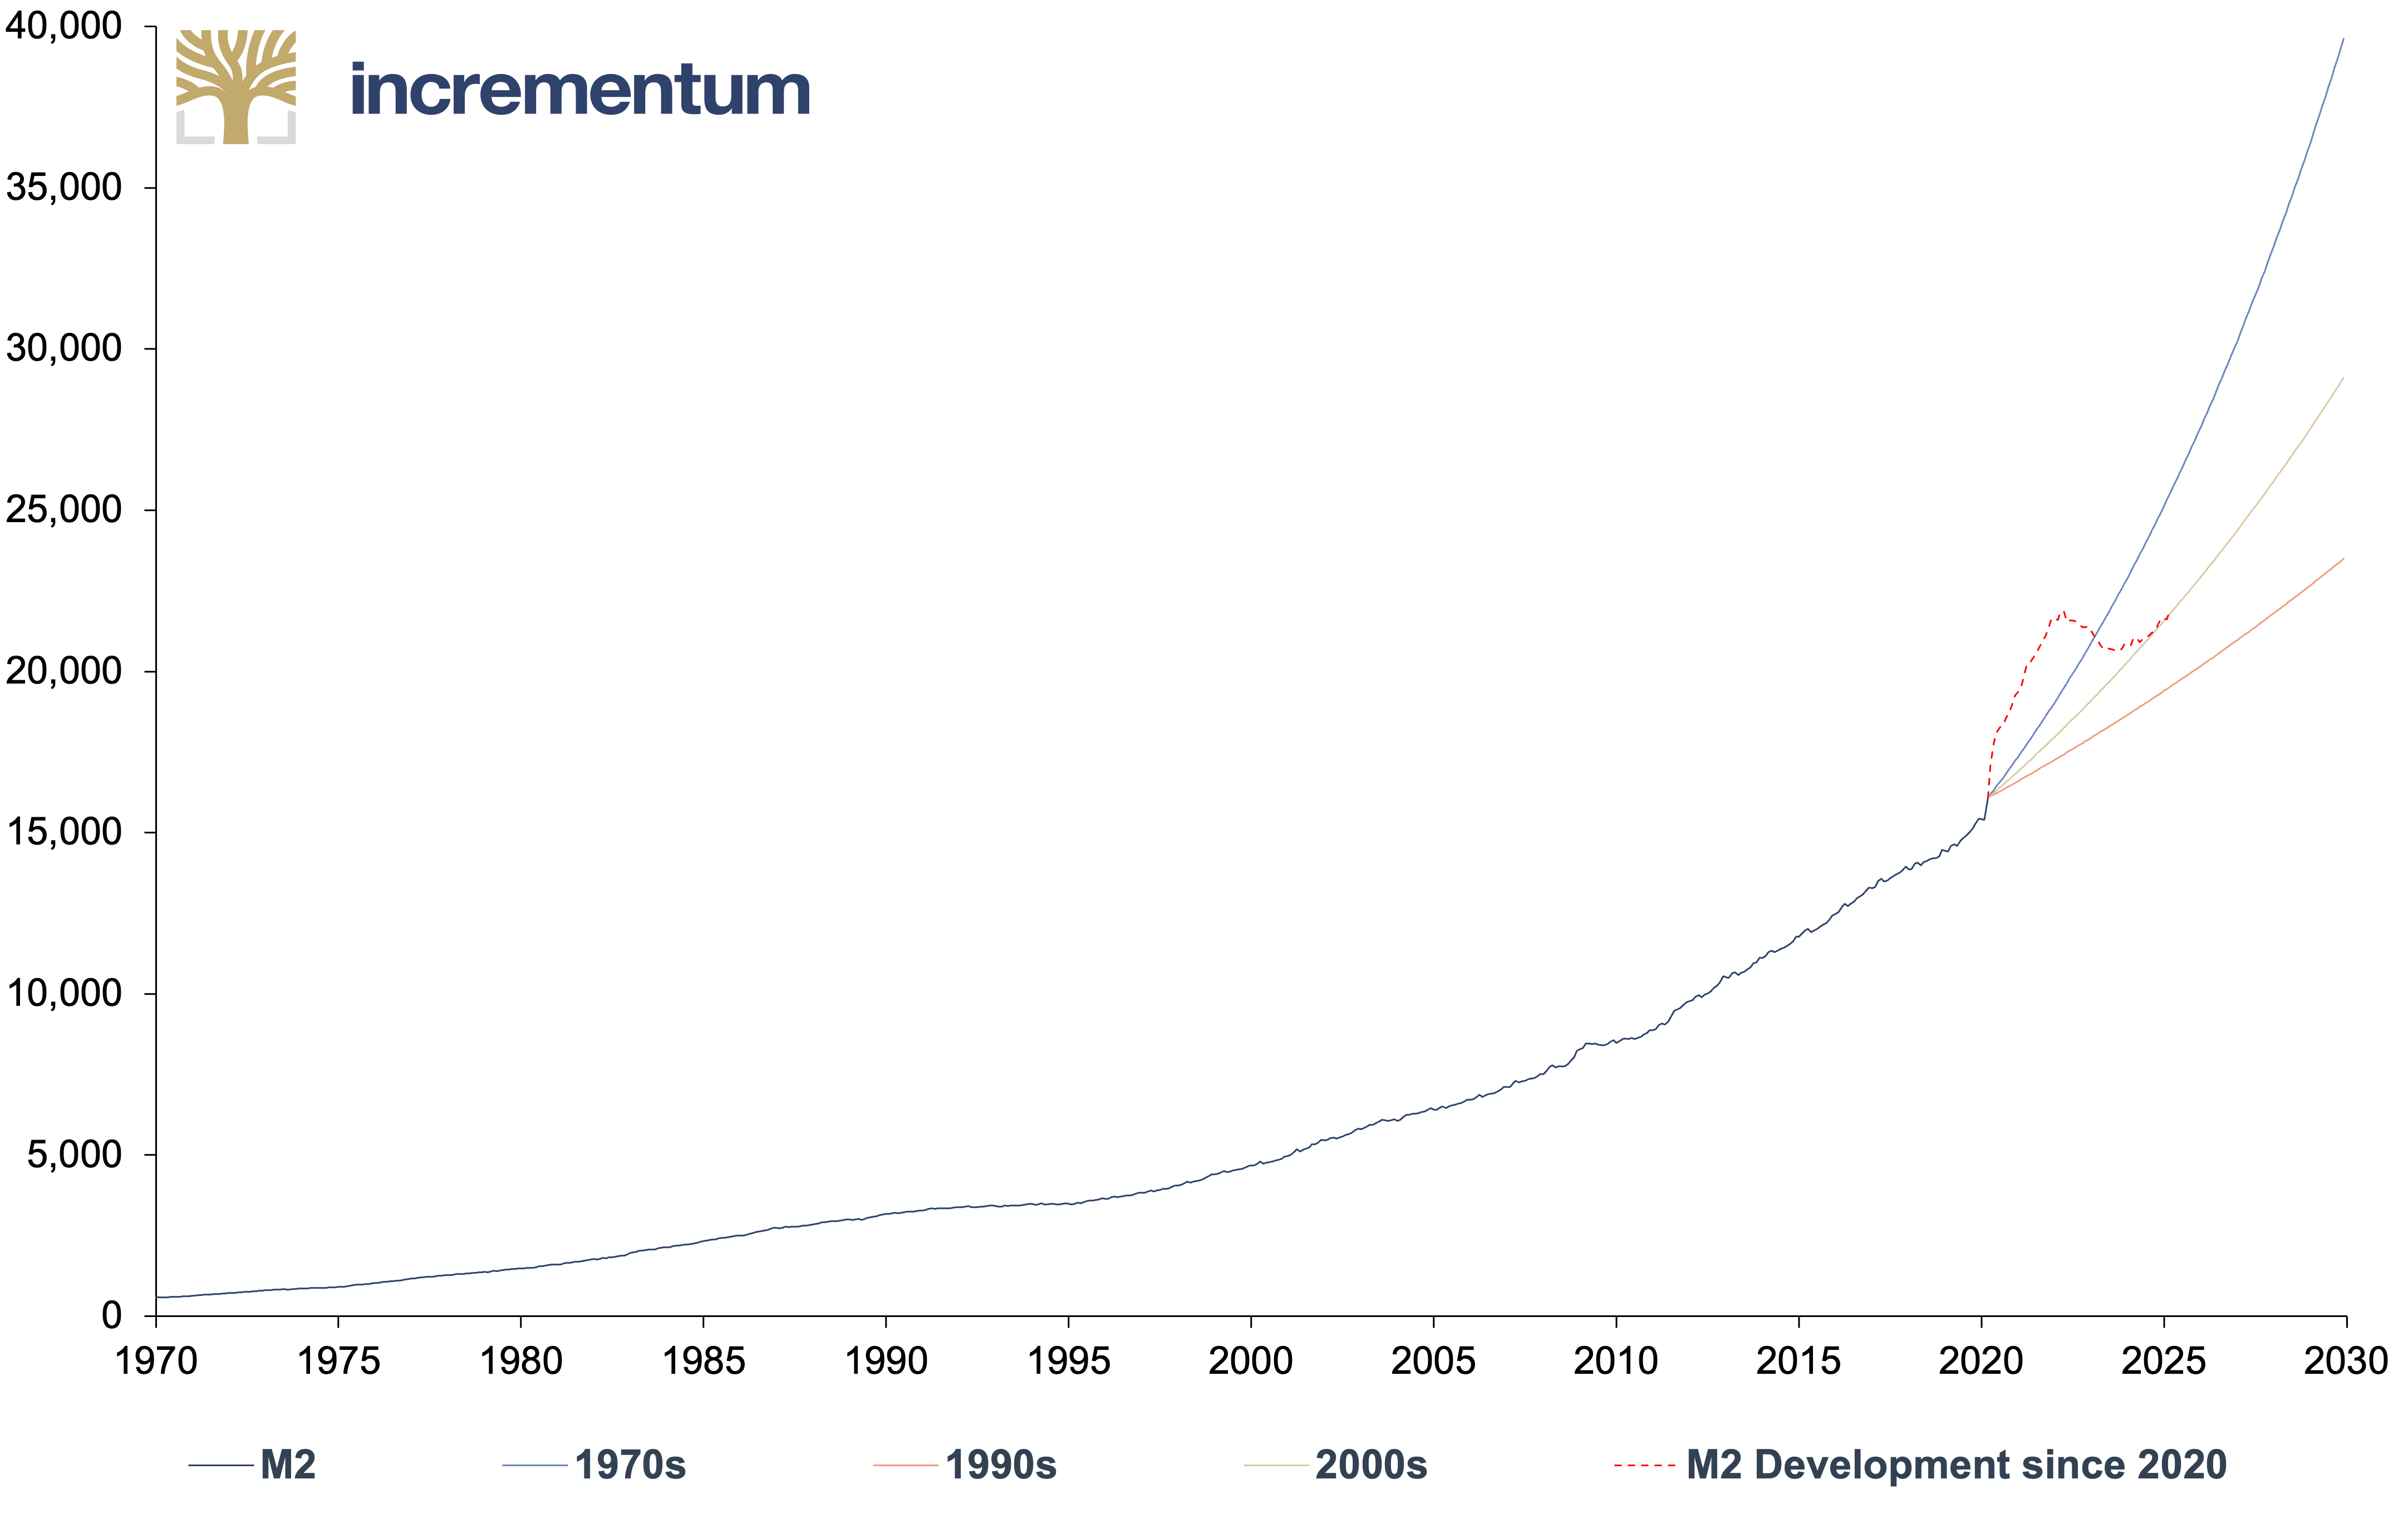
Source: LSEG, Incrementum AG
As the chart illustrates, after a brief phase of overshooting, the current growth in the M2 money supply is now essentially following the path of the 2000s, to which we have assigned the highest weighting with a probability of occurrence of 80%. As of March 2025, the annual growth rate is 7.0% p.a.
The implicit gold coverage ratio indicates what proportion of the money supply is covered by the gold reserves of a central bank, valued at the current market price. Historically, this value has fluctuated around 3.3% but rises significantly in phases of declining confidence in the monetary system, such as during the stagflationary 1970s, the global financial crisis of 2007/08, and the subsequent recession. The implicit coverage ratio currently stands at 3.8%, indicating a moderate increase so far and may be just the beginning of a more significant trend.
Gold Coverage Ratio of M2, 01/1970–03/2025
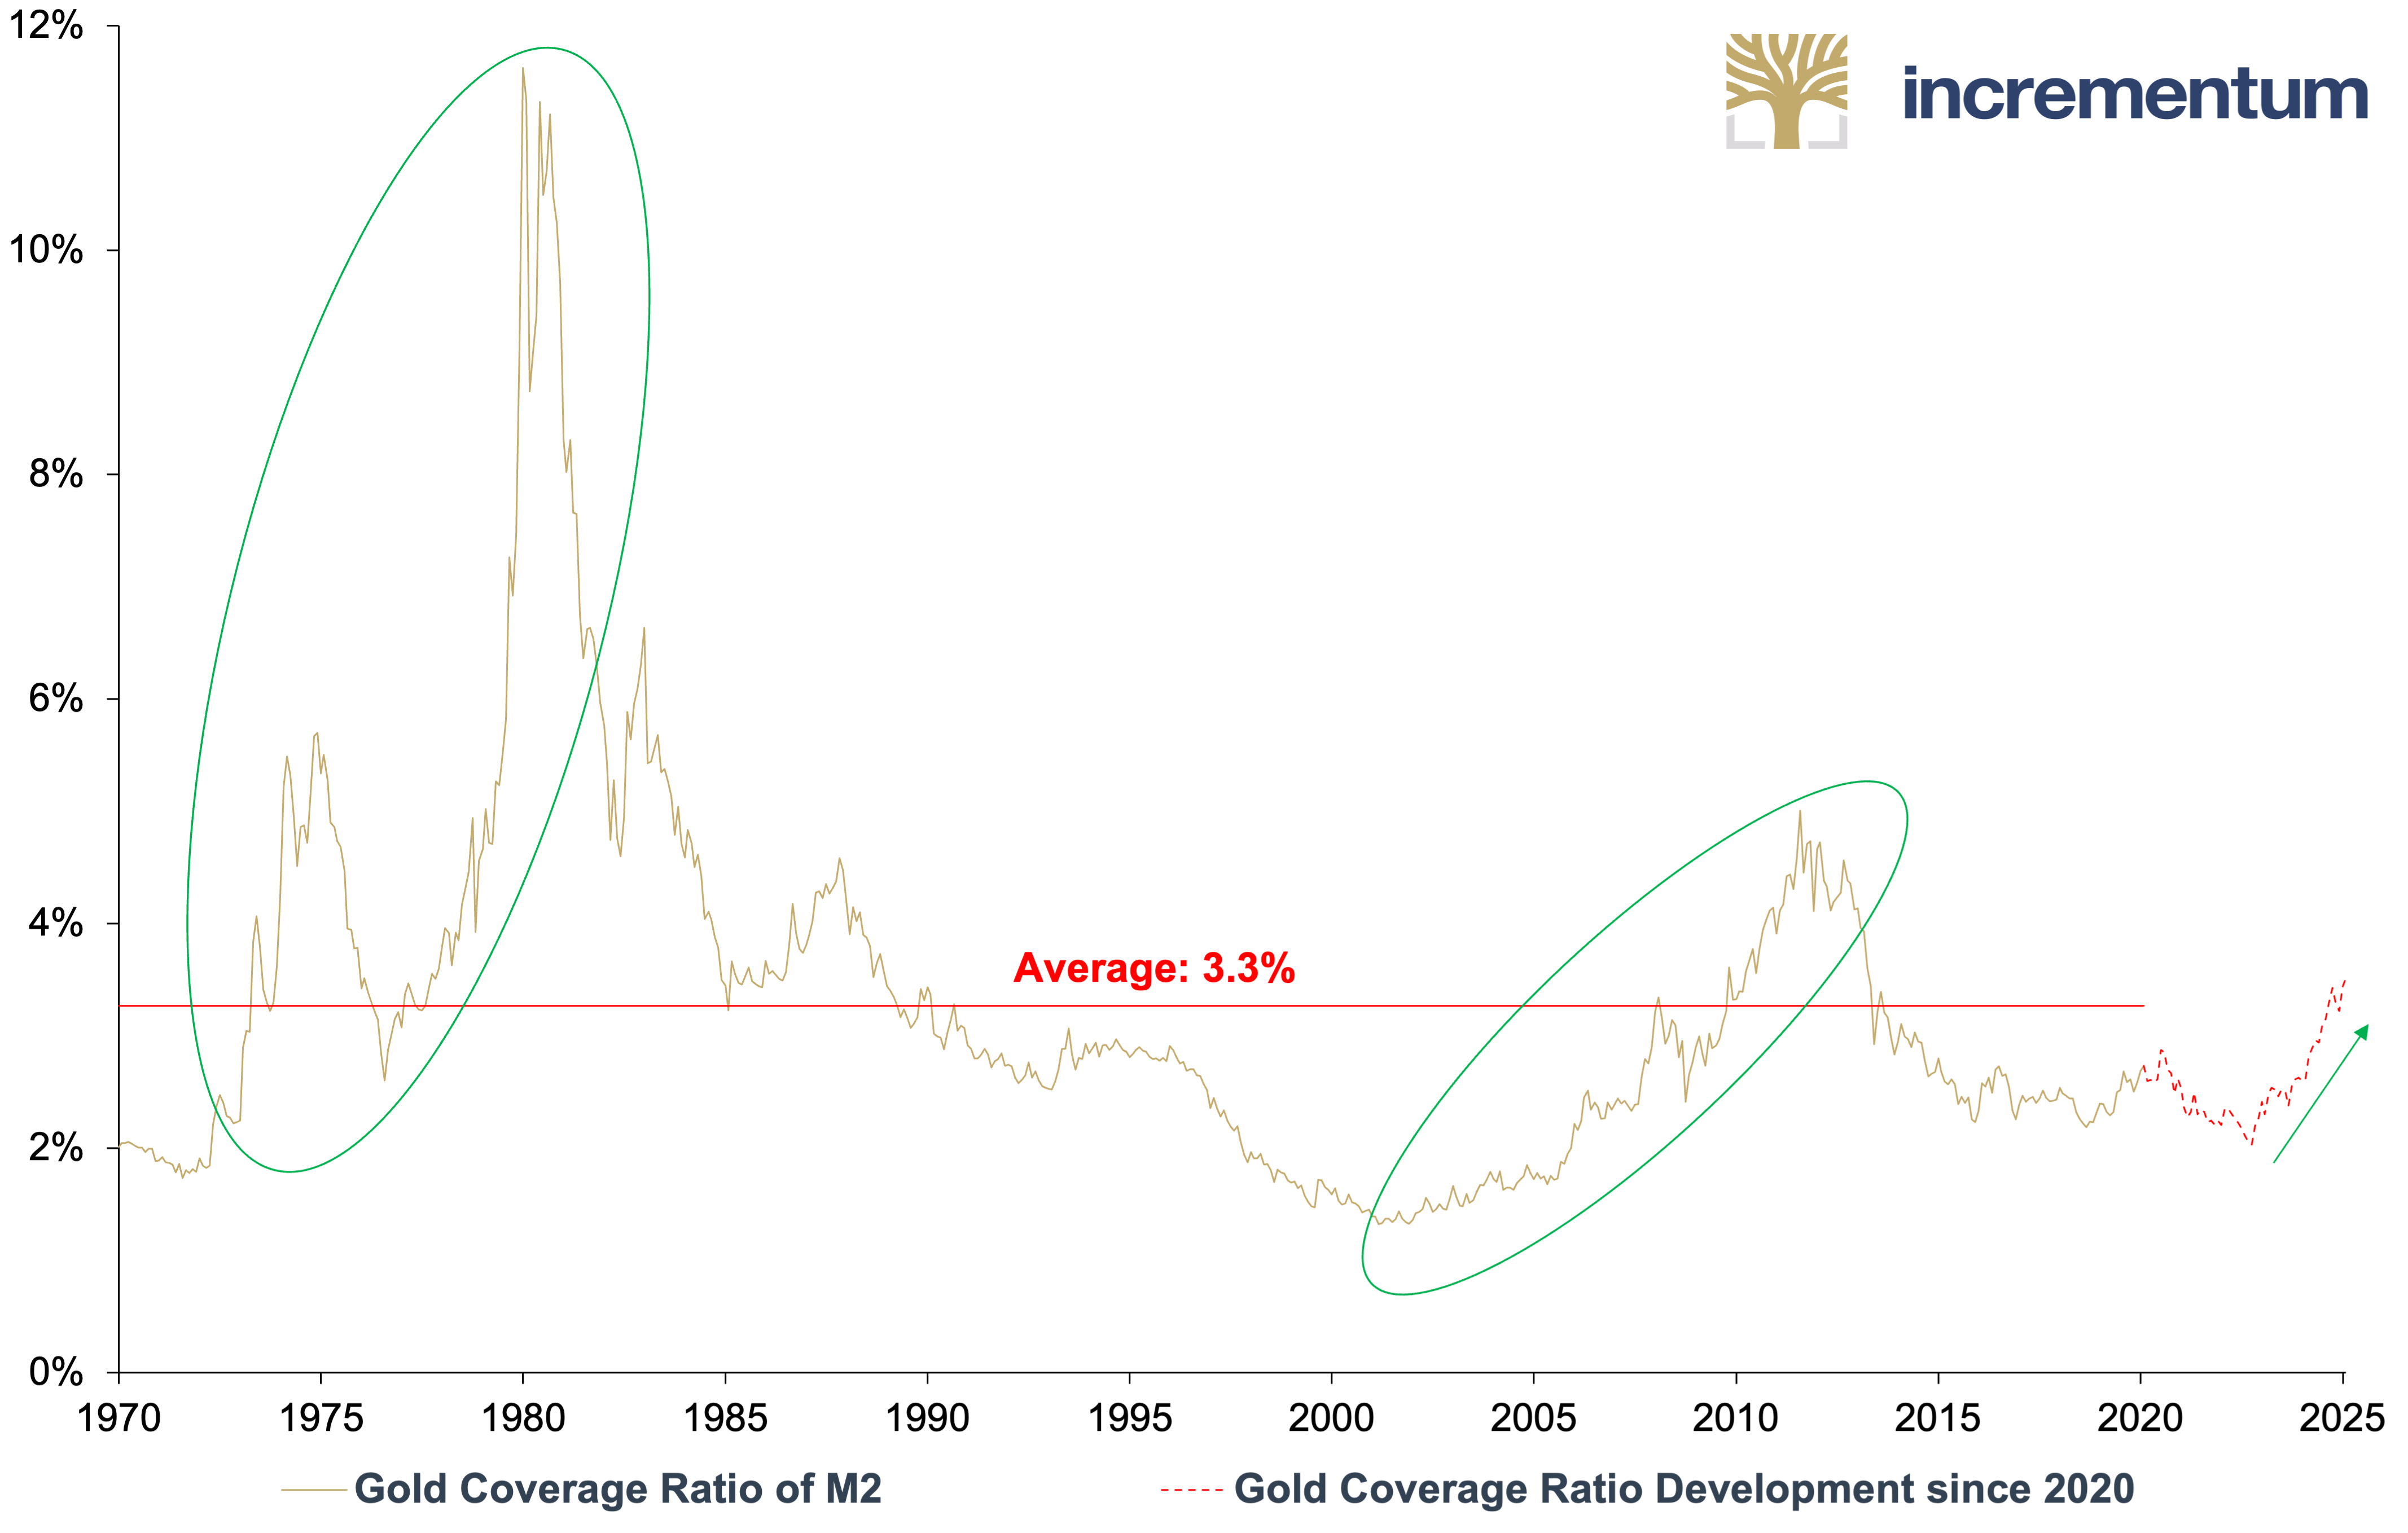
Source: LSEG, Incrementum AG
Based on these three scenarios, we have created a probability-weighted distribution function based on historical data. The most likely scenario is a gold coverage ratio between 3% and 4% with an M2 development as in the 2000s. This is precisely where the current value of 3.8% is, which speaks for the calibration and forecasting quality of the gold price model.
Probability Function of Scenarios: Gold Coverage Ratio of M2 (x–axis), and Probability of Occurrence (y–axis)
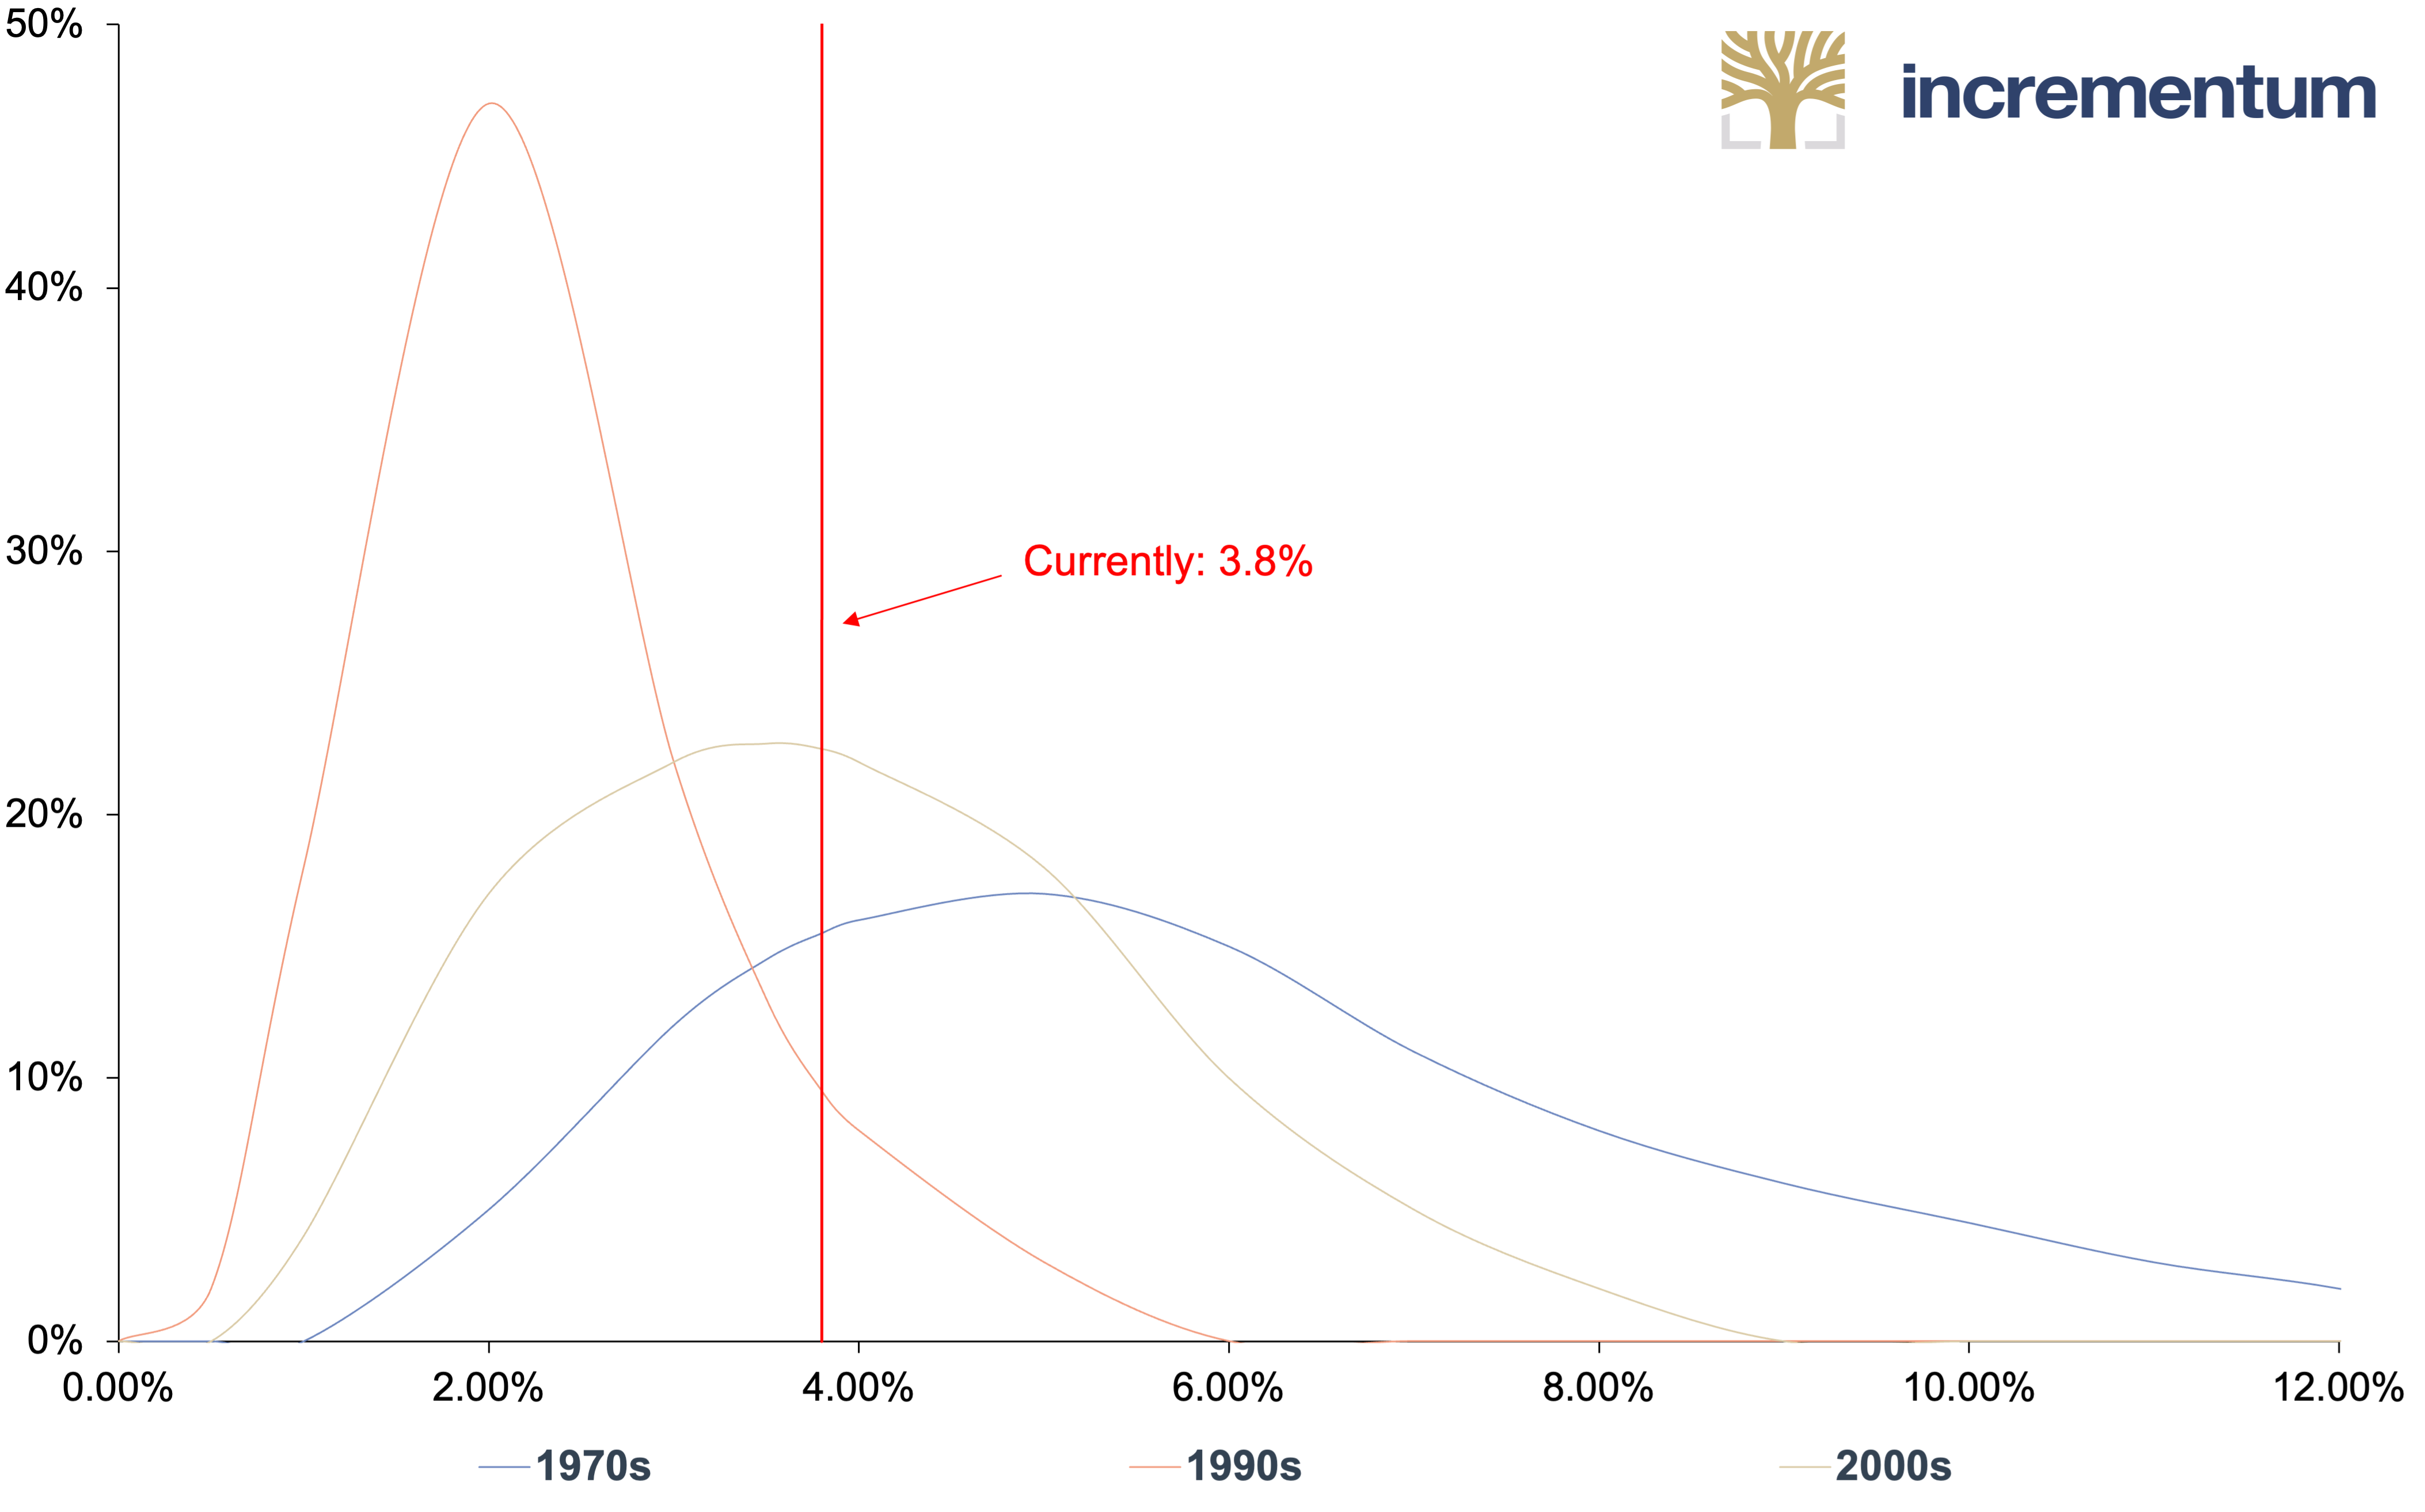
Source: LSEG, Incrementum AG
The cumulative distribution results in an expected gold price of around USD 4,800 at the end of the decade, the price target that we have consistently advocated since the model was introduced in 2020. It is essential to point out the clear right skew of the distribution, which makes higher price levels more likely than lower ones. For example, the probability of a gold price above USD 6,000 is over 25%, while a price above USD 4,000 has a probability of 57.4%.
Approximated Gold Price in 2030, by Distribution Probability, in USD
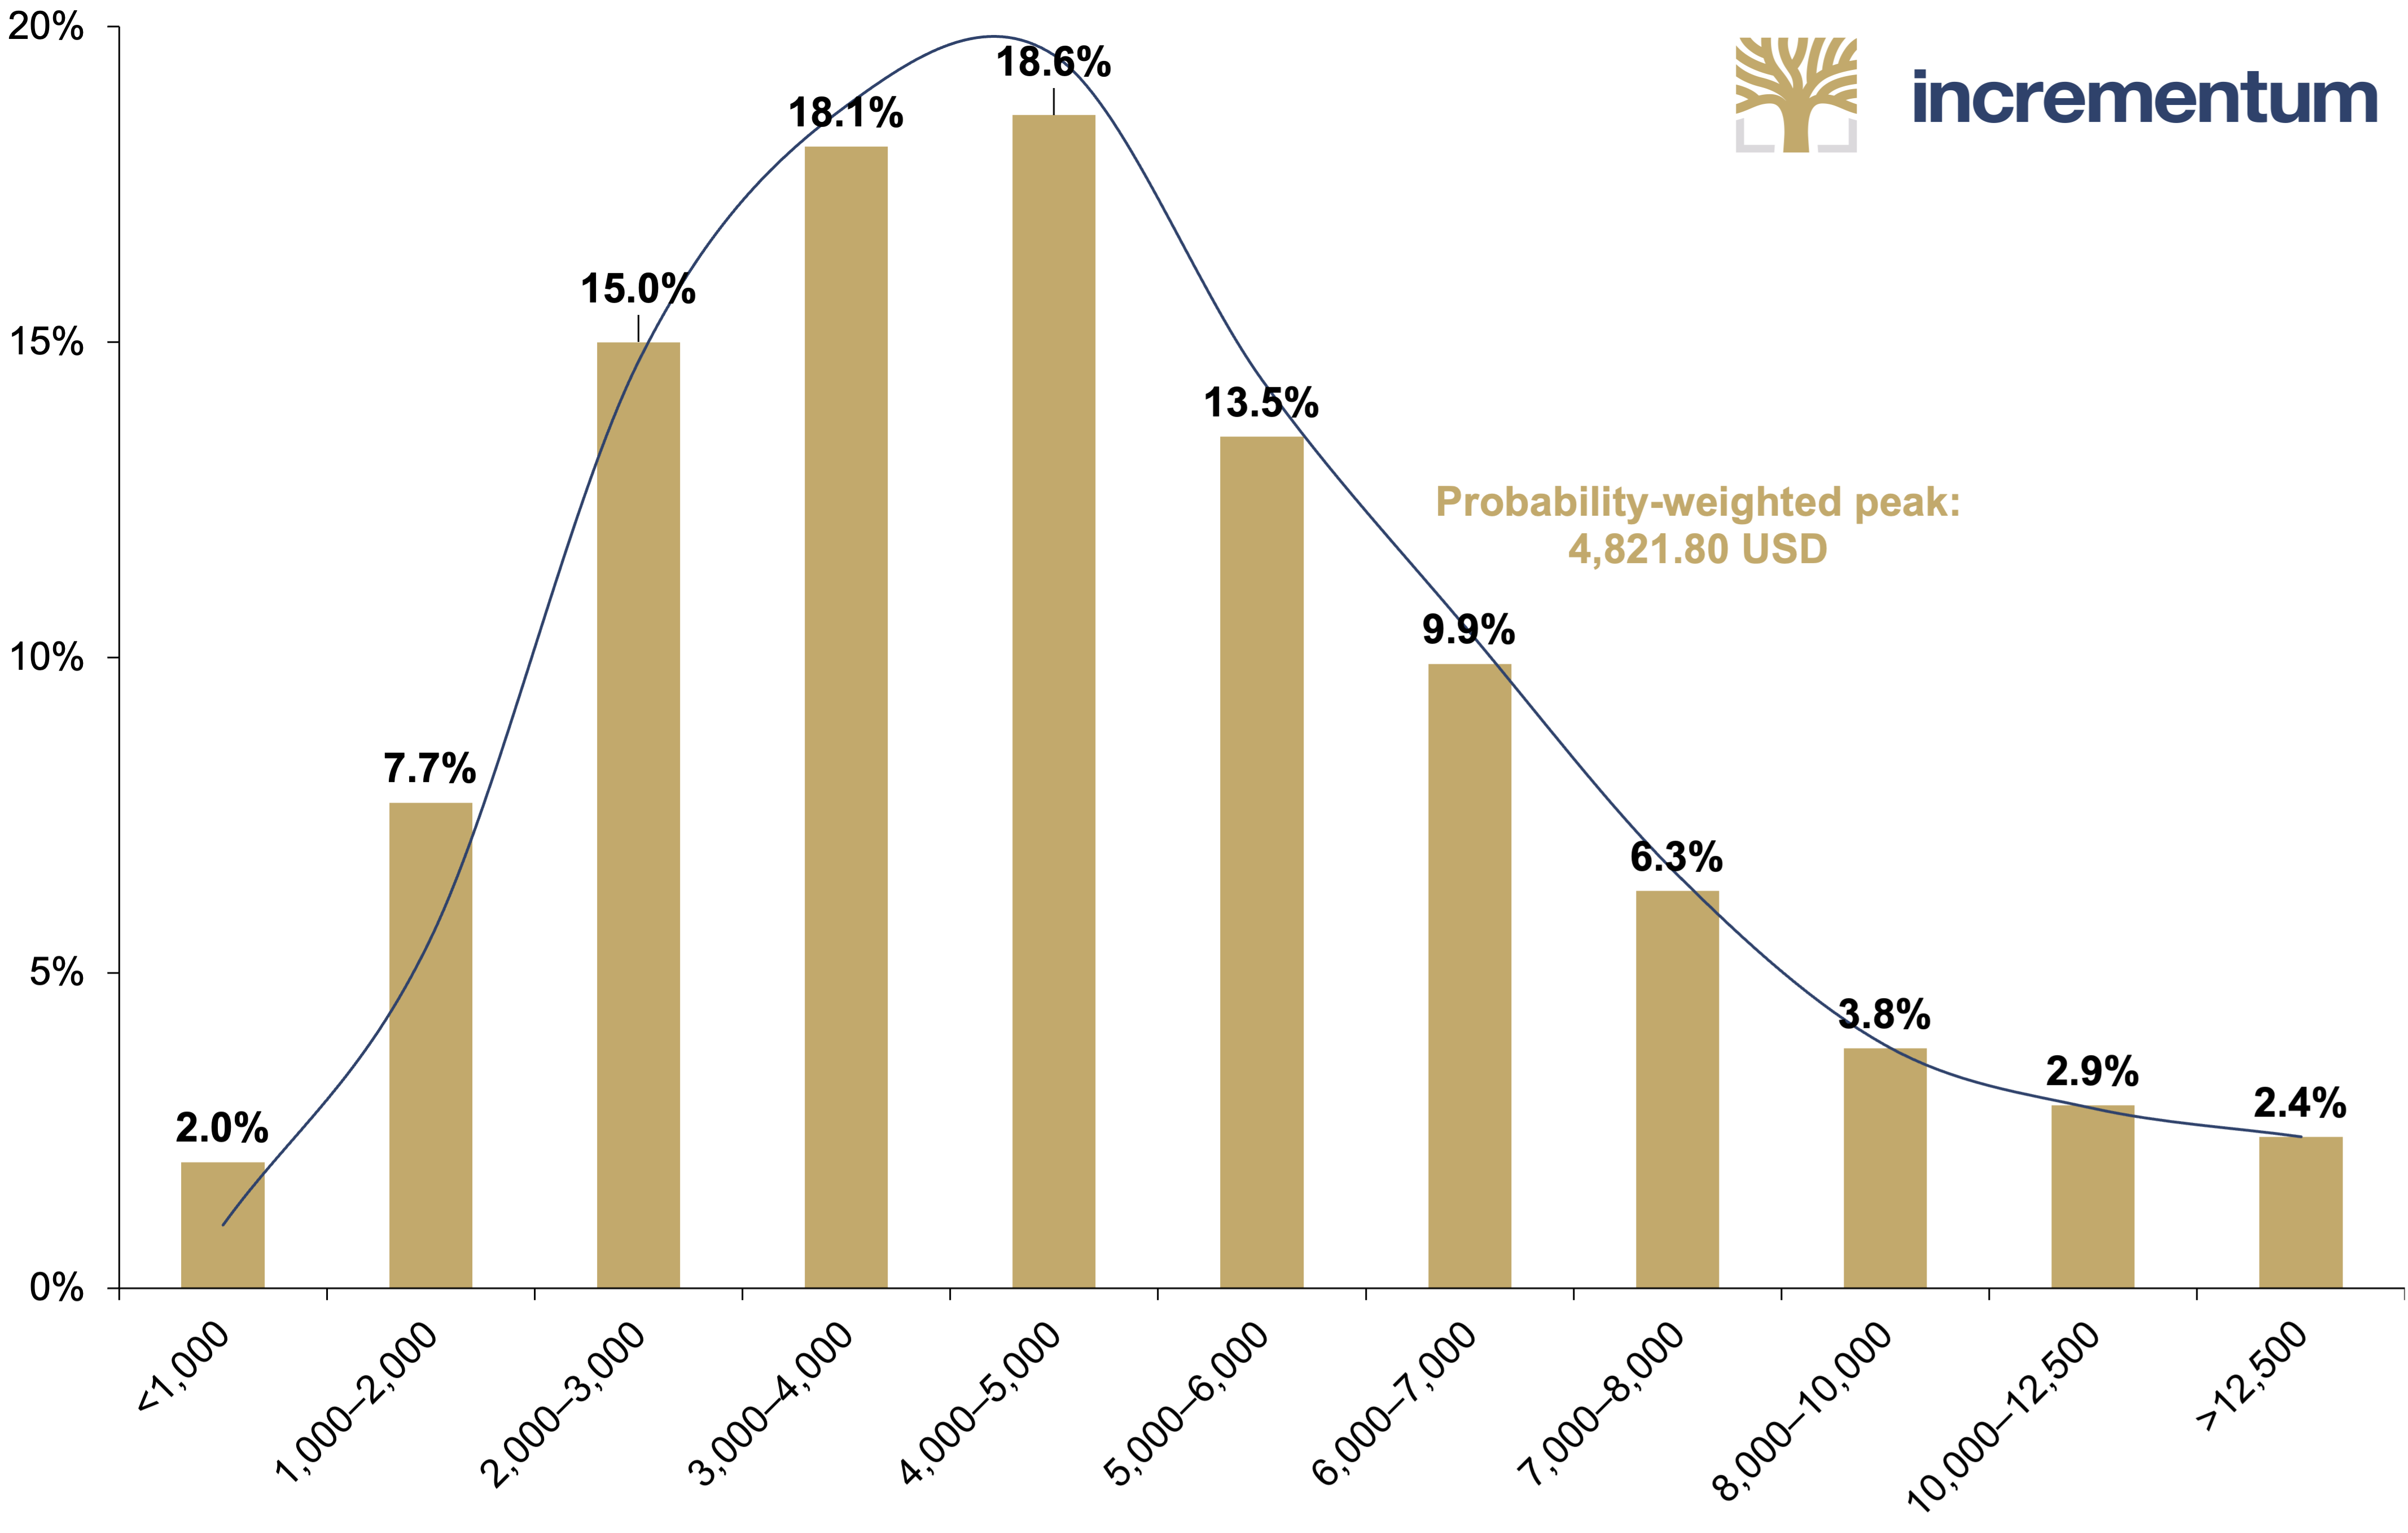
Source: Incrementum AG
What many dismissed as utopian, irrational, or even esoteric at the beginning of the decade now seems far more tangible. The number of bullish gold forecasts is growing: Yardeni Research expects a gold price of USD 4,000 by the end of 2025 and even USD 5,000 by the end of 2026, assuming that central banks continue to buy gold at a comparable pace. Goldman Sachs has revised its year-end 2025 gold price target again, recently raising it from USD 3,300 to USD 3,700. For a possible tail-risk scenario, Goldman Sachs now names a price target of USD 4,250 by the end of the year.
As of April 30, the gold price was already trading above the calculated interim target of USD 2,942, which we have defined for the end of 2025 on the path to our decade price target of USD 4,800. The annualized growth rate required for this is 7% – a figure that can be considered quite realistic under the current macroeconomic conditions.
Intermediate Status of the Gold Price Procejtion until 2030: Gold, in USD, 01/1970–12/2030
Source: LSEG, Incrementum AG
As the gold price has recently gained substantial momentum, it seems sensible to consider the path that would result in a scenario like the inflationary or stagflationary environment of the 1970s, i.e., a potential tail-risk scenario with intense upward pressure. In this case, the gold price would rise to around USD 8,900 by the decade’s end, corresponding to an annualized growth rate of around 19%. In this scenario, the corresponding interim target for the end of 2025 is USD 4,080.
Conclusion
A comparison of the three major gold bull markets confirms that while history does not repeat itself, it does rhyme. Despite differences in the bull markets, the structural similarities of the underlying conditions outweigh the differences. In the past two decades analyzed, gold proved to be a safe haven during inflation, economic turmoil, and confidence crises and achieved enormous gains in value during these “golden decades”. Many of the ingredients present at the time, from negative real interest rates to excessive monetary expansion and geopolitical tensions, are present again in the 2020s.
Macroeconomic Comparison: 1970s vs. 2000s vs. 2020s
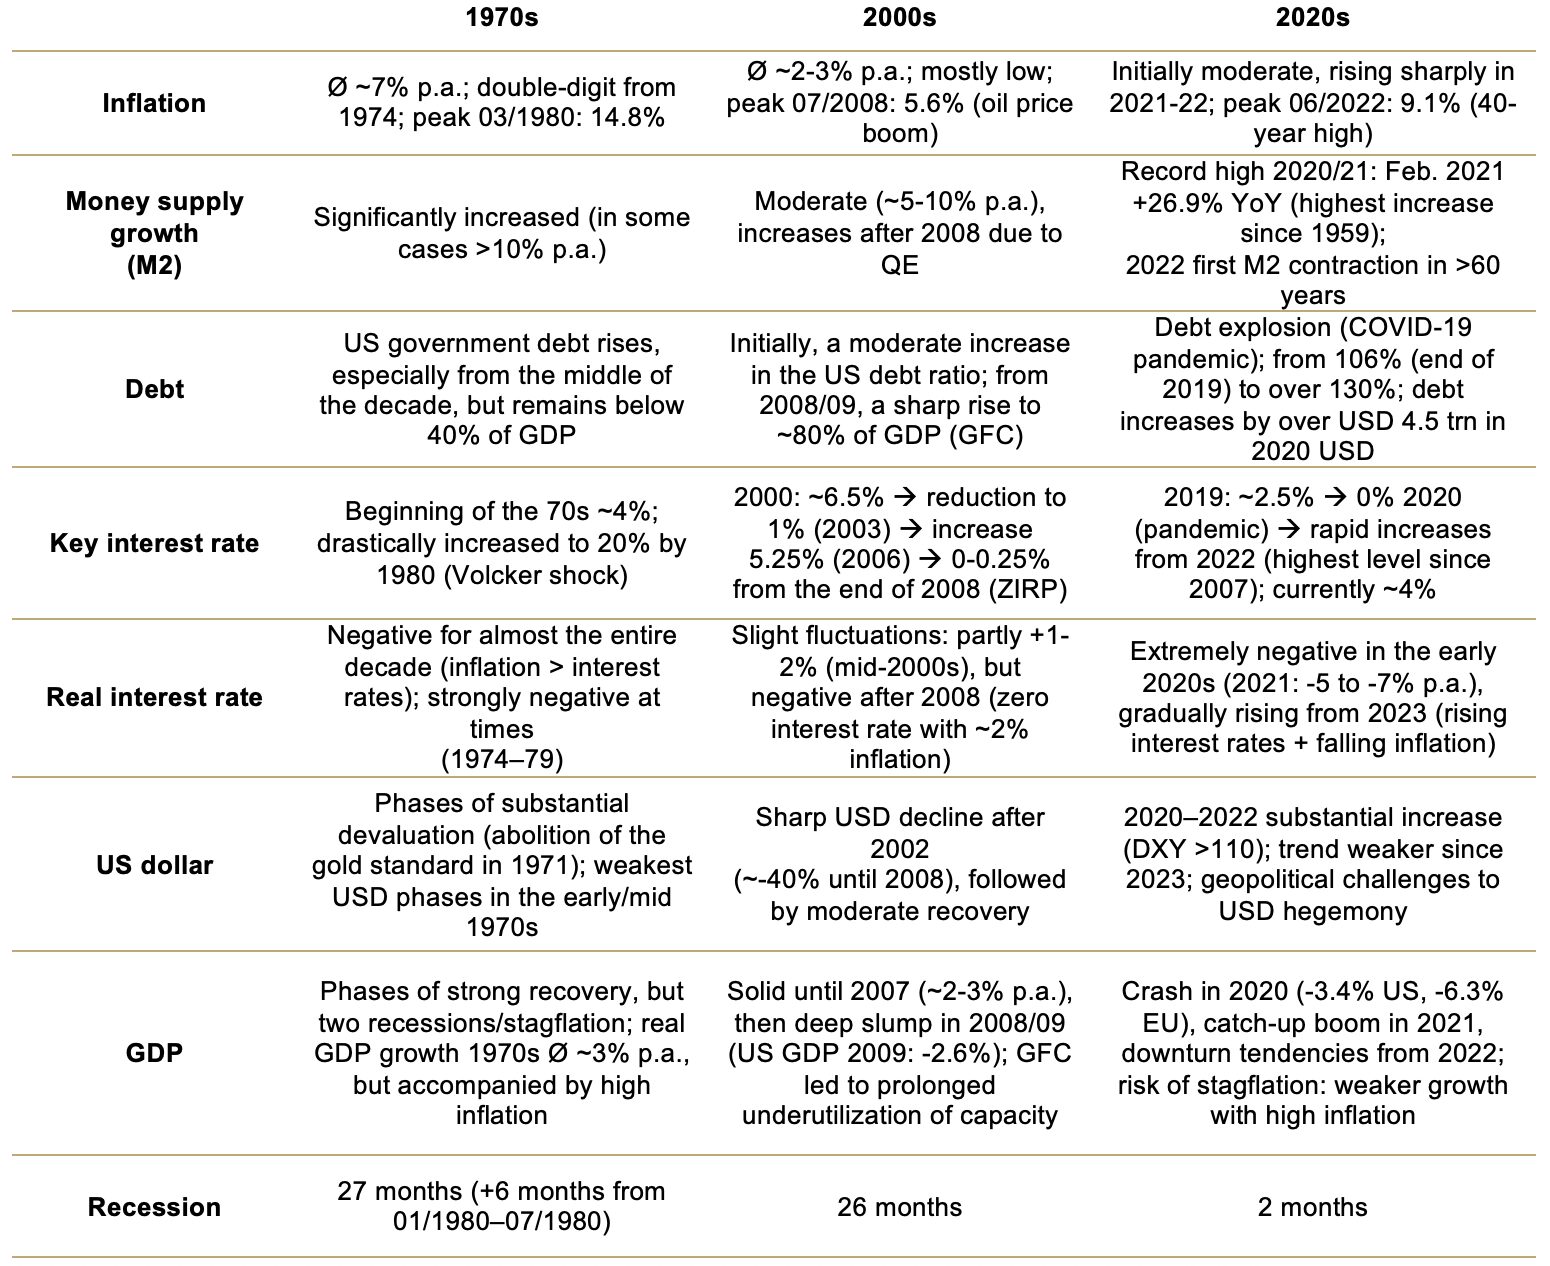
Source: LSEG, Incrementum AG
Developments to date support the theory that we are experiencing déjà vu and that the 2020s could become the third golden decade. Gold has already reached numerous historical highs in all currencies. If the cycle continues in line with previous decades, the second act of the 2020s decade is likely to see a further acceleration of the upward trend, which could culminate in a peak around the end of the decade. Past bull markets have always ended in overshoots within around 9 months, with a doubling of prices.
The following table provides an insightful comparison of the average annual performance (CAGR, annualized return) of gold, silver, mining stocks and commodities over the decades of the 1970s, 2000s and 2020s, divided into first and second halves and for the period. Even though the data for the second half of the 2020s decade is naturally still incomplete, some interesting patterns can already be identified.
CAGR of Gold, Silver, Mining Stocks*, and Commodities**, in Bull Market Decades, in USD, 12/1969–04/2025
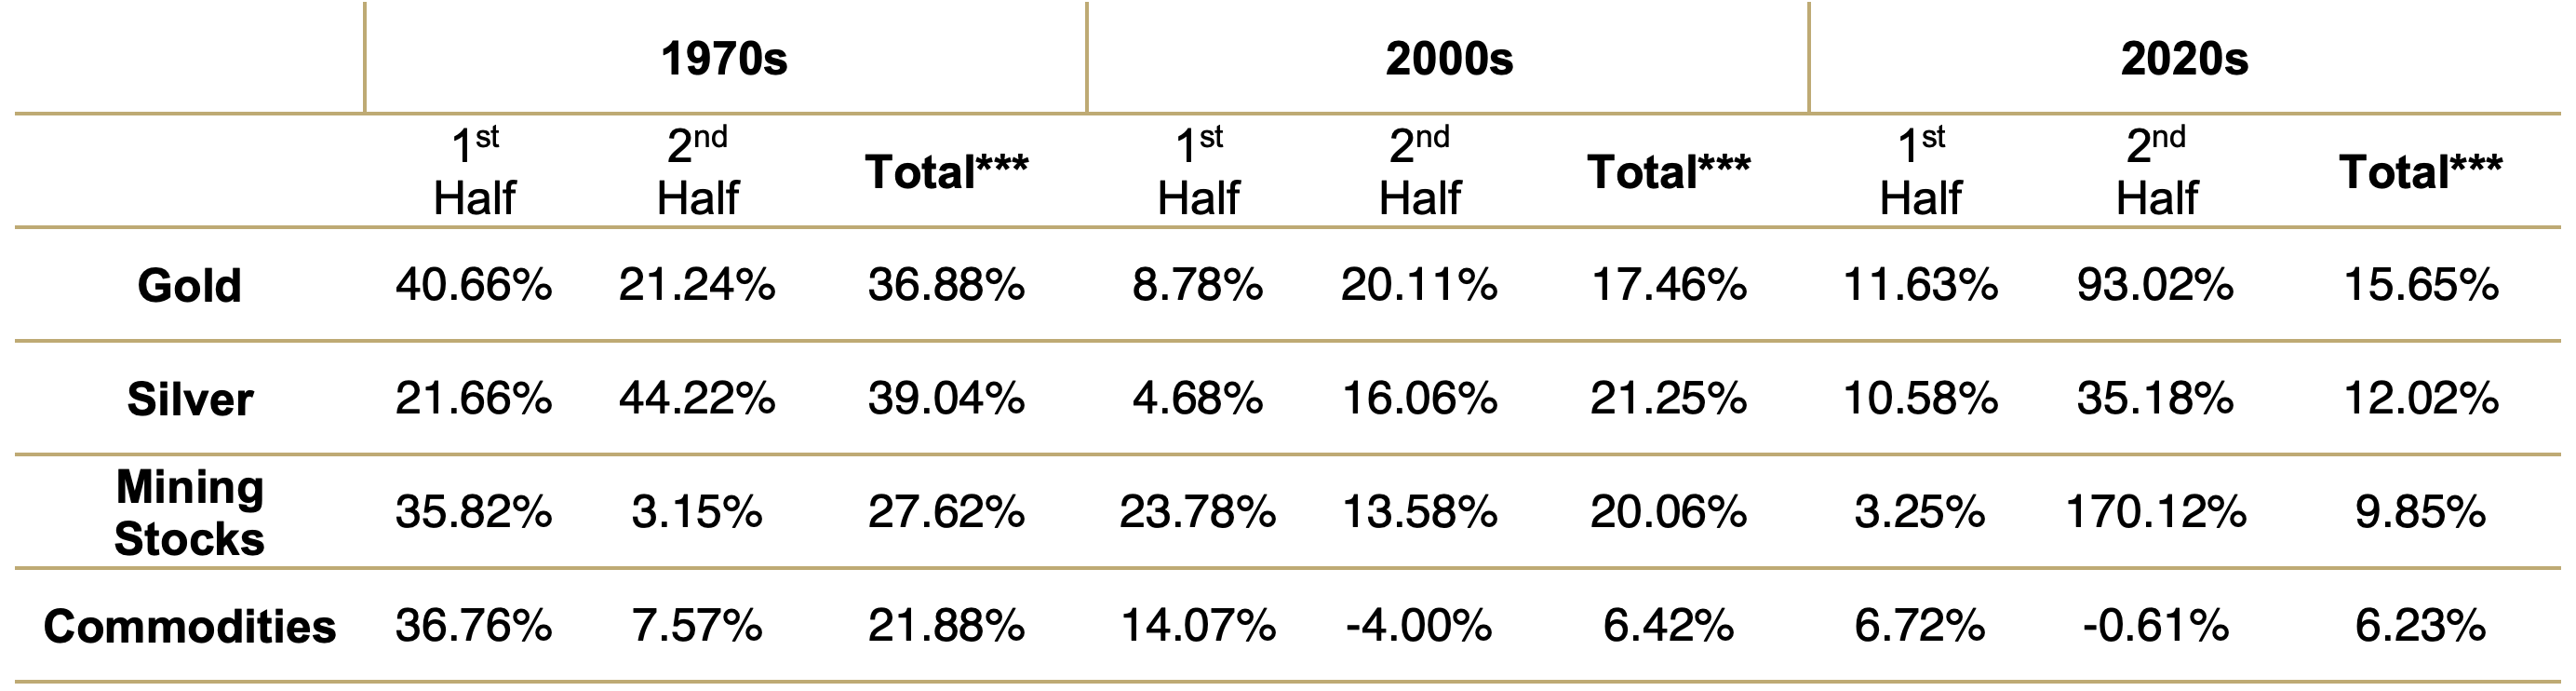
Source: LSEG (as of 04/30/2025), Incrementum AG
*BGMI 12/1969–05/1996, HUI 05/1996–. **GSCI Index TR. ***Start of decade until high.
Gold has been the most stable performer over all three decades. In the 1970s, it achieved an annual increase of more than 40% in the first half and still more than 21% in the second half. The pattern reversed slightly in the 2000s. At +20% p.a., the second half was much more dynamic than the first, at just under 9% p.a. The CAGR development to date in the 2020s is particularly striking: After an annualized return of just under 12% in the first half of the decade, gold has so far achieved an average annual performance of 93% p.a. in the second half. On the one hand, this extraordinary momentum is due to the still-short observation period, which is statistically more susceptible to outliers. On the other hand, it is a clear sign of cyclical momentum. Even if it cannot be assumed that gold will maintain its current pace over the entire further course, the development impressively underlines the intact upward momentum and the growing interest in the precious metal in an increasingly fragile macroeconomic environment.
Silver traditionally presents itself as a cyclical laggard with a tendency towards explosive late phases. In the 1970s, the second half was significantly stronger at over 44% p.a. than the first half at +21% p.a. A similar pattern emerged in the 2000s. A strong trend has also been observed in the current decade, but the historical parallels indicate that the dynamic part of the cycle may only be just beginning.
Gold mining shares are regarded as a more volatile leverage variant of the gold price, with sometimes spectacular swings. In the 1970s, gold mining shares achieved over 35% p.a. in the first half of the decade before losing much of their momentum in the second half. In the 2000s, the first half was much stronger than the second at just under 24% p.a. The 2020s appear to be breaking this pattern for the time being: After a disappointing first half with just 3.25% p.a., the mining sector is currently recording a veritable comeback with an annualized gain of over 170% in the first months of the second half of the decade, which is a strong signal for a revaluation.
Finally, commodities show a strongly cyclical picture. In the 1970s, they excelled in the first half with over 36% p.a., driven by oil price shocks and inflationary pressure. In the 2000s, performance was weaker overall, with the second half even turning negative due to the 2007/08 global financial crisis and bringing the commodity supercycle to an abrupt end. In the 2020s, the first half has been somewhat subdued so far. The second half began with a slight setback, posting an annualized return of –0.61%, triggered by the Trump shock.
The historical analysis of past bull markets shows that gold, silver, mining stocks, and commodities are resilient in fragile macroeconomic and geopolitical phases. Based on this insight, we presented our new 60/40 portfolio as an up-to-date, more robustly structured alternative to the traditional model in last year’s In Gold We Trust report, “The New Gold Playbook”. The aim was to take account of the changed framework conditions and outline a contemporary allocation strategy.
In contrast to the traditional allocation of 60% equities and 40% bonds, the new model deliberately considers the changed landscape and expands the allocation framework to include liquid, alternative assets that cannot be inflated at will: 45% equities, 15% bonds, 15% safe-haven gold, 10% performance gold, i.e. silver and mining stocks, 10% commodities, and 5% Bitcoin.
How this reallocation has proven itself in practice since the publication of last year’s In Gold We Trust report is illustrated by a look at the performance over the past twelve months compared to the classic 60/40 portfolio.
New 60/40 Portfolio*, and Old 60/40 Portfolio**, in USD, 100 = 05/17/2025, 05/2024–04/2025
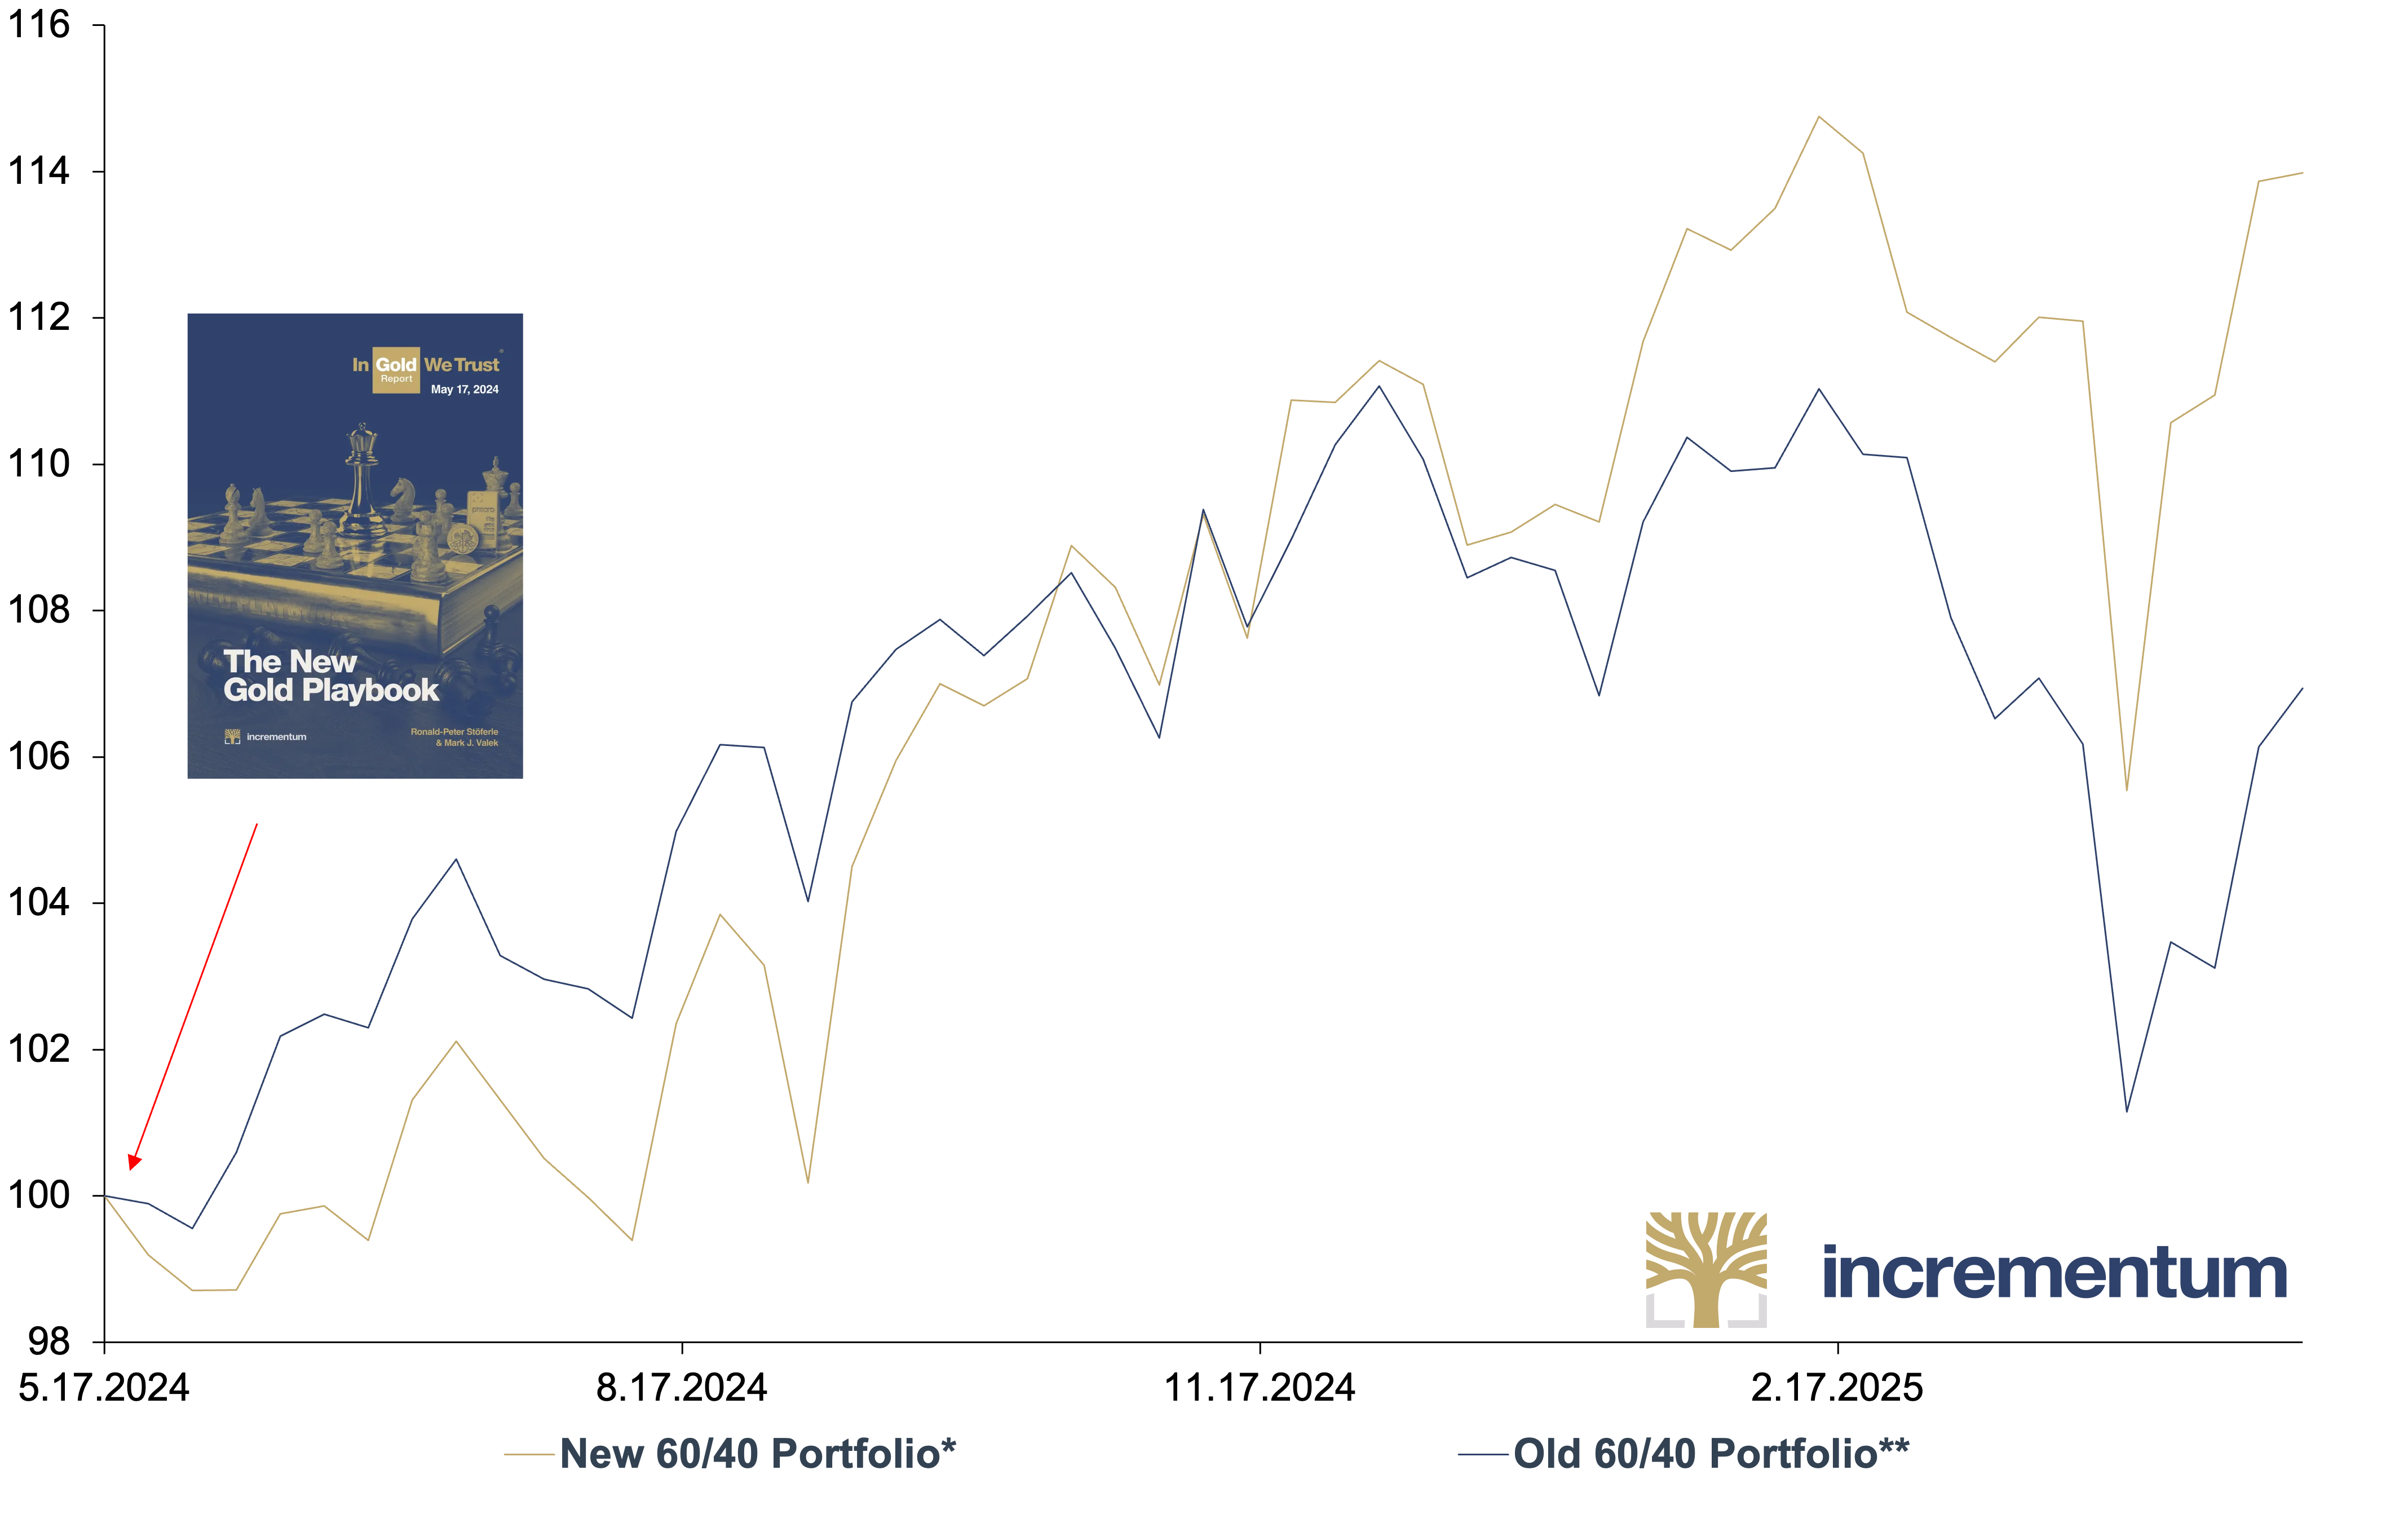
Source: LSEG, Incrementum AG
*45% S&P 500 TR, 15% US 10Y TR, 15% Gold, 5% Silver, 5% HUI Index TR, 10% BCOM TR, 5% Bitcoin
**60% S&P 500 TR, 40% US 10Y TR
A comparison of the two portfolios over the period from May 2024 to April 2025 clearly shows that the new 60/40 portfolio significantly outperformed its traditional counterpart over long periods. After an initially subdued start, the performance of the new 60/40 portfolio picked up noticeably, continuously outperforming the traditional 60/40 portfolio. While the conventional 60/40 portfolio came under increasing pressure as the year progressed, the new model remained much more stable and resilient, particularly during the volatile market phases of the current year.
The performance advantage over the period under review underpins the thesis that a modern portfolio architecture based on sound money components and inflation-resistant assets is superior to the traditional model, both in terms of stability and return potential. While gold has already reached new all-time highs, silver and mining stocks are still in the slipstream. However, experience shows that they catch up in the late phase of the cycle, which brings additional catch-up potential for performance gold.
Against this backdrop, the new 60/40 portfolio presented last year not only remains relevant but also proves to be a strategically well-thought-out response to the requirements of an increasingly complex market environment. It combines sound–money principles and reflects the insight that runs through all bull markets: The historical pattern suggests that the first half builds, the second escalates, and the curtain finally falls amid applause.