The Showdown in Monetary Policy
„In 2023, we will see whether a financial ecosystem sanitized by a decade of cheap money, and a deepseated belief in the Fed put, is prepared for that moment when the US economy has gone into recession but the monetary cavalry is still some distance away.“
Jamie Dannhauser
- The longer we wait for the recession to arrive, the worse it could become. Many central banks are faced with the dilemma of price stability vs. economic stability.
- In fact, the Federal Reserve faces a trilemma in the face of the turmoil, as it must now also actively ensure financial market stability.
- The most-anticipated recession continues to be a long time coming, as the fiscal stimulus from Covid times lingers. The recession will inevitably become a political issue, in view of the upcoming US elections in 2024.
- Many reliable indicators – the yield curve, ISM, LEI, money supply development – point to an imminent recession.
- The Federal Reserve’s pivot could catch many stock investors on the wrong foot, as such a turnaround has by no means always led to rising stock prices in the past.
- Our proprietary Incrementum Recession Phase Model confirms the excellent characteristics of gold as a recession hedge and provides information on the performance of different assets in the various phases of a recession.
Showdown: Federal Reserve vs. US Economy
The showdown – a moment when everything is at stake. A confrontation that decides everything. This is how one could describe the situation in which the global economy currently finds itself. It is becoming clear that the economic boom caused by the reopening after the pandemic is gradually fading. Signs of recession are growing, warnings are getting louder, and uncertainty on the markets is rising.
2021 and 2022 saw a veritable euphoria of growth, especially in the developed economies. However, the record growth figures were almost exclusively due to the fact that measures enacted to prevent the spread of the coronavirus were initially weakened, then later partially and finally completely lifted. Now that these growth-driving extraordinary measures are fading, the question arises, what will happen now?
Even though we often read about the most anticipated recession ever, the analyst consensus actually speaks a different language. The majority of analysts and market participants currently believe that there will only be a slowdown in growth, or at most a soft landing, i.e. a mild recession.
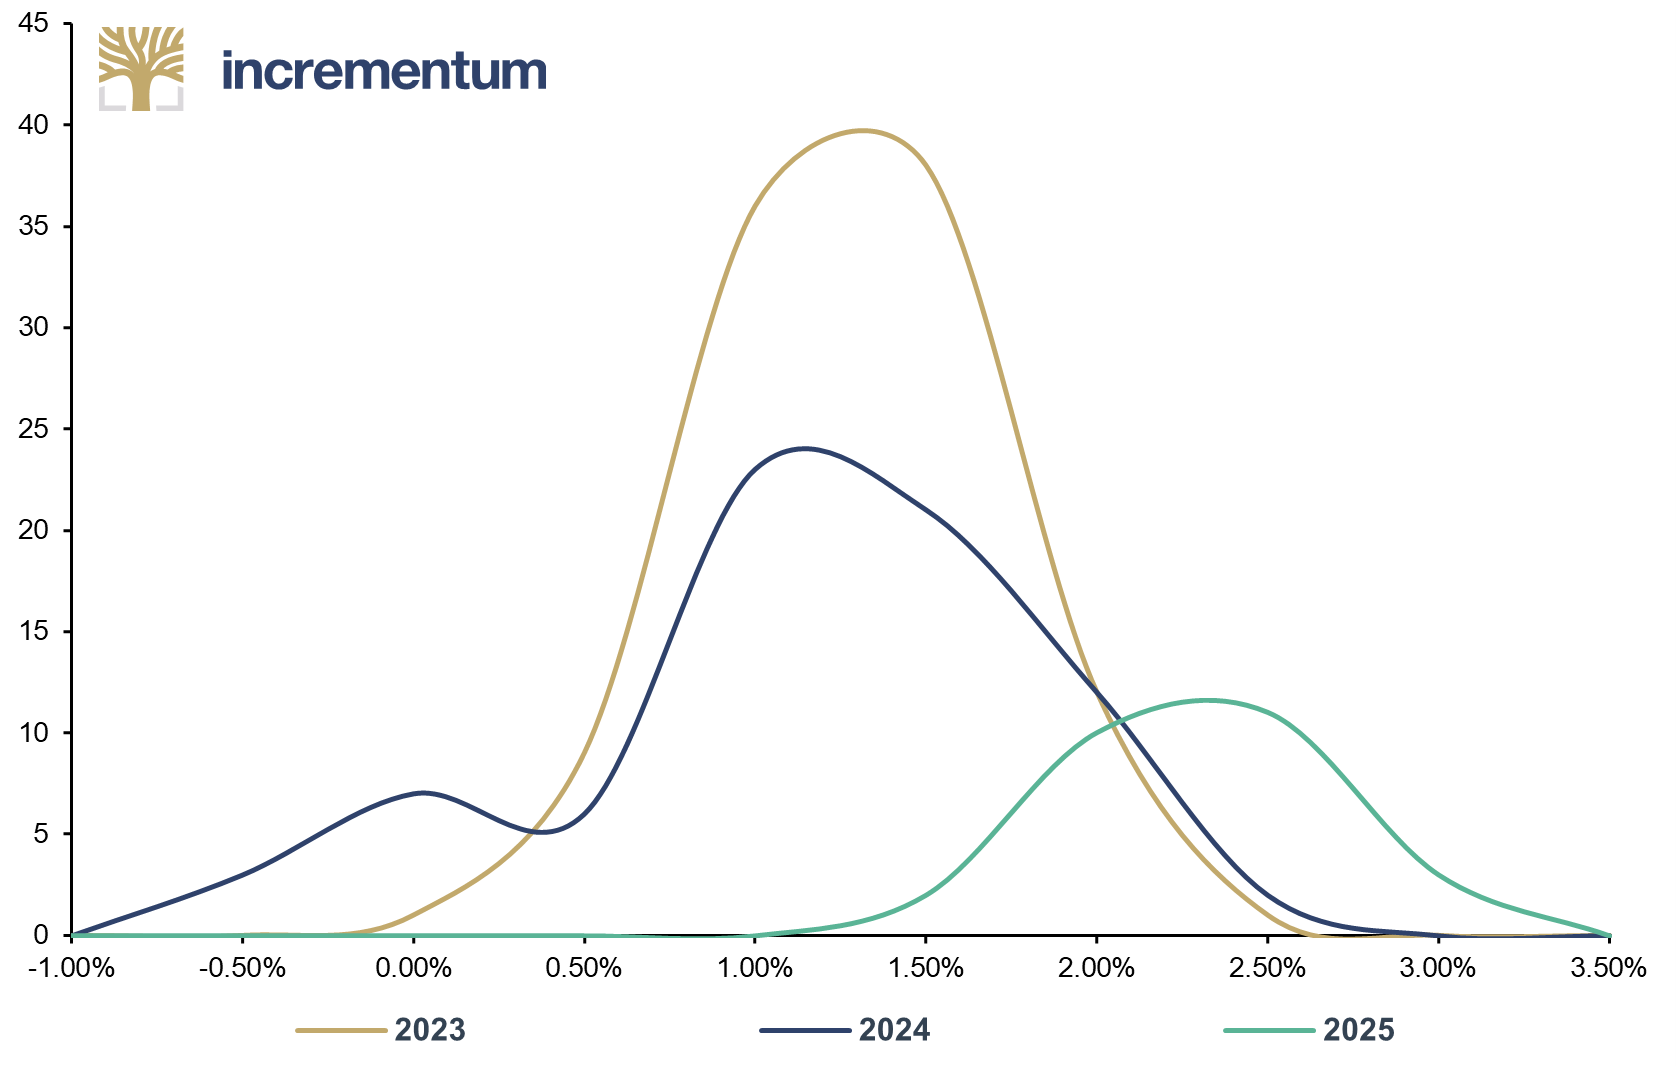
US GDP Polls, Annual GDP Growth (x-axis), and Number of Analysts (y-axis), 04/2023
Source: Reuters Eikon, Incrementum AG
Based on April surveys, both the median and the average of analysts’ estimates of annual US GDP growth for 2023 and 2024 lie between 0.8% and 1.1%. However, the forecasts for the coming quarters are likely to be significantly lower. Overall, only 4 out of 100 analyst firms believe the US economy will contract in 2023, compared with13 out of 93 for 2024. None of the analysts surveyed expects a severe recession – despite extreme monetary tightening.
This is where the central banks come into play as decisive actors. Especially since the Global Financial Crisis of 2007/08, central banks have taken on enormous responsibility – and so far, have not been able to live up to it. After all, acting responsibly also means facing up to reality, not trying to suppress it with ever new waves of liquidity.
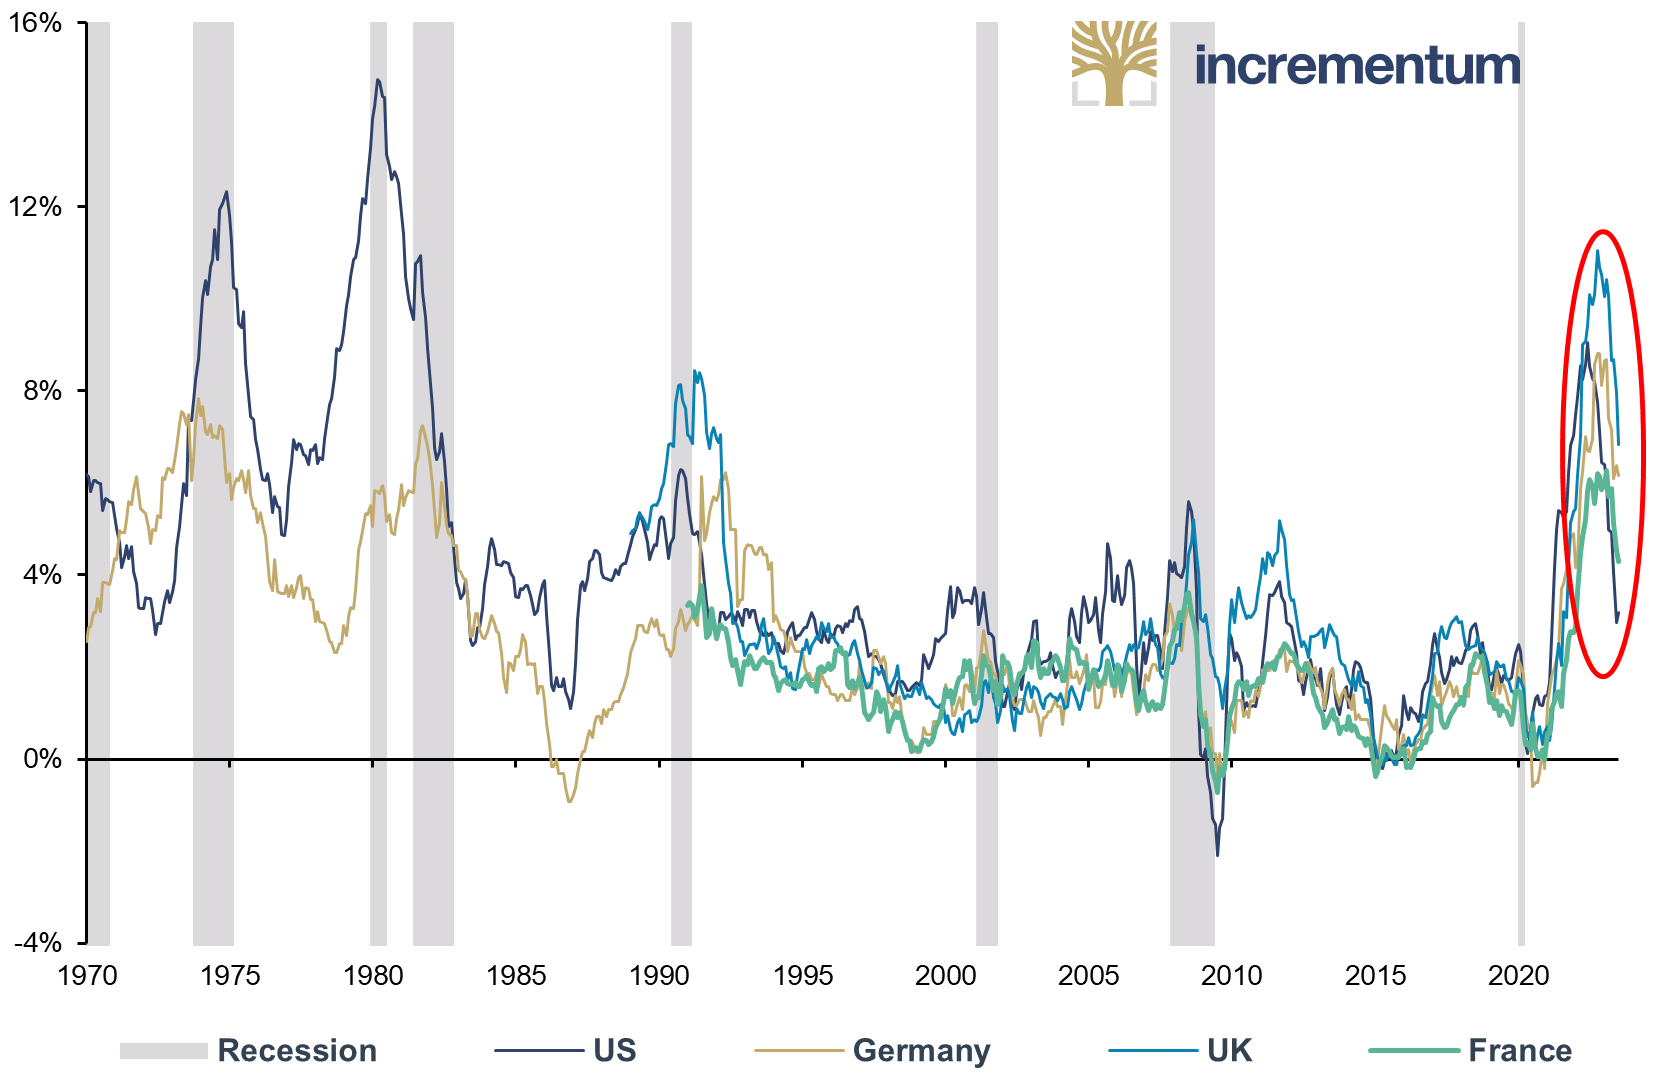
Therefore, the repeated efforts of central banks, this time with active support from fiscal policy, to stimulate an even slightly weakening economy was bound to end up in a strong wave of inflation, the likes of which we have not seen in large parts of this world for over 40 years.
CPI, yoy, USA, Germany, UK, France, 01/1970-04/2023
Source: Reuters Eikon, Incrementum AG
So far, central banks have always lagged in setting the course. This is not surprising, especially if central bankers, as they tirelessly emphasize, want to make decisions based on data. After all, the data is always yesterday’s data, never today’s data, and certainly not tomorrow’s data.
A Small Silver Lining on the Growth Horizon
Last year, on the cover of the In Gold We Trust report “Stagflation 2.0” we positioned a creeping economic bear along with an inflation wolf in the background. We are convinced that the bear is now dangerously close and that the year 2023 could be mauled by a recession.
To begin, however, we would like to present arguments against a recession in the US. Although our starting hypothesis is that the US will slide into recession somewhen in the second half of the year, there are, as always, several factors which justify a more optimistic assessment and which could, contrary to expectations, prevent a recession.
One argument against a recession, much less a hard landing, is the GDP deflator. A severe recession in times of high inflation is improbable because the GDP deflator tends to „gloss over“ the growth figures and sometimes make them look better than they actually are. This is the case when the GDP deflator does not fully capture price changes or when inflation is underestimated.
The stimulating effect of high budget deficits is another factor supporting growth. Fiscal stimulus has so far counteracted the withdrawal of liquidity. One source of stimulus is the promotion of the expansion of renewable energies, another is the generous transfers to the private sector during the Covid19 pandemic and subsequently to cushion the inflation and energy-cost crisis. The numerous US stimulus programs to alleviate the Covid-19-related economic slowdown alone amount to just over USD 5trn, or 25% of GDP. These transfers have enabled households to build up record levels of savings.
Although these excess savings have been consistently reduced again since the withdrawal of the Covid-19 measures from initially USD 2.1bn to now still USD 0.5bn, they are still above average and are currently supporting consumption. This means that robust consumer demand from private households can be expected to continue in the coming quarters, even though the savings rate in the US is now rising again. Some households already appear to be accumulating additional savings to have financial reserves in the event of recession-related layoffs.
US Personal Savings, yoy, 01/1960-03/2023

Source: Federal Reserve St. Louis, Incrementum AG
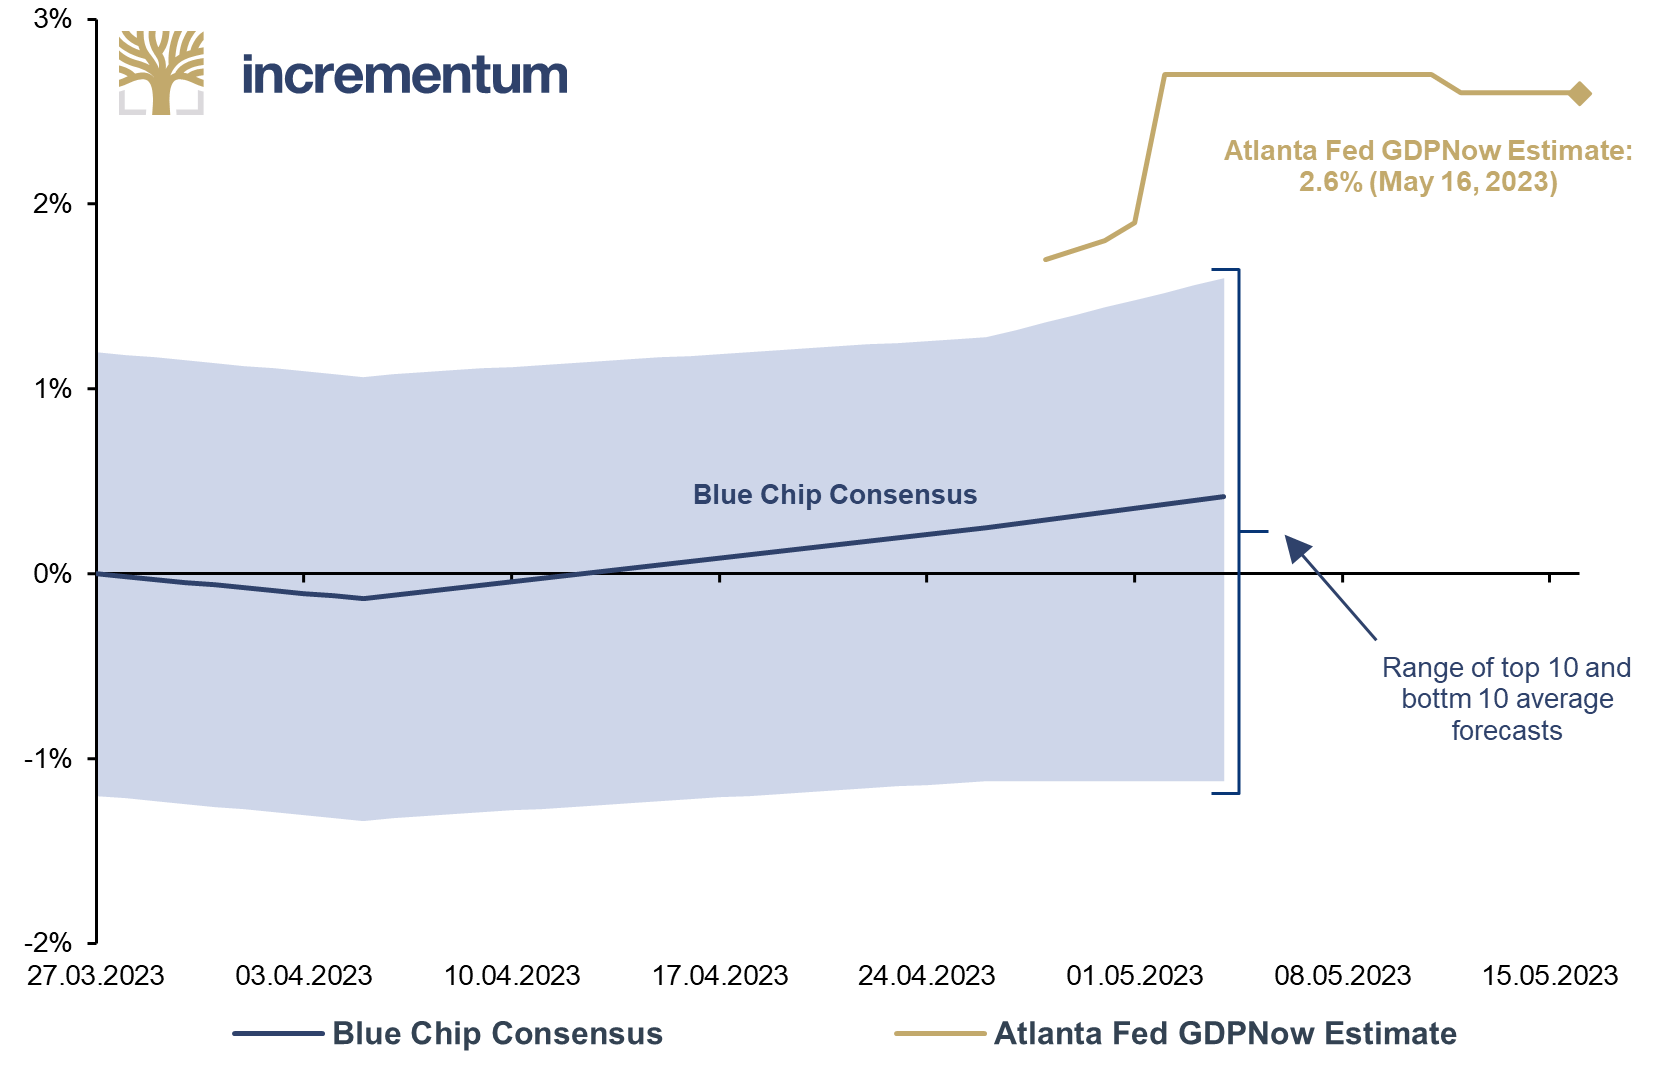
In addition, the latest GDP Now estimates of the Federal Reserve Bank of Atlanta for the current Q2/2023 show solid real growth of 2.6%. However, for us, this is less an indicator that the US economy is on solid ground, but rather that the recession we are expecting will probably not materialize until next quarter or the quarter after.
Atlanta Fed GDPNow Estimate of Real GDP Growth for Q2 2023, qoq, USA, May 16, 2023
Source: Federal Reserve Atlanta, Blue Chip Economic Indicators, Blue Chip Financial Forecasts, Incrementum AG
Amidst the backlight of rising stock prices, it remains a challenging task to fathom the shadow of recessionary clouds. Since the mid-October 2022 low, the S&P 500 has surged by approximately 15%, which, at first glance, appears to convey optimism. However, how are companies faring in this demanding economic environment?
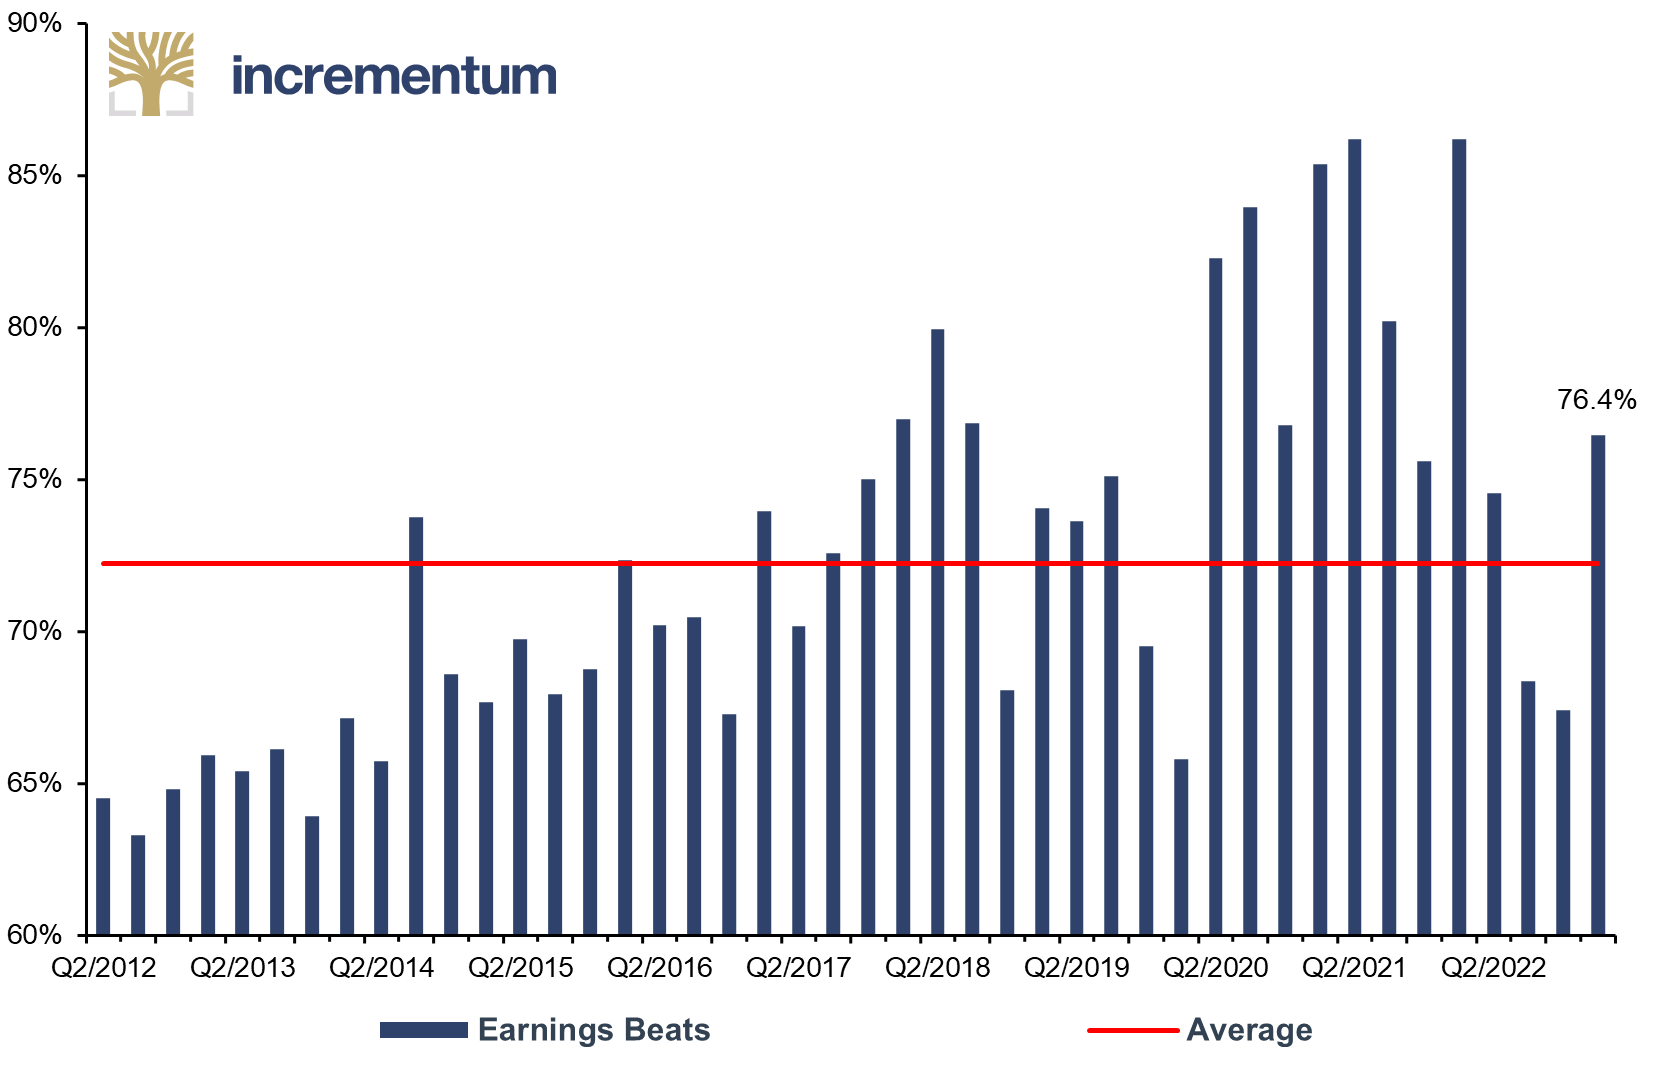
In many cases, the market results have exceeded analysts’ expectations, although these were not overly ambitious, either. So far, 450 of the S&P 500 companies have reported their results for Q1/2023. Of these, 344 companies exceeded expectations, 90 missed them, and 16 hit them. This equates to a percentage earnings beats score of 76.4%, well above the average since Q2/2012 of 72.2%.
Earnings Beats, as % of all S&P 500 Companies, Q2/2012-Q1/2023*
Source: S&P Global, Incrementum AG
+for Q1/2023 89.1% of all S&P 500 companies reported earnings as of 05/09/2023
The Harbingers of Recession
Clearly eclipsing these positive factors are myriad signs of economic weakness, which are thus the focus of the monetary policy showdown: Will the Federal Reserve sacrifice fighting inflation for growth, or sacrifice the economy for price stability?
Inversion in the bond market
The yield curve in the US has been strongly inverted for some time, meaning that yields on short-term bonds are higher than those on longer-term bonds. In the present context, interest rate inversions serve as an extremely reliable recession indicator. In many cases, however, the recession occurred only after the yield curve began to normalize again. The inversion is currently as strong as it was last during the severe recessions in 1973–75 and the double-dip recession in the early 1980s. As a result, the bond markets are clearly bucking the sentiment on the equity markets. Thus, we are also facing an equity market vs. bond markets showdown. Historically, bond markets have been better forecasters.
US 10Y-3M Spread, 01/1970-05/2023
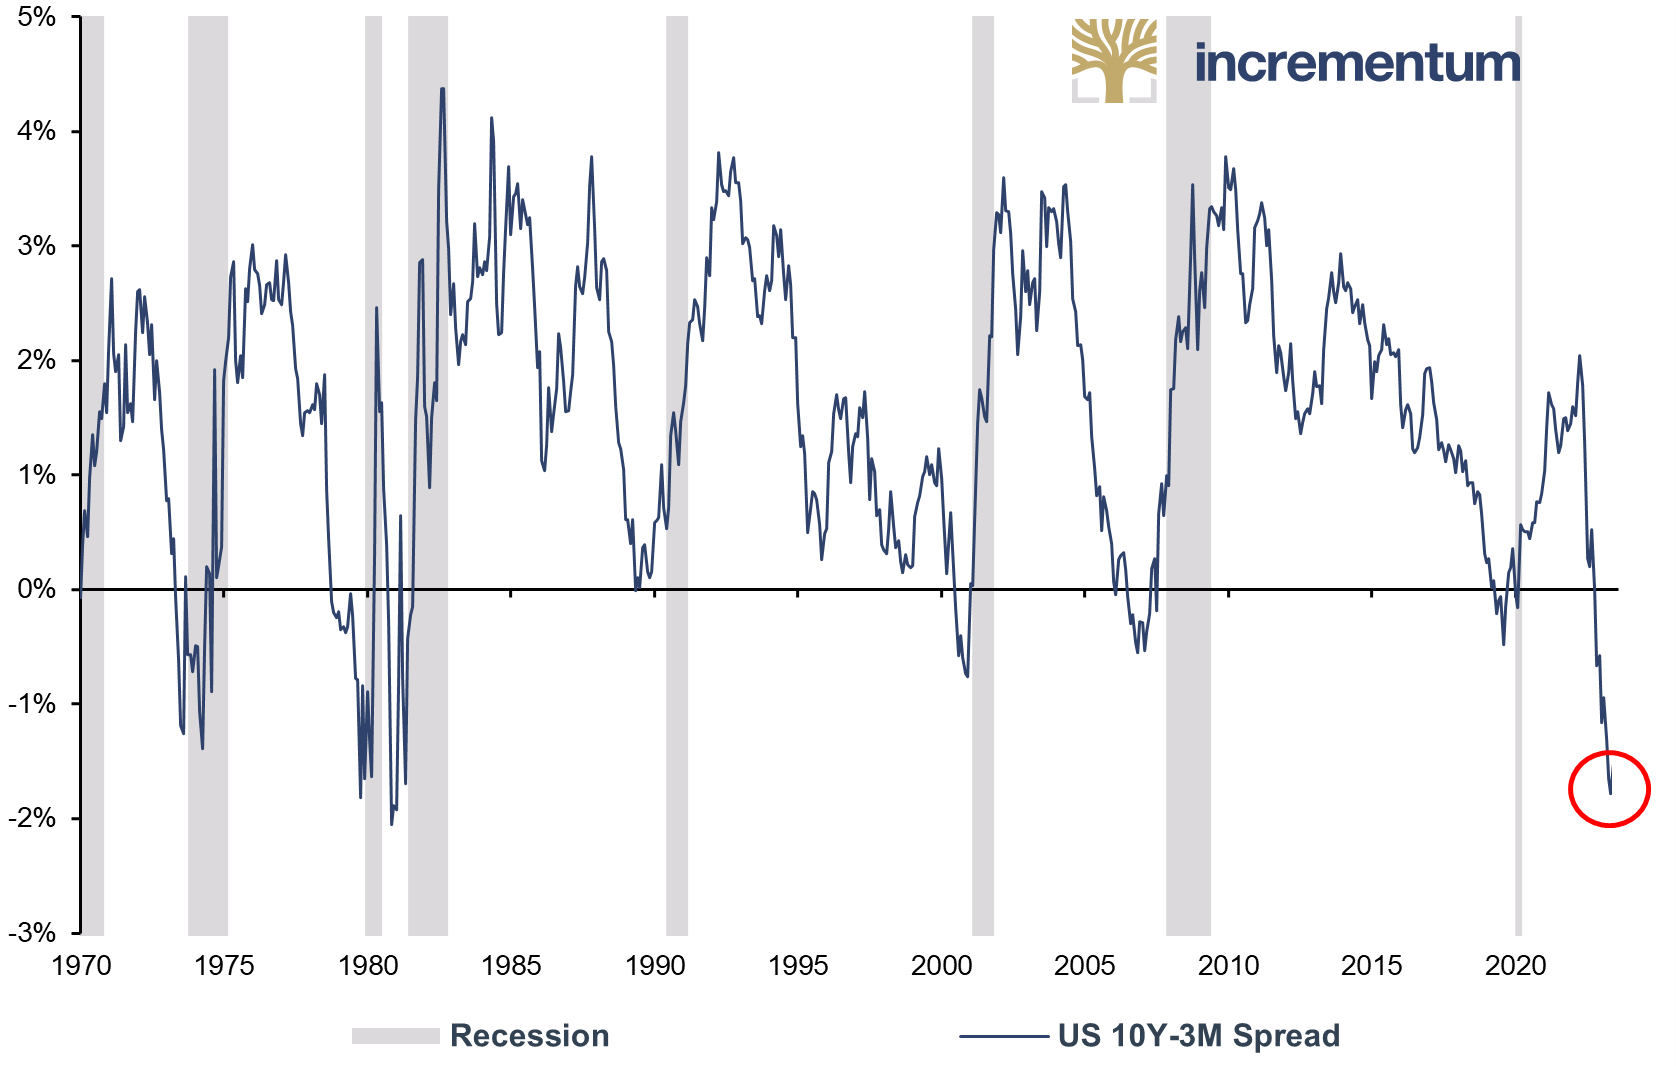
Source: Reuters Eikon, Incrementum AG
The spread between 10-year and 3-month bonds usually peaks just before the first rate cut by the Federal Reserve. If one believes the implied fed funds rates, the Federal Reserve made its last rate hike in May. So, the inversion may still further intensify. However, a strong inversion does not necessarily mean a severe recession, as there is no direct correlation between the strength of the inversion and the severity of the subsequent recession.
The Federal Reserve itself prefers the near-term forward spread, i.e., the difference between the expected 3-month interest rate in 18 months and the current yield on 3-month bonds, as an indicator. This has been inverted for seven months and fell to a new cycle low in May.
Near-Term Forward Spread, 01/1962-05/2023
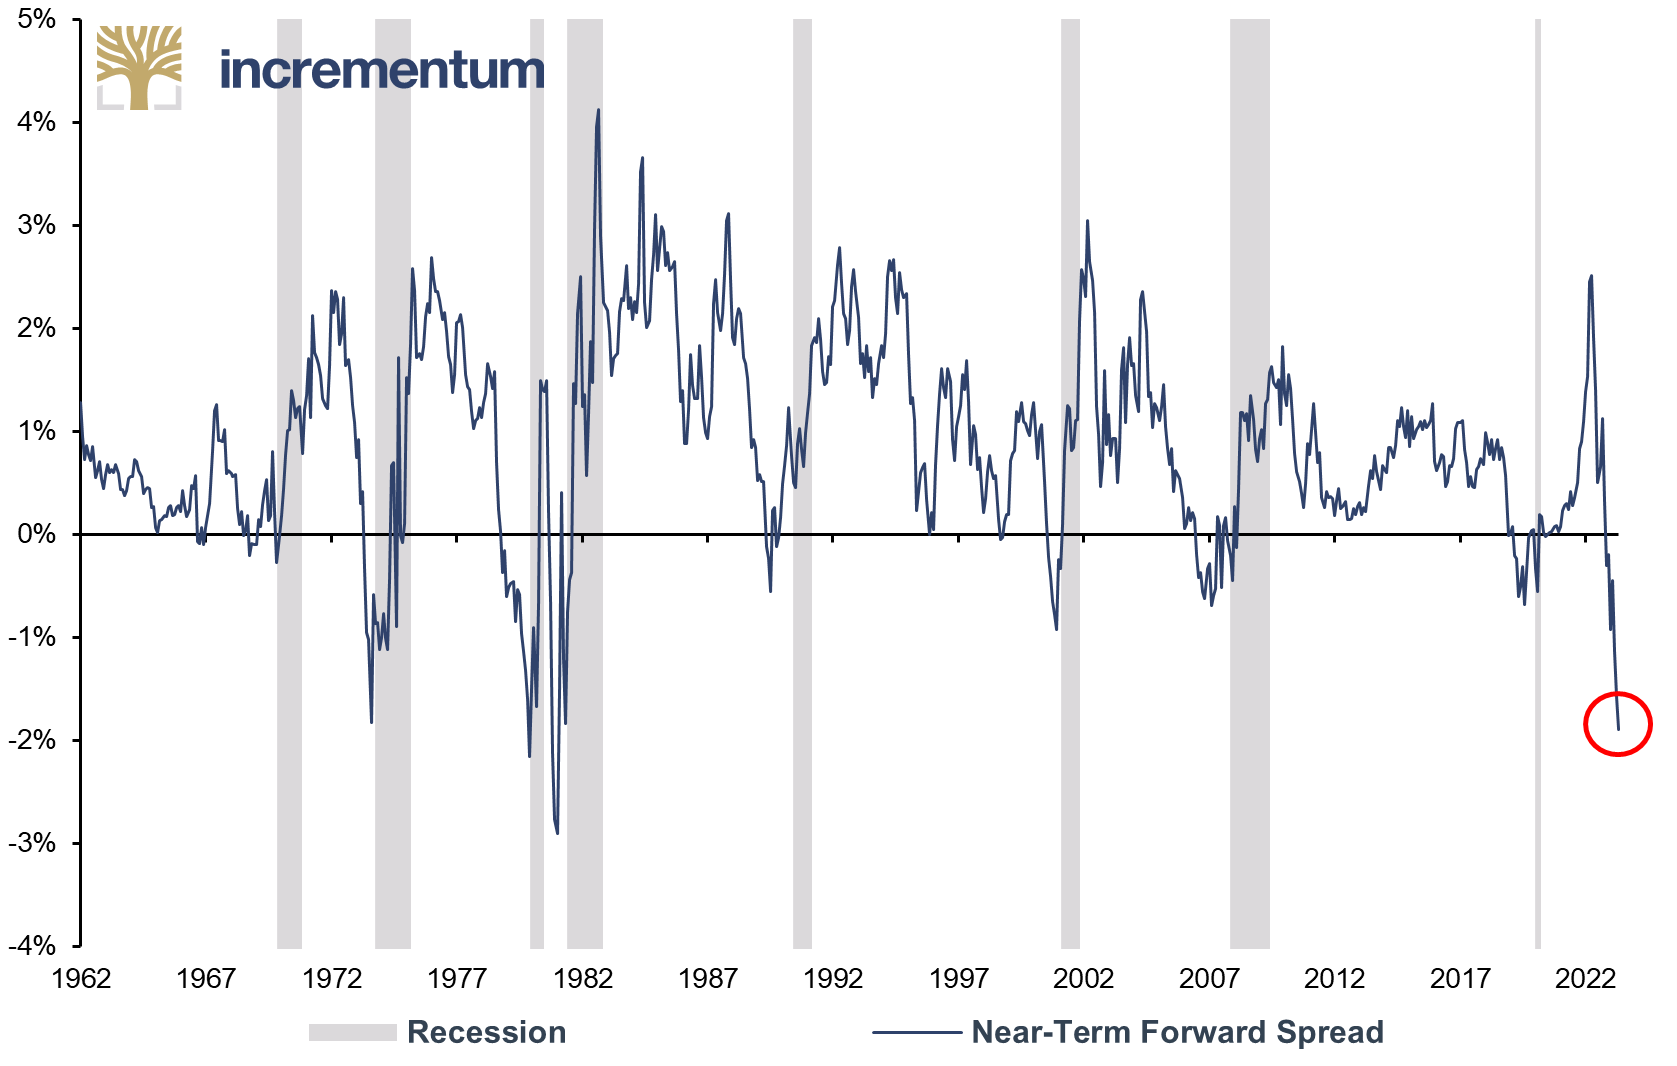
Source: Diercks & Soques, neartermforwardspread.com, Incrementum AG
However, the Federal Reserve seems to have negated this warning sign as well. An inversion of this magnitude has so far always resulted in a recession within the following eight months.
Real economic indicators signal downturn
What will it take for the Federal Reserve to shed its hawkish plumage? In July 2022, the ISM broke through the 50 mark for the first time in this cycle, to a value of 48.6. It currently stands at 45.7, which statistically indicates a recession on the one hand and the Federal Reserve loosening its monetary policy reins on the other. In the recent past, the Federal Reserve has always reacted to a drop in the ISM index below 50 by easing monetary policy.
ISM Manufacturing (New Orders), 01/1960-04/2023
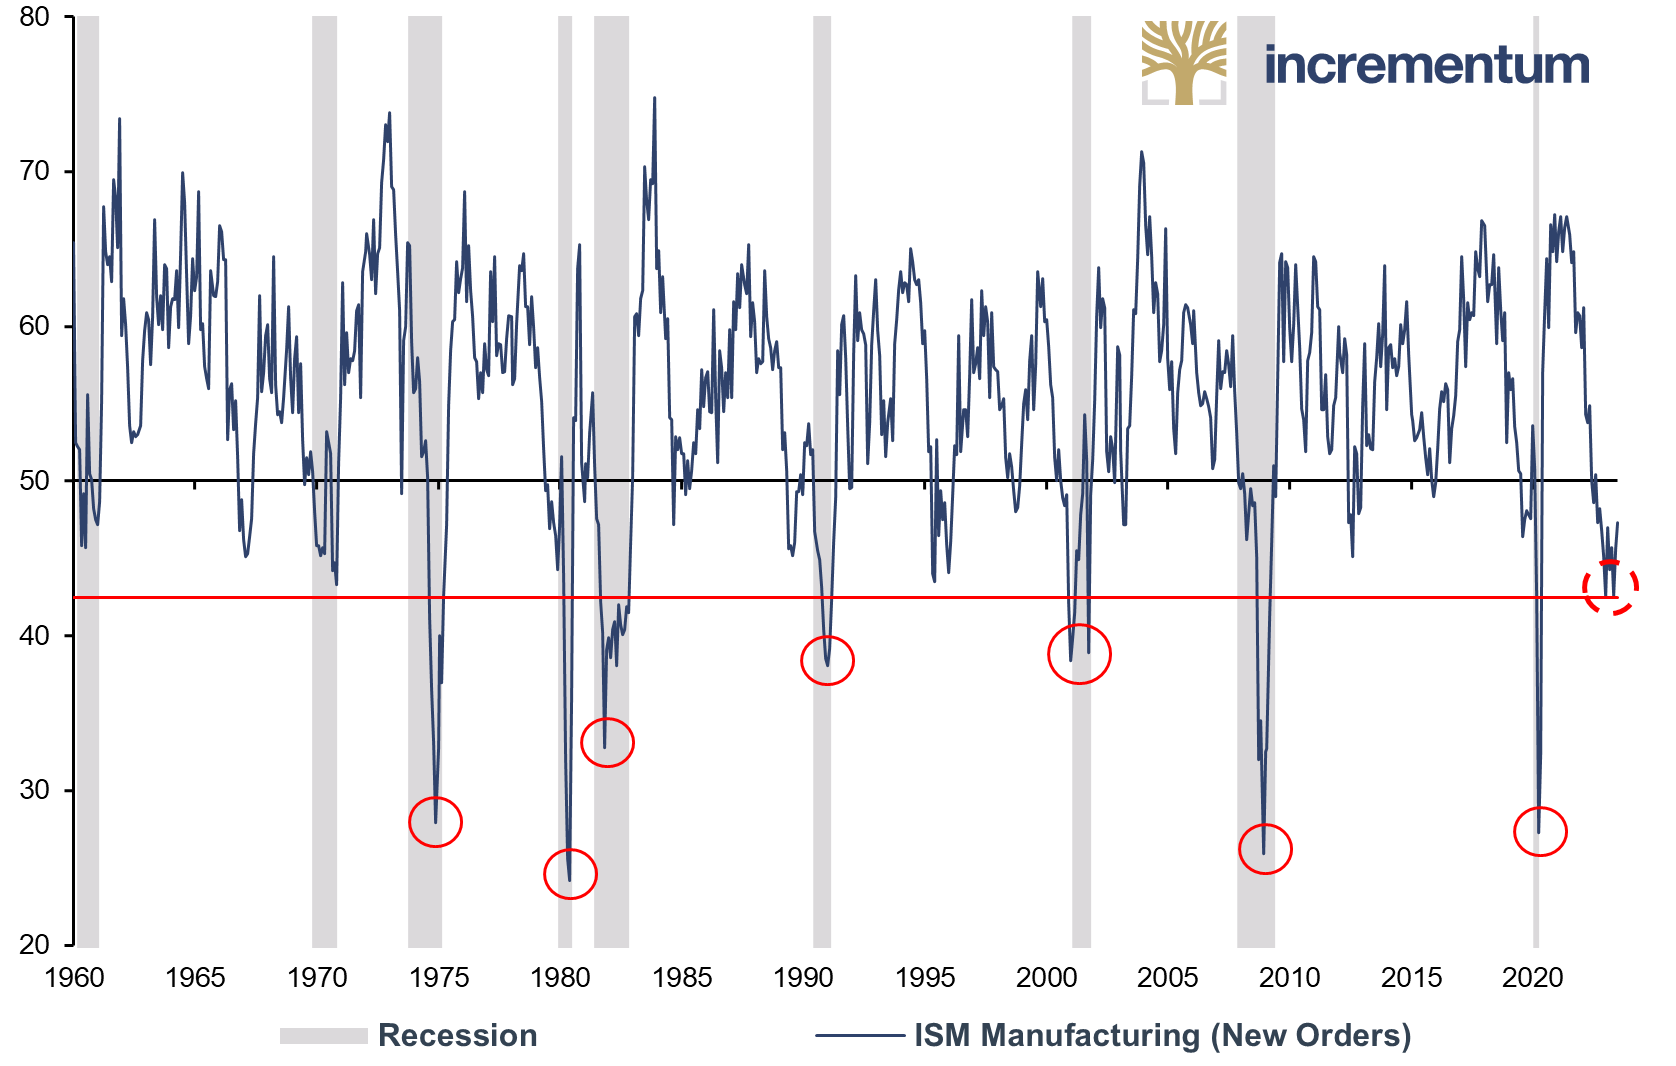
Source: Reuters Eikon, Incrementum AG
The fact that corporate earnings have weakened recently can be seen from the EPS development of the S&P 500 companies.
S&P 500 EPS (TTM, top down), Q1/1970-Q4/2022
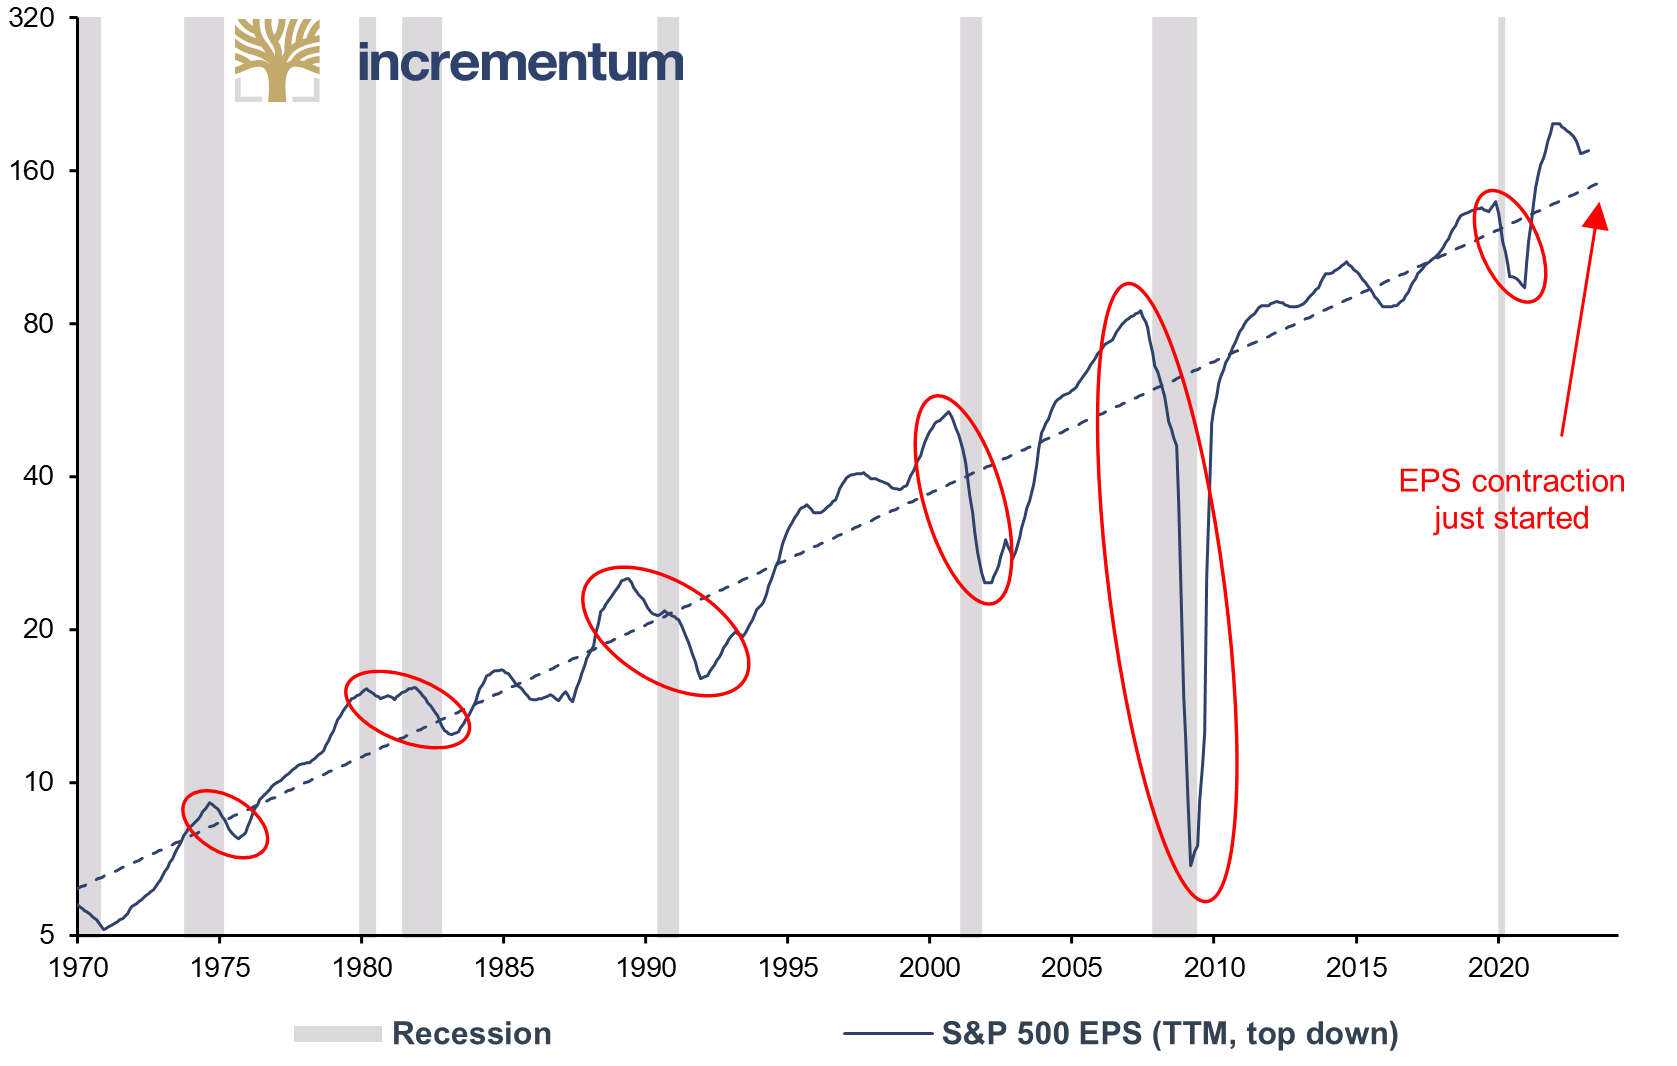
Source: Reuters Eikon, Incrementum AG
While we are still a long way from a collapse like that of the early 1990s or 2000s, the contraction is currently only in the starting blocks. We believe it is realistic that when the recession sets in, corporate profits will fall below the trend line drawn above. However, a profit contraction on a similarly dramatic scale as in the 2008/09 recession is not in line with our base scenario.
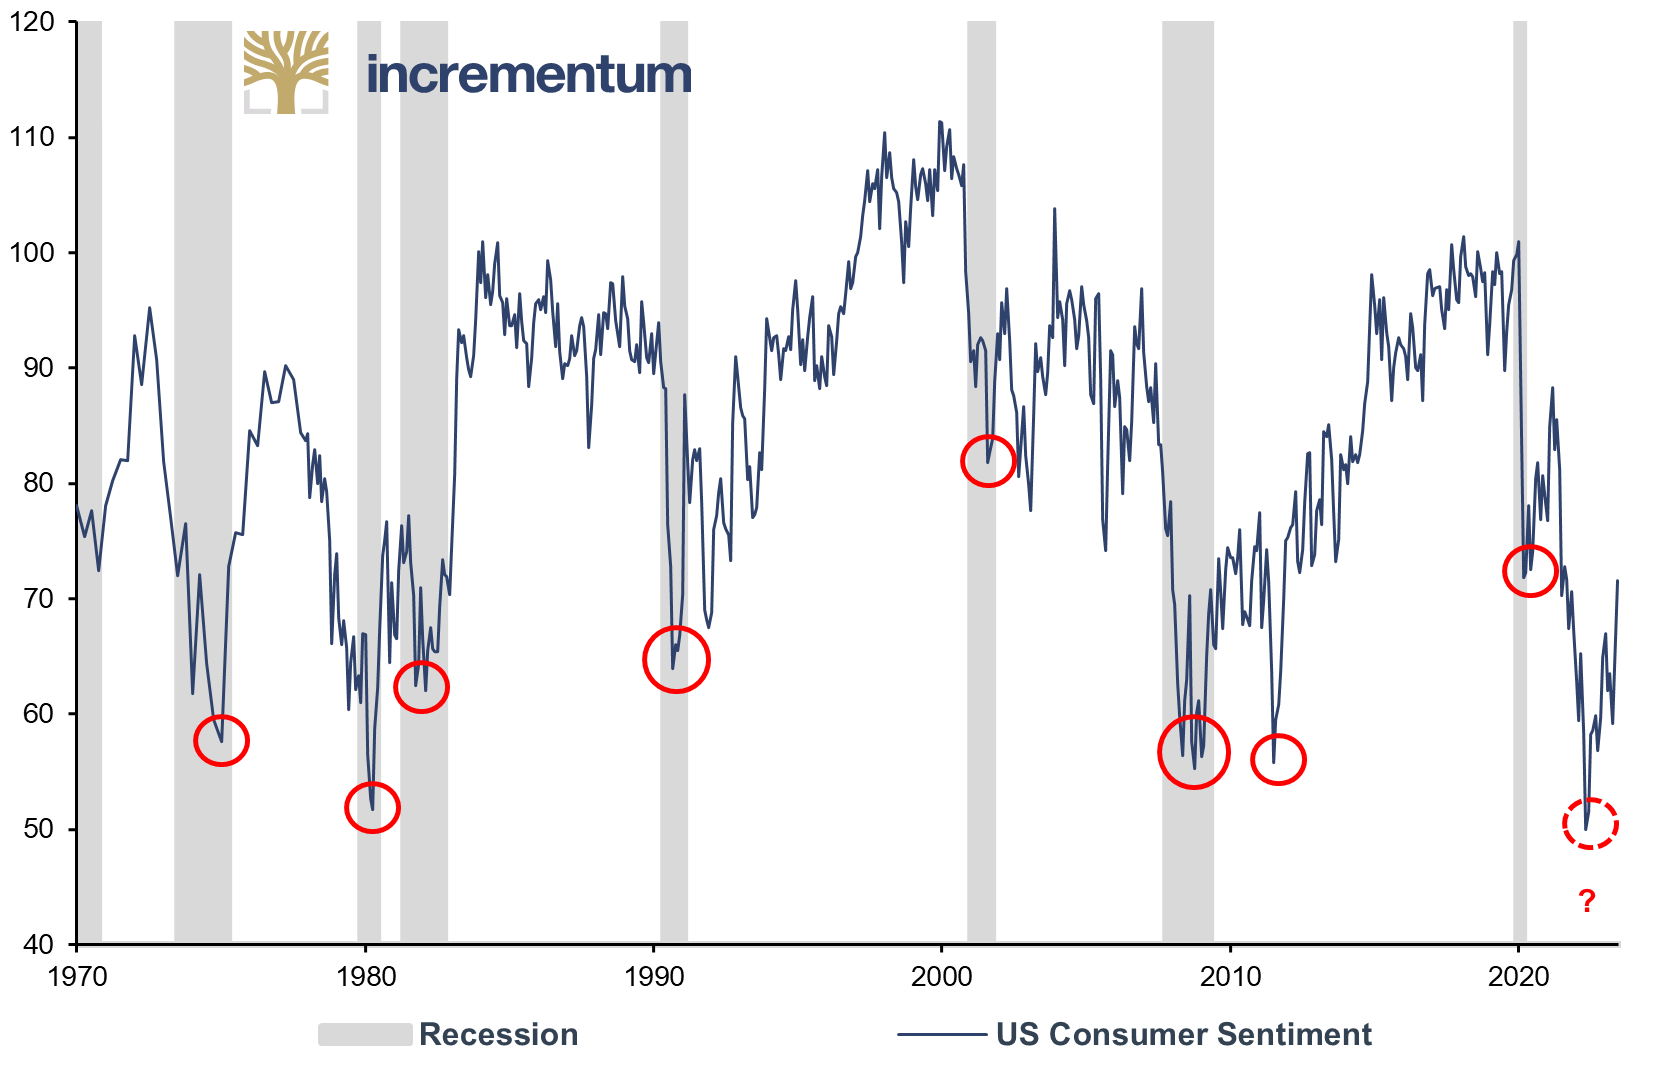
The recession picture looks even clearer in terms of US consumer confidence, which is surveyed by the University of Michigan. In June 2022, the index reached the lowest level in its almost 70-year history and was even significantly lower than at the beginning of the Covid pandemic. Since then, consumer confidence has recovered slightly; but at a value of 63.5, it remains at a historically low level that in the past could only be observed before or during a recession.
US Consumer Sentiment (University of Michigan), 01/1970-04/2023
Source: Reuters Eikon, Incrementum AG
The real estate sector is reeling
The real estate market, which is vitally important for the US economy, is already undergoing a striking correction. Prices are falling, demand is declining, and new orders are collapsing. The main reasons for this are the significant increase in financing costs and the dystopian rise in prices for residential real estate in relation to household income in recent years.
This abrupt development is shown in the following chart of mortgage rates in relation to US median household income. This ratio reached a high of 30.7% in October 2022 and has only retreated slightly since then. The rapid increase illustrates how much the financing problem has intensified for potential US home buyers.
Mortgage Payment*, in % of US Median Household Income, 01/1985-03/2023
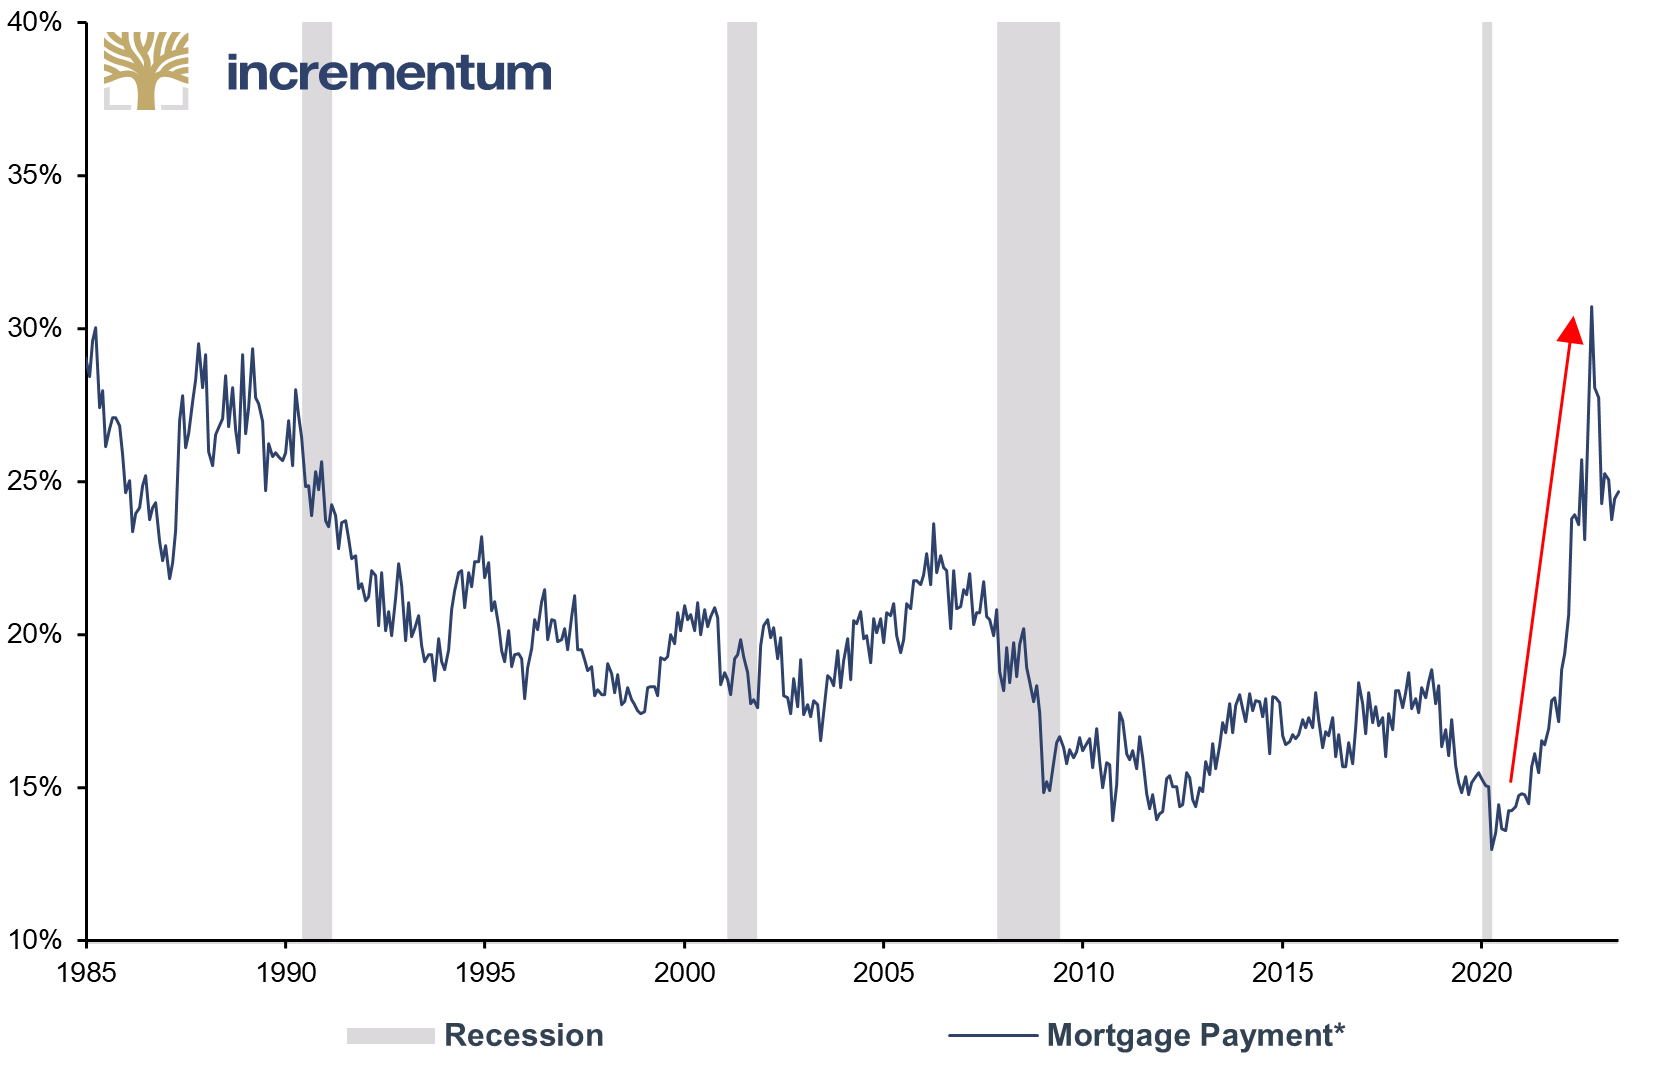
Source: Reuters Eikon, Incrementum AG
*Inputs: Interest Rate = 30-Year Fixed Rate Mortgage, Equity = 30%, Home Price = US New Home Sales
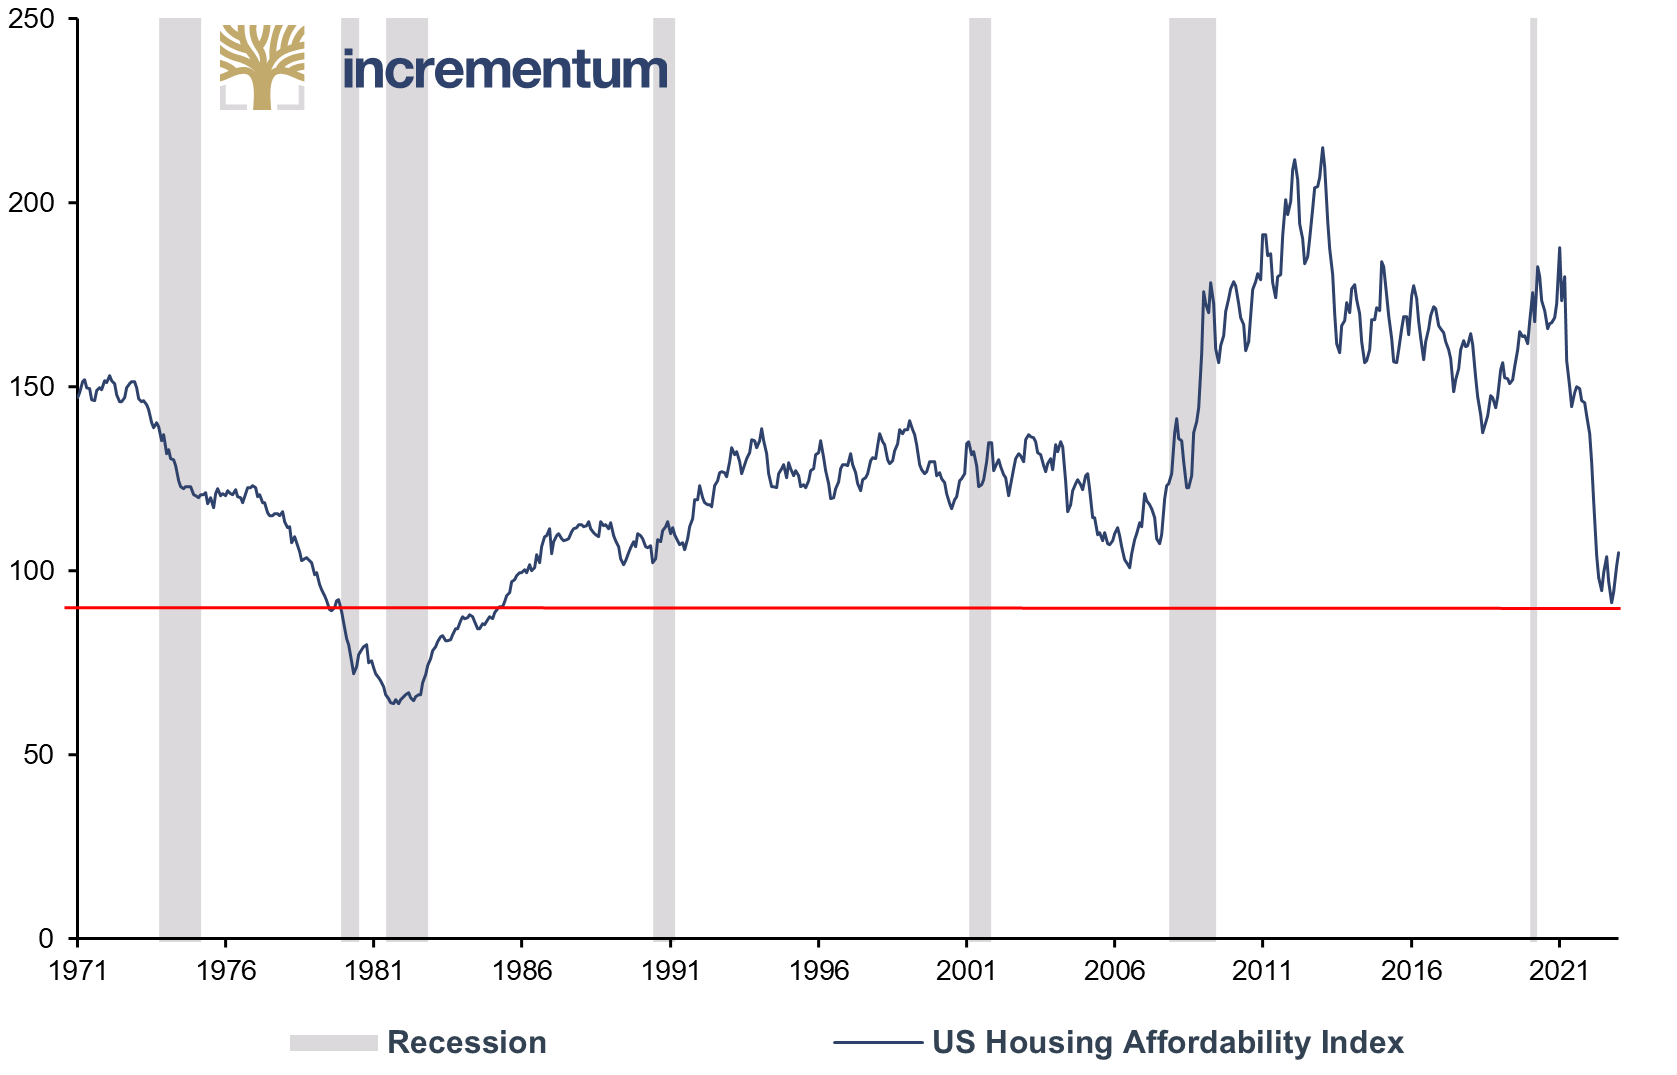
The observation that rising housing prices have now become a major problem is supported by the US Housing Affordability Index. This index measures whether the average family has a high enough income to obtain a mortgage loan for a typical home. In October 2022, the index reached a low of 91.3. In the last 50 years, a lower level had only been seen in the late 1970s and early 1980s. Aside from those periods, it has never been more difficult for the average family in the US to purchase a property than it is today.
US Housing Affordability Index, 01/1970-01/2023
Source: NAR, ycharts.com, Reuters Eikon, Incrementum AG
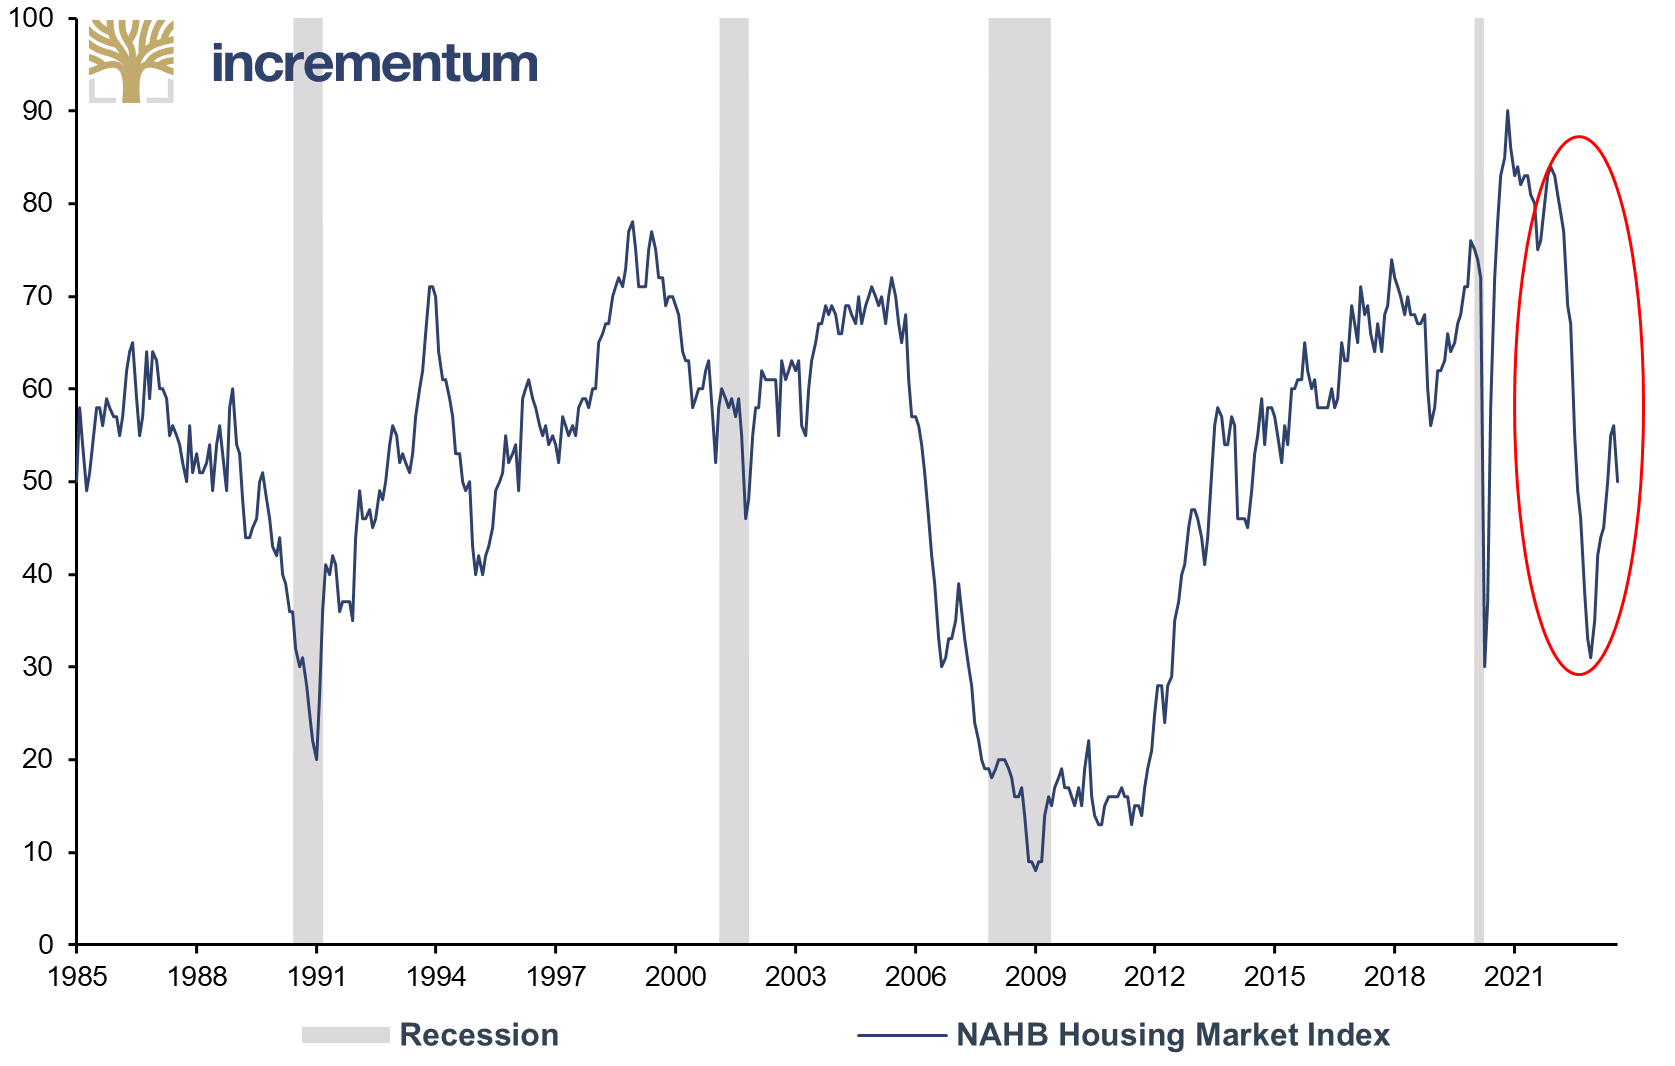
The significant decline in demand for real estate as a result of the rapid rise in mortgage rates over a short period of time is underpinned by the NAHB Real Estate Market Index. The index measures the sentiment of builders regarding current and future market conditions, with a value above 50 signaling positive market sentiment. Within one year, the index fell from 84 to 31 from December 2021 to December 2022. Such a rapid drop was not even seen during the real estate crash in the 2000s.
NAHB Housing Market Index, 01/2000-04/2023
Source: Reuters Eikon, Incrementum AG
The housing market is so significant for the assessment of recessionary trends as no sector of the US economy is more important than residential real estate. According to Federal Reserve analysis, the real estate industry accounted for about 17% of GDP in 2021, and mortgages account for the largest share of private sector wealth and income. According to the reverse wealth effect, the close link between the real estate market and household wealth means that falling real estate prices and rising mortgages can lead to a drop in purchasing power and thus weaken private sector consumption.
Let’s now look specifically at the commercial real estate market. This has recently received increased attention as many US banks have come under pressure in the wake of corrected market valuations in the commercial segment. In particular smaller US banks, known for their heightened vulnerability to economic pressures, bear an inequitable burden, as they hold an outsized portion of approximately 70% in commercial real estate (CRE) loans.
Commercial Real Estate Loans, by Size of Lender, in USD trn, 01/2005-05/2023
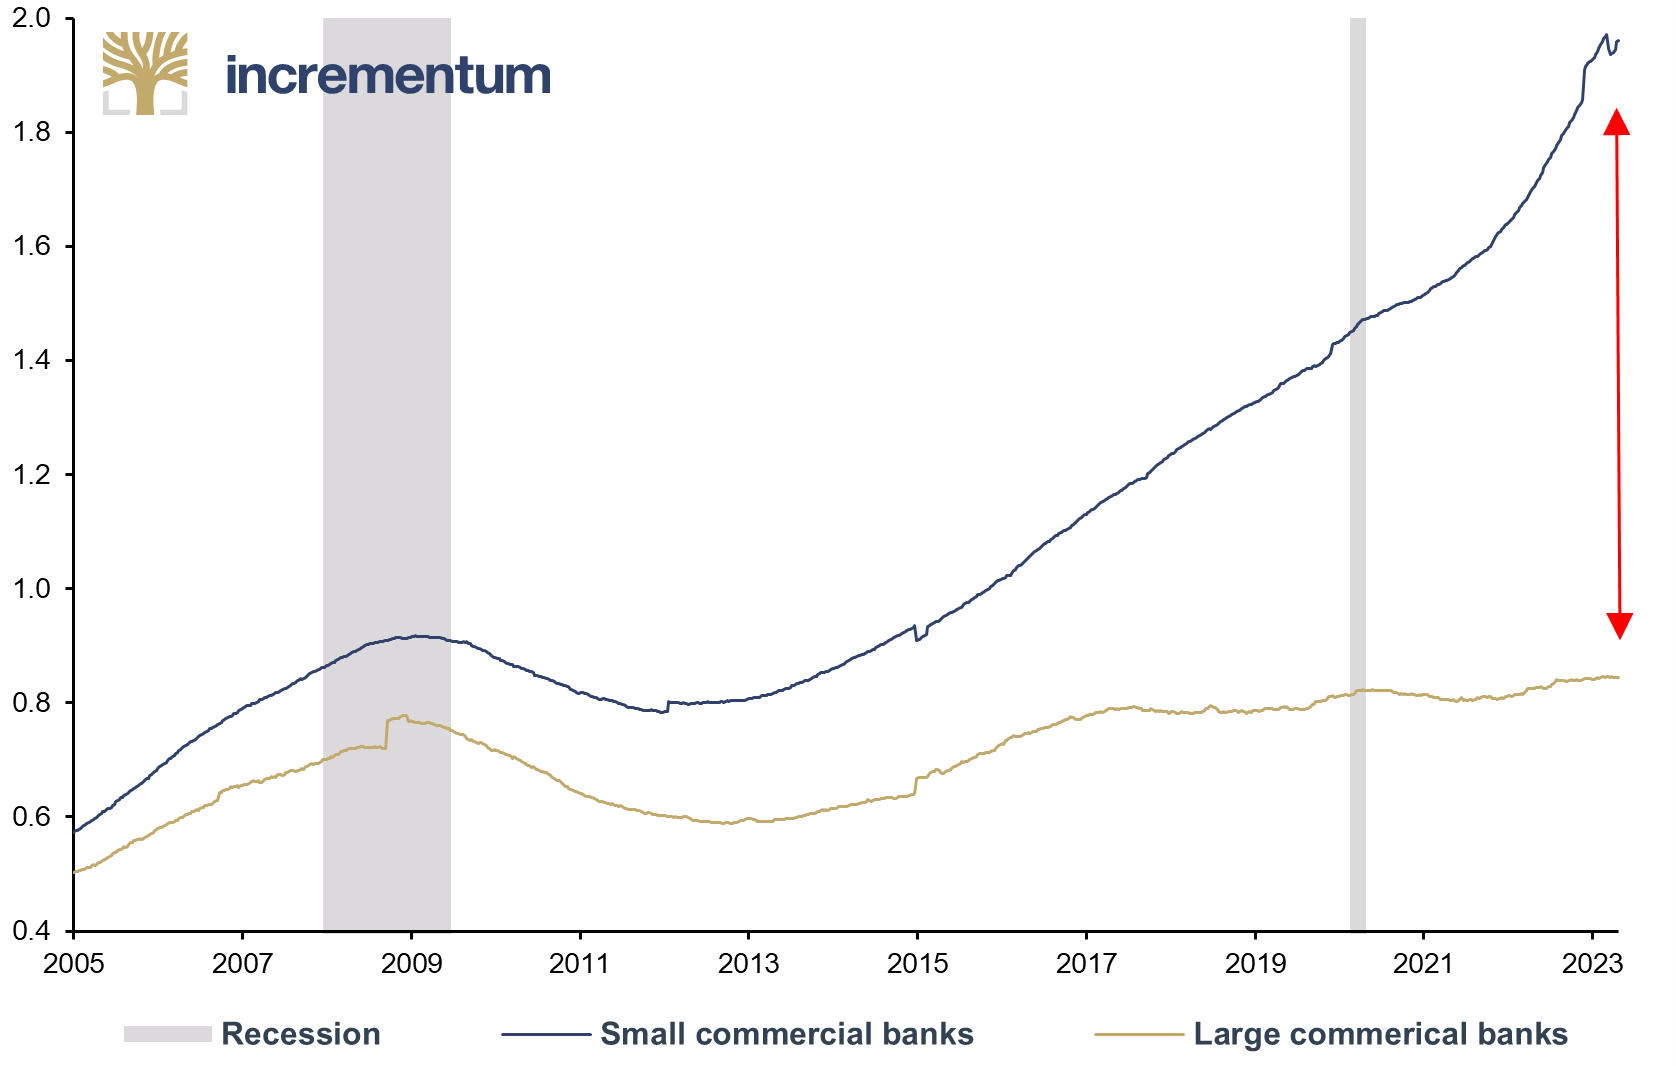
Source: Federal Reserve St. Louis, Allianz Research, Incrementum AG
As economic activity continues to cool, banks now face a double whammy: First, the risk of default on CRE loans is rising; second, CRE valuations must be sharply adjusted, while the cost of funding is rising and squeezing net interest margins.
How stable is the financial market’s house of cards?
The financial market, which in recent years has been characterized by a high degree of stability – it has almost always been on the up, thanks to the liquidity support of the central banks – is suddenly shaken. In this showdown, it’s not only supposedly scrappy opponents like Silicon Valley Bank – before its bankruptcy the 16th largest US bank in terms of deposits – or First Republic Bank that are being hit, but also heavyweights like Credit Suisse. For the latter, in Q4/2022, net outflows amounted to CHF 110.5bn, and in Q1/2023 another CHF 61.2bn flowed out. Then, on March 16, 2023, when it became known that Credit Suisse intended to draw on an extraordinary liquidity grant of up to CHF 50bn from the SNB, the bank’s rating was abruptly downgraded from A to BBB and the bank was taken over by UBS for what could almost be classified as a symbolic amount of CHF 3bn.Credit Suisse, Stock Price, in CHF, 01/1990-05/2023
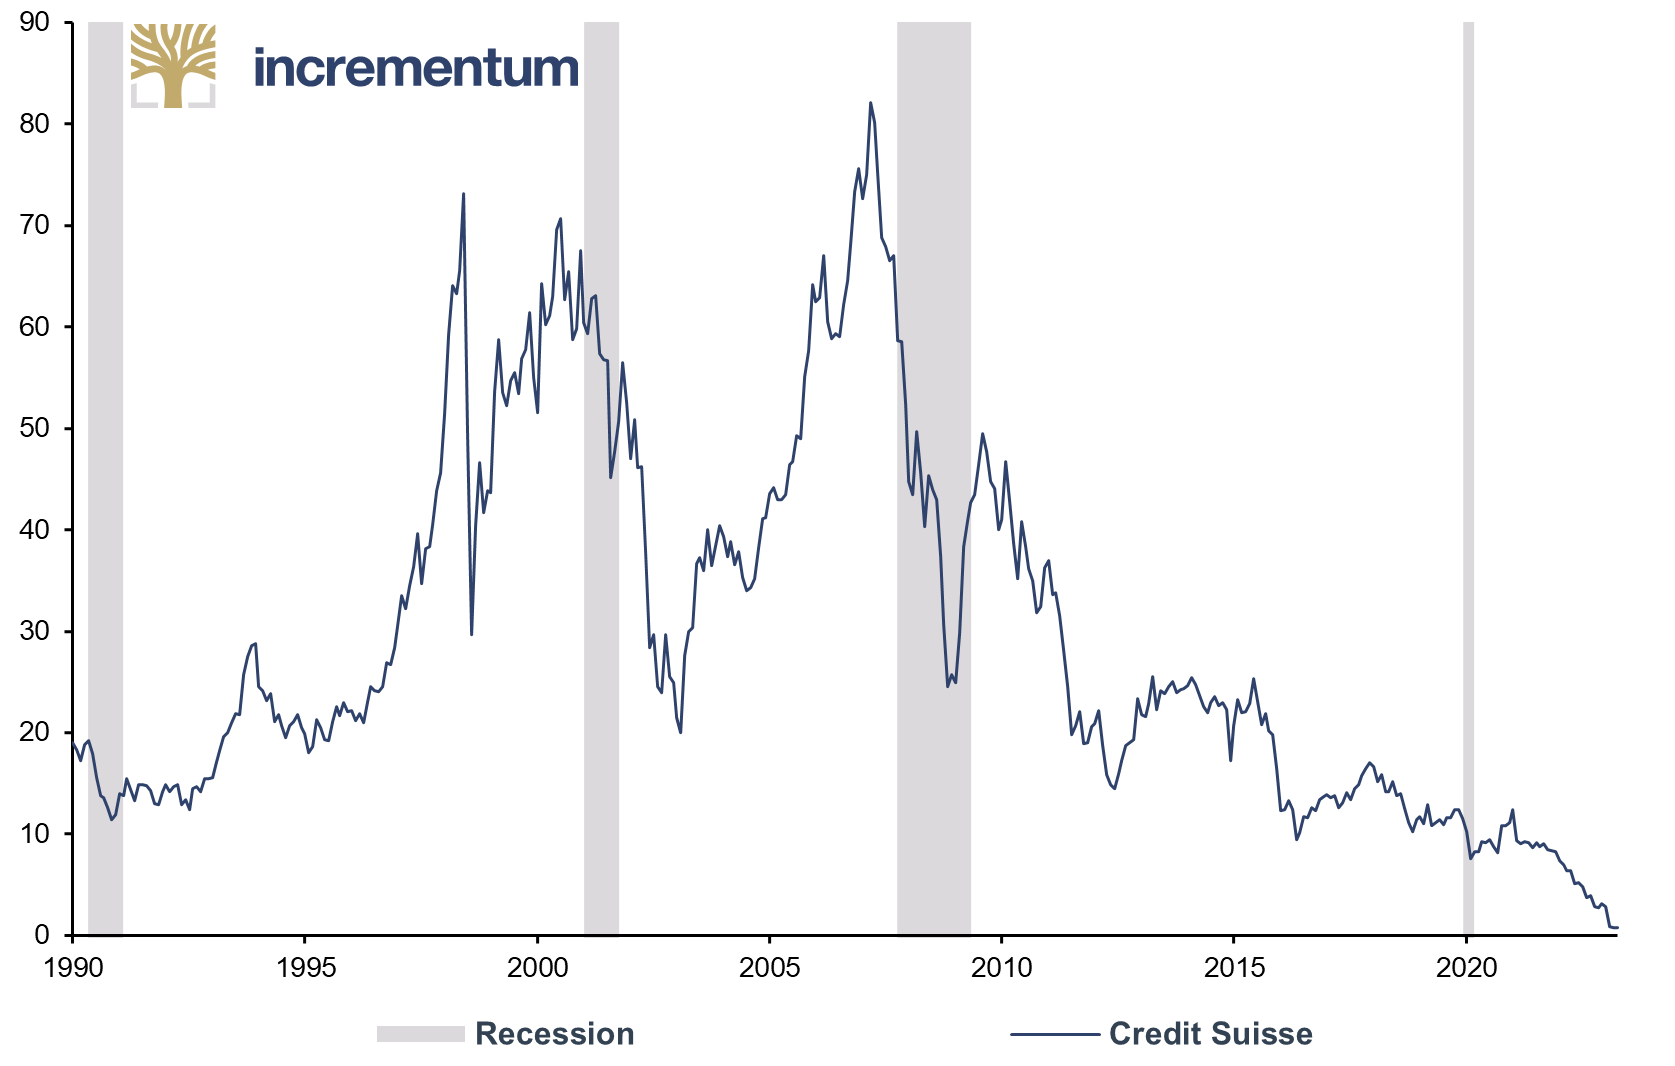
Source: Reuters Eikon, Incrementum AG
Central banks are responding to these distortions in the financial sector by mouthing the words financial market stability more often than price stability, and this with inflation rates beyond the 5% mark. Thus, the pivot long longed for by many market participants seems to be within reach. Currently, the market expects the first interest rate cut before the end of the year. However, a pivot does not equate to a favorable performance – especially on the stock market – as we will discuss later in the chapter. This much can be revealed: The recession bear has already found its next victim.
As a result of the recent turmoil in the banking sector, increasingly high inflows into money market funds were registered. In March 2023 alone, more than USD 340bn flowed into money market funds. This is the highest figure since April 2020, when uncertainty on the financial markets caused by the outbreak of the Covid pandemic was at its peak.
US Money Market Funds, Total Financial Assets, in USD trn, Q1/1980-Q1/2023
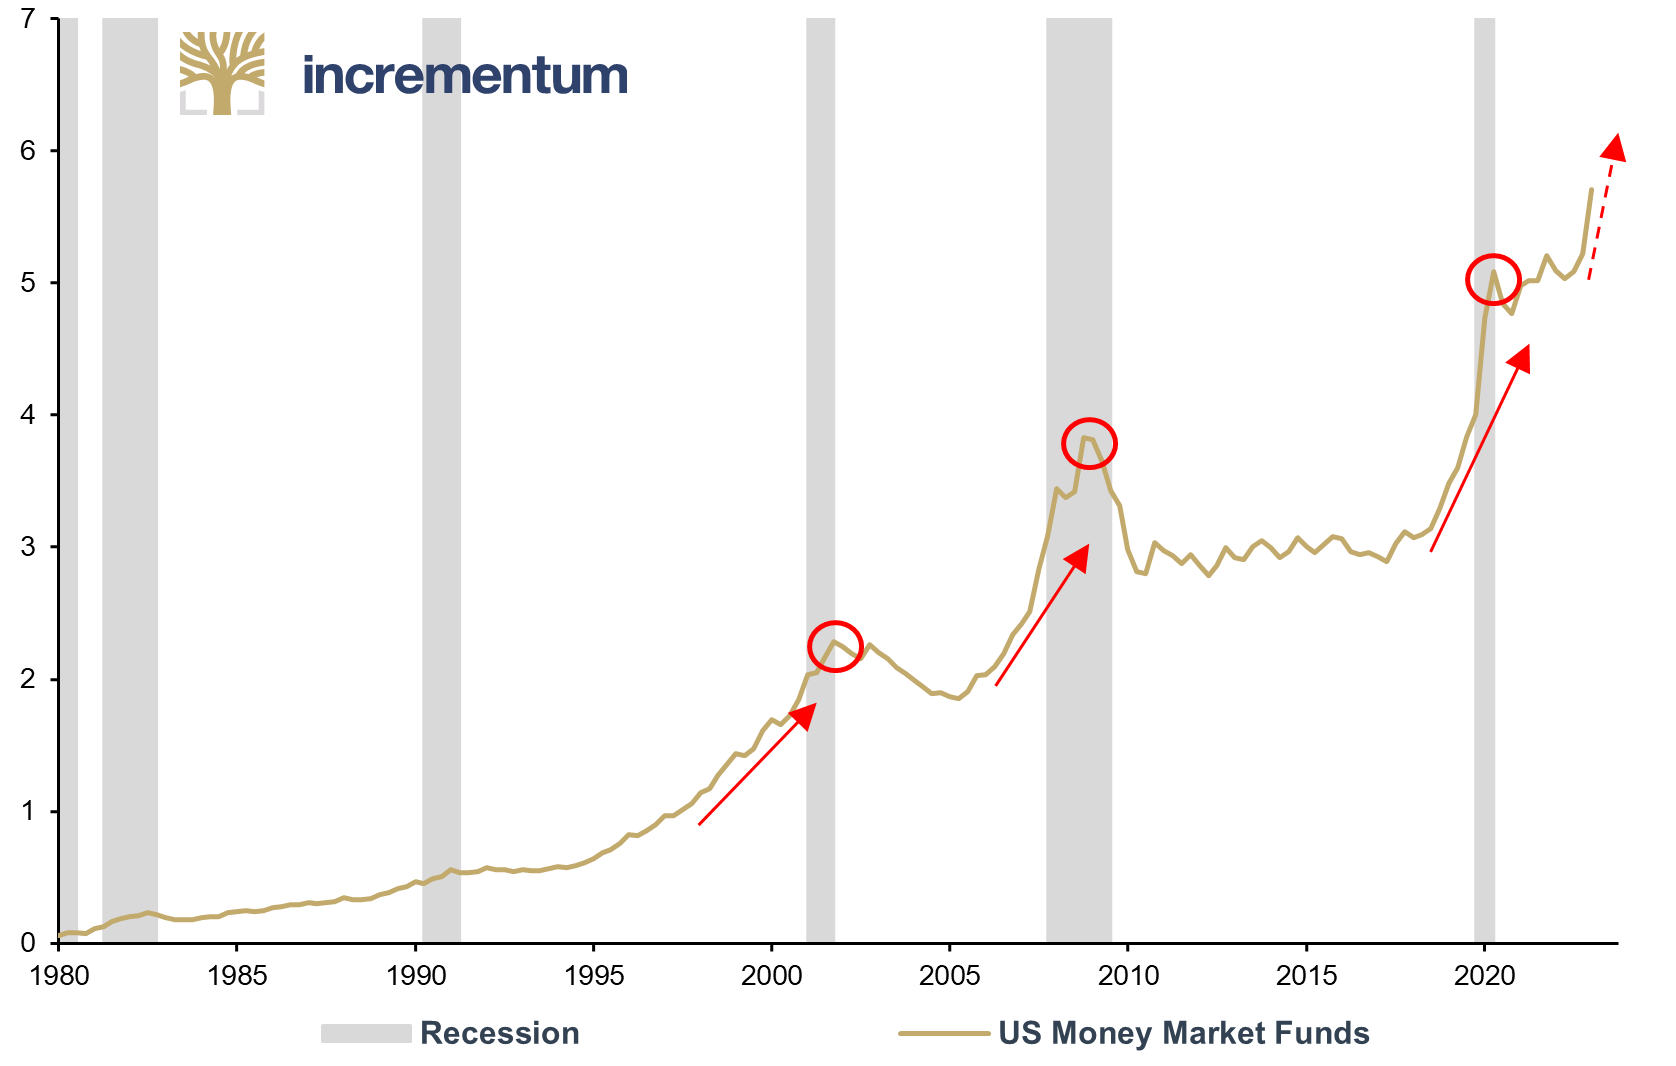
Source: Federal Reserve St. Louis, SEC, Incrementum AG
But why is this and what does the level of inflows mean for investors? Money market funds offer a safe and stable investment option. Especially in times of uncertainty and volatility in the financial markets, they are seen as a safe haven. Considering the recent banking crisis, many bank customers, fearful that their deposits are not safe, are withdrawing their money and looking for alternatives.
The latest inflows can therefore be interpreted on the one hand as an indication of rising instability in the financial sector. On the other hand, the interest rates offered by conventional banks are currently significantly lower than those offered by money market funds, which mostly invest in liquid, short-term government bonds. In addition, competition has intensified due to new market entrants such as Apple, which recently stirred up the market with an effective annual interest rate of 4.15% for all Apple Pay users in the US.
Comparison of US Interest Rates, APY, 04/2023
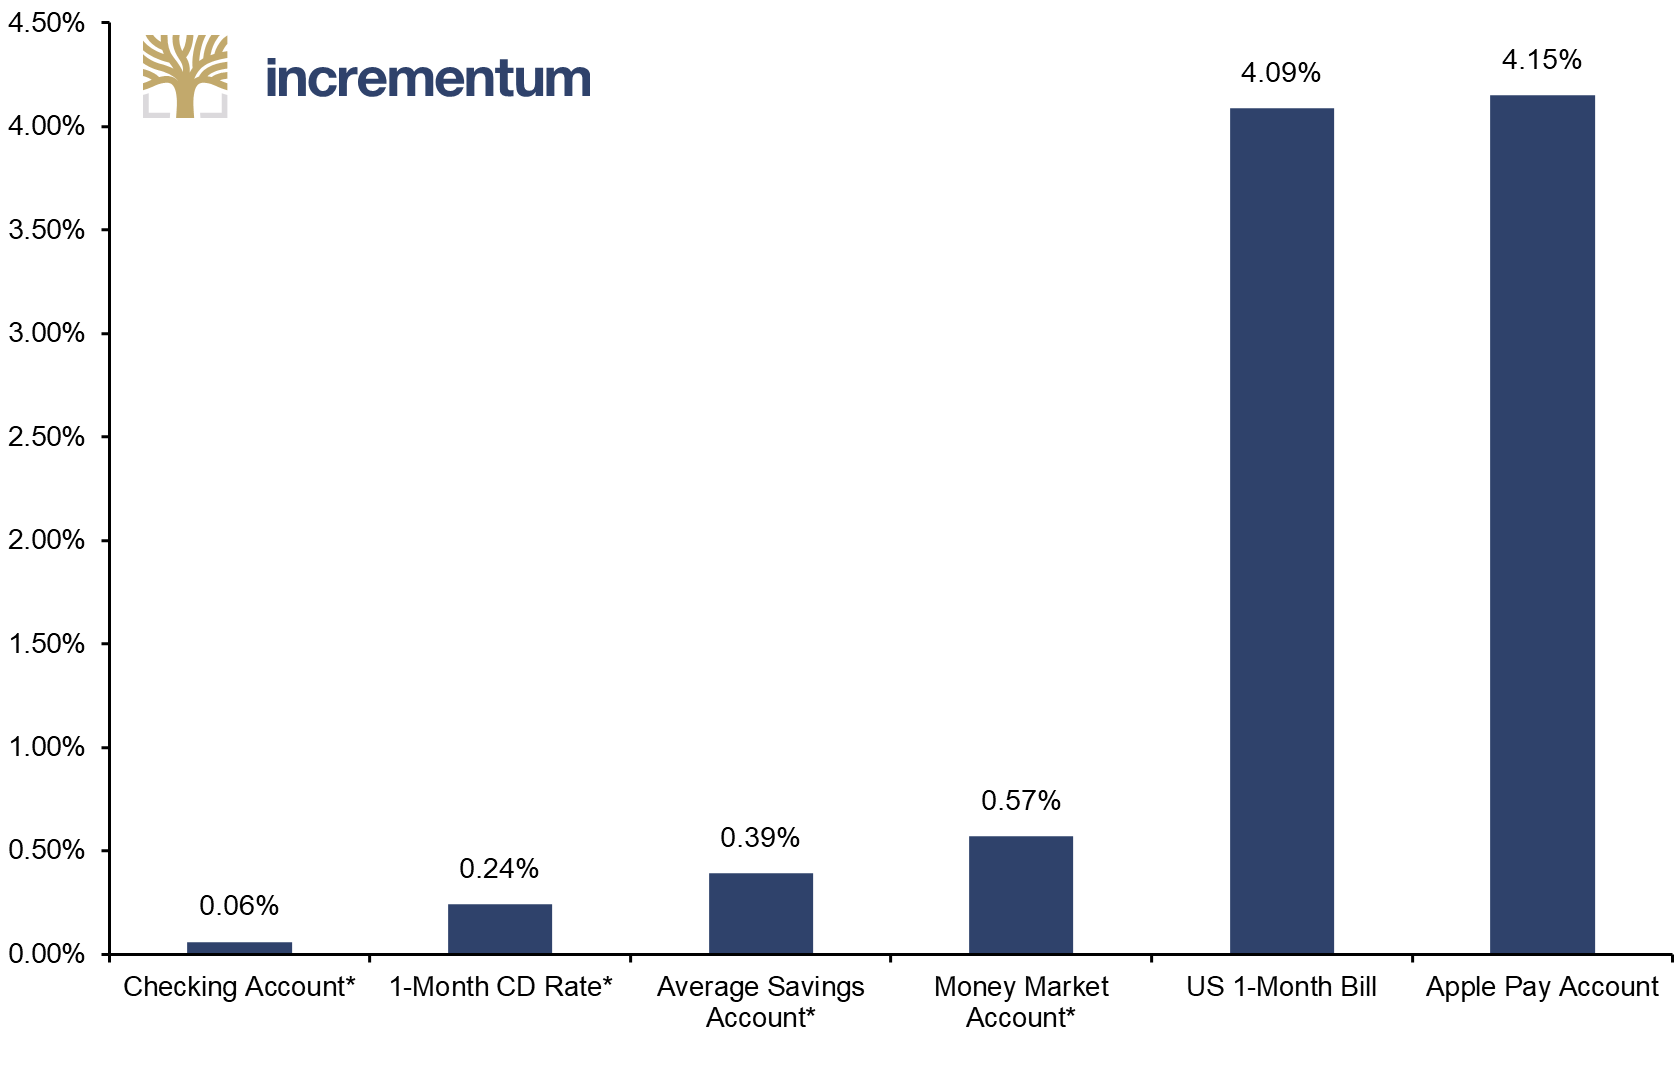
Source: FDIC, Federal Reserve St. Louis, Reuters Eikon, Incrementum AG
*Average values
The rapid increase in investments in money market funds can have negative effects on the sector. Particularly before the financial crisis in 2008, and in 2020, investments in money market funds increased significantly as investors sought safe and stable investment options. However, this led to significantly higher demand for short-term bonds and money market instruments, which in turn led to an overvaluation of these instruments. Furthermore, it fueled stress in the banking sector, as banks lost further liquidity as a result and profits shrank. One of the consequences is tighter credit conditions.
The next chart shows that tighter credit conditions for companies are mostly accompanied by increased volatility in financial markets. This phenomenon was particularly well observed in 2008/09 and 2020. Since June 2021, the trend has been toward tighter credit.
Net Percentage of Banks Tightening Credit Standards (lhs), and VIX (rhs), 01/1990-03/2023
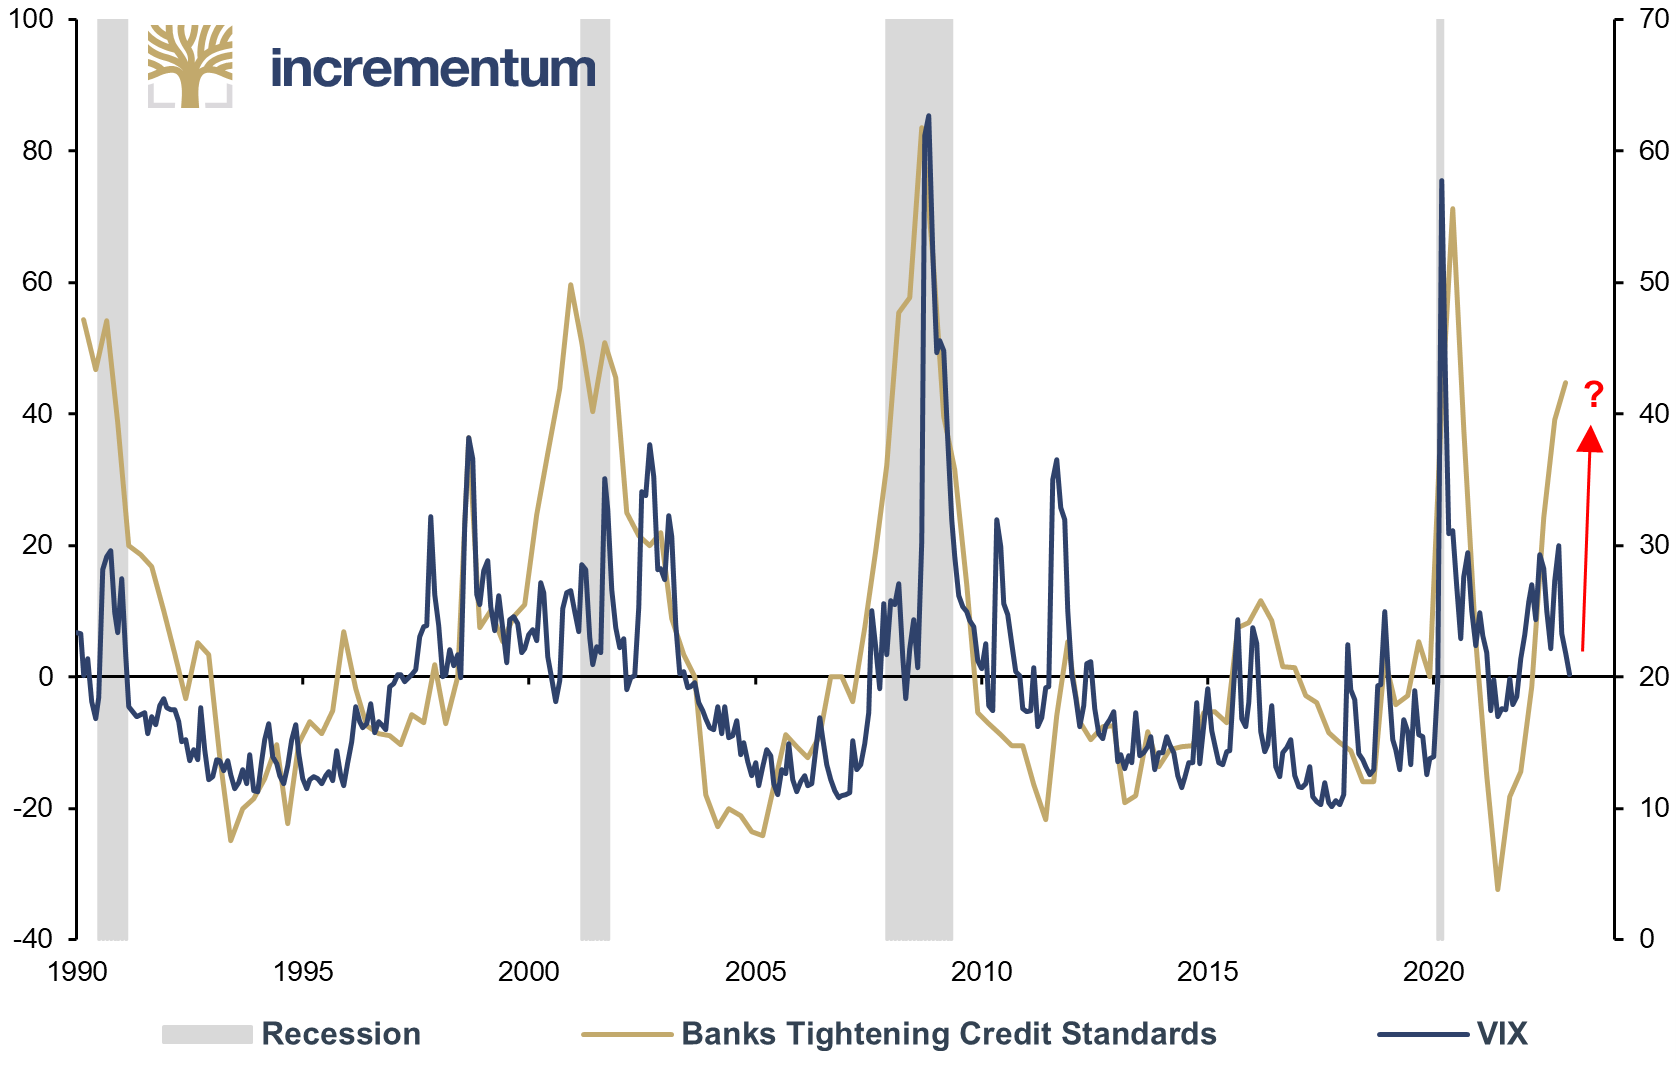
Source: Federal Reserve St. Louis, Incrementum AG
An analysis of the volatility indices is also revealing. In Q1/2008, too, the VIX volatility index, which measures implied volatility for the S&P 500, remained quiet, at levels similar to today’s. However, the credit situation continued to worsen in subsequent quarters until the failure of Lehman Brothers in September 2008 led to a sharp rise in volatility. While volatility on the stock market is still low now, the MOVE Index, which measures implied volatility on the US bond market, is at levels last measured in 2008/09.
VIX (lhs), and MOVE (rhs), 01/2003-04/2023
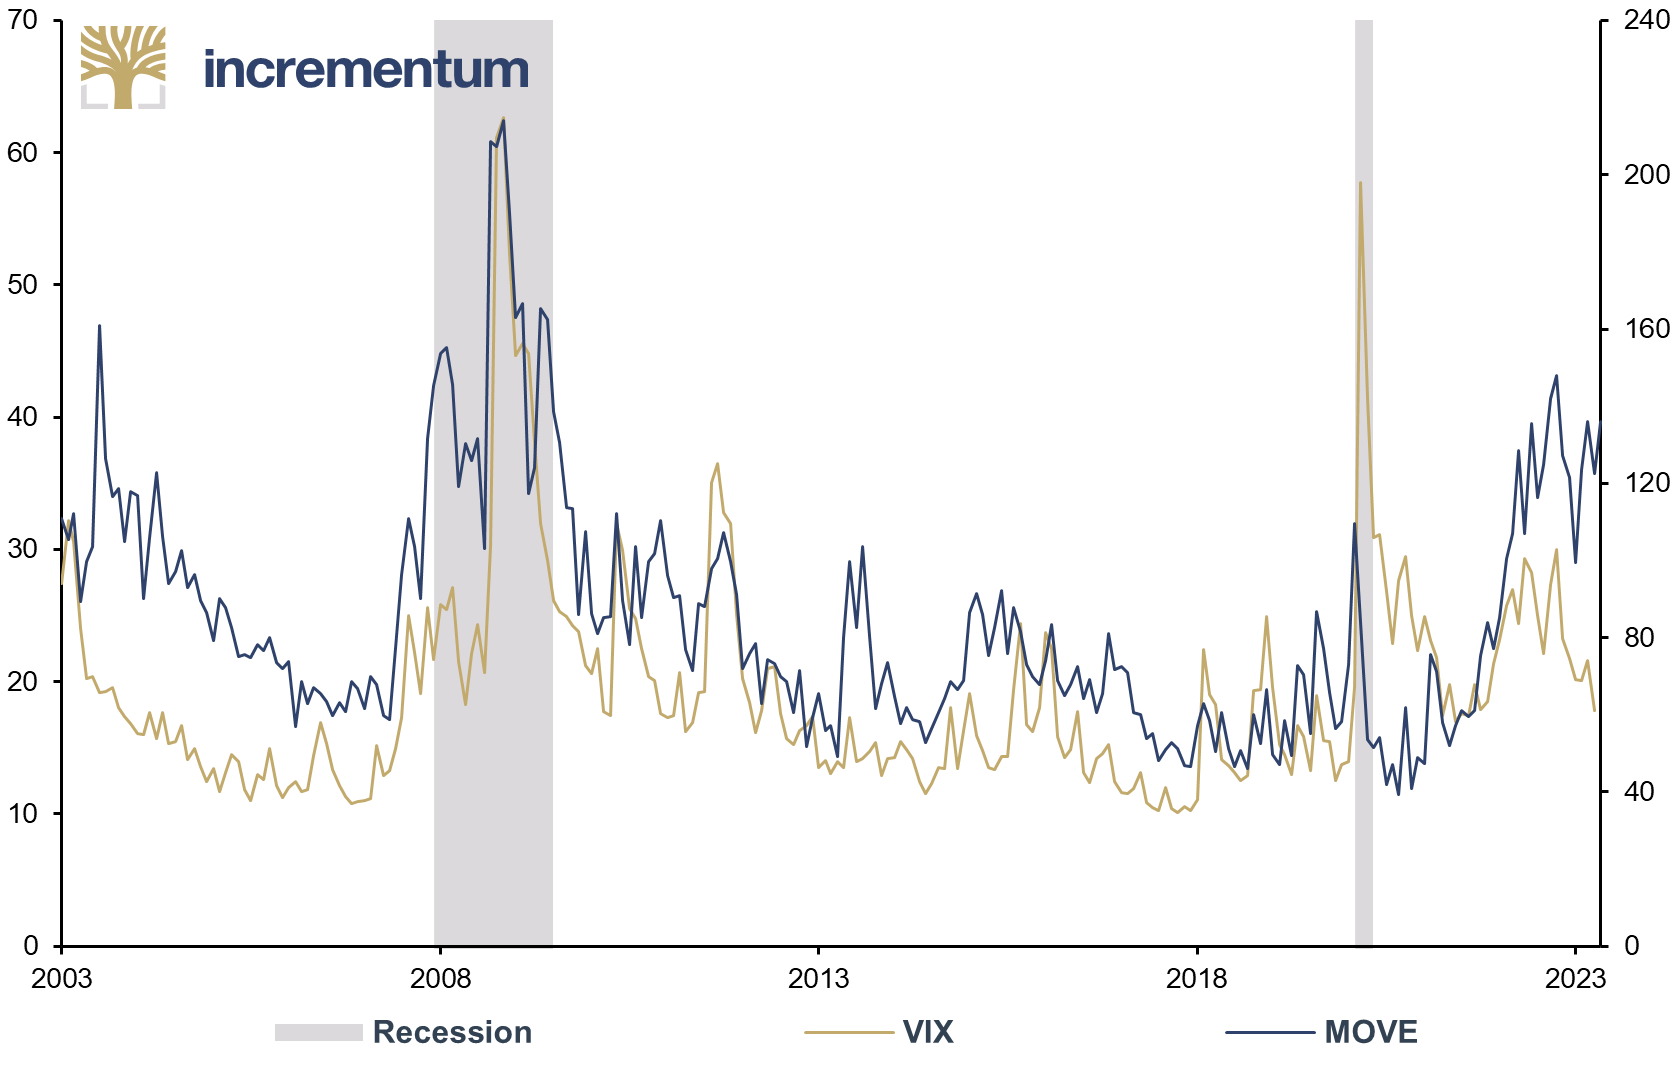
Source: Reuters Eikon, Incrementum AG
The looming credit crunch is also being accompanied by increasing distress in the commercial real estate (CRE) sector, which will exacerbate and prolong the slowdown in the US economy and financial sector. A credit crunch seems inevitable as banks are forced to strengthen their balance sheets and thus may face an increasing number of recalled loans and a significant curtailment of lending.
Because smaller banks are particularly vulnerable to losses on their commercial real estate portfolios, more conservative credit conditions would limit, and thus strain, credit availability to the broader economy. If increasing pressures on the commercial real estate market affect bank solvency, this could further constrain lending and prevent the Federal Reserve from maintaining a tight monetary policy.
Net Percentage of Banks Tightening Credit Standards for Commercial Real Estate (CRE) Loans, Q1/1990-Q1/2023
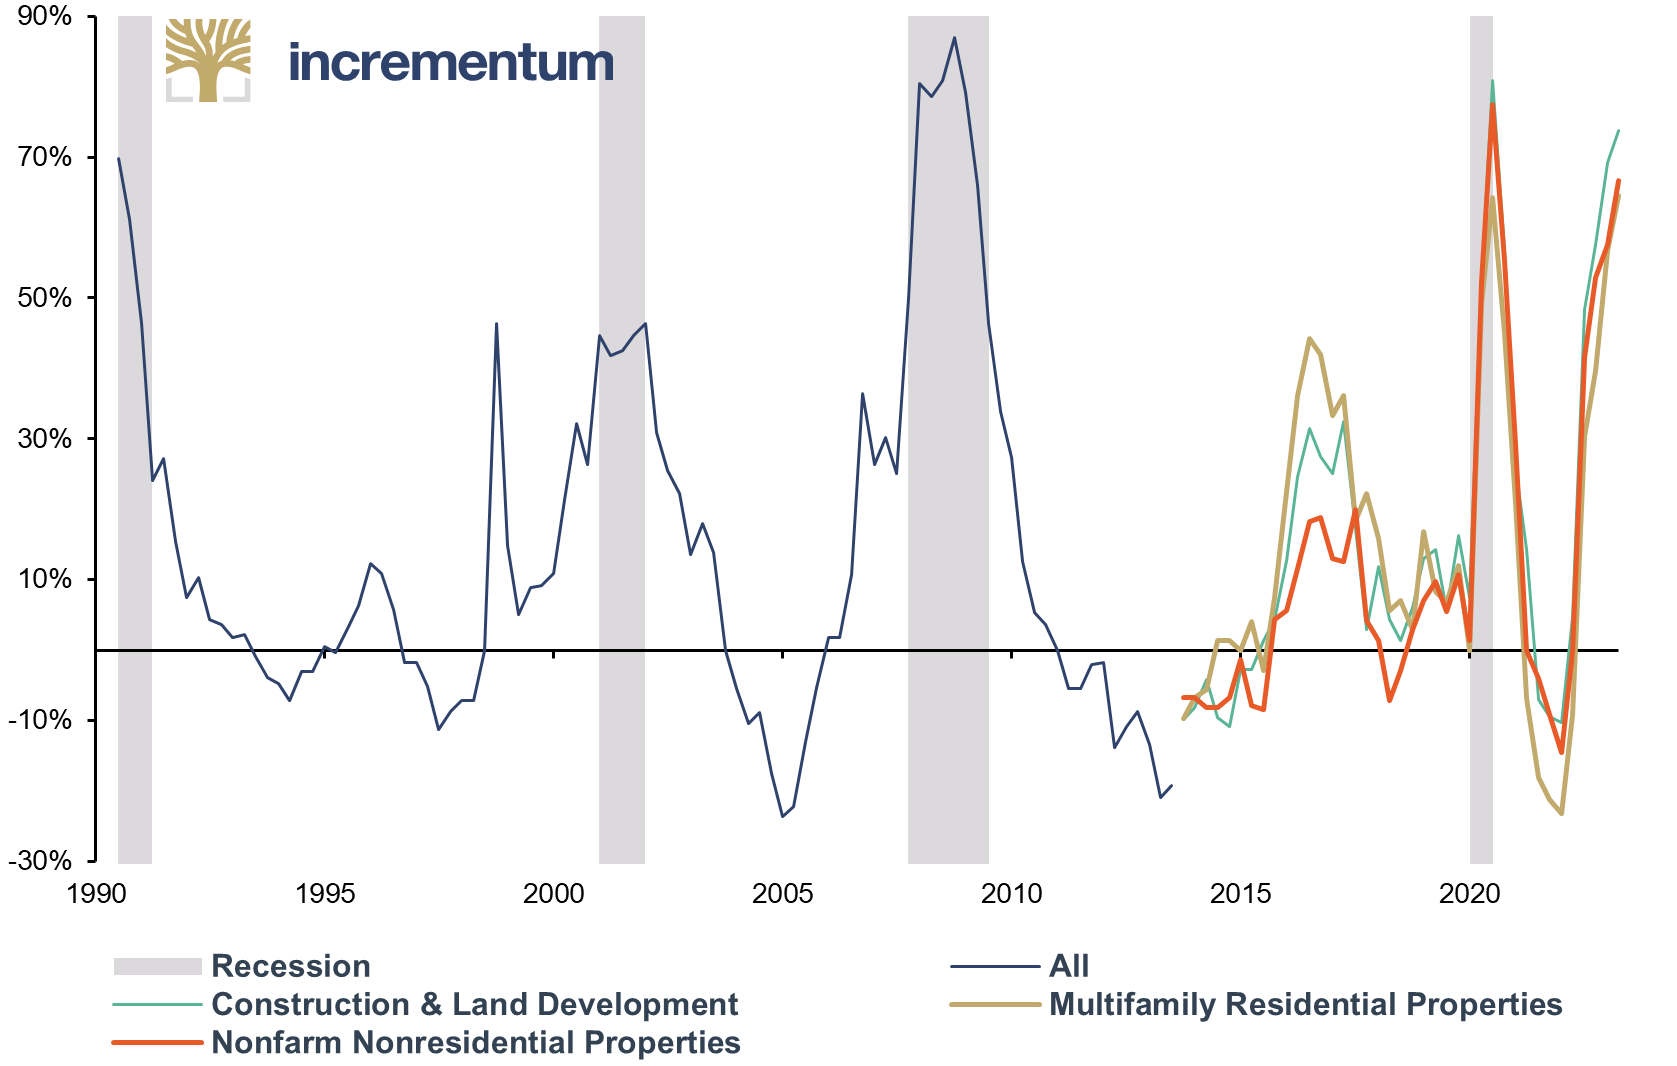
Source: Federal Reserve St. Louis, Longview Economics, Macrobond, Incrementum AG
Provided that the restrictive credit conditions on the financial market remain in place, we expect economic uncertainty and tighter financing conditions to lead to a gradual increase in pressure on the commercial real estate market in the coming months. Losses in this area could have a negative impact on the entire banking sector and ultimately on the economy.
Labor market shows first weaknesses
For a long time, the labor market has been surprisingly robust, but the first cracks are now visible. For example, the number of overtime hours worked has declined sharply year-on-year, which has been a reliable recession indicator in the past. In times of restrictive monetary policy and economic slowdown, companies try to cut costs by reducing staff or cutting working hours. Weakening orders also favors this managerial behavior. A temporary low of -18% in overtime hours formed in February 2023. Lower values were last observed only during the Covid-19 pandemic and during the 2008/09 recession following the Global Financial Crisis.
Overtime Hours, US Manufacturing Sector, yoy, 01/1970-04/2023
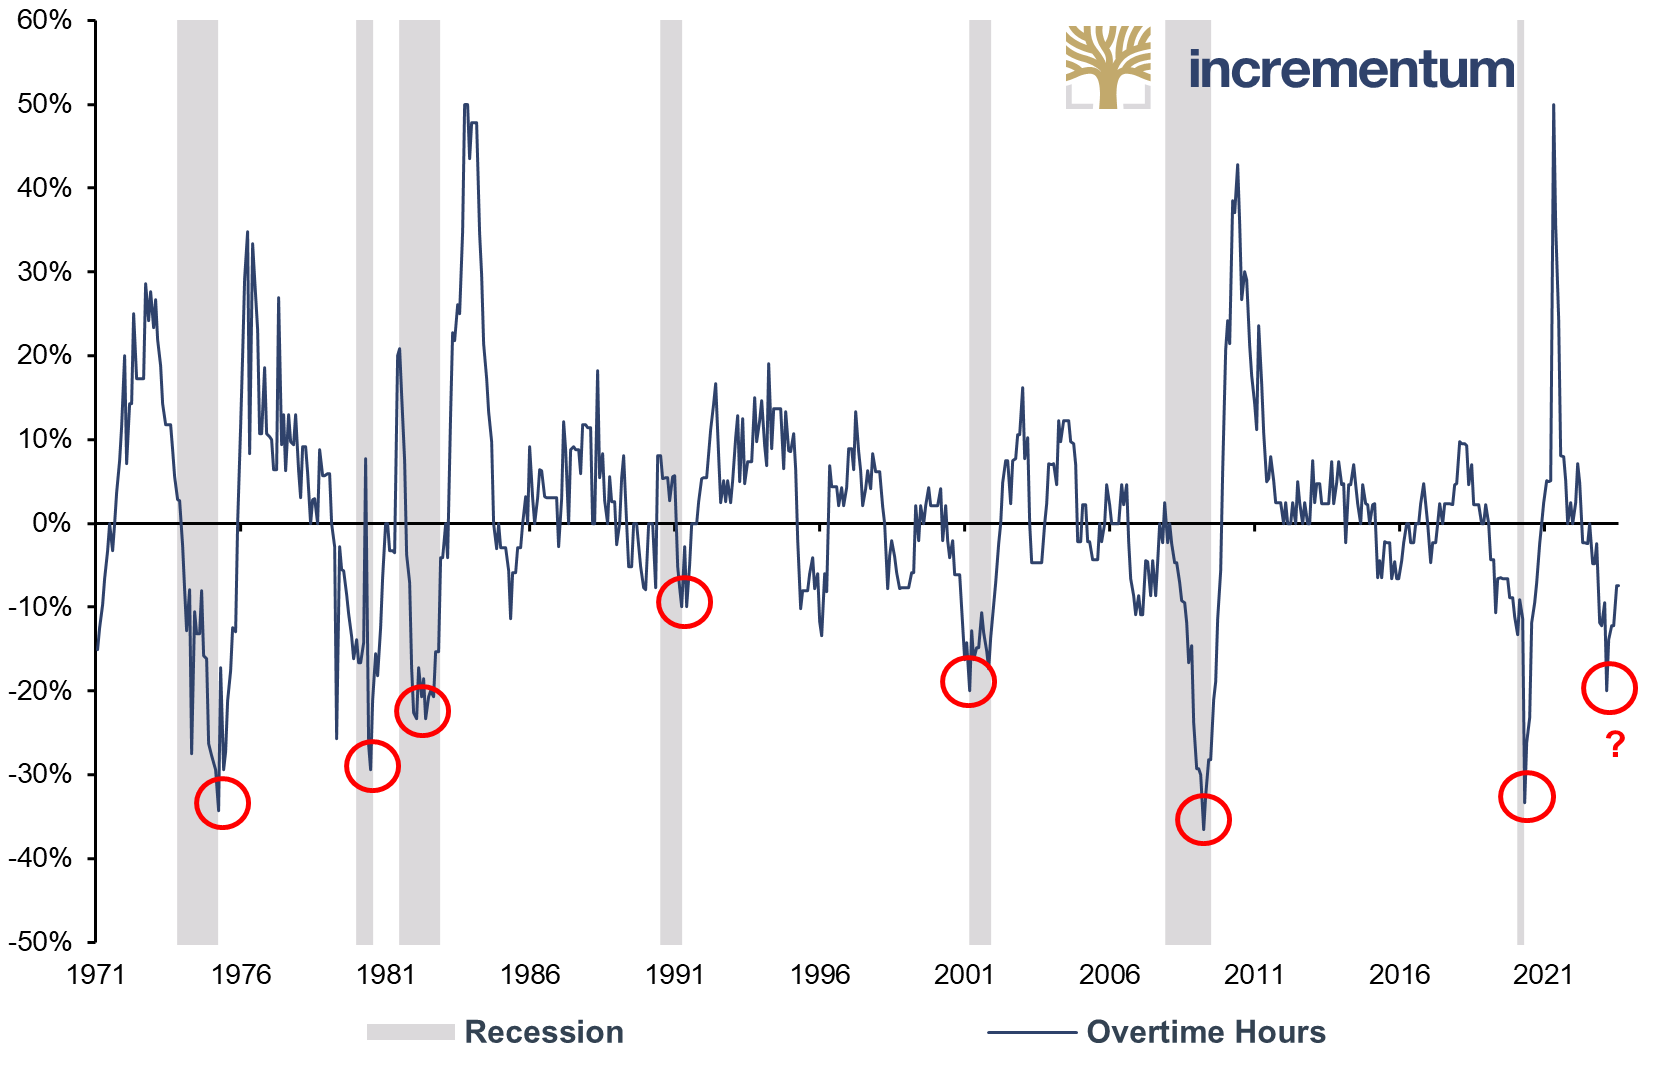
Source: Reuters Eikon, Incrementum AG
The gloom can also be seen in the fact that more and more sectors are reporting layoffs. This phenomenon can be observed particularly well in the interest-sensitive tech sector, where there are many companies with long duration, i.e., a high proportion of long-term investments and low liquidity. Whether it’s Big Tech à la Facebook, Google, Amazon, or less-well-capitalized and lesser-known tech companies, one layoff announcement follows hard on the heels of the next. In difficult economic times, companies in the technology sector tend to lay off more workers, due to their very high labor costs, to stabilize their financial position and service their liabilities.
Tech Layoffs, Employees Laid Off (lhs), and Companies with Layoffs (rhs), Q1/2020-Q1/2023

Source: layoffs.fyi, Incrementum AG
The statistics show that layoffs are steadily gaining momentum: In the first few months of this year, 186,328 jobs had already been cut by the beginning of May, more than the 164,576 in 2022. And „tech“ these days also means transportation, healthcare, finance, real estate, infrastructure, and leisure and travel sectors, not just software and hardware companies. Above all, though, tech means wellpaid specialists.
In stark contrast to previous recessions, white collar workers, of whom there are typically fewer in a company than blue collar workers, are currently bearing the brunt of job cuts. As a result, the impact on the unemployment rate and other labor-market statistics has so far been manageable. Only when blue-collar workers are also hit by layoffs will there be marked changes in the labor market.
In September 2022, US initial jobless claims, commonly used as a leading indicator of the labor market, hit a new low since surveys began. Since then, the number of initial claims has jumped by nearly 25%, coinciding with the recent wave of layoffs in the tech sector. Historically, the low point in initial claims was reached before a recession. A recession typically occurs when the labor market slowdown accelerates. A sustained continuation of this trend could soon spell the end of record lows in the US unemployment rate and signal the onset of a recession.
US Initial Jobless Claims, 01/1970-05/2023
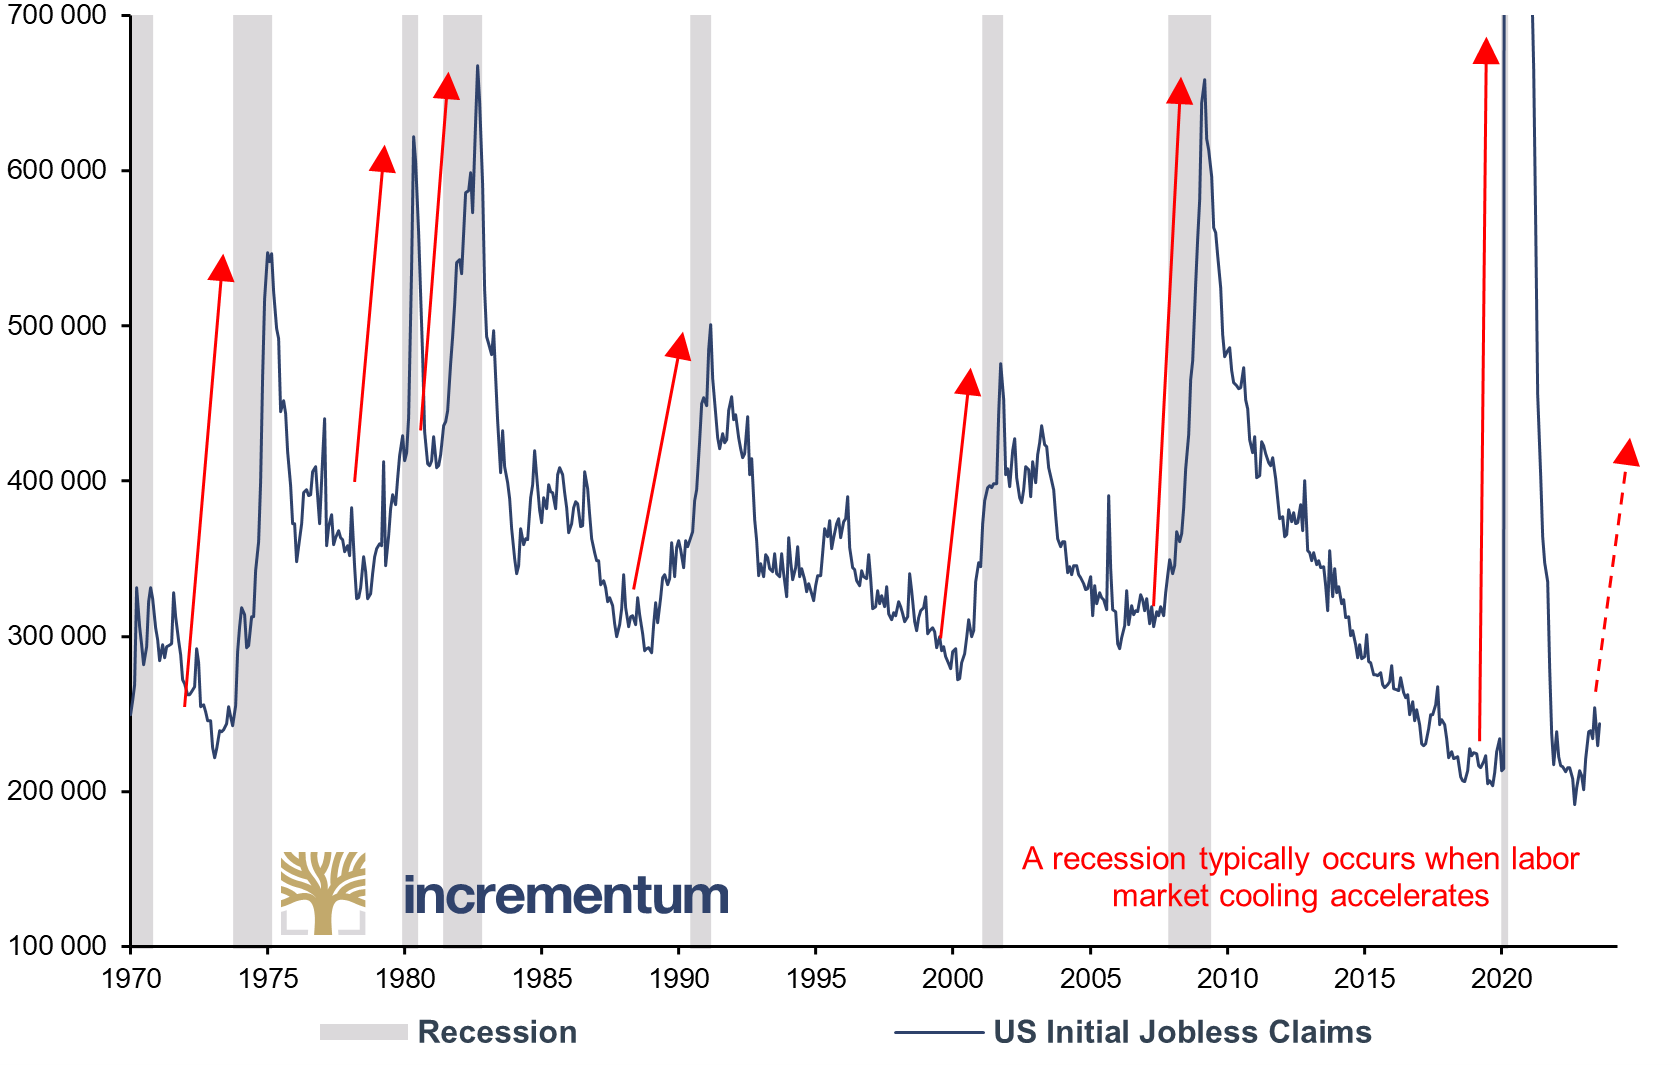
Source: Reuters Eikon, Incrementum AG
In both 2008 and 2019, the Federal Reserve made its first rate cuts a few months after US job openings had formed a high. The high in the current cycle was marked back in March 2022. So, this time, the Federal Reserve’s delay appears to be even more severe, as the first rate cut is long overdue based on macroeconomic trends, except for the significantly elevated inflation rate.
Effective Federal Funds Rate (lhs), and US Job Openings (JOLTS), in mn (rhs), 01/2001-04/2023
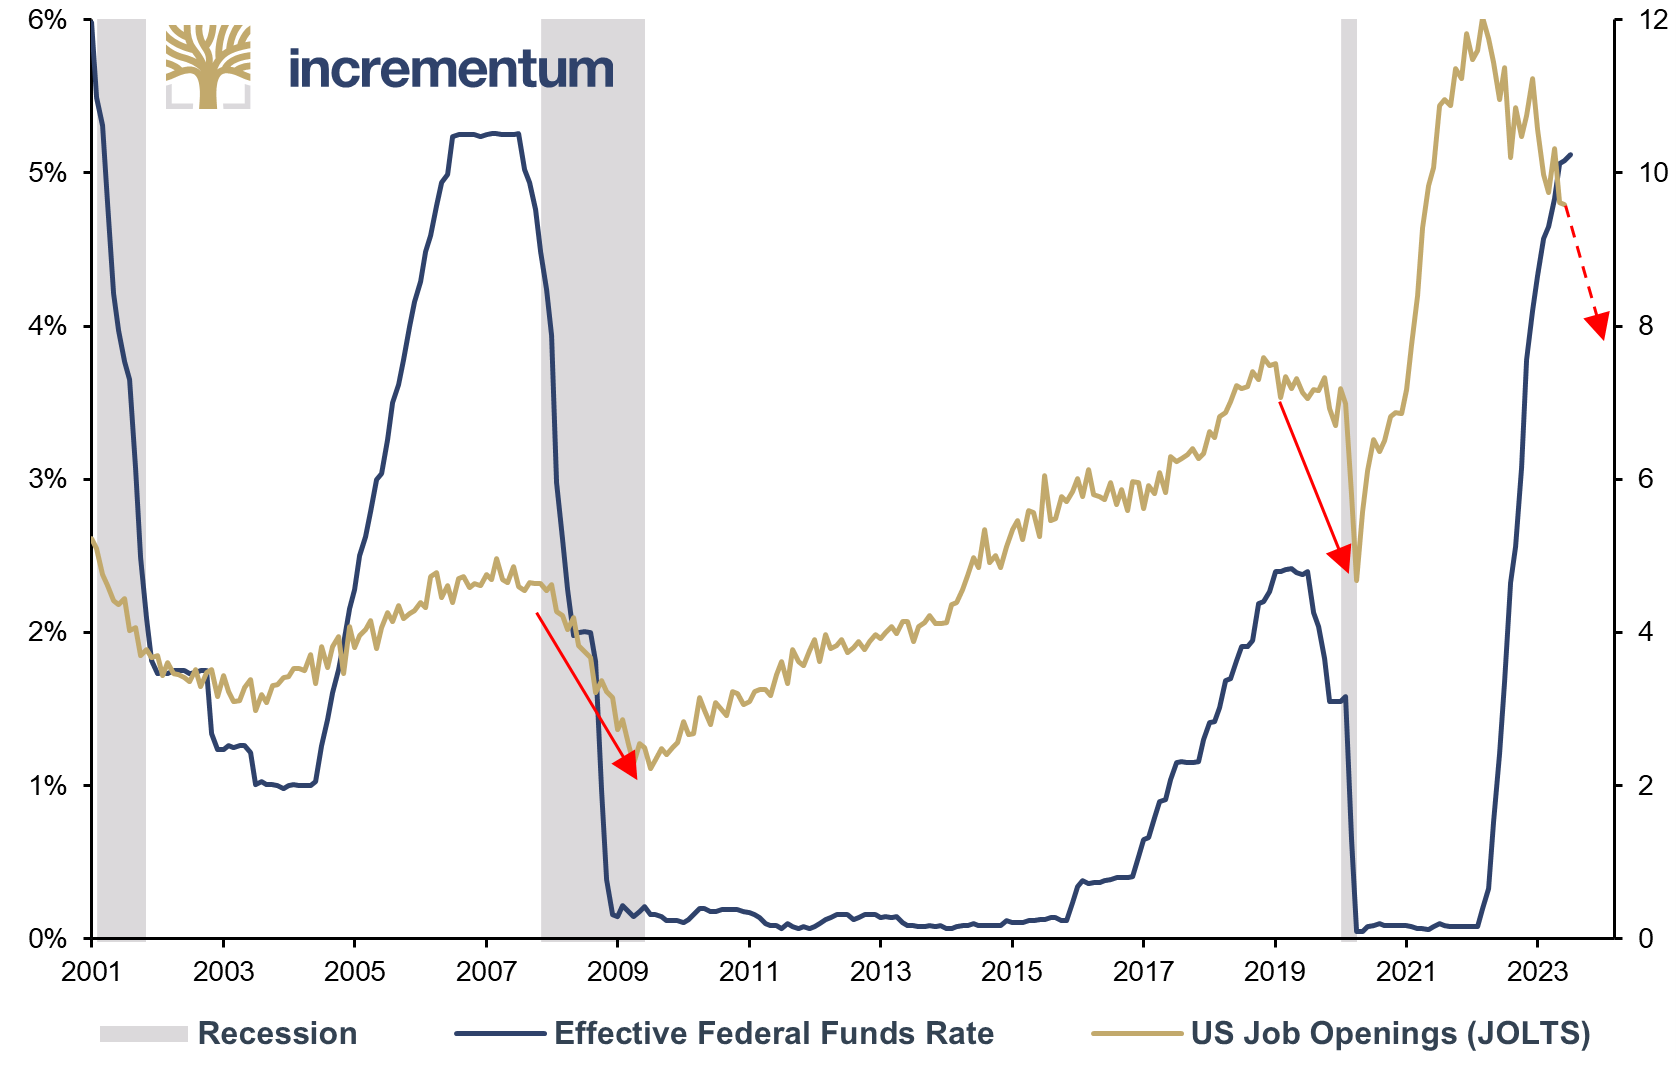
Source: BofA Global Investment Strategy, Reuters Eikon, Incrementum AG
Strategic Portfolio Adjustments
Be prepared for the pivot
Because we assume that the US economy, in particular, will soon slide into a recession (but not alone), the question for investors becomes, what impact could a recession have on their portfolio? After all, this is unfamiliar territory for many investors, as the US economy has slid into recession only four times in the past 40 years, with only the 2008/2009 recession lasting longer than a year, at 18 months.
In principle, the influence of interest rate developments on the stock market is well known. Increasing interest rates result in higher borrowing costs, which can dampen both investment and consumption. Consequently, companies may experience a decline in profits, leading investors to adopt a more pessimistic outlook. In the case of falling interest rates, this chain of events should logically run in the opposite direction.
However, central banks tend to lower interest rates only when the economy is weakening or has long since weakened. In such a situation, investors may become nervous and sell their stock holdings, which can lead to a decline in stock prices. Away from the model world, falling interest rates are not a positive indicator for the stock markets. Perhaps it is precisely this simple and toooften-observed cause and effect principle that explains why falling interest rates trigger feelings of happiness, rather than concern, among market participants.
Effective Federal Funds Rate (lhs), and Wilshire 5000 Total Market Full Cap Index (rhs), 01/1971-05/2023
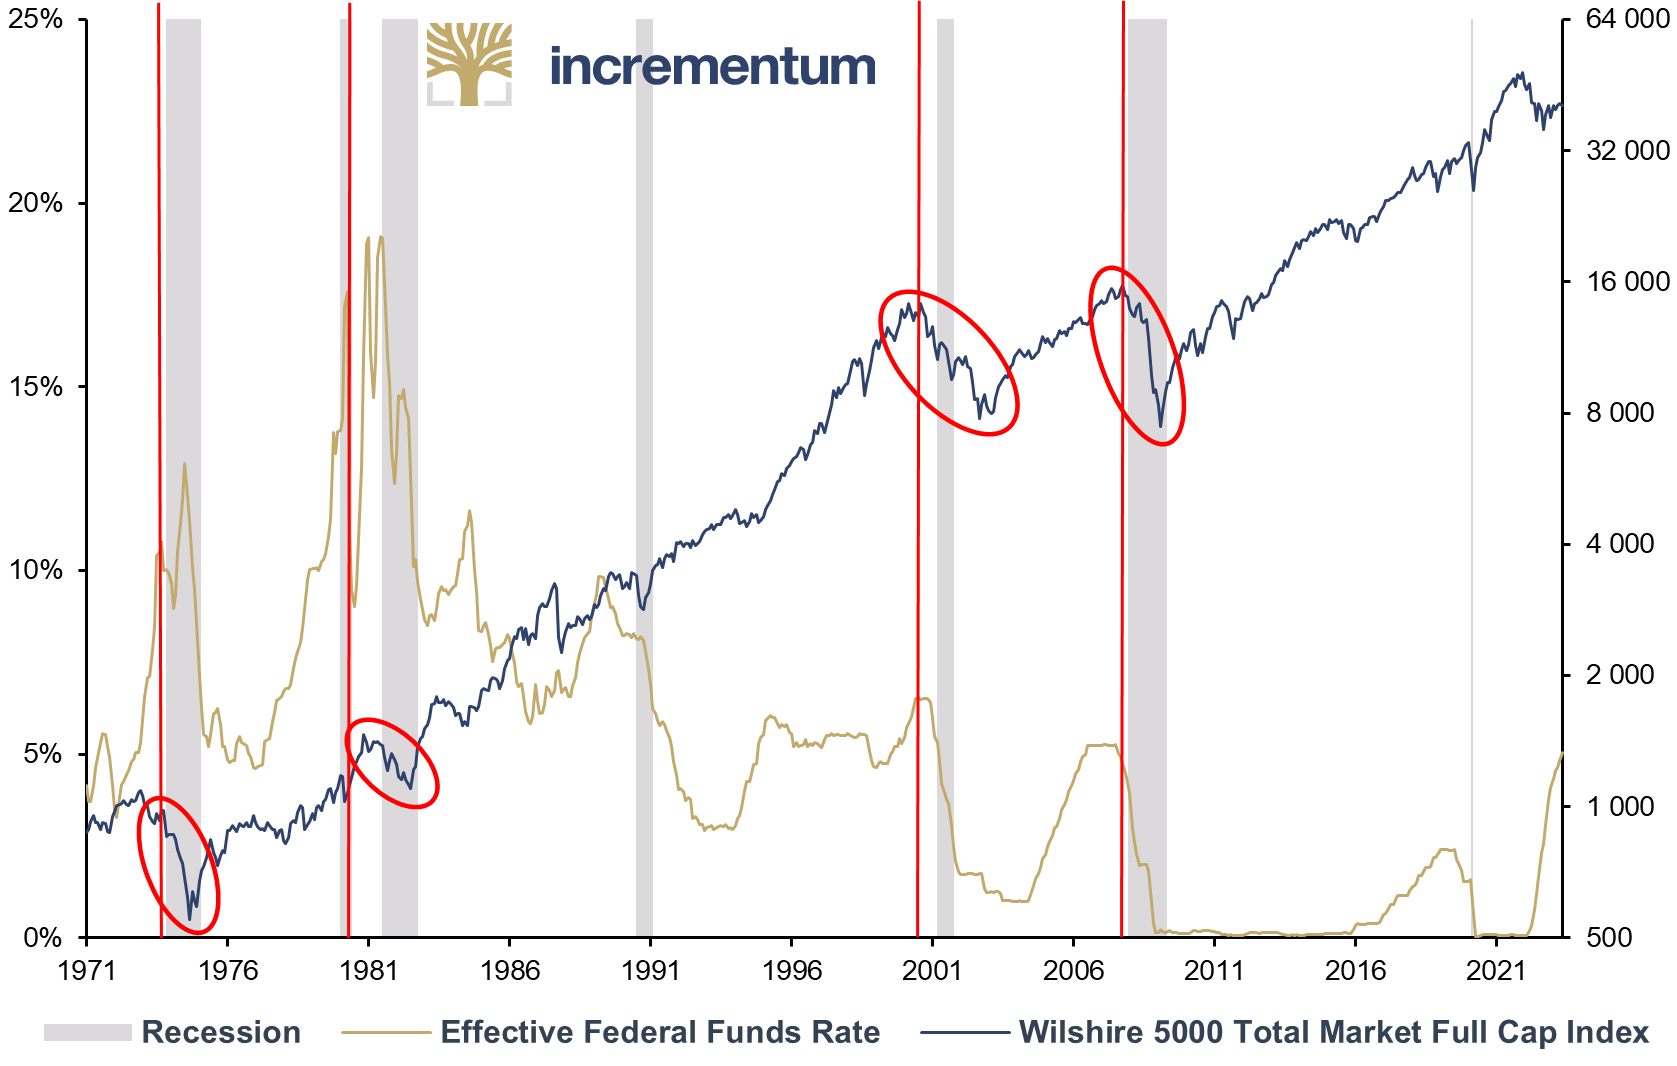
Source: Hussman Strategic Advisors, Reuters Eikon, Incrementum AG
As is so often the case, a look at the past reveals more than a glance at the textbooks, because in most cases this positive ceteris paribus effect of falling interest rates was not present in reality. Since 1960, the S&P 500 has lost an average of 28.4% in all major interest rate reduction cycles. At the current level of around 4,100 points as of May 12, this would indicate a decline to just below 3,000 points.
Federal Funds Rate (lhs), and S&P 500 (rhs, log), 01/1965-05/2023
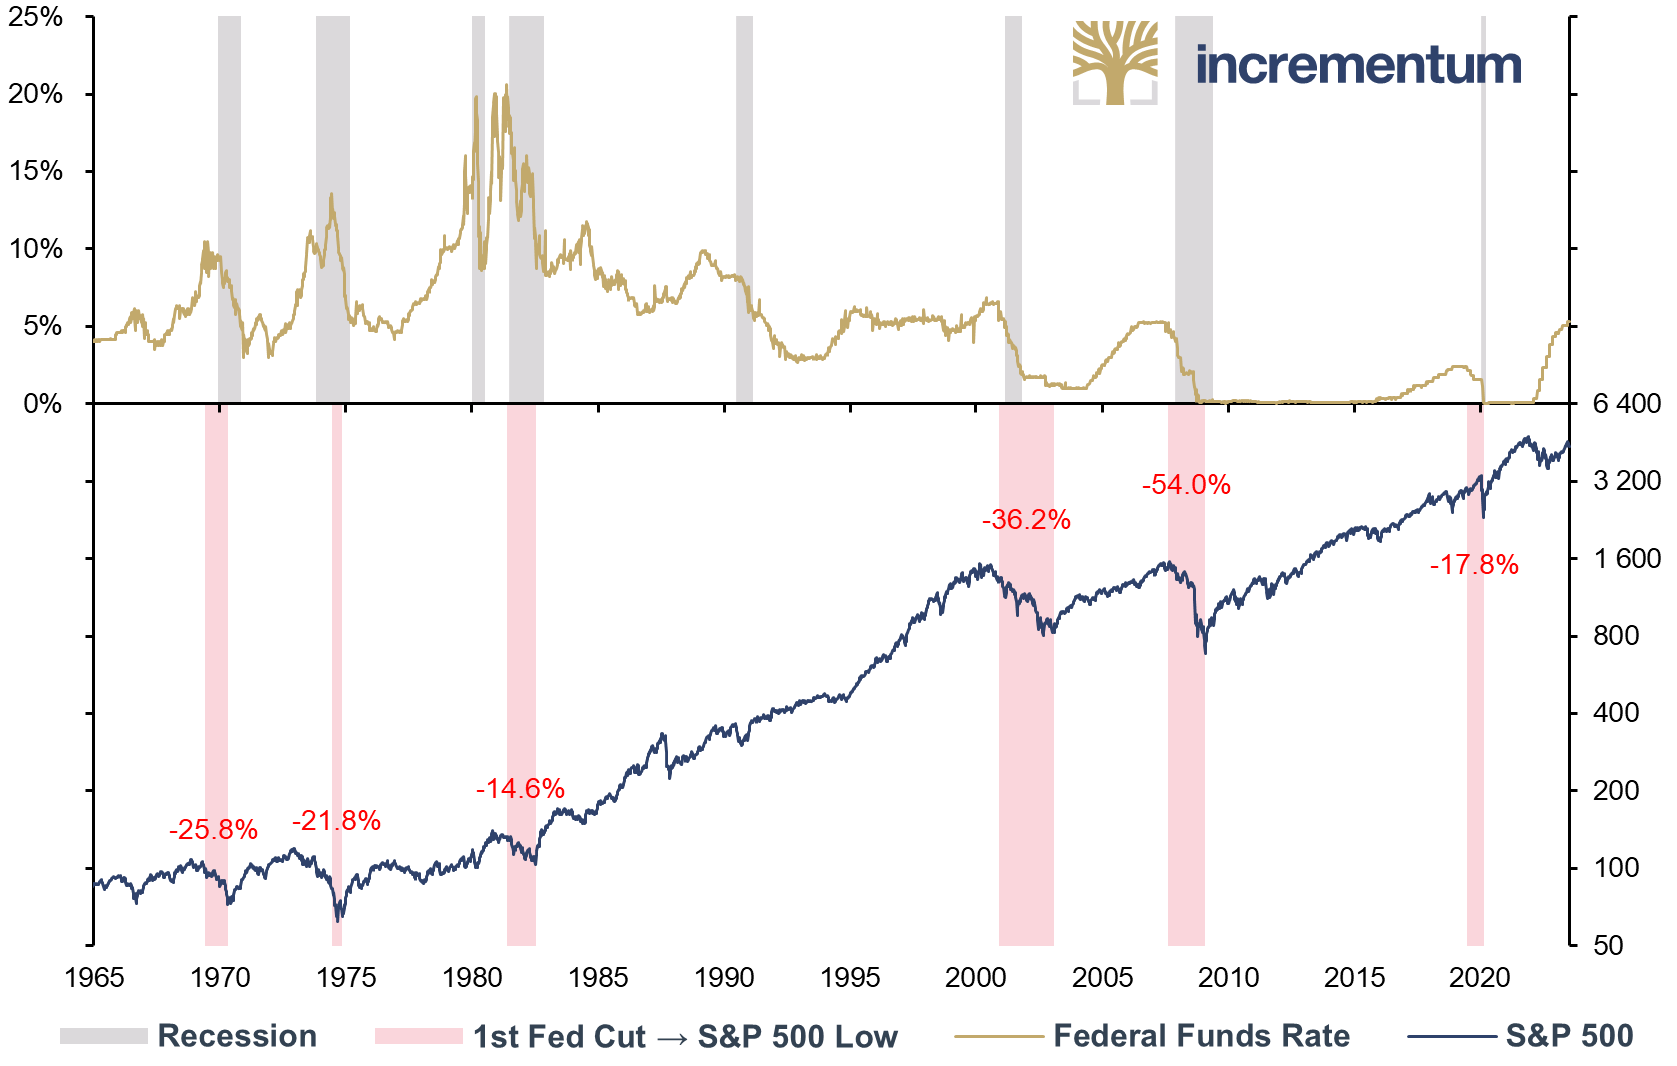
Source: Reuters Eikon, Incrementum AG
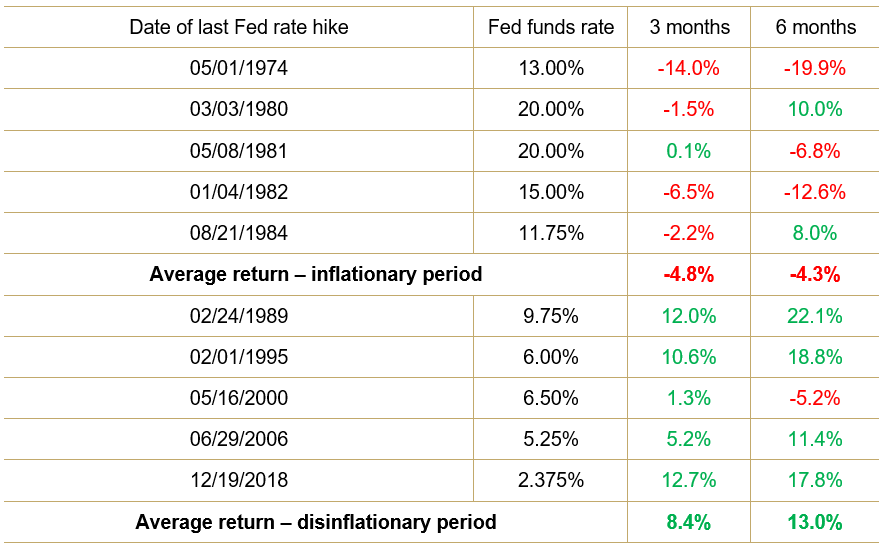
The following table supports this finding. It shows the returns of the S&P 500 three and six months after the last interest rate hike by the Federal Reserve, as well as the federal funds rate at the time of the rate hike. A distinction is made between inflationary and disinflationary periods.
S&P 500 Returns after Last Fed Rate Hike
Source: BofA Global Investment Strategy, Reuters Eikon, Incrementum AG
During the inflationary period, S&P 500 returns were negative in the three and six months following the last rate hike, averaging -4.8% (3 months) and -4.3% (6 months). During this period, the Federal Reserve was struggling with high inflation, so a similar balancing act between price value stability and recession avoidance had to be performed as is currently the case.
In the disinflationary period, S&P 500 returns were positive in the three and six months following the last rate hike, with a single exception, averaging 8.4% (3 months) and 13.0% (6 months). During this period, inflation was lower and the Federal Reserve’s rate hikes were merely preventive in nature to avoid overheating the economy.
This suggests that the development of inflation can fundamentally influence the dynamics of the pivot. With inflation rates currently remaining significantly elevated, the pivot could turn out to be a tempting apple for equity investors, one that appears flawless and juicy on the outside but is actually rotten to the core and inedible. After the last pivot – when inflation was not yet an issue – almost all asset values rose significantly, as the following chart shows.
Various Assets (lhs), and Bticoin (rhs), 100 = 01/04/2019, 10/2018-12/2019
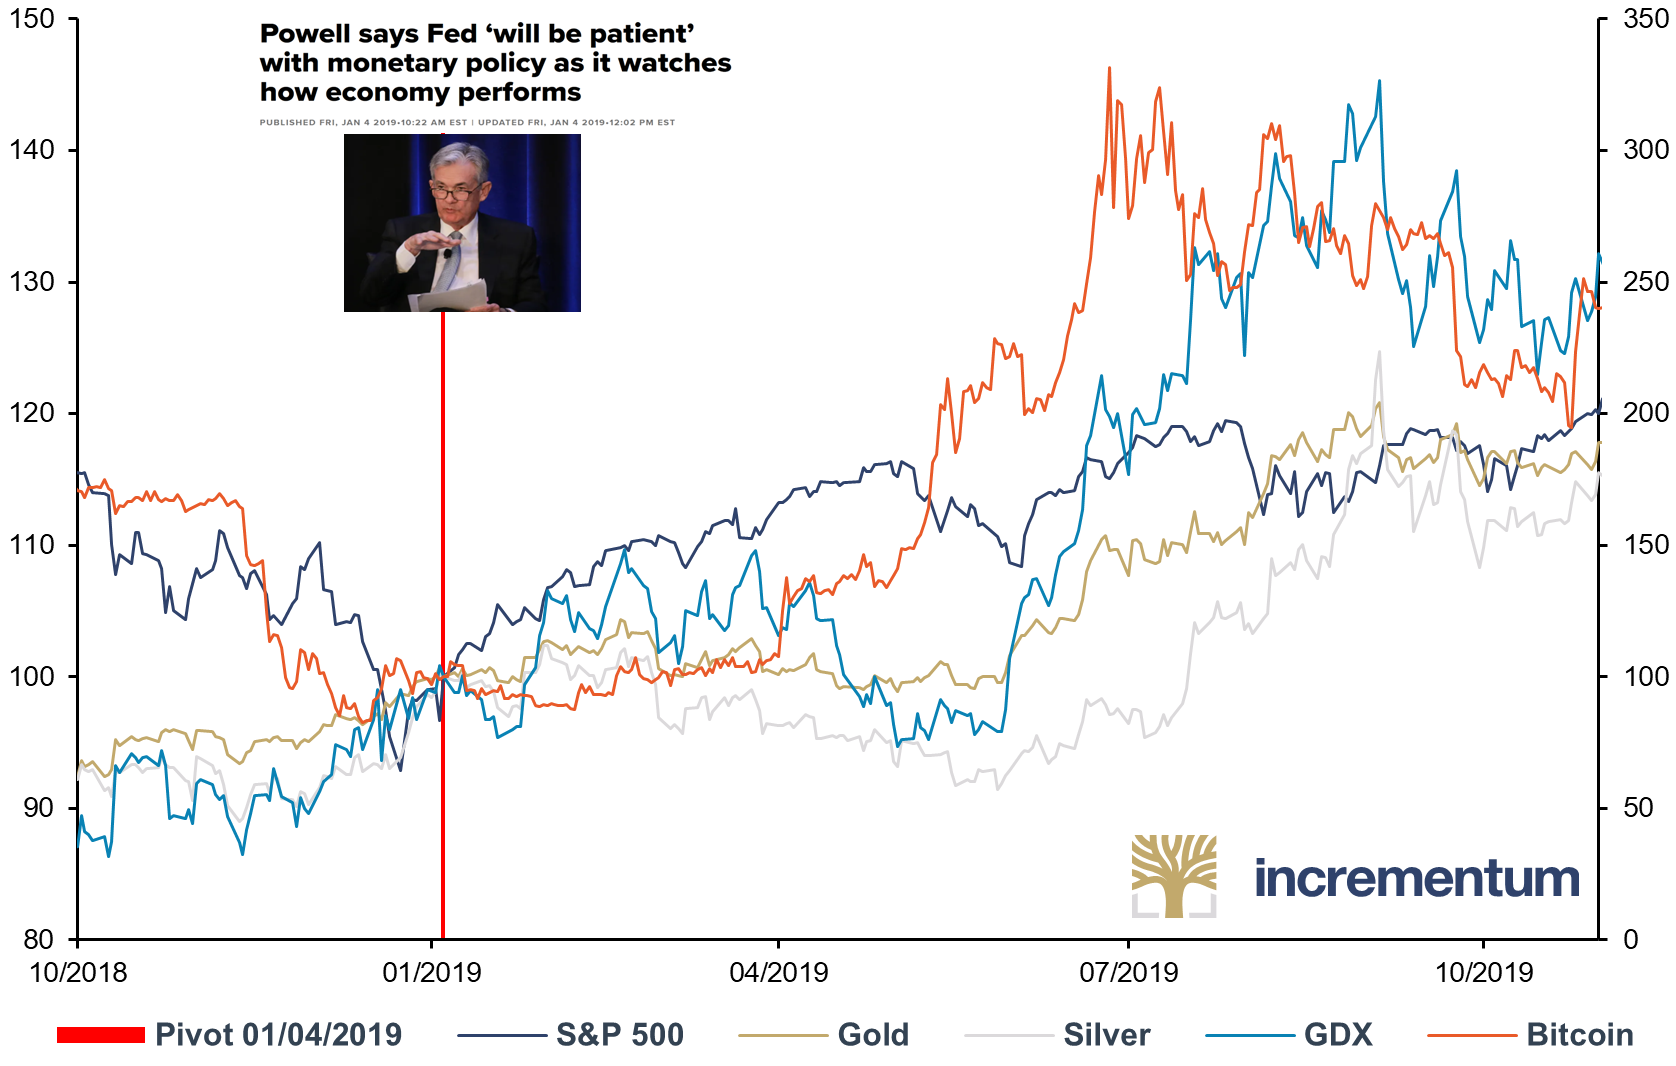
Source: Reuters Eikon, Incrementum AG
Be prepared for the recession
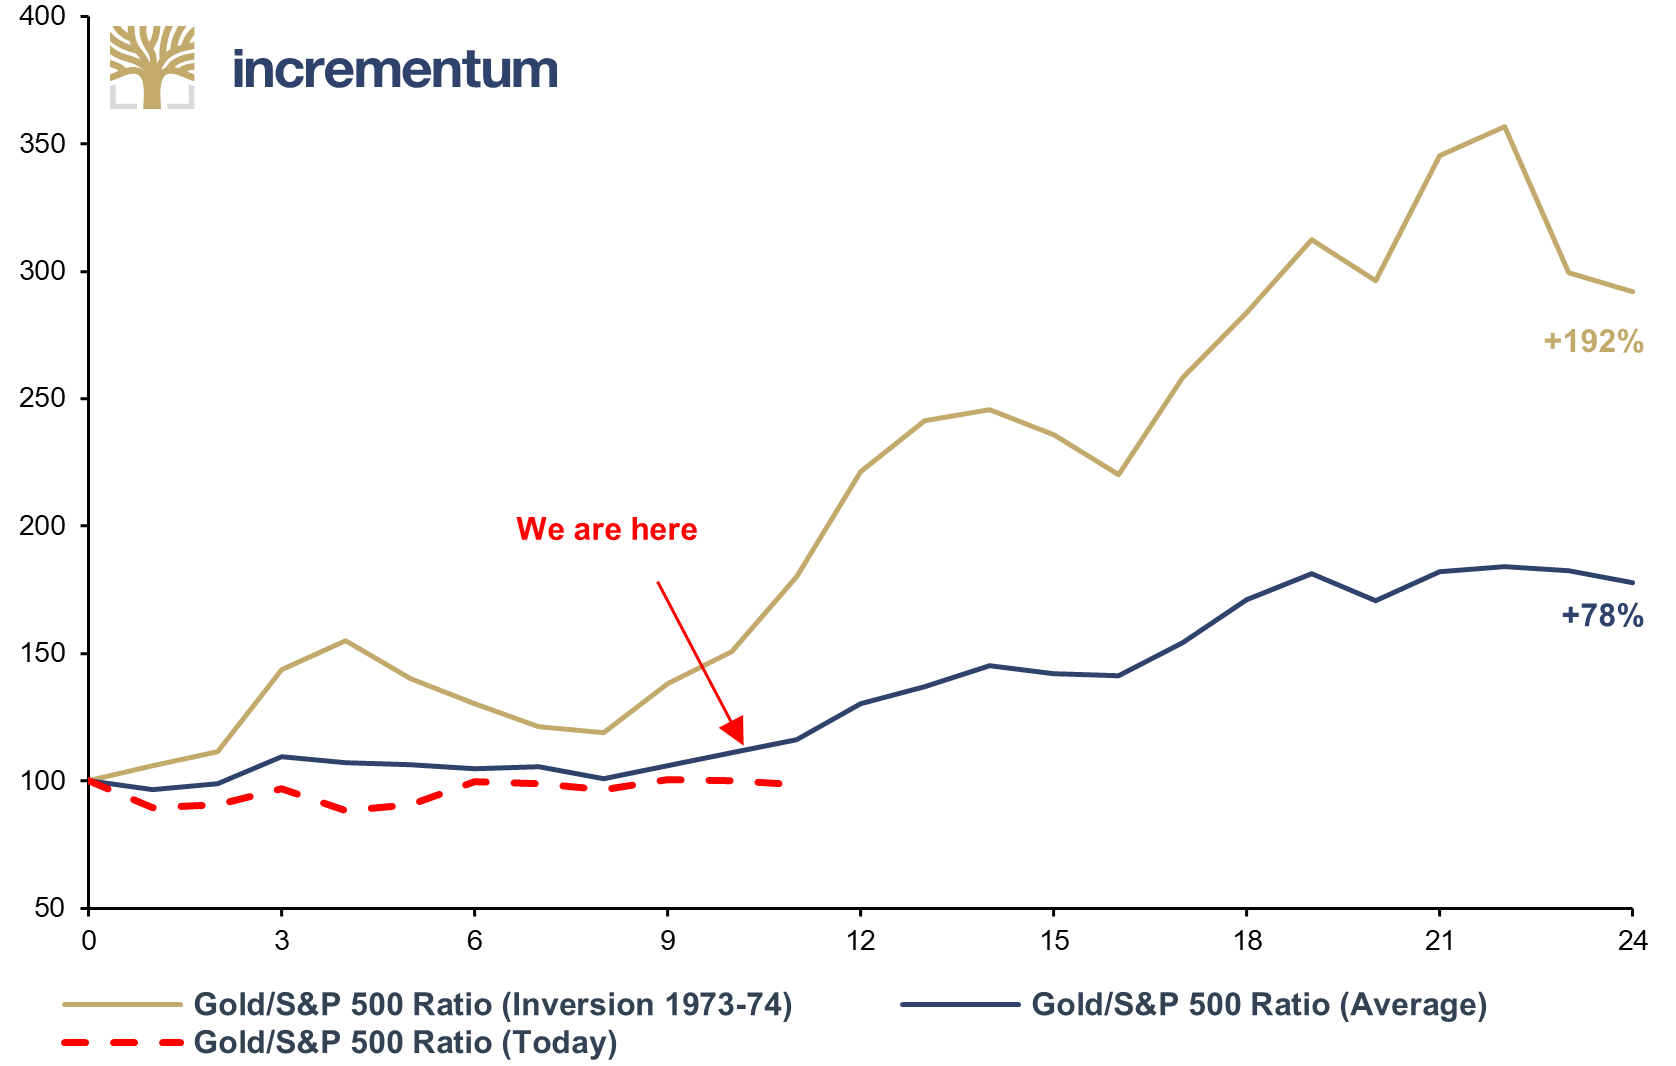
What can we expect from gold in this environment? Gold’s long history as an independent and stable store of wealth makes it a predestined recession hedge. Recessions and economic crises, in the view of the Austrian School of Economics, are inevitable events that occur due to business cycles or other external political as well as economic factors. And just as recessions are part of the business cycle, gold belongs – at least from our point of view – in every investor’s portfolio.
The following chart shows the development of the gold/S&P 500 ratio after an inversion of the 10Y–1Y yield curve. On average, the ratio increased by 78% 24 months after the first inversion in an economic cycle, indicating a sharp outperformance of gold relative to equities.
Gold/S&P 500 Ratio, Performance after UST 10Y-1Y Inversions*, 01/1971-05/2023
Source: Tavi Costa, Crescat Capital LLC, Reuters Eikon, Incrementum AG
*excl. inversion 2019 due to low intensity and duration
The Incrementum Recession Phase Model
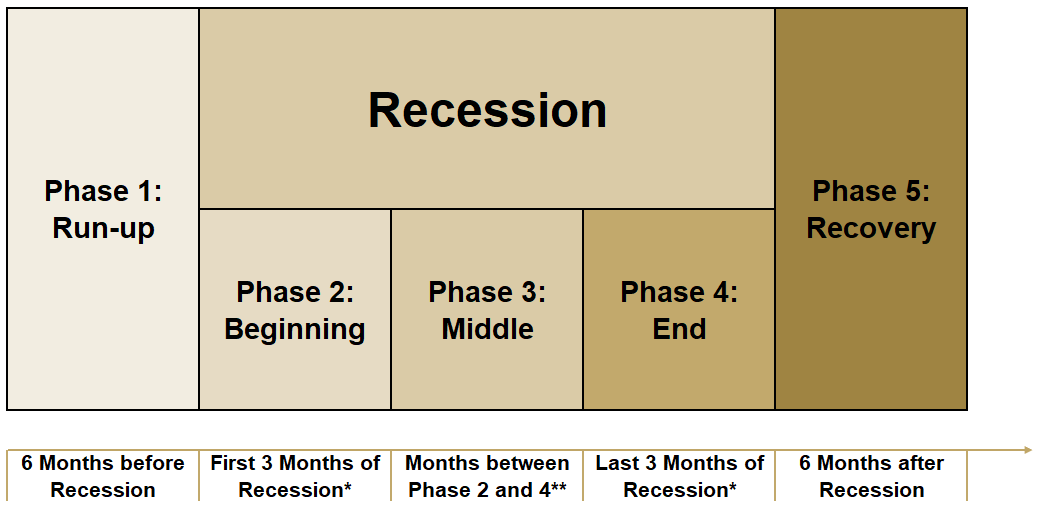
The Incrementum Recession Phase Model (IRPM) examines the performance of different asset classes during recessions. Unlike many other analyses that only look at the average performance of asset classes during the entire recession period, our Incrementum Recession Phase Model aims to help investors better adapt their investment strategies to the different phases of a recession.
The model divides a recession into five distinct phases, each with different characteristics. A detailed analysis of asset performance in each of these phases allows us to gain a better understanding of which asset classes perform best in which recession phase.
Incrementum Recession Phase Model
Source: Incrementum AG
*For short recession periods less than 3 months
** For recession periods with 6 or less months no Phase 3 is identified
- The run-up phase (phase 1) of a recession is characterized by burgeoning volatility on the financial markets. In this phase, the market increasingly starts to price in an impending recession.
- In phase 2, the so-called initial phase, there is a transition between increased uncertainty and the peak of the economic slowdown. In this phase, the slowdown in economic momentum can also be documented for the first time with negative macroeconomic data.
- In the middle phase (phase 3), the negative economic data manifest themselves. It also marks the low and turning point of the recession.
- In phase 4, the final phase, a stabilization of the economy gradually occurs, resulting in a return of optimism on the markets.
- In the fifth and final phase of the recession model, the recovery phase, the economy returns to positive growth figures.
In the case of a short recession, such as in 2020, there are phases that last less than 3 months, so phase 3 is irrelevant for recession periods of 6 months or less. In our recession phase model, we rely on the NBER definition[2] because it is the most common recession definition. Moreover, this definition is also followed by the Federal Reserve.
However, we are aware that a recession according to the NBER definition is always announced with a lag of several months. Similar problems arise with alternative definitions, such as the technical definition of a recession[3], where one has to wait for the publication of the final GDP quarterly figures. It is therefore of great importance to identify a recession at an early stage in order to position oneself as an investor in the best possible way. Dividing a recession into distinct phases can help minimize the risk of losses and maximize returns by helping investors develop a balanced portfolio strategy that aligns with the different phases of a recession.
Evaluation of the Incrementum Recession Phase Model
In this section, we will analyze the performance of the S&P 500 as a proxy for stocks and gold, and the BCOM Index, which serves as a proxy for commodities. In Chapter 15, we have also calculated the performances of silver.
The following table shows the performance of the S&P 500 during the various recession phases.
S&P 500 Performance in the Incrementum Recession Phase Model
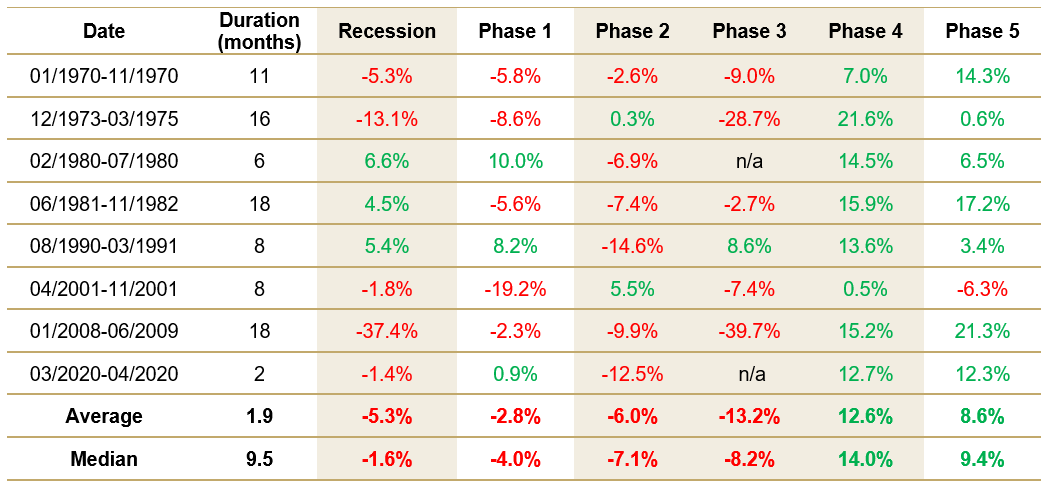
Source: Reuters Eikon, Incrementum AG
A view of the eight recessions since 1970 shows that equities lost an average of 5.3% in value. However, it should be noted that the Global Financial Crisis, an outlier, strongly distorts the average value downward. In comparison, the median value shows a negative performance of just -1.6%.
Interestingly, however, there were major differences within the recession phases in terms of the impact on equities. Particularly in the third phase, the peak of the recession, equities were hit the hardest. However, once the last three months of the recession (phase 4) were reached, equities recovered very well in all eight cases and continued this trend in the first months after the recession. Based on our Recession Phase Model, it is therefore recommended to reduce equity allocation early until the peak of the recession is reached to then benefit from the subsequent recovery rally. Let’s now look at the performance data for gold under the Recession Phase Model:
Gold Performance in the Incrementum Recession Phase Model
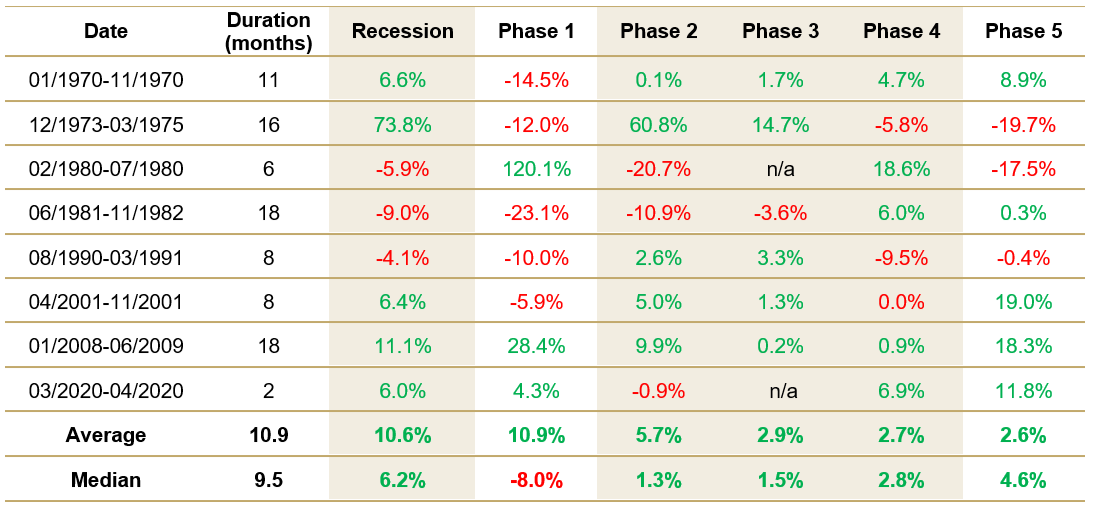
Source: Reuters Eikon, Incrementum AG
Unsurprisingly, and in line with its reputation as a recession hedge, the gold price rises on average 10.6% during a recession. It is particularly noteworthy that gold performs positively in all phases of the recession. In phases 1 and 2, the mean of gold price increases is the most pronounced, which is probably due to the fact that the markets are most uncertain during these phases. Another explanation for the strong average performance of gold in phase 1 is the 120.1% price increase in the initial phase of the recession in 1980, which is an outlier.
In the first three phases of a recession, gold tends to outperform equities. However, as soon as the first signs of an economic recovery emerge and most of the market uncertainty subsides, the balance of power usually reverses and equities can outperform gold in the final and recovery phases. Consequently, the table shows that gold can be a suitable recession hedge, especially in the early stages of the model, providing excellent diversification and stabilizing portfolio performance in turbulent economic times.
In the following section, we would like to examine whether there are certain phases during a recession when commodities perform particularly well and whether they can be employed profitably in a portfolio during economic slowdowns.
Commodity (BCOM) Performance in the Incrementum Recession Phase Model
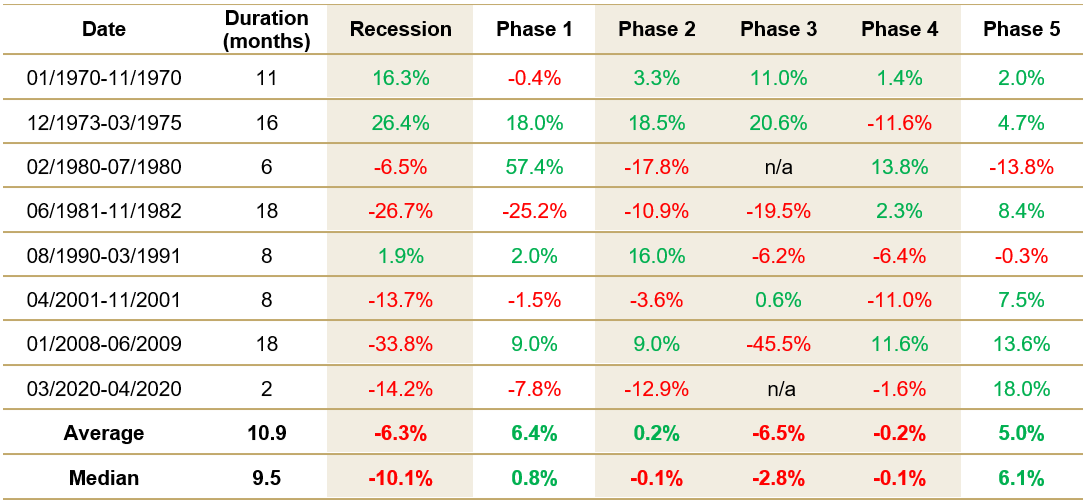
Source: Reuters Eikon, Incrementum AG
The average recession performance of the BCOM Index since 1970 is clearly in negative territory at -6.3%. Thus, in our analysis, commodities perform worse than equities in the overall view. However, a closer look at commodities also reveals clear differences in each phase of a recession. While commodities post gains in phase 1 (lead phase) and phase 5 (recovery phase), there is no discernible trend in phase 2 (start phase) and phase 4 (end phase). The negative performance thus largely occurs in phase 3 (middle phase), i.e., when the economy reaches its low.
From a portfolio perspective, according to our analysis, overweighting commodities in the run-up to and recovery phase of a recession proves to be prudent. Theory supports this finding and suggests that precious metals, and gold in particular, are suitable as a hedge against uncertainty before the peak of a recession. Energy and base metals also prove beneficial due to the reflationary effect of picking up growth after the peak of a recession.
Conclusion
The most-anticipated recession is still stubbornly waiting to happen. On the one hand, this is related to the growth spurt in connection with the postCovid-19 reopenings, which is only slowly subsiding. Also, the horror scenarios of summer and fall 2022, when energy prices skyrocketed, have not materialized. On the other hand, the ascendance of fiscal policy as an expression of monetary climate change, which we analyzed in detail in the In Gold We Trust report 2021, is also a contributing factor. Fiscal policymakers are thus taking over the role of central bankers by injecting liquidity into the markets through significant transfer payments to households and companies.[4] In our view, this behavior is not sustainable, because it merely postpones the recession – at the cost of continued monetary devaluation, which will ultimately most likely end in stagflation.
This dynamic is also underlined by the latest published data on economic growth and the core inflation rate in the USA. In the first quarter, real US GDP grew by only 1.1% annualized, which was clearly below expectations. On the other hand, the core PCE rate remains stubbornly high. Since the March 2022 high of 5.3%, it has so far only fallen to 4.6%, a much weaker decline than that of headline inflation.
The longer we wait for the recession to arrive, the worse it could be when it finally does. This is due to the Federal Reserve’s ability to uphold its hawkish policy stance for an extended period, which will cause the economy to slide deeper into recession because, on the one hand, liquidity and financing conditions will have remained restrictive for a longer period and, on the other hand, it will take longer for the pivot to take effect and reach the real economy. Following the most drastic surge in interest rates in nearly four decades, the pressing question emerges of when and how swiftly the Federal Reserve will execute its monetary policy U-turn in order to address the ongoing weakening of the economy.
Fed Rate Hike Cycles, Federal Funds Rate, 1967-2023
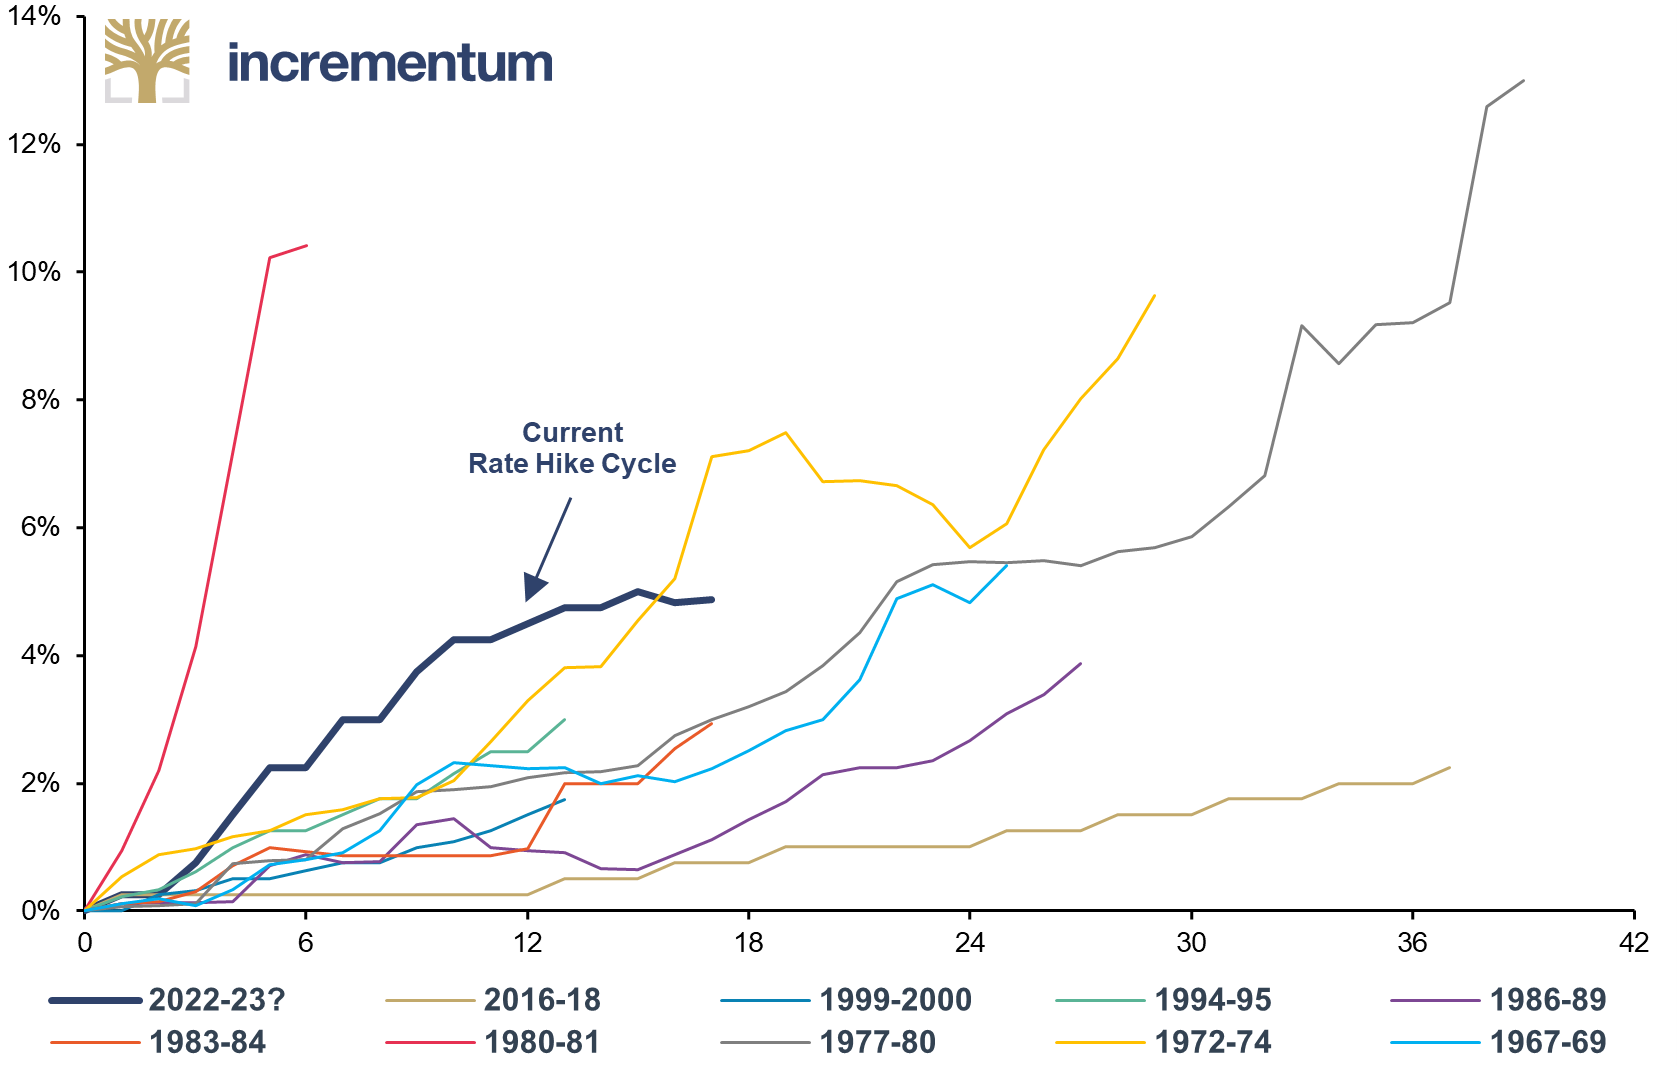
Source: Federal Reserve St. Louis, Reuters Eikon, Incrementum AG
But a recession is a necessary process that corrects undesirable developments in economic growth. It leads to a restructuring of the production process, adjustment of prices to actual consumer preferences, and correction of misallocations. The longer this process is delayed, the more painful it becomes.
Particularly in the context of the upcoming US elections next year, the Democrats will very likely strive to avoid a recession. This could lead to fiscal policy measures – in line with the whatever it takes mentality that has come into vogue – that further delay the inevitable adjustment process. However, the constraints on room to maneuver are inexorably increasing and the options for postponement are dwindling. To resolve this dilemma between short-term voter favor and long-term economic stability, those responsible must finally live up to their name.
The approaching recession, washed up by the wave of inflation, may not be too far off, as the following table shows. Four leading economic indicators have consistently predicted every recession so far – and currently, all of them are signaling a recession again.
History of Selected Recession Indicators and Current Status
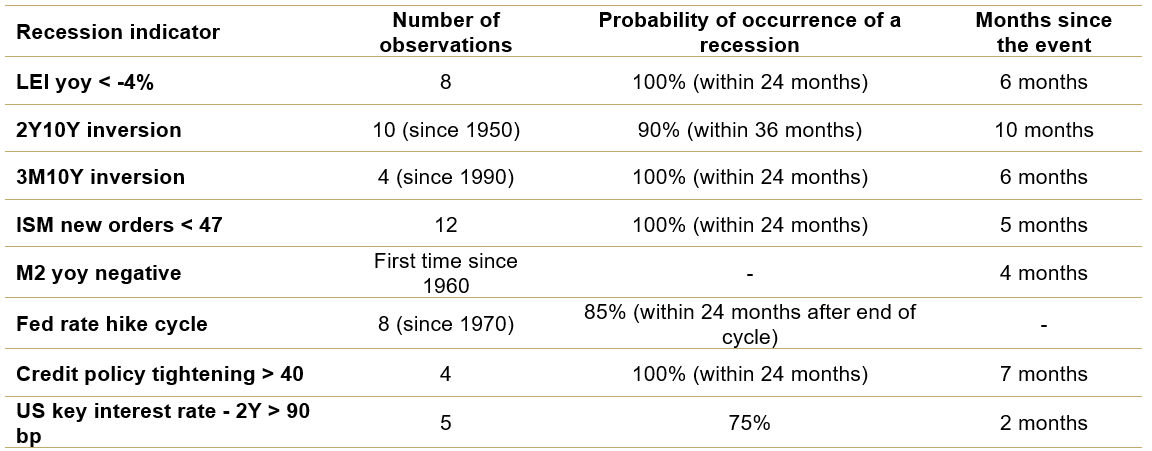
Source: BofA Global Research, Incrementum AG
Particularly worth mentioning in this context is the Leading Economic Index (LEI), which combines 10 leading indicators and is designed to predict the dynamics of the economy for the coming quarters. It can thus be seen as a comprehensive and weighted recession indicator.
Conference Board Leading Economic Index (LEI), yoy, 01/1960-03/2023
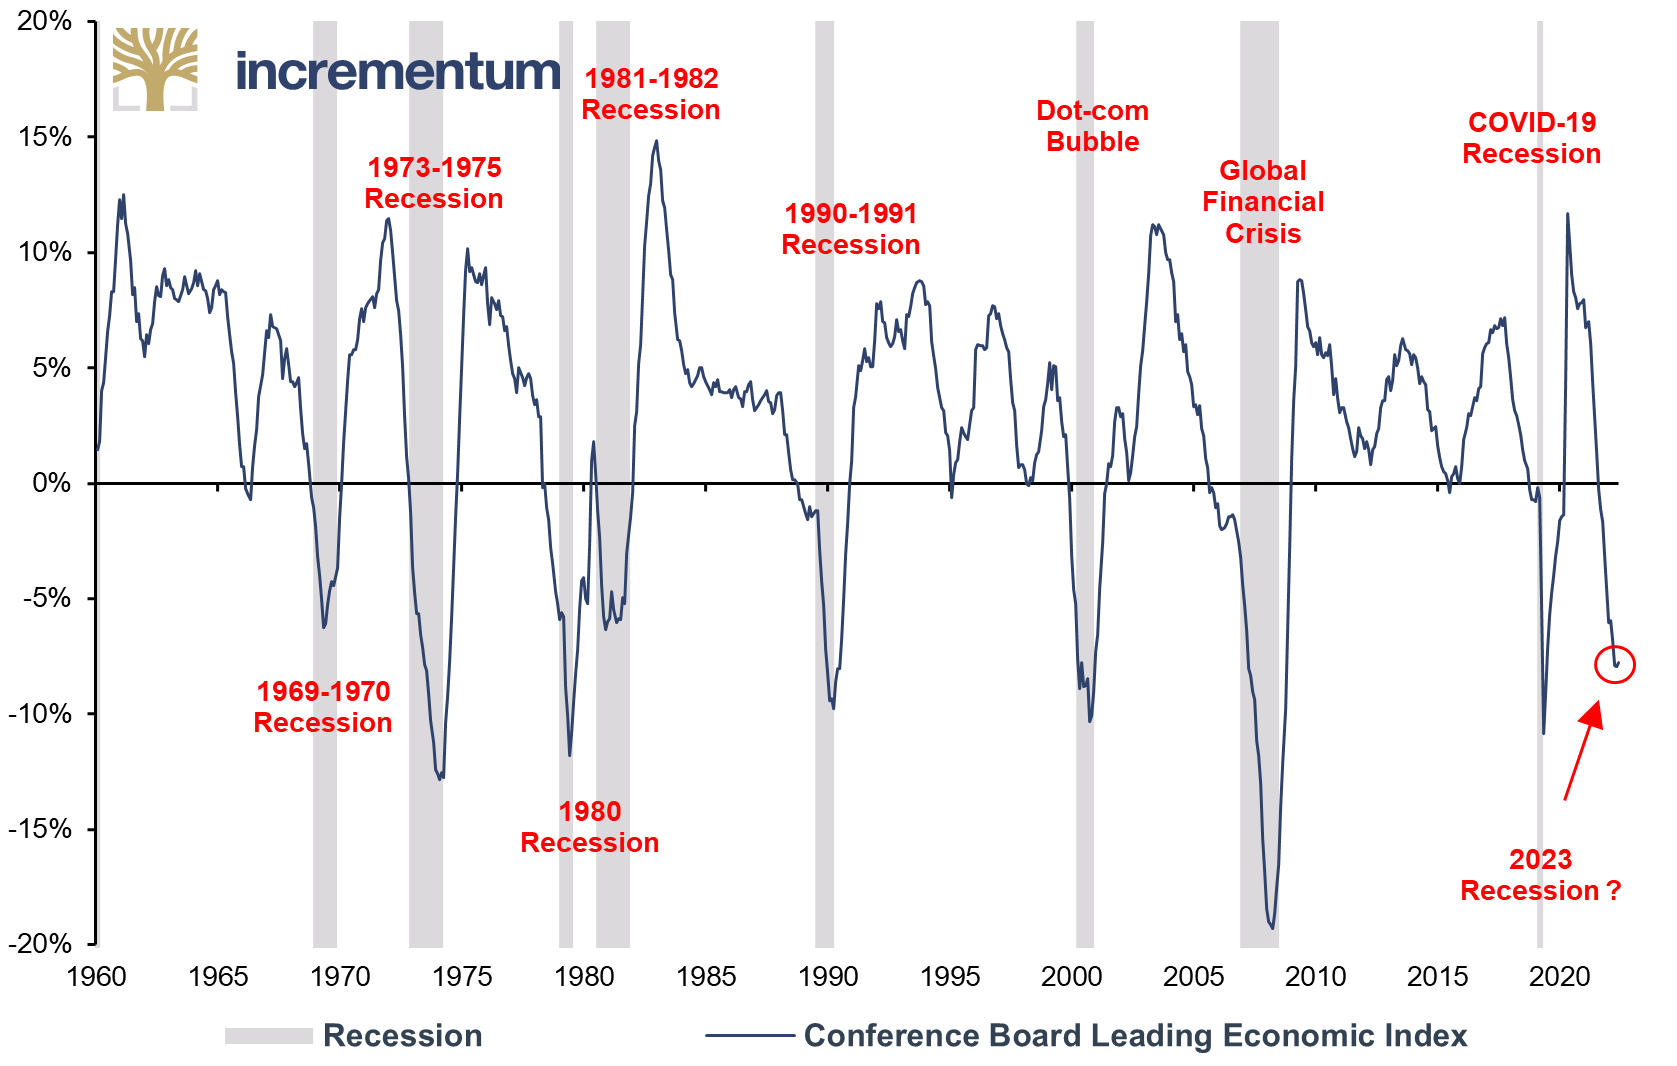
Source: Reuters Eikon, Incrementum AG
The index has now fallen for 12 consecutive months and is at its November 2020 level. A 7.8% year-over-year decline has historically signaled a recession. In total, there have been eight recessions since 1960, in which the LEI peak averaged 14 months before the recession began. The median is 11 months.[5] The LEI successfully predicted all eight of these recessions. The current index peak is dated December 2021, making it 17 months since the last index peak. A recession would therefore appear to be overdue. Additionally, in terms of its magnitude, the annual change rate of the LEI is currently at -7.8%, which is lower than its average value before a recession (-4.7%).
Even though black swan events, i.e. unpredictable events, shake the markets time and again, it is important to prepare meticulously for foreseeable events and to develop a strategy. In this case, from an investor’s perspective, there are two events in particular that are in focus and present challenges: the upcoming central bank pivot and an impending recession.
The Incrementum Recession Phase Model provides valuable insights and helps in deciding how best to act in each of the five recession phases to make the portfolio more resilient to economic downturns. Evaluation of our model for equities, gold, and commodities shows that asset performance can sometimes diverge significantly in each of the five recession phases.
Gold clearly stands out as a recession hedge. In all phases, gold was able to gain on average. However, the average gold performance gradually declines as the recession progresses. Towards the end of the recession, it is commodities and, above all, equities that benefit from the waning recession or recover their losses, which in both cases are largely suffered in the middle phase of the recession.
Average Performance of S&P 500, Gold, and BCOM in the Incrementum Recession Phase Model, 1970-2023
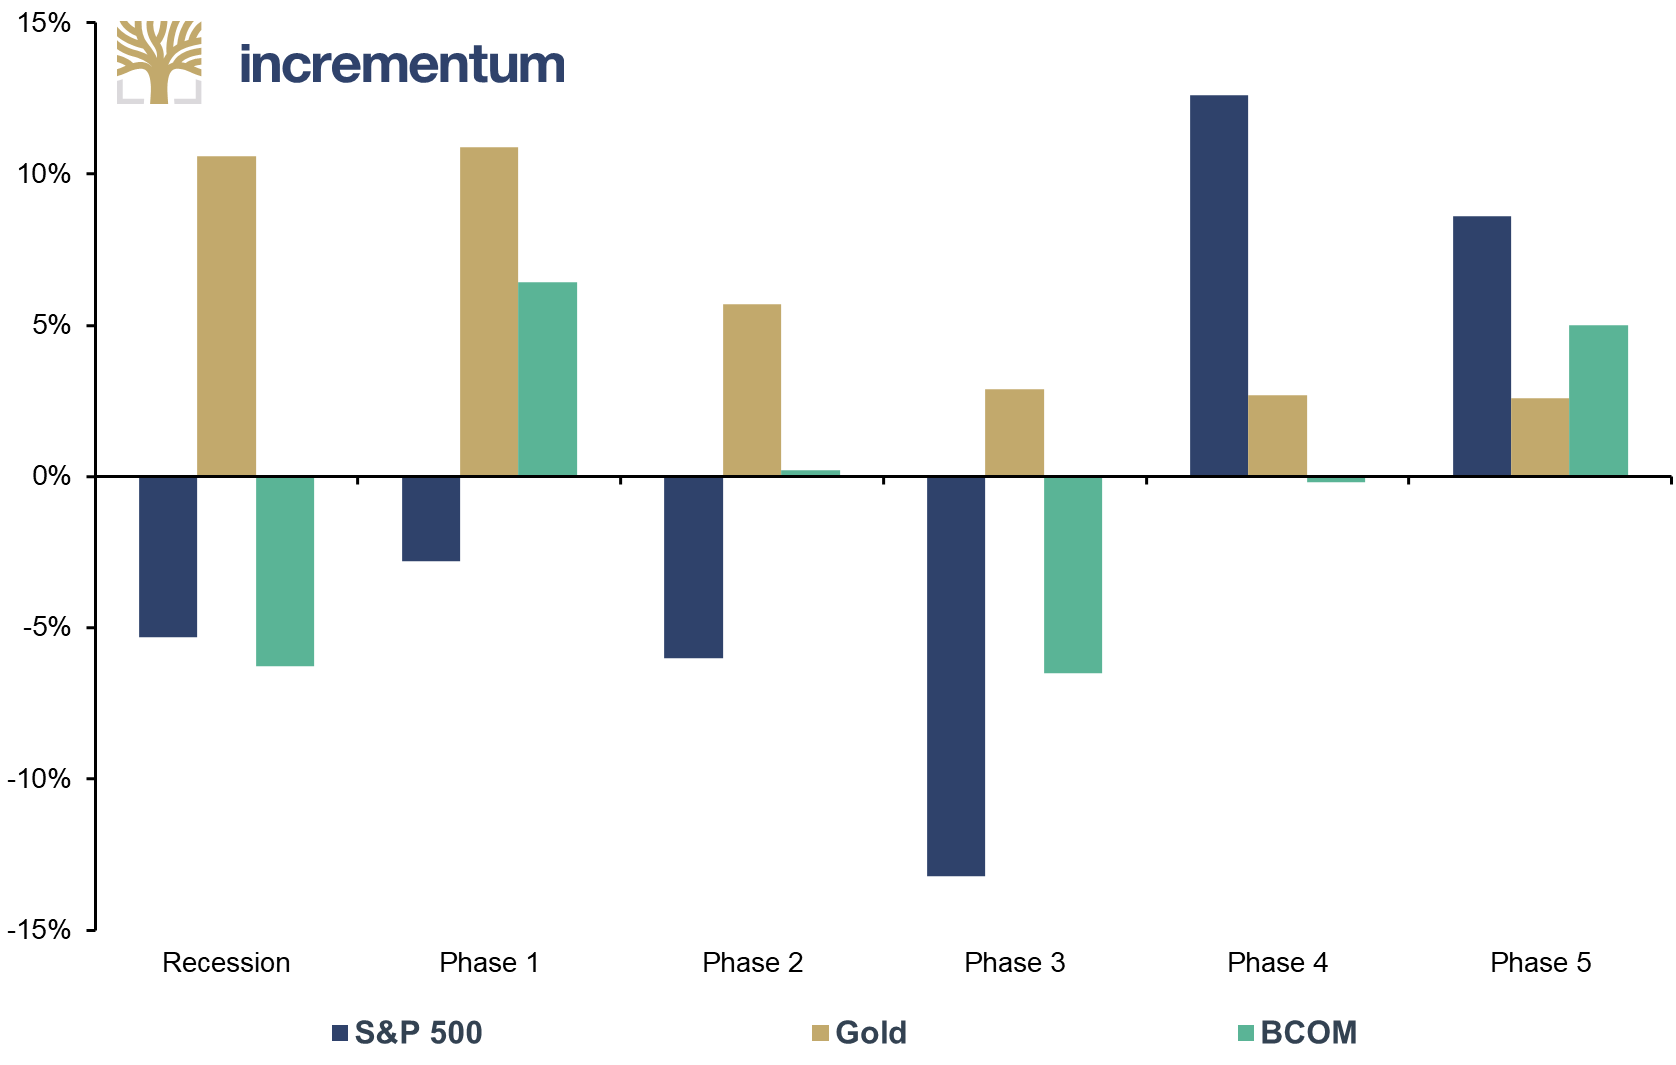
Source: Reuters Eikon, Incrementum AG
[1] „Stagflation 2.0,“ In Gold We Trust Report 2022, p. 110
[2] The NBER‘s definition emphasizes that a recession involves a significant decline in economic activity that extends across the economy and lasts for more than a few months.
[3] A technical recession occurs when an economy records two consecutive quarters of negative economic growth.
[4] See the short version of our interview with Russell Napier in this In Gold We Trust report: “Exclusive interview with Russell Napier: Save Like a Pessimist, Invest Like a Pessimist”. The long version of this interview is available here; and “Yield Curve Control, the Biggest Mistake of the ECB So Far! – Exclusive Interview with Russell Napier,” In Gold We Trust report 2021
[5] See “Breakfast with Dave,” Rosenberg Research, April 21, 2023