The Akuma Afterglow: Japanification of the West?
„It feels the same / But time takes a toll on this buried flame / Lift me up, say my name.“
Soilwork
- Contrary to popular belief, Japan’s economic challenges started before the 1987 crash, as issues were already accumulating within a deeply ingrained quasi-centralized credit-allocation system.
- While the Eurozone and the US share similarities with the Japanese economy, it is important to note that the Eurozone and Japan are positioned on the production-based side, while the US is positioned on the consumption-based side. As a result, the US might face more inflationary consequences in the event of a resurgence of loose monetary policy.
- The implementation of potential yield-curve control and a resurgence of quantitative easing aimed at stimulating production to facilitate the green transition is anticipated to result in a prolonged period of elevated inflation. A scenario akin to Japan’s experience lacks solid support upon more profound analysis.
- A resurgence of loose monetary policy is expected to sustain the recent trend of increasing demand for gold as a hedge against inflation. This environment is also likely to favor tangible assets, potentially resulting in a real loss for government bond investments.

Fabian Wintersberger
Fabian Wintersberger, a trained economist, serves as a rates trader at an Austrian regional bank. Through his weekly newsletter, ‘The Weekly Wintersberger‚, he offers insightful analyses of financial markets and economic events rooted in the Austrian tradition.
Within Japanese folklore there’s a creature called Akuma, a demon or evil spirit. It’s a bizarre animal, with a huge flaming head and glowing eyes that brings harm and misfortune over people. The Japanese attribute mental illness to the presence of Akuma. Hence, when a person is in such a state of mind that causes it to engage in impulsive, risky behavior, Japanese say it’s surrounded by Akuma.
At times, an action may not immediately appear to be insane, and its true nature may only become evident over time, much like the subtle effects of certain central bank strategies. Regarding modern central bank policy, consider Japan’s experience: Despite the employment of numerous asset purchase programs and the capping of long-term interest rates, the dire consequences often associated with such measures, such as misallocations and inflation, allegedly failed to materialize. Consequently, warnings about following Japan’s lead are often dismissed with the rationale that it was not so bad for Japan, so it will not be bad for us.
With regards to the further direction of economic and monetary policy in the US and the Eurozone, discussions have abounded on whether the Western world will emulate Japan’s economic trajectory. Post-2008, the Federal Reserve and ECB initiated quantitative easing, akin to the Bank of Japan’s earlier measures amidst its prolonged economic slump. Over the past decade, parallels have emerged between the Eurozone, US, and Japanese economic paths.
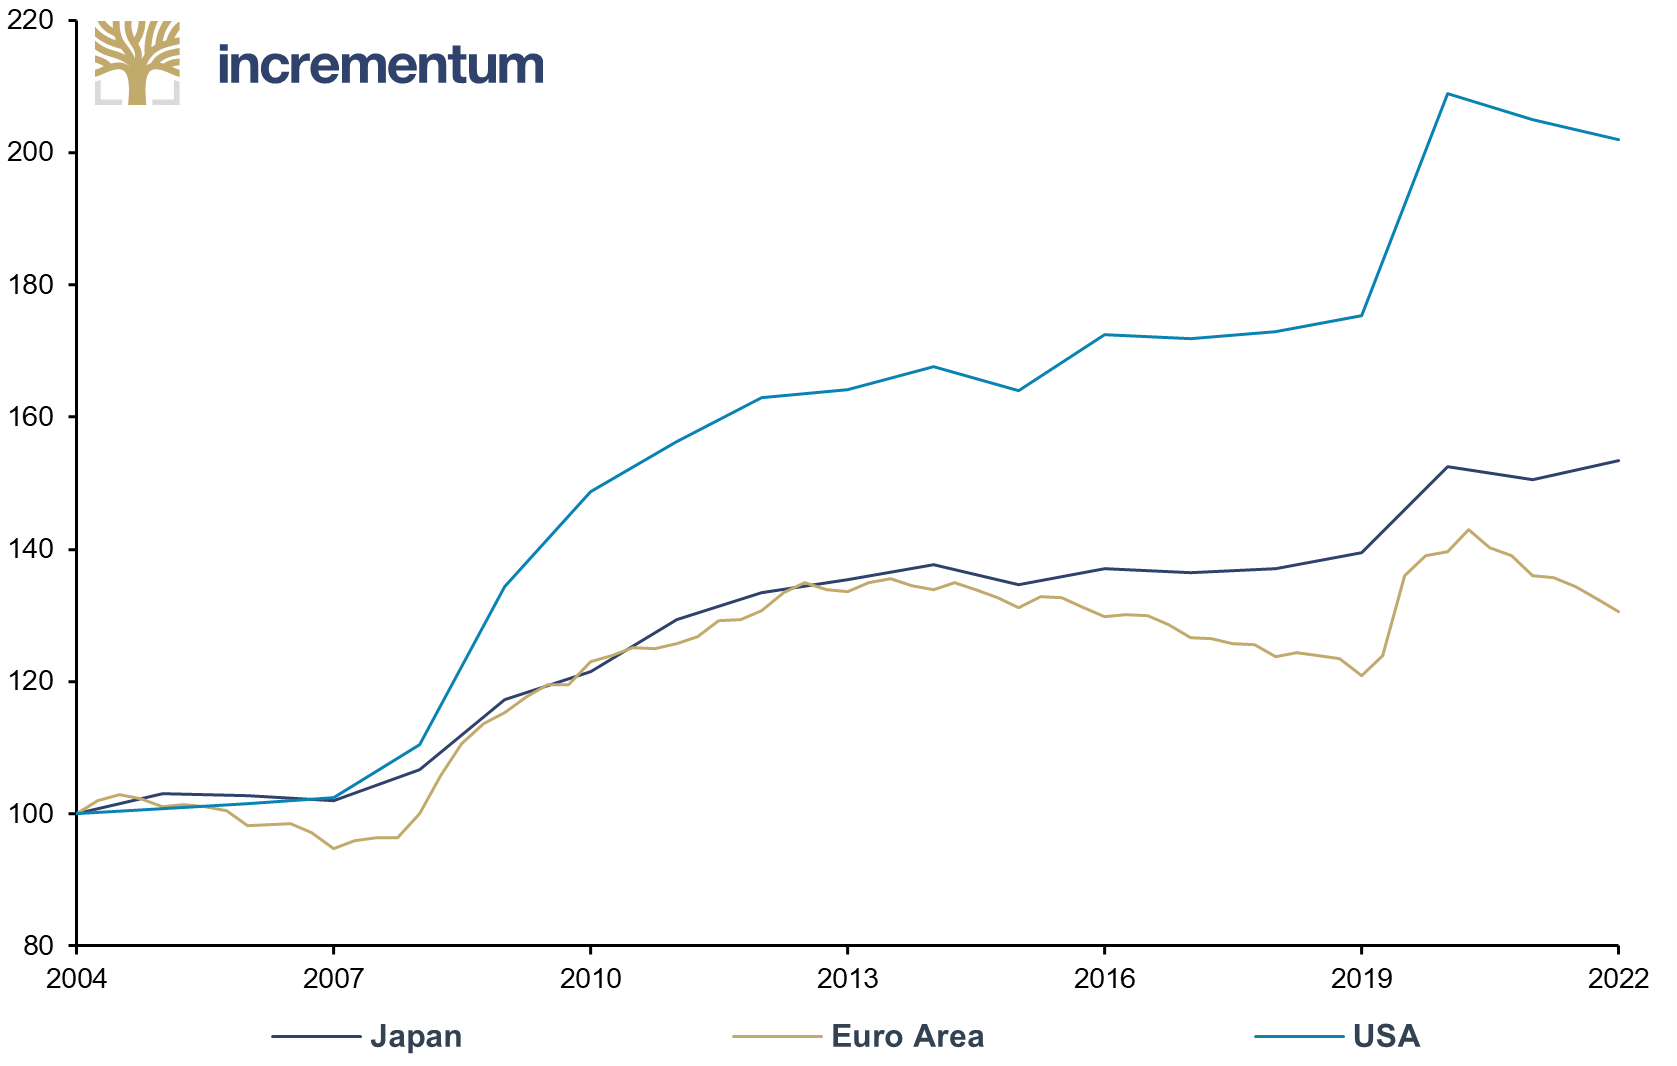
The landscape shifted in 2020, when at the outbreak of the Covid-19 pandemic, governments injected record funds into the economy, accompanied by looser monetary policies, resulting – surprisingly for many – in a resurgence of inflation in the Eurozone and the US, while inflation remained benign in Japan.
CPI/HICP, yoy, Japan, Euro Area and USA, 01/2018–03/2024
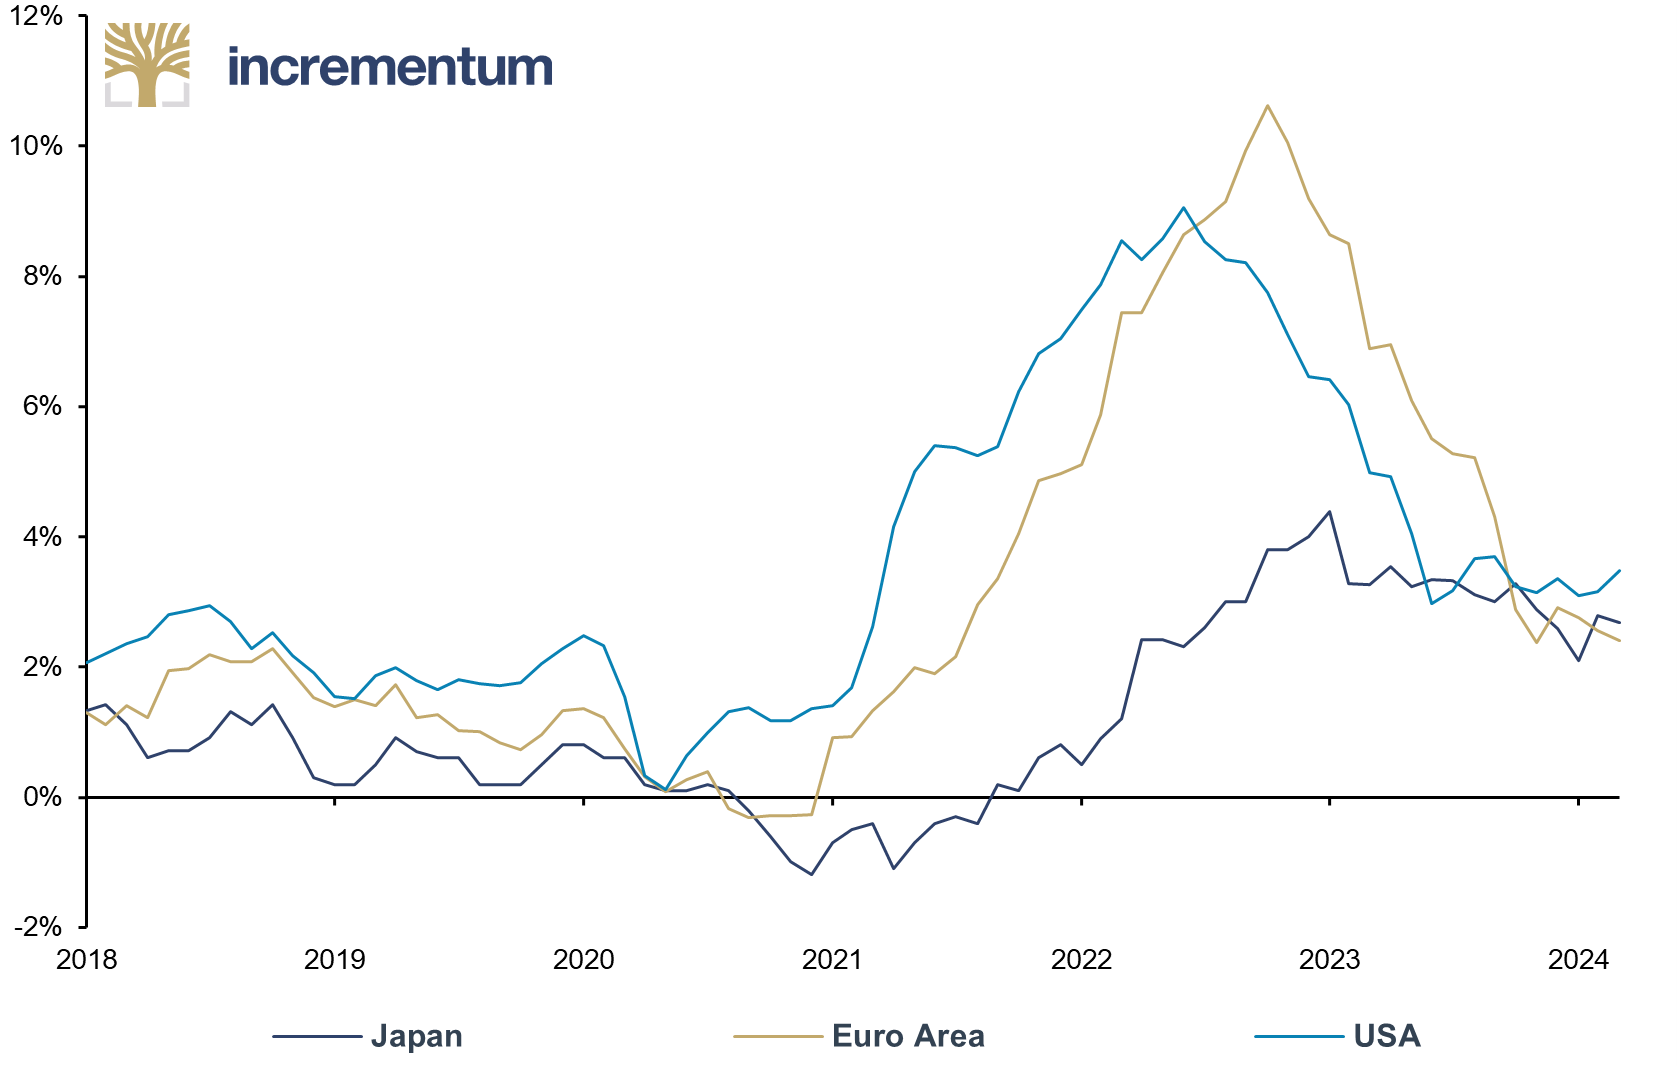
Source: Reuters Eikon, Incrementum AG
Although inflation has dropped substantially due to tightening policies by the ECB, the obvious questions are whether the era of higher inflation has now passed and whether the Eurozone and the US will return to economic stagnation and deflation. Will the Eurozone and the US face Akuma, the evil spirits that Japan has encountered, again, or will history make another, unexpected turn?
The Case of Japan
Usually, a movie features the main character fighting to prevail. Our story, however, is less optimistically heroic, with the main character suffering endless difficulties and the viewers witnessing setback after setback in sequel after sequel. For Japan, the sequels are never-ending, it reminds us somewhat of The Fast and the Furious.
In the early 1980s, Japan was considered the poster child of the world economy, enjoying high economic growth, a solid industrial base, and full employment. It was expected to surpass the US to become the world’s dominant economic power. However, history went in a different direction.
While the Japanese economy started to stagnate in the 1990s, it is overlooked that Japan’s economic miracle was already in decline before the bursting of its stock market bubble. From the 1950s to 1991, the Japanese government intervened heavily in credit markets. The Bank of Japan controlled commercial banks, assessing whether quotas for specific economic sectors were fulfilled and punishing banks that missed them.[1]
On the one hand, this helped Japan to grow its industrial base. On the other hand, because central planning suffers from an information-asymmetry problem – as explained by Friedrich A. Hayek – that strategy massively misallocated capital and resources and diminished growth.
Japan GDP (lhs), in JPY trn, and BoJ Basic Loan Rate (rhs), 01/1960–12/2022
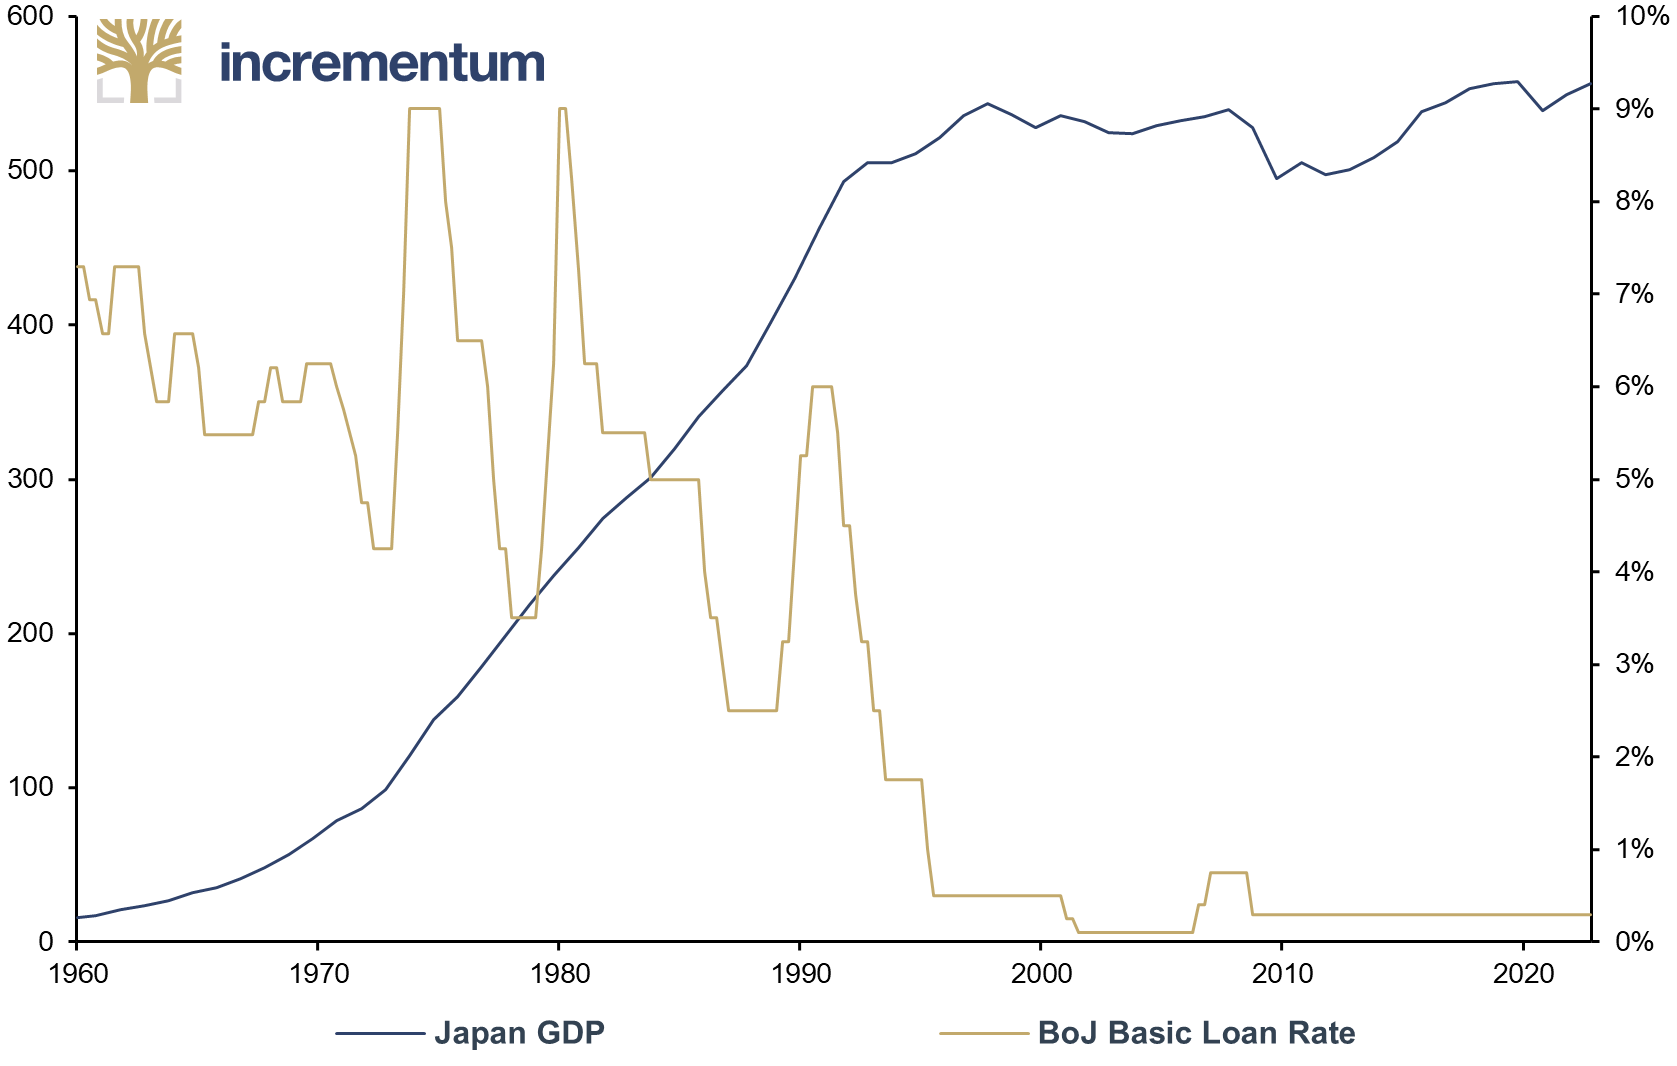
Source: IMF, Bloomberg, Incrementum AG
These credit quotas had yet another side effect. As described in Professor Richard Werner’s fabulous Princes of the Yen, to fulfill these quotas, banks increased lending even when there was no demand for loans. This was achieved by handing out riskier loans, which grew the money supply and led to Japan’s massive financial-market and property bubbles.
After the bust, Japan’s average rate of consumer price inflation between 1990 and 2023 was 0.6%. Although the Bank of Japan was the first central bank to implement QE in the early 2000s and cap long-term government bond yields in 2013, growth did not pick up again.
The reason for low inflation was that despite the Bank of Japan’s balance sheet expansion, broad money growth remained subdued throughout that period. While narrow money (M1) grew 6.1% year-over-year on average between 2000 and 2023, broad money (M3) only rose 2.1% on average, which resulted in average yearly consumer price inflation of 0.3%.
Japan M1, M3 and CPI, yoy, 01/2000–12/2023
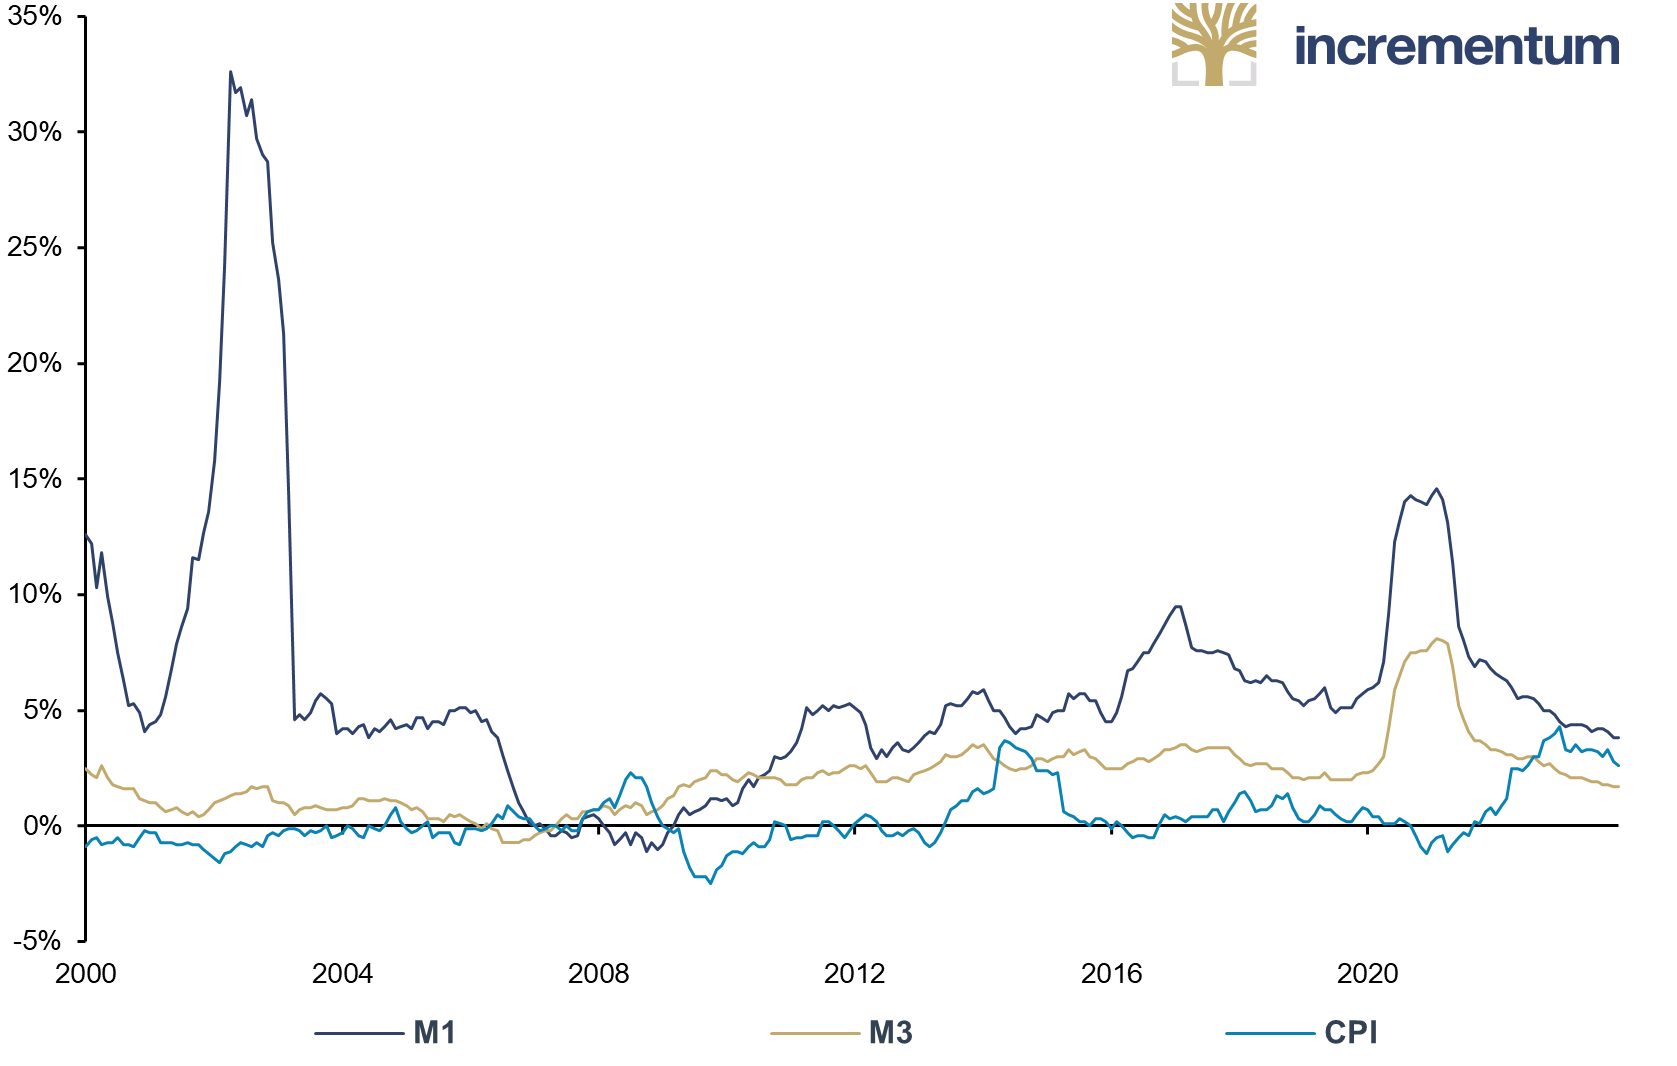
Source: Bloomberg, Incrementum AG
The Shared Fate of an Aging Population
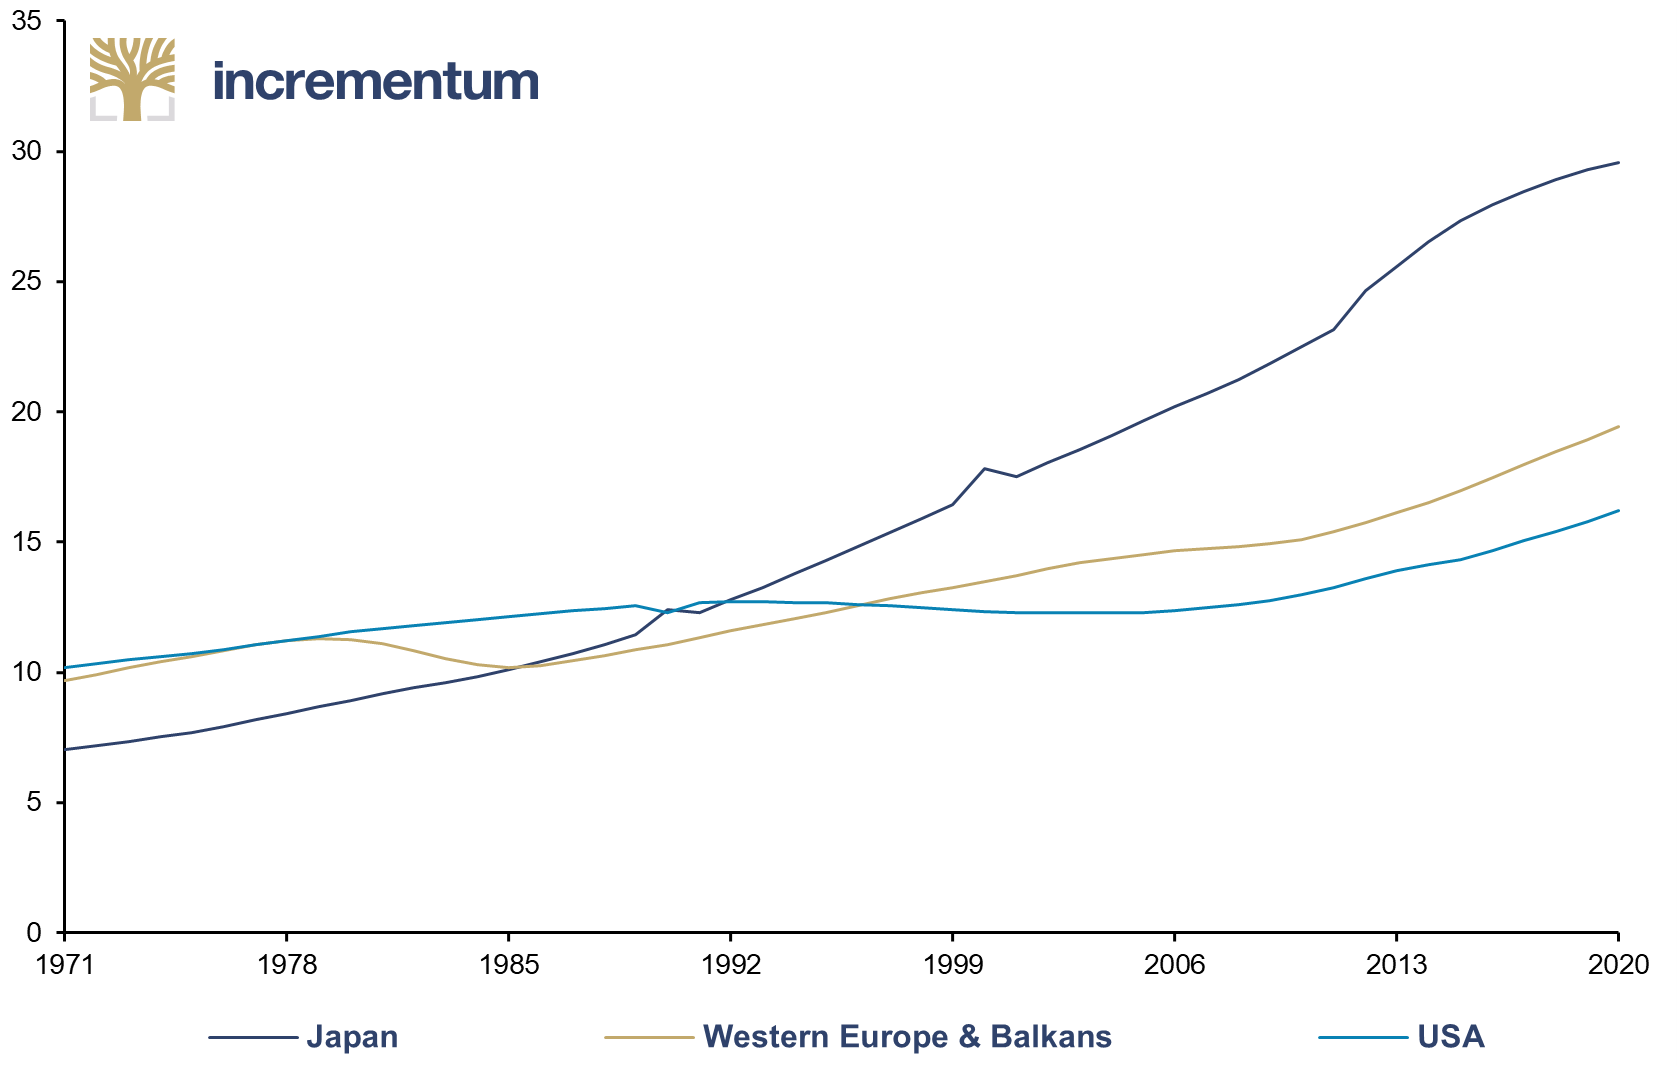
When one looks at similarities among the Eurozone, US, and Japanese currency areas, the most apparent similarity is demographics. In 2023, almost 30% of the Japanese population was above 65. European and US demographic trends seem to be following Japan’s. Currently, the share of people above 65 is about 19% in Europe and 16% in the US.[2]Population Ages 65 and Above As % of Total Population, 1971–2020
Source: Bloomberg, Incrementum AG
Keynesians have argued that aging demographics automatically lead to lower inflation, interest rates, and economic stagnation.[3] However, empirical data does not support this theory.[4] One could argue that an aging population poses the risk of increasing inflation because the supply of workers is shrinking, which should push wages up because of better negotiating power, ceteris paribus. That poses the question whether this could induce a wage-price spiral, where higher wages drive prices up, pushing wages further.
That argument bears some difficulties. Firstly, higher wages incentivize businesses to invest in automation enhancements, potentially reducing the demand for labor and, thus, wages. Secondly, higher prices might reduce demand and lower profits, increasing layoffs.
Further, in the absence of an increase in the quantity of money, higher wages should result in relative price adjustments, lowering demand for other inputs, consequently leading to lower prices. A wage-price spiral can only occur if there is a constant influx of new currency units into the economy.
On its own, a wage-price spiral, or any other increase in production costs, cannot be the source of inflation. Milton Friedman correctly described it as an observable effect of the actual cause, an expanding money supply.
Debt Levels
Debt levels suggest the Eurozone and the US could be capable of following Japan’s path. As of the end of 2022, Japan’s government debt was 260% of GDP, while the Eurozone’s debt-to-GDP ratio was about 91%, and US government debt stood at 123.4% of GDP.[5]
Yet, examining how these debt levels evolved in the last 20 years, the situation looks quite different. From 2005 to 2023, government debt-to-GDP levels doubled in the US, grew by 50% in Japan, and by “only” 30% in the Eurozone.
Public Debt as % of GDP, 100 = Q4/2004, Q4/2004–Q4/2022
Source: Bloomberg, Incrementum AG
Was the Latest Inflation Wave Just a Blip?
The latest inflation wave led to higher Eurozone and US interest rates. According to the mainstream view, as formulated by ECB economists,[6] the rise resulted primarily from supply chain disruptions. Further arguments are that the price rises were due to the Russian-Ukrainian war or greedy businesses (“Greedflation”) raising their prices and were unrelated to expansive monetary policies.
That begs the question of whether the outcome will be the same as in Japan and if the latest rise in consumer price inflation was just a blip, as Keynesian economists would claim. If there are differences between the Eurozone and the US compared to Japan, that would suggest that a Japanification will lead to different results if the Western central banks return to QE or implement yield curve control.
The Eurozone Is More Similar to Japan than the US Is
Like Japan, many European economies run export-oriented growth models, while the US economy is more consumption-driven. Hence, domestic consumption plays a much larger role in economic growth in the US than in the Eurozone and Japan.
To use a soccer analogy, Japan and the Eurozone serve as the hardworking players, similar to Xavi, Iniesta or Dani Alves at the FC Barcelona or Angél DiMaria, Sergio Agüero or Nicolás Otamiendi in the Argentines national squad, while the US represents Lionel Messi, who gets handed the passes he needs to score.
For example, both Japan and the Eurozone have run continuous current account surpluses. As of Q4 2023, the Eurozone maintained a current account surplus equivalent to 1.9% of its GDP, while Japan’s current account surplus stood at 3.5%. On the other hand, the US continuously runs current account deficits, with a current account deficit of 2.9% in Q4 2023.
Current Account as % of GDP, Q4/1999–Q4/2023
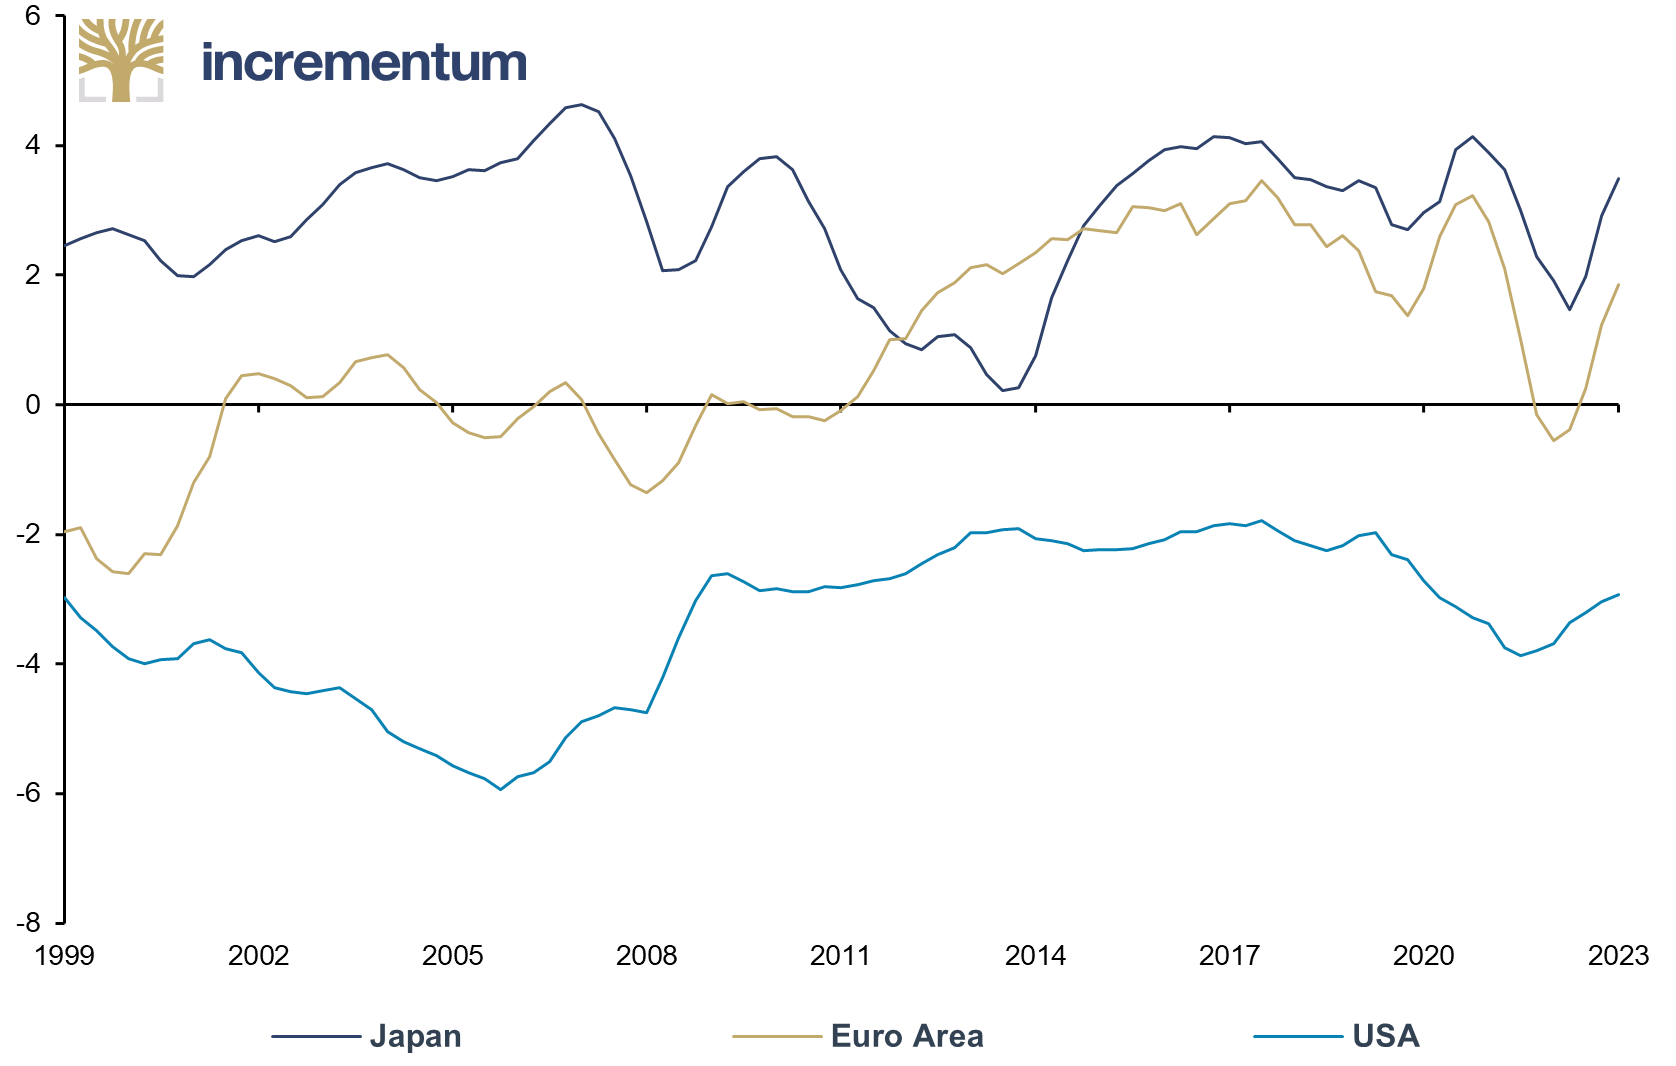
Source: Bloomberg, Incrementum AG
While the US constantly consumes more than it produces, the Eurozone countries and Japan produce more than they consume, a result of the so-called exorbitant privilege of the US that has the Federal Reserve printing the world’s reserve currency. Roughly said, the US exports dollars in exchange for physical imports from Europe and Asia and vice versa. Just as Messi relies on passes from his teammates to score goals, the US benefits from its position as the issuer of the world’s reserve currency, receiving “passes” in the form of European and Asian imports.
Nominal GDP in the Eurozone has also followed Japan’s in the sense that it has been stagnating since the Global Financial Crisis in 2008, just as Japan’s nominal GDP has stagnated since the Asian Financial Crisis in the mid-1990s.
Germany in particular is very similar to Japan in regard to its net international investment position (NIIP). Both countries have accumulated a positive NIIP over the years, which means they own more assets abroad than they owe to foreigners domestically. For the Eurozone as a whole, NIIP was only slightly negative in 2000, then worsened until 2010, before it improved substantially in recent years and finally turned positive in 2021.
Net International Investment Positions, in USD bn, Q4/2005–Q3/2023
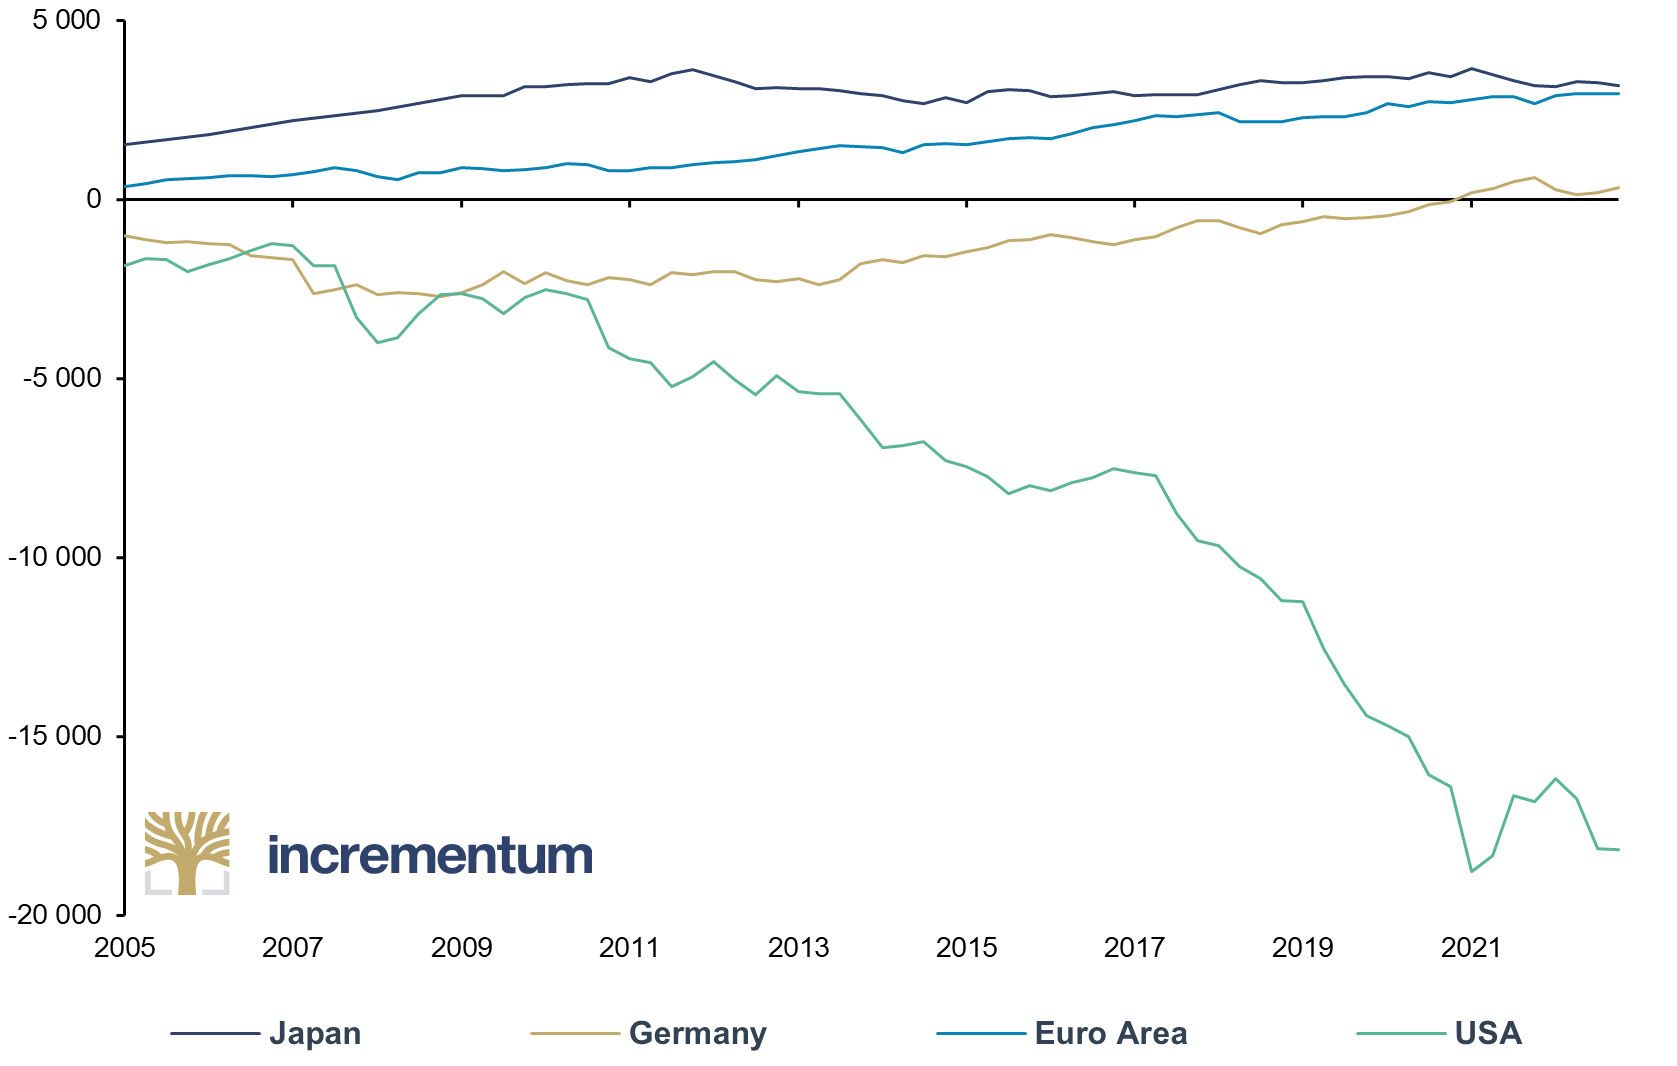
Source: Bloomberg, Incrementum AG
After 2010, one could say that the Eurozone has done something similar to what Japan did. Both regions are export-oriented and have run constant trade surpluses that they invested into foreign assets, while the US borrowed money from foreign countries to purchase their goods and services, continuously running a negative NIIP since 1985.
At this point, one has to mention a major difference between Japan and Eurozone countries like Germany. Foreign investors also hold government bonds from Eurozone members, while Japanese government bonds are predominantly held domestically.
Due to ultra-low interest rates, Japanese investors started to engage heavily in the so-called yen carry trade in the 1990s, where they borrow yen at low rates and invest it into higher-yielding foreign currency assets, like US Treasury bonds or stocks, because they expect a greater return. As long as the US dollar is appreciating against the yen, the returns get even better. Over time, investors have increased their risk in that trade by using leverage. Thus, one can say that Japan borrows from itself and then makes risky investments abroad.
Further, stock markets in Europe and Japan appear remarkably similar. The sideways movement of European stocks suggests that Europe has already experienced Japanification since the early 2000s, while the US stock market has produced continuous returns for investors.
Recently, the Japanese Nikkei Index broke out of its decades-long sideways movement and, after 34 years, climbed to a new all-time high. However, despite QE and YCC, Japan’s real economy continues to struggle; and it has lost its position as the world’s third-largest economy to Germany, which itself has now slipped into recession. According to recent estimates, India, currently in fifth place, will have overtaken both countries by 2027. This highlights the ongoing challenges faced by Japan.
Nikkei 225, Euro Stoxx 50 and S&P 500, 100 = 01/1987, 01/1987–04/2024
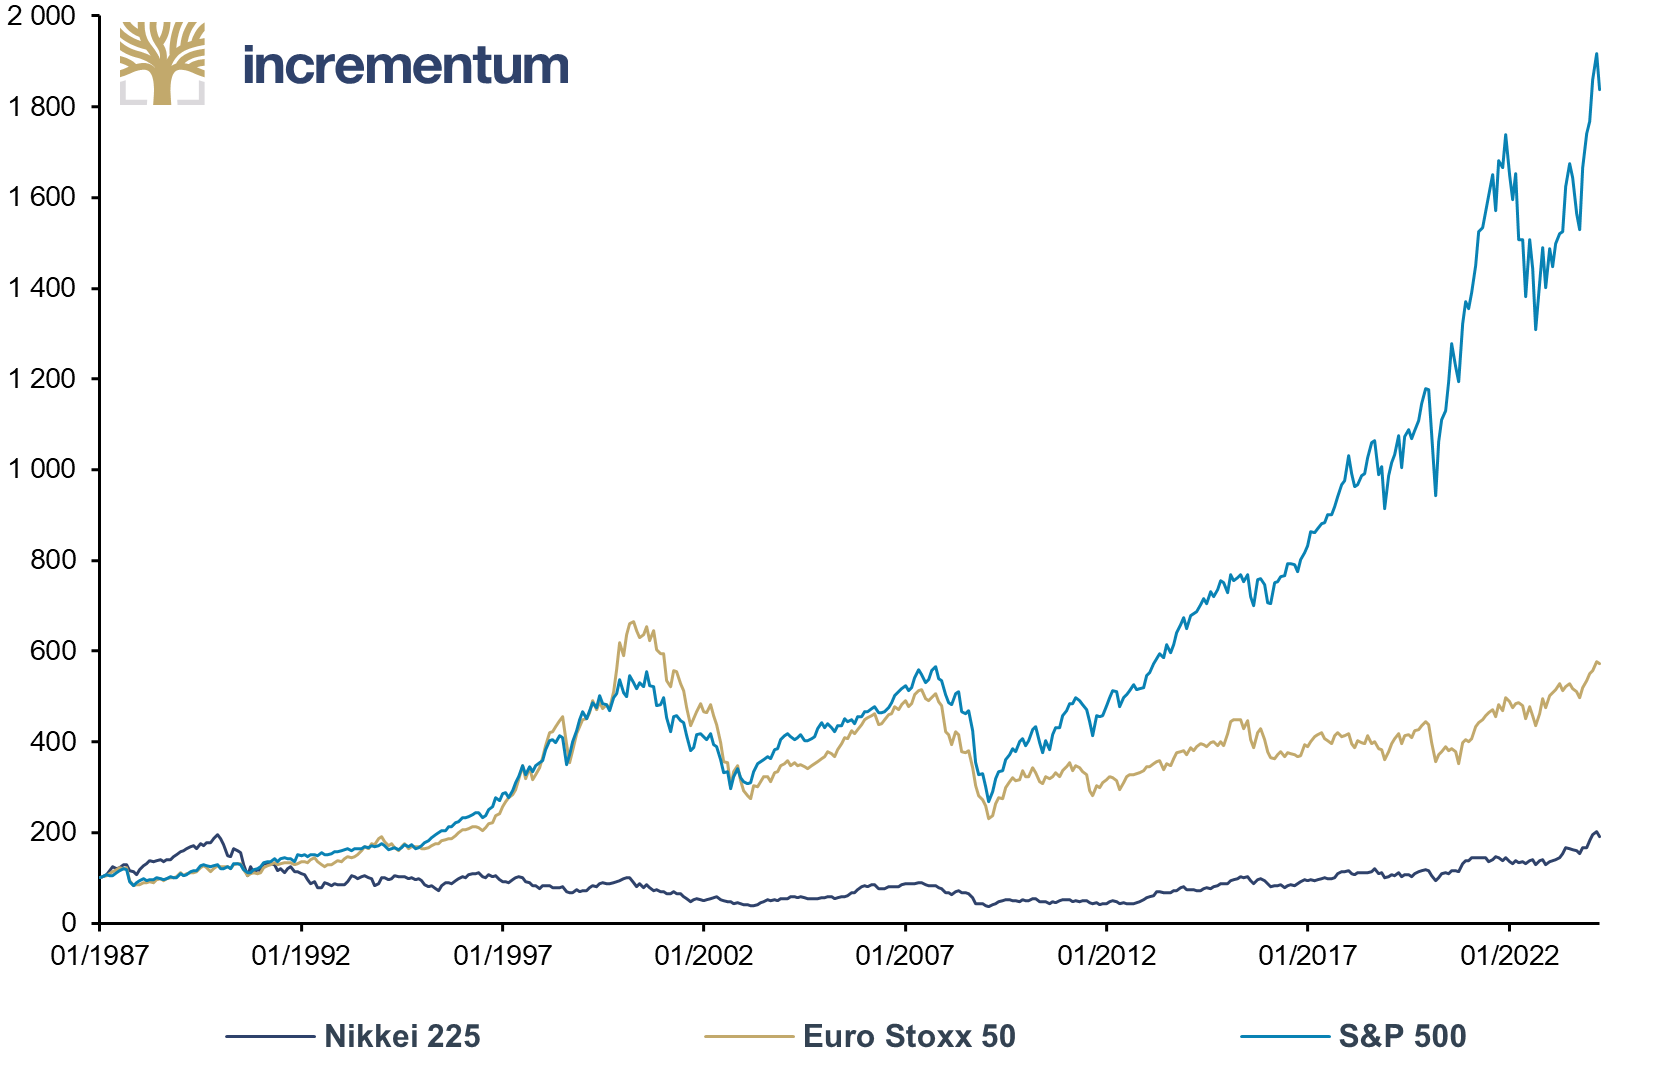
Source: Reuters Eikon, Incrementum AG
The Difference between QE and Yield Curve Control
We will now look at historical examples of quantitative easing and yield curve control and further discuss it more generally. By doing so, we want to examine their potential effects should the ECB or the Federal Reserve implement them as monetary policy tools again.
The main goals of QE have been to strengthen financial-market functioning, lower long-term yields, raise consumer price inflation from deficient levels, foster economic stability, and spur growth. While QE programs define a nominal amount of bonds the central bank plans to buy, yield curve control directly concentrates on long-term interest rates. It aims to hinder them from rising above a specified level to keep the government bond market functioning.
Quantitative easing and yield curve control in history
Yield curve control was implemented for the first time in the US during World War II (in 1942), after an increase in inflation and rising concerns over the expansion of the budget deficit, and remained in place until 1951.[7] The principal idea, however, had already been mentioned in a letter by John Maynard Keynes to President Roosevelt during the Great Depression in 1933:[8]
I see no reason why you should not reduce the rate of interest on your longterm Government Bonds to 2½ percent or less with favorable repercussions on the whole bond market if only the Federal Reserve System would replace its present holdings of short-dated Treasury issues by purchasing long-dated issues in exchange. Such a policy might become effective in the course of a few months, and I attach great importance to it.
In 1947, the Bank of England also implemented yield curve control and capped long-term interest rates at 2.5%. Such operations, although not systematically employed, were carried out repeatedly for brief periods until 1971, driving government bond holdings of the Bank of England continuously higher.[9]
Compared to yield curve control, quantitative easing (QE) is a relatively new policy tool for central banks. It was first implemented by the Bank of Japan in 2001 with the aim of lifting growth and inflation rates. Yet, despite all efforts, the Bank of Japan failed to achieve its intended goals. The programs were conducted from 2001 to 2006, followed by additional asset purchase programs in 2010, 2013, and another in 2014, in which the Bank of Japan planned to buy JPY 80trn of bonds annually. By July 2020, the Bank of Japan held more than 50% of all Japanese government bonds outstanding.
In response to the Global Financial Crisis, the Federal Reserve was the first to follow Japan when it initiated three quantitative easing programs between 2008 and 2015. Meanwhile, the Bank of England also started QE in 2011, and the ECB followed in 2015. All three central banks experienced the same results as Japan, failing to sustainably lift growth and inflation.
All central banks faced the same problem. In theory, QE should encourage banks to increase their lending, but they might not be willing to. After all, you can lead a horse to water, but you cannot make it drink.
In 2019, the Bank of Japan added yield curve control as a monetary policy tool in combination with QE, to produce QQE. At the height of the Covid-19 pandemic in 2020, the Bank of England, the ECB, and the Federal Reserve all reinstated QE programs in order to guarantee financial market stability. Unlike the Bank of Japan, the other central banks are currently trying actively to reduce their balance sheets, engaging in quantitative tightening (QT).
How yield curve control is implemented
The potential effects of a return to QE and yield curve control in the Eurozone and the US depend on how and where it’s implemented first. In Japan, the Bank of Japan is actively buying government bonds to suppress interest rates. However, as Russell Napier has pointed out, the other possibility is financial repression, and he believes this will be the path central banks opt for.
If one assumes that yield curve control will be done through financial repression, starting in the Eurozone first, it could be that policymakers will force private investors to buy up government securities to cap yields, by law if necessary. Moreover, one can assume that yield curve control would be implemented after a return to QE when it turns out that the intended effects are not materializing. Because of the US dollar’s exorbitant privilege and the Federal Reserve’s stance under Jerome Powell to try to avoid a return to QE for as long as possible, QE and yield curve control would probably be implemented in the Eurozone first.
Possible results of a return to QE and yield curve control in the euro area
Before the pandemic and the start of the war in Ukraine, the highest probability for what would happen in the euro area was a Japanese scenario. Recent geopolitical events and economic policies have changed this. Like Japan, the Eurozone has a solid industrial base and production sector.
However, current Eurozone economic policies and surging energy prices have caused a decline in industrial production and led many companies to offshore production to other parts of the world, like America and Asia. Going forward, Eurozone governments will likely try to combat that trend and subsidize industries, both to keep them from moving away and to boost the renewable sector.
Apart from an increase in government debt levels, it is doubtful whether this would lead to a substantial pick-up in economic growth, because of several factors. First, the Eurozone lacks skilled workers to accomplish the economic green transition, and it has so far failed to attract the immigration of skilled migrants because of more attractive destinations for those workers elsewhere.
Second, the European continent lacks domestic raw materials needed for the green transition. Thirdly, the EU is already way behind China, which is currently leading in solar, battery, and electric vehicle production. At the end of February, the first Chinese ship with 3,000 EVs unloaded its cargo in Germany, and China plans to construct 200 ships of that size in order to massively boost the export of EVs.
To address these issues, Eurozone countries would need to run large deficits to subsidize businesses. The ECB likely will need to return to QE and implement yield curve control to make the debt burden bearable. However, it’s doubtful that the result will be higher growth. The most apparent results are probably a weak euro and lower production for domestic consumption due to a misallocation of workers.
Higher import prices, lower output, and higher debt could send inflation higher in the Eurozone. If we recall Russell Napier here again, governments could implement credit guarantees to expand the money supply further. Still, it is hard to see that this would create sustainable growth apart from increasing inflation rates. Additionally, the Eurozone is constantly working toward more regulation instead of less. However, the measures might lead to lower debt-to-GDP ratios at some point, though at the expense of citizens due to inflation.
The Federal Reserve will bow to policy goals
If the ECB and Eurozone governments implement all these policies and the Federal Reserve stands aside, this could lead to a sharp rise in the US dollar. While this is favorable to imports, it runs diametrically to the declared goals of both US presidential candidates, who want to bring manufacturing back to the US. To achieve this, the US would obviously need a weaker, not a stronger, US dollar.
DXY and US Industrial Production, 01/2019–04/2024
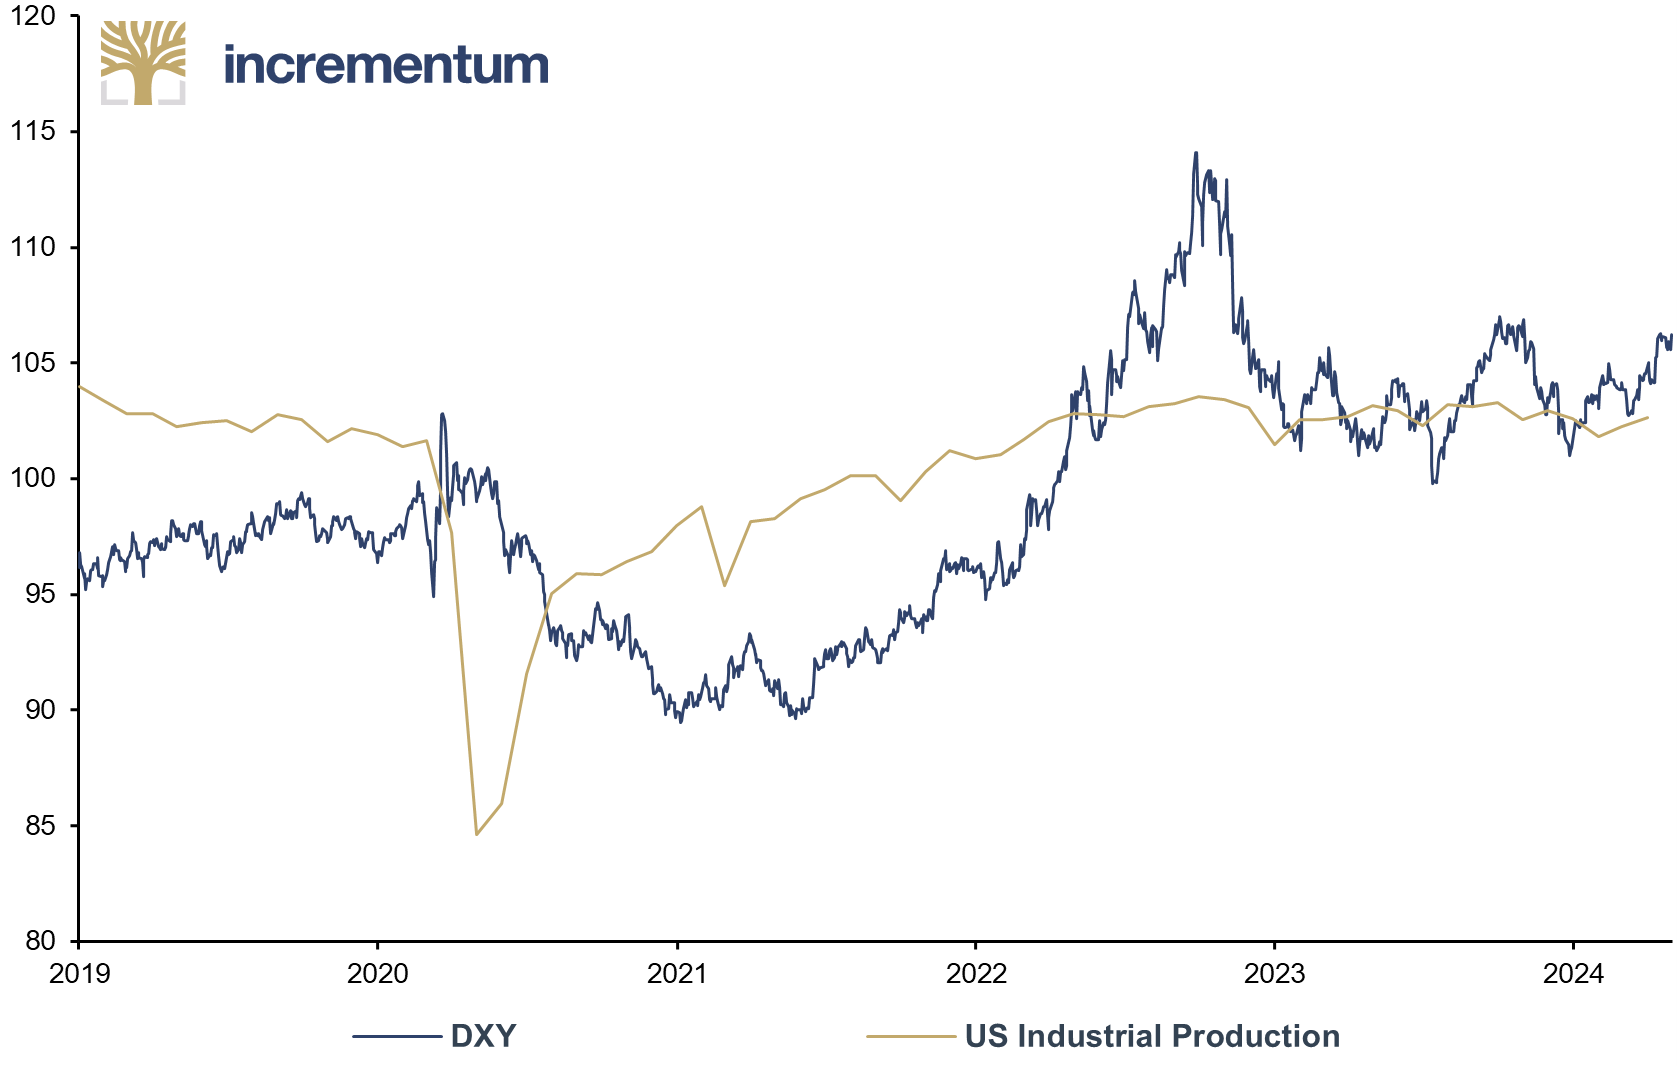
Source: Reuters Eikon, Incrementum AG
Further, both US presidential candidates are in favor of larger budget deficits to achieve their goals, which is problematic in times when interest rates are already much higher than over the last decade. This is driving US interest expenses and, hence, the deficit. Leaving aside the likely possibility that the current level of interest rates could harm the US economy at some point, it is clear that these policy goals will probably increase political pressure on the Federal Reserve and cause a change there at some point. When the Federal Reserve gives in under the prescribed scenario, the new printed money will find its way into the real sectors of the economy through government spending to subsidize industries.
This will drive consumer price inflation back up and, with it, interest rate expenses and government debt. However, one should not rule out the possibility that at some point the government will stop adjusting social security benefits to inflation, which at the moment is mandated by law. As either candidate would be serving his final term, he could surprise people with such a move.
Honestly, it is difficult to envision that this measure alone would prevent yield curve control. As American guitarist and singer John Mayer poignantly croons in “Stop This Train”, even though one might wish to get off, one knows one cannot:
Stop this train
I want to get off and go home again
I can’t take the speed it’s moving in
I know I can’t
But honestly, won’t someone stop this train?
The Effects of These Policies on Asset Classes
Obviously, the pressing question now is, “What does this mean for assets?” and, given that this is the In Gold We Trust report, “What does this mean for gold”?
If the ECB and the Federal Reserve loosen their monetary policies again and follow Japan, then the development of gold priced in yen could hint at where the gold price in euros and the US dollar is heading. When Japan implemented QQE in 2019, the gold price in yen broke out and started a solid upward trend, from one all-time high to another. The JPY 300,000 mark was crossed for the first time in the fall of 2023. Even the first interest rate hike by the BoJ since 2007 on March 19, thus ending the phase of a negative key interest rate that had lasted since 2016, did not affect the gold price in yen negatively.
Gold, in JPY (lhs), and USD, EUR (rhs), 01/1990–04/2024
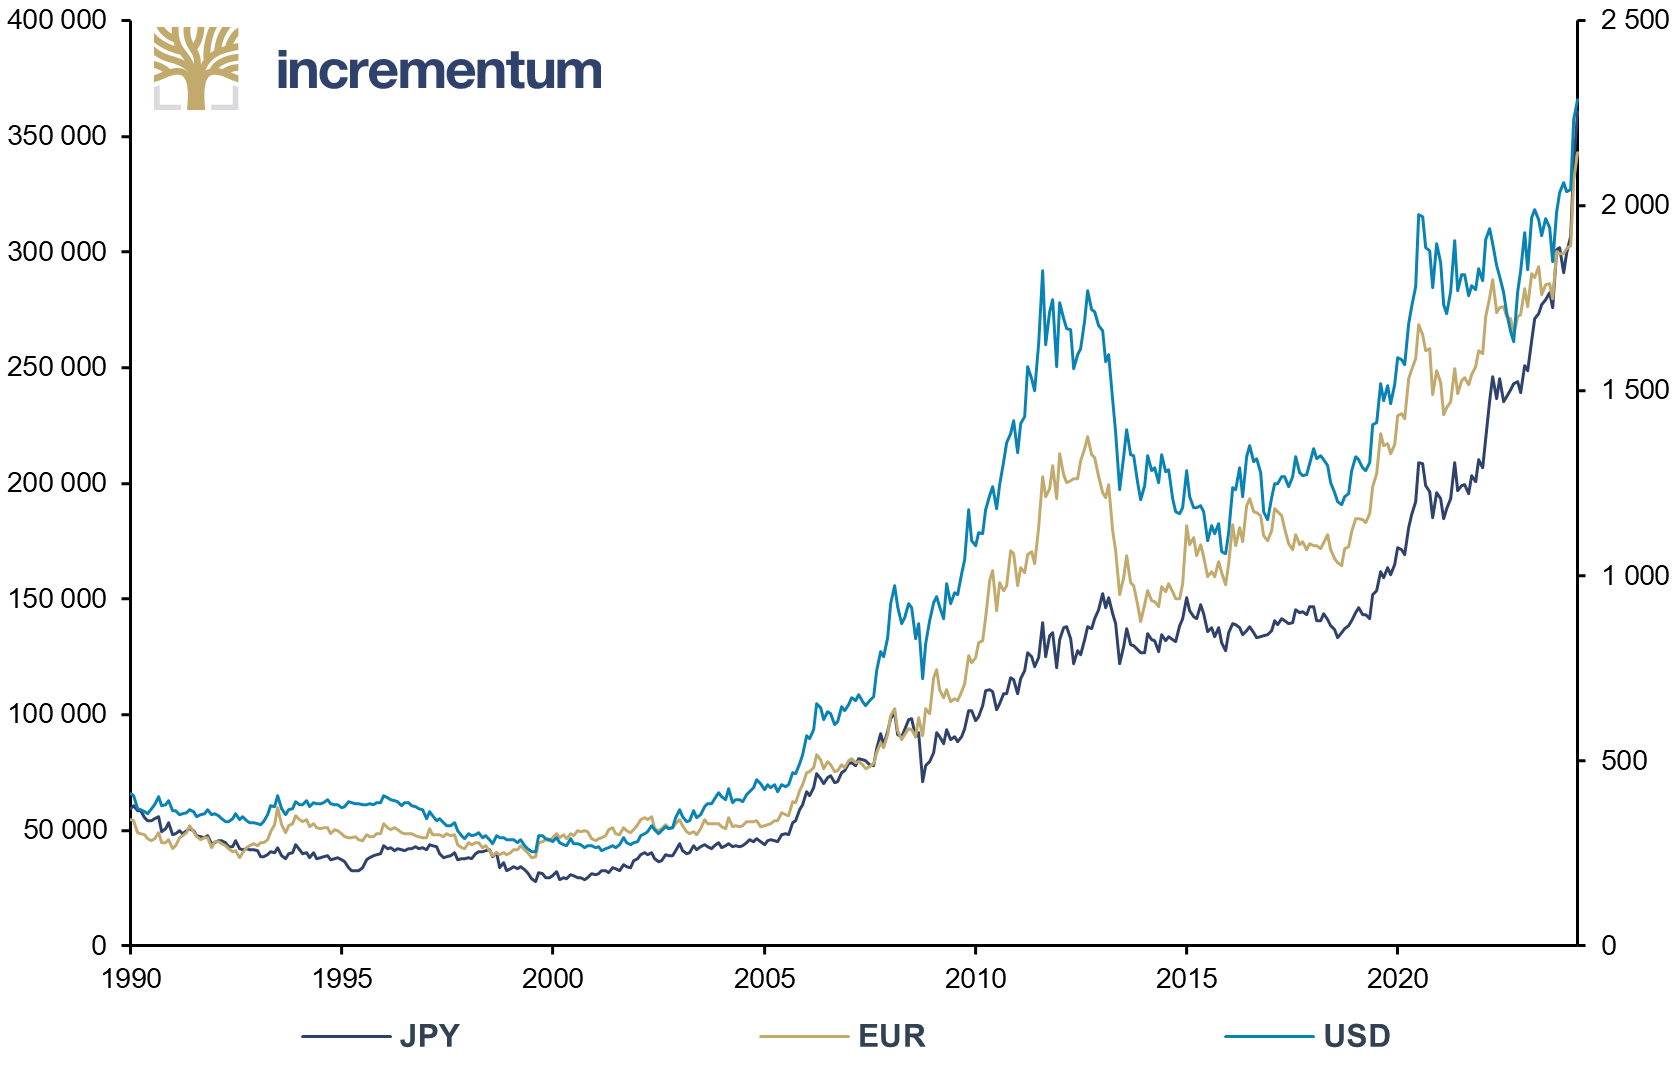
Source: Reuters Eikon, Incrementum AG
After the Federal Reserve began to raise interest rates and the Bank of Japan decided to keep monetary policy loose, the yen sold off against other major currencies. Following the drop in value, Japanese investors increased their demand for gold and gold ETFs.
Interestingly, while Asian gold ETF holdings increased further from 2022 onwards, ETF holdings in Europe and the US declined, underlining the fact that demand has increased in Asia while staying stagnant in Europe and the US.
Japanese Gold ETF Holdings (lhs), and Flows (rhs), in Tonnes, 07/2010–03/2024
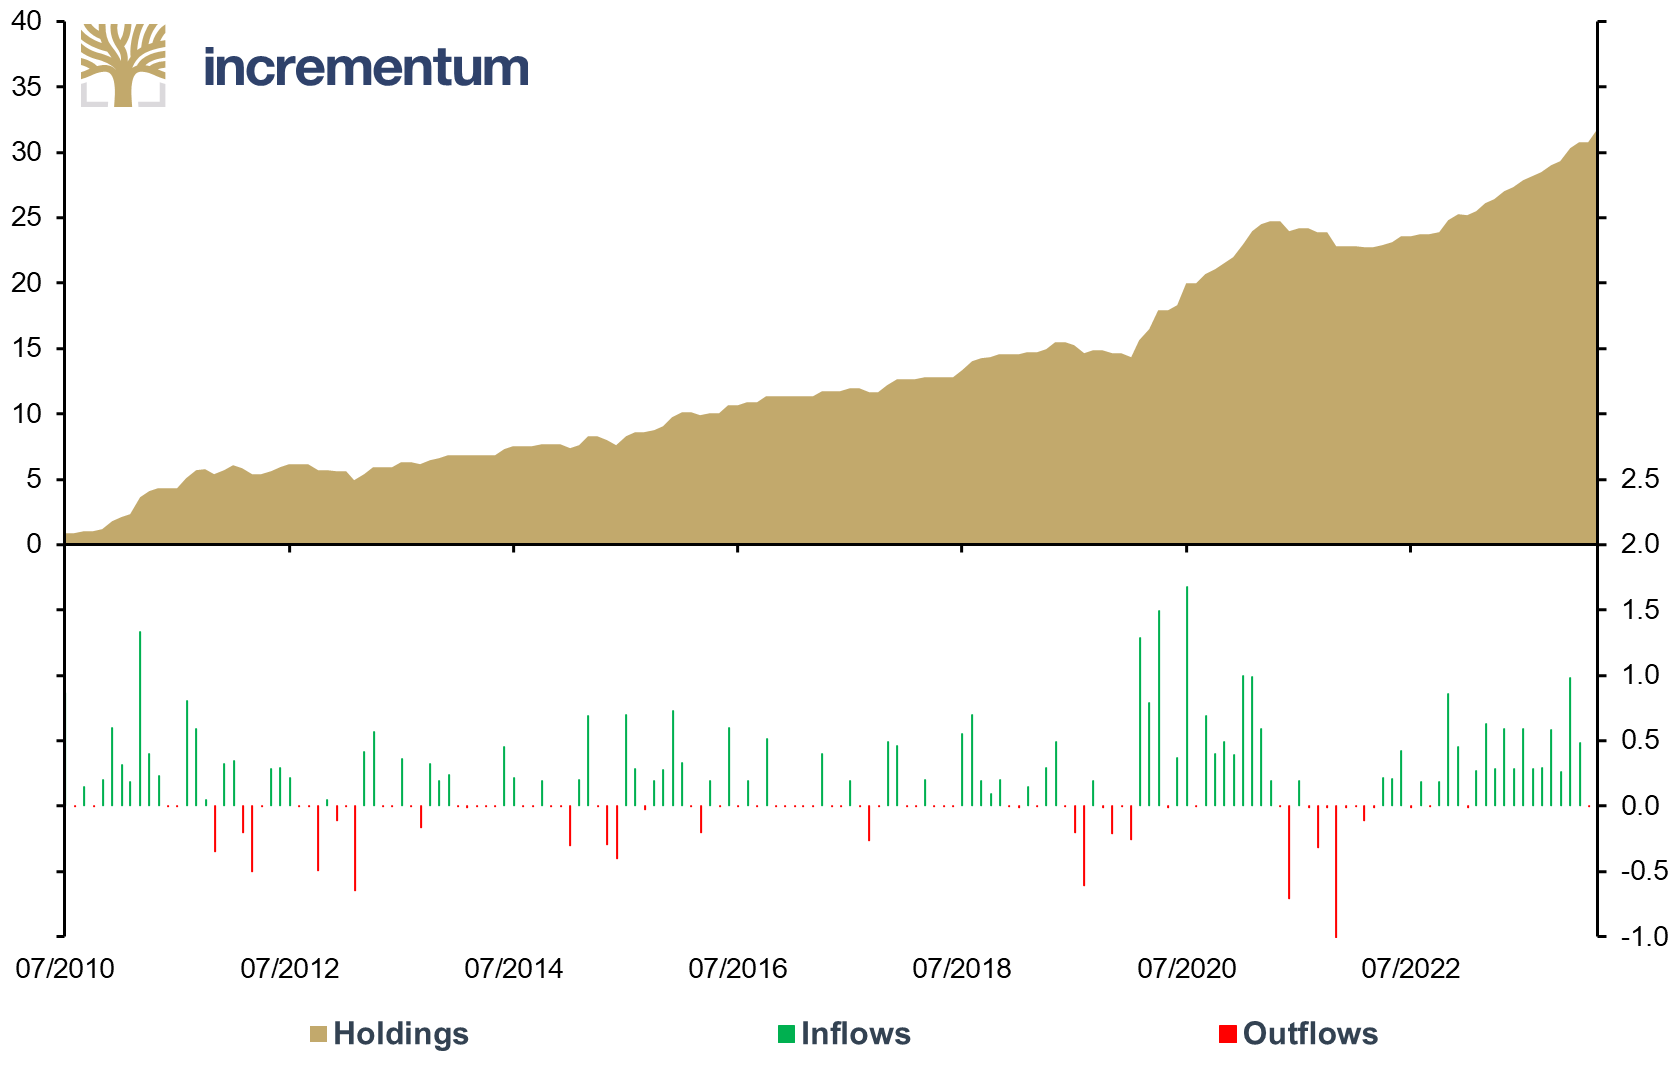
Source: World Gold Council, Incrementum AG
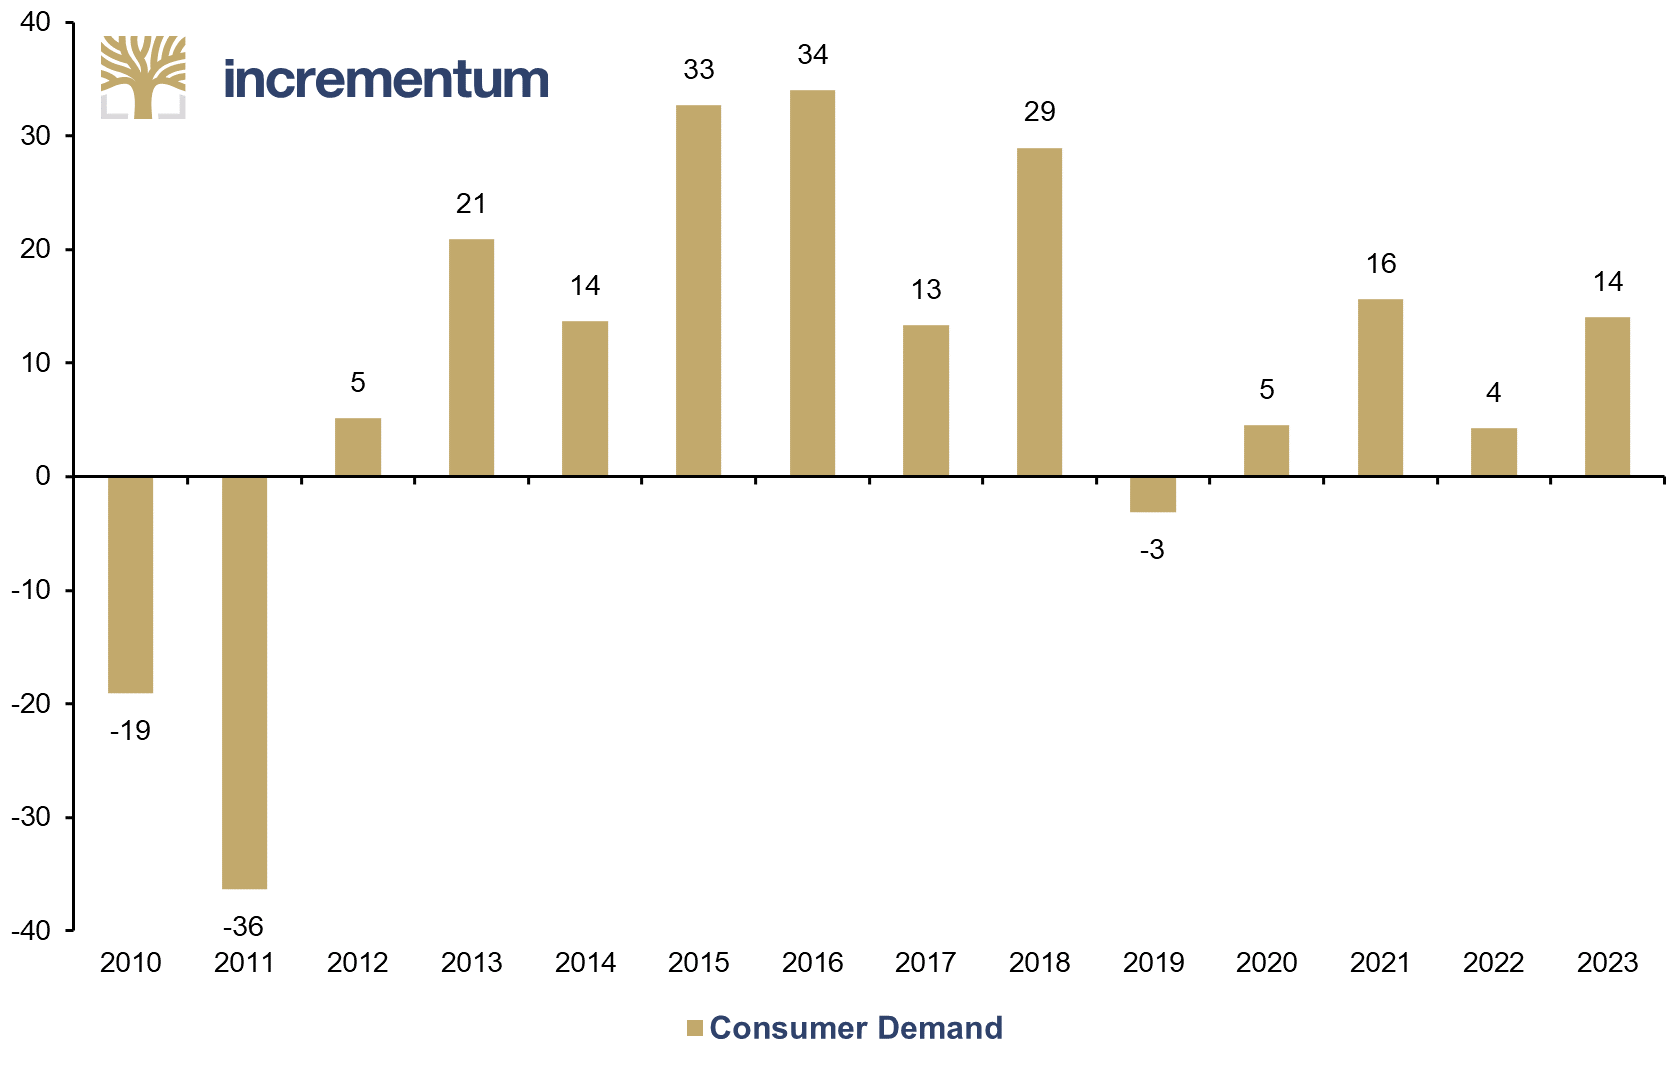
Looking at consumer demand, Japanese demand for gold was negative before 2012 but started to turn positive afterward. Since then, only 2019 marked a year of negative demand in Japan.
Japanese Consumer Gold Demand, in Tonnes, 2010–2023
Source: World Gold Council, Incrementum AG
Historically, the Bank of Japan holds only a small portion of its total assets in gold, far less than the Federal Reserve and central banks in the Eurozone. Since 2000, the Bank of Japan has increased its gold holdings by about 90 tonnes, which brought the share of gold reserves to total reserves from 0.4% up to 4.3%, levels where it had not been since the early 1980s. In US dollar terms, Japan’s gold reserves have risen steadily since the early 2000s and are currently at an all-time high.
Japanese Gold Reserves, as % of Total Reserves (lhs), and in USD bn (rhs), 01/1980–12/2023
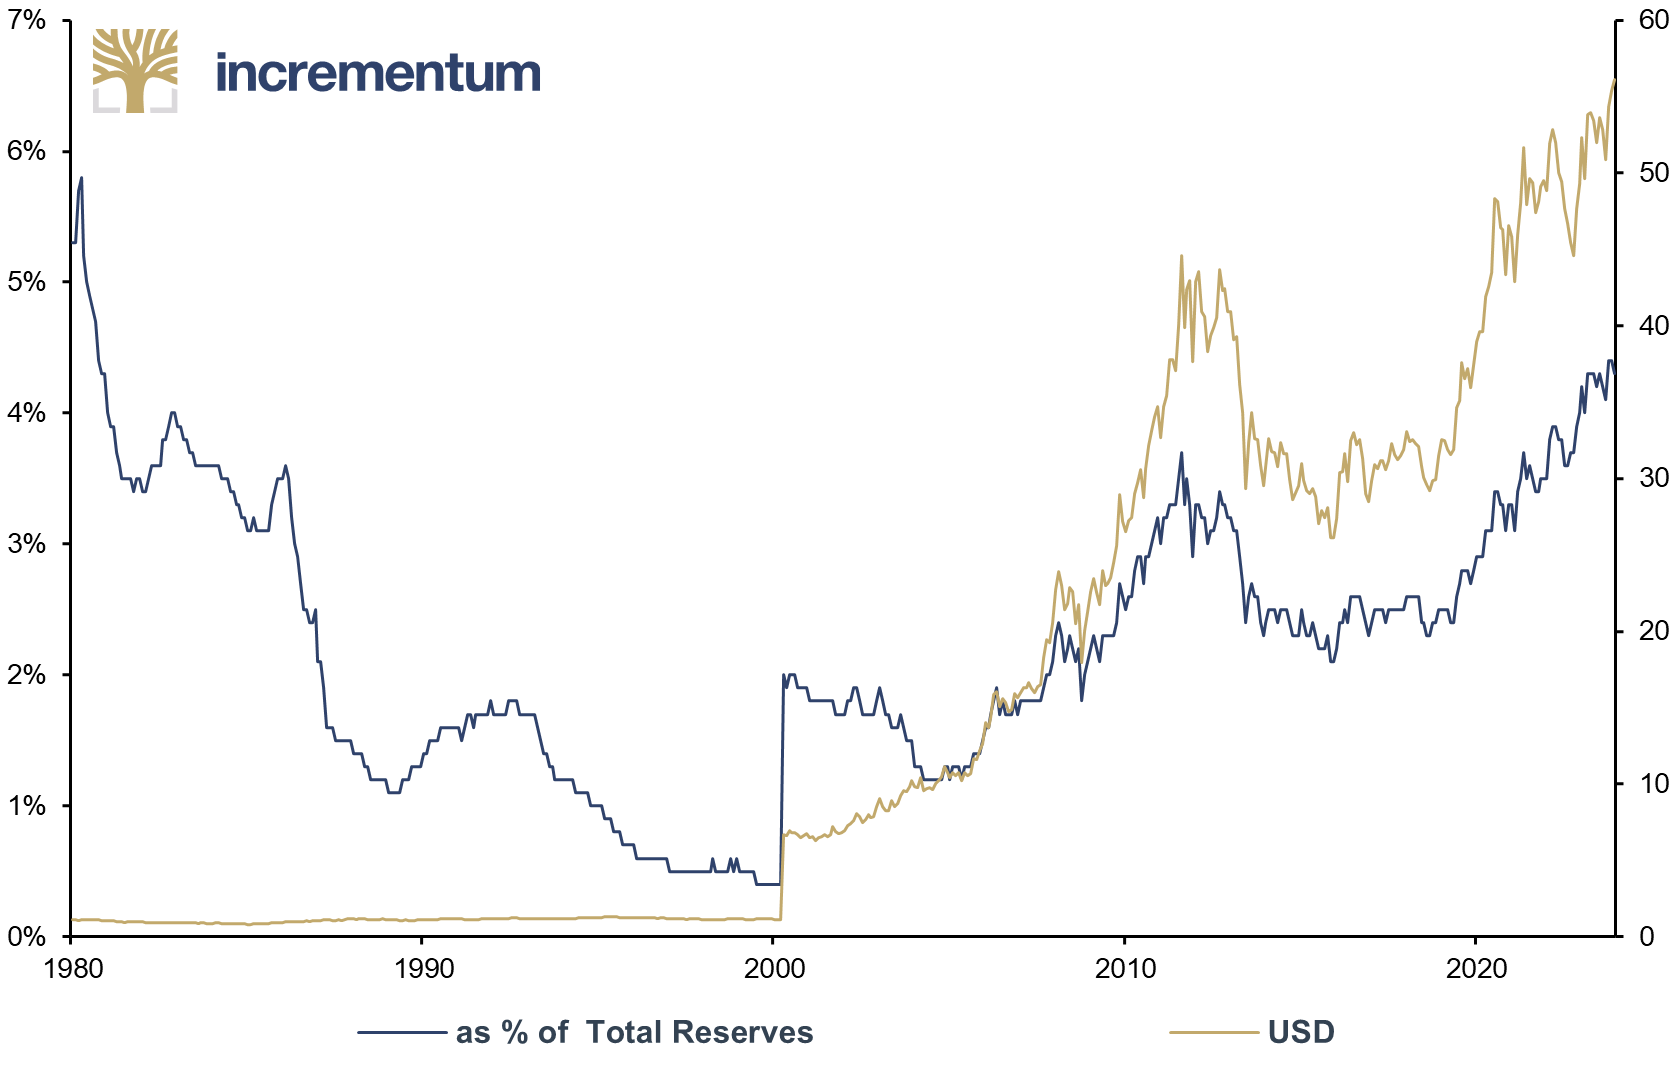
Source: Bloomberg, Incrementum AG
In inflationary periods, gold usually serves as a hedge, despite continual mocking from financial professionals, who claimed the latest inflation wave showed that gold wasn’t a good inflation hedge because, despite a rising CPI, gold moved sideways.
What is overlooked here is that the gold market had already anticipated inflation and started to trade sideways when it became obvious that monetary tightening was coming. Much like Michael “Air” Jordan anticipated situations in advance to score, executing such a trade ahead of time pays off, preempting market shifts. Suppose someone invests in gold to hedge against inflation after it has already spiked and they can now predict central bank intervention. That’s more of a reactive response, akin to the moment when Utah Jazz’s Byron Russell slipped just before Jordan threw in his final basket in a Chicago Bulls jersey.
Gold (lhs), in USD, and US CPI (rhs), yoy, 01/2018–04/2024
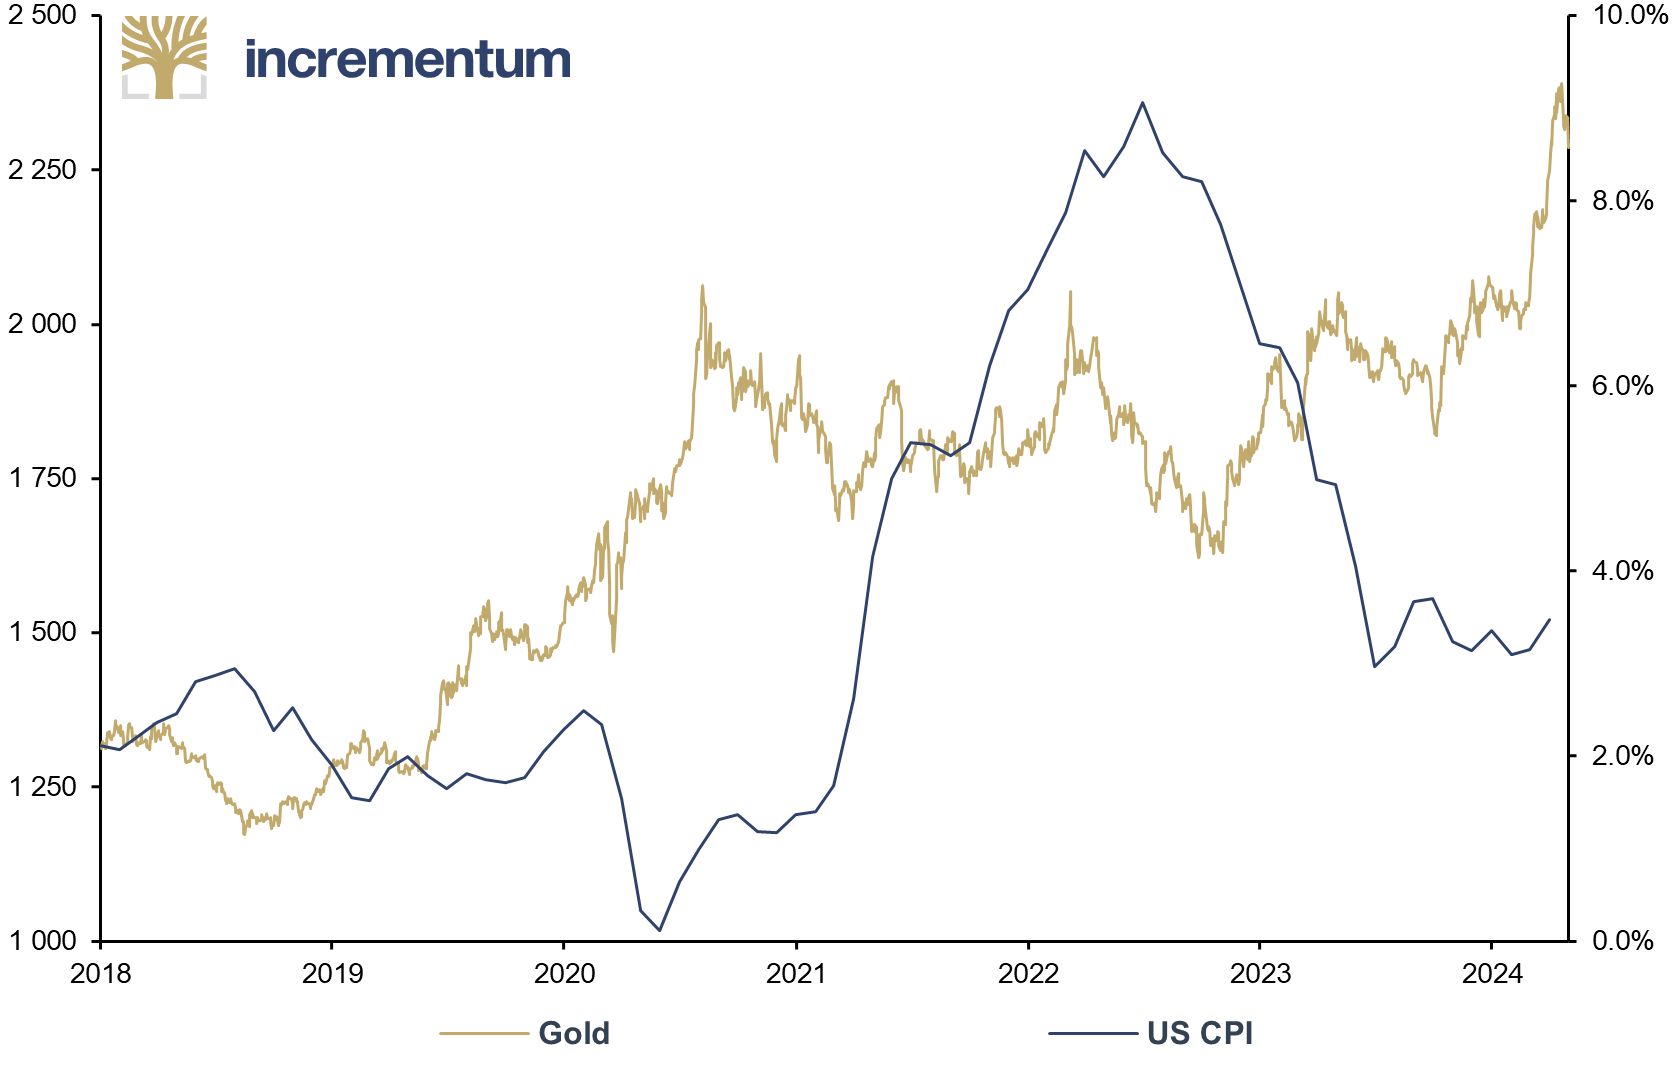
Source: Reuters Eikon, Incrementum AG
All the policies discussed suggest that the Eurozone and the US will enter a period of consistently higher inflation in the years ahead, hence a higher price for gold (and Bitcoin) seems likely. Such an environment should benefit tangible assets, especially commodities, raw materials, and related industries that are needed for the pursuit of the green transition. Given that other energy sectors have suffered from chronic underinvestment in recent years, they should also profit, from our point of view.
While investments in government bonds might look compelling in nominal terms, prolonged periods of high inflation usually lead to a loss in real terms. Currency-wise, though, it is likely that the US dollar will remain king, relative to most fiat currencies, apart from the Japanese yen or likely the Swiss franc, because the Bank of Japan cannot, and the Swiss National Bank will not, ease more than the Federal Reserve or the ECB. Under this scenario, the yen carry trade would likely blow up because of the rapid strengthening of the yen against the US dollar.
That could also benefit the Japanese economy, as a higher yen makes imports of raw materials cheaper that the innovative Japanese business could then use to build products for domestic consumption and for export. Our sensing is that Japan will benefit in a scenario of Western Japanification.
Although many say the US would suffer in such a scenario, it could very well be that the US is not hurt as much as many expect before it restructures and then profits from it. Further, we are all aware of the challenge of breaking away from old habits, and this holds true for the reliance on the US dollar in international trade, perpetuating a continuous demand for the currency. Apart from that, and given that the EU does not reverse its path to overregulation, the potential benefactors are likely Asia and commodity-rich countries in South America.
There is a saying that the definition of insanity is “doing the same thing over and over again and expecting different results.” However, in the case of Europe and the US, our analysis does not support the assumption that implementing additional rounds of QE and yield curve control would yield similar results to those observed in Japan.
Consider this: the greatest trick the devil ever pulled was convincing the world he didn’t exist. Symbolically, Japan’s monetary experiment could be seen as a similar trick, suggesting that ultra loose monetary policy isn’t as harmful as feared.
However, perhaps the effects were less obvious, and things appeared better than they were. It’s possible that the shadow of Akuma lurked within Japan’s monetary policies all along. If monetary policymakers in the Eurozone and the US adopt a similar approach, we may witness an ‘Akuma Afterglow,’ revealing the hidden consequences of these policies, with completely different consequences.
[1] See Werner, Richard A.: “A Reconsideration of the Rationale for Bank-Centered Economic Systems and the Effectiveness of Directed Credit Policies in the Light of Japanese Evidence”, The Japanese Economy, May–June 2002, Vol. 30, No. 3, pp. 7-9; p. 23
[2] See “Global Demographics Turn Inflationary,” In Gold We Trust report 2021
[3] Rachel, Lukas and Summers, Lawrence H.: “On Secular Stagnation in the Industrialized World”, Brookings Papers on Economic Activity, Spring 2019
[4] Mayer, Thomas and Schnabl, Gunther: “Reasons for the Demise of Interest: Savings Glut and Secular Stagnation or Central Bank Policy?”, CESifo Working Paper, No. 7954, 2019; see also “Global Demographics Turn Inflationary,” In Gold We Trust report 2021
[5] See “Status quo of Debt Dynamics” in this In Gold We Trust report
[6] De Santis, Roberto A.: “Supply chain disruption and energy supply shocks: impact on euro area output and prices”, ECB Working Paper Series, No. 2884, January 2024
[7] See also “Introduction,” In Gold We Trust report 2021; “Status Quo of Debt Dynamics,” In Gold We Trust report 2021; “Yield Curve Control, the Biggest Mistake of the ECB So Far! – Exclusive Interview with Russell Napier,” In Gold We Trust report 2021
[8] Amamiya, Masayoshi: “History and Theories of Yield Curve Control”, Keynote speech at the Financial Markets Panel Conference to Commemorate the 40th Meeting, January 11, 2017, p. 3
[9] Amamiya, Masayoshi: “History and Theories of Yield Curve Control”, Keynote speech at the Financial Markets Panel Conference to Commemorate the 40th Meeting, January 11, 2017, pp. 3f.